Embed Size (px)
Citation preview
HAL Id: halshs-01109452https://halshs.archives-ouvertes.fr/halshs-01109452
Submitted on 26 Jan 2015
HAL is a multi-disciplinary open accessarchive for the deposit and dissemination of sci-entific research documents, whether they are pub-lished or not. The documents may come fromteaching and research institutions in France orabroad, or from public or private research centers.
L’archive ouverte pluridisciplinaire HAL, estdestinée au dépôt et à la diffusion de documentsscientifiques de niveau recherche, publiés ou non,émanant des établissements d’enseignement et derecherche français ou étrangers, des laboratoirespublics ou privés.
Natural Disasters, Household Welfare, and Resilience:Evidence from Rural Vietnam
Mohamed Arouri, Adel Ben Youssef, Cuong Nguyen-Viet
To cite this version:Mohamed Arouri, Adel Ben Youssef, Cuong Nguyen-Viet. Natural Disasters, Household Welfare,and Resilience: Evidence from Rural Vietnam. World Development, Elsevier, 2015, 70, pp.59 - 77.�halshs-01109452�
1
NATURAL DISASTERS, HOUSEHOLD WELFARE AND
RESILIENCE:EVIDENCE FROM RURAL VIETNAM
Mohamed Arouri
Centre Clermontois de Recherche en Gestionet Management (CRCGM)
Clermont-Ferrand, France
Adel Ben Youssef
Groupe de REcherche en Droit, Économie, Gestion (GREDEG)
InstitutSupérieurd'Économieet Management (ISEM)
Université de Nice-Sophia Antipolis
Nice, France
Cuong Nguyen (contact author)
National Economic University
Hanoi, Vietnam
Email: [email protected]
Abstract
The study usescommune fixed-effect regressions to estimate the effect of natural disasters
on household welfare and poverty, and subsequently examines household and community
characteristics that can strengthen resilience of households to natural disasters. We find that
all the three disaster types considered in this study including storms, floods and droughts
have negative effects on household income and expenditure. Access to micro-credit,
internal remittances and social allowances can help households strengthen the resilience to
natural disasters. Households in communes with higher expenditure mean and more equal
expenditure distribution are more resilient to natural disasters.
Keywords: Natural hazards, disasters, resilience, poverty, household welfare, Vietnam
JEL codes: O12, Q54, D12
2
1. Introduction
There is no doubt that the climate change has been the growing and biggest challenge to the
people in the recent years. There is a rise in sea levels, the disappearance of ice, and
changes in precipitation. A study by Dasgupta et al. (2009) on the potential impacts of sea
level rise in 84 coastal developing countries shows that a one meter rise in sea level would
affect about seven percent of agricultural land and 11 percent of the population, which
could reduce the agriculture sector‟s GDP by 10 percent. According to IPCC(2007), “the
average Northern Hemispheres temperatures during the second half of the 20th century
were higher than during any other 50-year period in the last 500 years. It is possibly the
highest in at least the past 1,300 years.”
There is also an increase in the frequency and severity of natural disasters (IPCC,
2007; World Bank, 2010). Natural disasters cause physical and social-economic damages
through direct, indirect, and secondary effects (Pelling et al., 2002; Benson, 1997; Lindell
and Prater, 2003; Haen and Hemrich, 2006). The physical impacts of natural disasters
include casualties and property damages. It is estimated that natural disasters caused 3.3
million deaths since 1970, or about 82,5 thousand a year (World Bank, 2010). Natural
disasters also affect 255 million people annually (NarseyLal et al., 2009). World Bank
(2010) estimates that the total damage caused by all hazards between 1970 and 2008 is
around $2,300 billion (in 2008 dollars).Guha-Sapir et al. (2004) find that the economic cost
related to natural disaster has increased 14-fold since the 1950s.
The impacts of natural disasters differ for different nations, regions, communities
and individuals due to the differences in their exposures and vulnerabilities to natural
disasters (Clark, et al.1998). There is aconsensus that the disasters cause more human
losses in developing countries than the developed ones (Ludwig et al., 2007; Haen and
Hemrich, 2006), and the poor are likely to suffer most from natural disasters (Ludwig et al.,
2007; Haen and Hemrich, 2006; Kaplan, 2010). Although more than 60% of total damages
caused by disasters occurred in high-income countries, the estimated damages as a share of
3
GDP are significantly greater in less developed and small countries (Okuyama and Sahin,
2009). Studies of Guha-Sapir (2011),Gaiha et al. (2010), Ludwig et al. (2007),Toya and
Skidmore (2005), Sawada (2006)also findthat while the level of damages due to natural
disasters is much higher in developed countries, the impact of disasters tends to be higher in
less developed countries. In a country, poor households are more vulnerable to natural
shocks in both response and recovery phases (Peacock et al., 1997; Fothergill and Peek,
2004; Wisner, et al. 2004).
The impact of natural disasters on households depends on the level of resilience of
households and communities to the natural disasters. Exposed to the same disasters,
households with better coping capacity and resilience can suffer less damage than those
with low coping capacity and resilience. Basically,resilience is defined as capacity of
households to absorb andmitigate damage or loss caused by natural disasters(Holling, 1973;
Perrings, 2001).The resilience refers to the ability to recover from disasters and the ability
to withstand disasters (Rose, 2004; Cannon, 2008; Briguglio et al.,2009). The resilience is
also related to the coping capacity of households to the natural hazards (Greiving, 2006;
Greiving et al., 2006). According to Rose (2004), resilience can take place at the three
levels: micro level such as households and individual firms, medium level such as sectors
and groups, and macro level with all individual units. The economic resilience depends on a
large number of factors including macro and micro economic stability, social development
and good governance (Briguglio et al. 2009). Assets, livelihood strategy, public transfers,
and credit are important sources for households to increase resilience to shocks (Bruneau et
al., 2003; Davies, 2013).
This study has the three main objectives. The first objective is to measure the effect
of natural disasters on household welfare and poverty in rural Vietnam. As known, the
impact of natural disasters depends on the resilience of households to natural disasters. An
important question is which factors can increase the resilience of households to natural
disasters. Thus, the second objective of this study is to examine whether a number of
household and commune characteristics can strengthen the resilience of households to
natural disasters in Vietnam. The third objective is to estimate the geographically
heterogeneous effect of natural disasters. We will propose a simple method to construct
spatial maps of the economic impact of natural disasters on households.
4
The study will focus on the economic effect of natural disasters on households in
Vietnam for several reasons. Firstly, located in the South East Asia, Vietnam is considered
as one of the most affected countries in the world by climate change. According to World
Bank (2009), Vietnam is one of the 12 countries which are most vulnerable to climate
change. UNISDR (2009) ranks Vietnam fourth in the global in terms of the absolute
number of people exposed to floods, tenth to high winds from tropical cyclones, and
sixteenth to droughts.Secondly, natural disasters occur throughout the country without very
large events enable results applicable to average disasters (Noy and Vu, 2010). Thirdly,
there are large surveys on households in Vietnam, which allows for the analysis of
household welfare, resilience and natural disasters. More specifically, we will use the
Vietnam Household Living Standard Surveys in 2004, 2006, 2008, and 2010 in this study.
Findings from the studies can provide useful information for policy makers on the
adverse effects of natural disasters on household welfare and poverty in rural Vietnam. If
natural disasters result in large economic damages for households, the government should
have stronger and more effective policies and programs to reduce the adverse effects of
natural disasters in Vietnam. Findings from the household and community characteristics
associated with the resilience of households to natural disasters can be useful inputs for
policies to strengthen the resilience to natural disasters.
The study is expected to have several contributions to the literature of environmental
economics as well as development economics. Firstly, it provides empirical findings on the
effect of natural disasters on household welfare and povertyand the factors that can mitigate
the adverse effect of natural disasters in Vietnam - a developing country highly exposed to
natural disaster.Secondly,it proposes a simple estimation method to estimate the
geographically heterogeneous effect of natural disasters on household welfare.
The paper is structured into six sections. The second section provides a brief review
of literature on the effect of natural disasters in the world and in the case of Vietnam. The
third section presents the data set and descriptive analysis of welfare and natural exposure
of households in rural Vietnam. The fourth and fifth sections present the estimation
methods and empirical results on the effect of natural disasters, respectively. Finally, the
sixth section concludes.
5
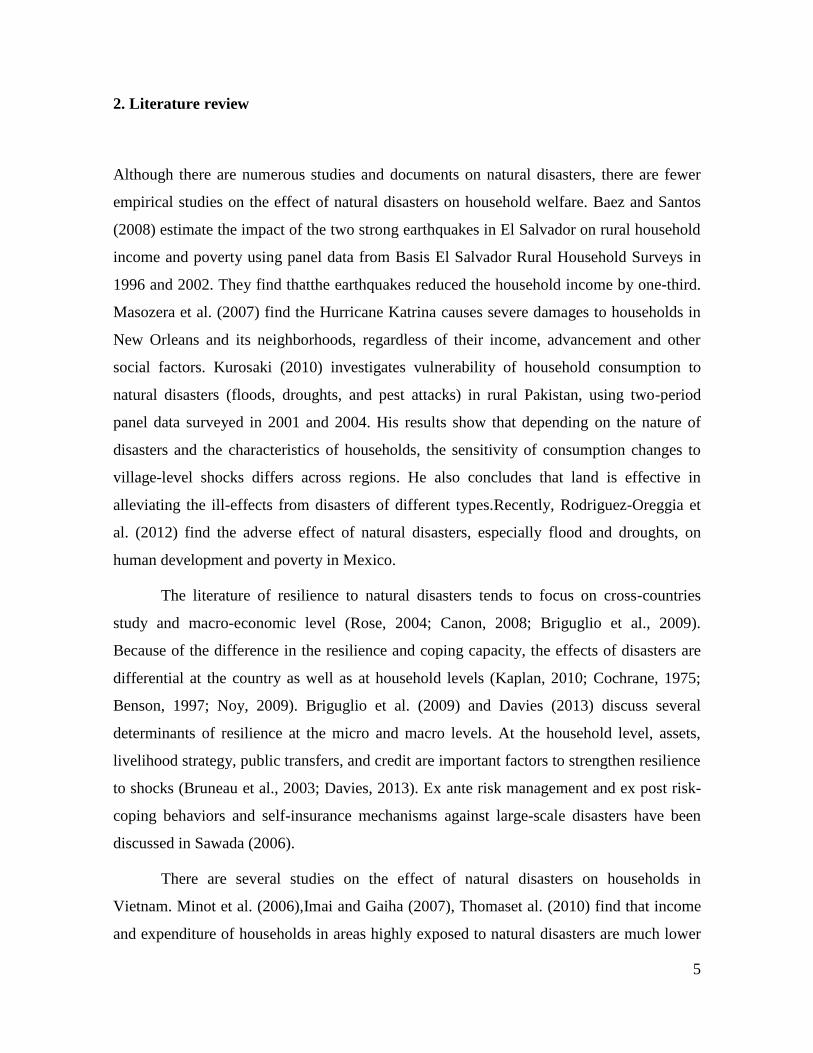
2. Literature review
Although there are numerous studies and documents on natural disasters, there are fewer
empirical studies on the effect of natural disasters on household welfare. Baez and Santos
(2008) estimate the impact of the two strong earthquakes in El Salvador on rural household
income and poverty using panel data from Basis El Salvador Rural Household Surveys in
1996 and 2002. They find thatthe earthquakes reduced the household income by one-third.
Masozera et al. (2007) find the Hurricane Katrina causes severe damages to households in
New Orleans and its neighborhoods, regardless of their income, advancement and other
social factors. Kurosaki (2010) investigates vulnerability of household consumption to
natural disasters (floods, droughts, and pest attacks) in rural Pakistan, using two-period
panel data surveyed in 2001 and 2004. His results show that depending on the nature of
disasters and the characteristics of households, the sensitivity of consumption changes to
village-level shocks differs across regions. He also concludes that land is effective in
alleviating the ill-effects from disasters of different types.Recently, Rodriguez-Oreggia et
al. (2012) find the adverse effect of natural disasters, especially flood and droughts, on
human development and poverty in Mexico.
The literature of resilience to natural disasters tends to focus on cross-countries
study and macro-economic level (Rose, 2004; Canon, 2008; Briguglio et al., 2009).
Because of the difference in the resilience and coping capacity, the effects of disasters are
differential at the country as well as at household levels (Kaplan, 2010; Cochrane, 1975;
Benson, 1997; Noy, 2009). Briguglio et al. (2009) and Davies (2013) discuss several
determinants of resilience at the micro and macro levels. At the household level, assets,
livelihood strategy, public transfers, and credit are important factors to strengthen resilience
to shocks (Bruneau et al., 2003; Davies, 2013). Ex ante risk management and ex post risk-
coping behaviors and self-insurance mechanisms against large-scale disasters have been
discussed in Sawada (2006).
There are several studies on the effect of natural disasters on households in
Vietnam. Minot et al. (2006),Imai and Gaiha (2007), Thomaset al. (2010) find that income
and expenditure of households in areas highly exposed to natural disasters are much lower
6
than the averageincome and expenditure.Thomaset al. (2010) estimatethat riverine floods
and hurricanes cause household consumption losses of 23 and 52 percent, respectively.
Recently, Wainwright and Newman (2011) look atcoping strategies of rural household
toadverse income shocks. They find that liquid assets, public and private transfers can help
households lessen the consumption fluctuation caused by natural shocks.
Our paper differentiates to the previous studies on natural disasters‟ impacts in
Vietnam in three facets. Firstly, our papermeasures the effect of the three most frequent
disasters in Vietnam including storms, floods and droughts using the most recent Vietnam
Household Living Standard Surveys in 2004, 2006, 2008 and 2008. Secondly, we examine
the role of a large number of household and commune characteristics in strengthening the
resilience of households to disasters. Thirdly, we propose a simple method to estimate the
geographically heterogeneous effect of natural disasters on household consumption.
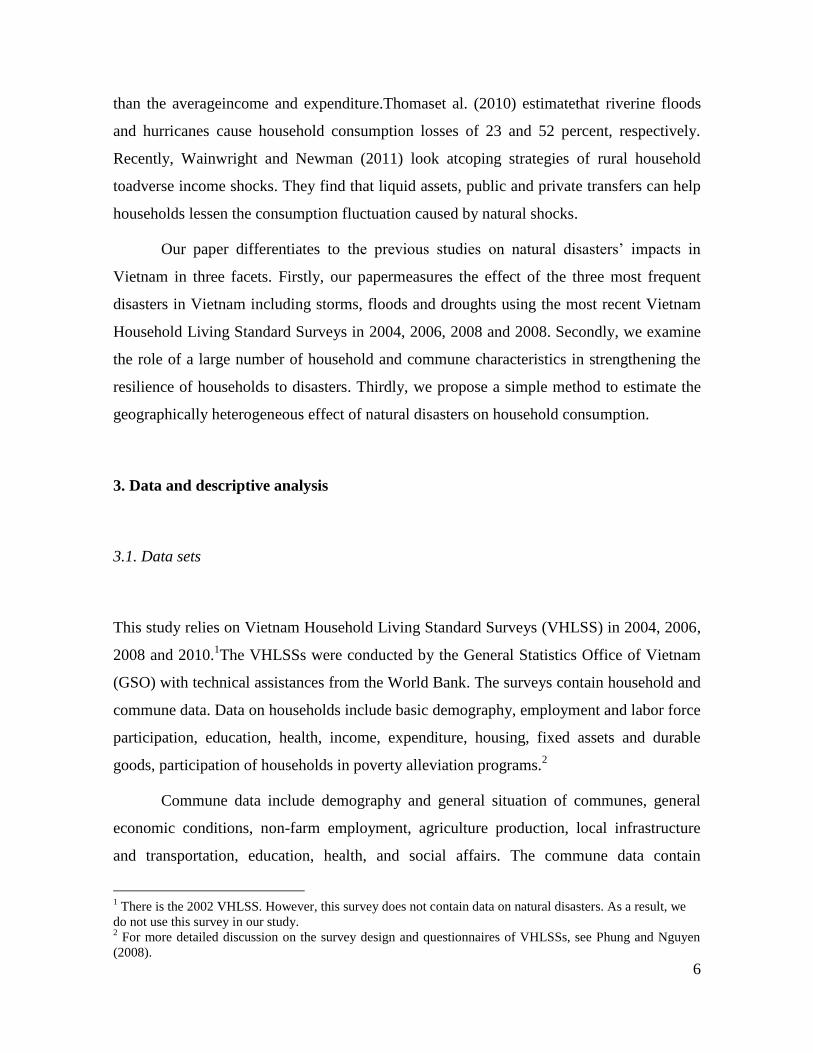
3. Data and descriptive analysis
3.1. Data sets
This study relies on Vietnam Household Living Standard Surveys (VHLSS) in 2004, 2006,
2008 and 2010.1The VHLSSs were conducted by the General Statistics Office of Vietnam
(GSO) with technical assistances from the World Bank. The surveys contain household and
commune data. Data on households include basic demography, employment and labor force
participation, education, health, income, expenditure, housing, fixed assets and durable
goods, participation of households in poverty alleviation programs.2
Commune data include demography and general situation of communes, general
economic conditions, non-farm employment, agriculture production, local infrastructure
and transportation, education, health, and social affairs. The commune data contain
1 There is the 2002 VHLSS. However, this survey does not contain data on natural disasters. As a result, we
do not use this survey in our study. 2 For more detailed discussion on the survey design and questionnaires of VHLSSs, see Phung and Nguyen
(2008).
7
information on natural disasters happening in communes in previous years. Commune data
can be merged with household data. Each of the VHLSSs covers more than ninethousand
households. The data are representative for urban/rural and eight geographic regions. In this
data, we use the rural samples, since data on urban disaster are not available in the surveys.
The 2004, 2006, 2008 and 2010 VHLSSs covered6938, 6882, 6837, and 6750 rural
households, respectively.
Data on disasters are collected from the rural commune questionnaires. Commune
leaders are asked about different disasters that happened most recently during the past three
years. There is no information on the number of disasters during the past three years. Thus,
in this study we define the disaster variables as dummy variables indicating whether a
disaster (storm, flood or drought) happened in a commune during the past two years. We
define the disaster variables that happed during the past two years for the purpose of
regression analysis, since our VHLSSs have a two year gap.
3.2. Descriptive analysis
Vietnam has been successful in poverty reduction. During the period 2004-2010, the
proportion of rural population with per capita expenditure below the poverty line decreased
from 25% to 17.9%.3However, the speed of poverty reduction is slow in the recent years.
There is a large difference in the poverty rate between regions. West Northern Mountain is
the poorest region, while South East and Red River Delta are the richest regions. Poverty is
very high in ethnic minorities as well as households living in high mountains.
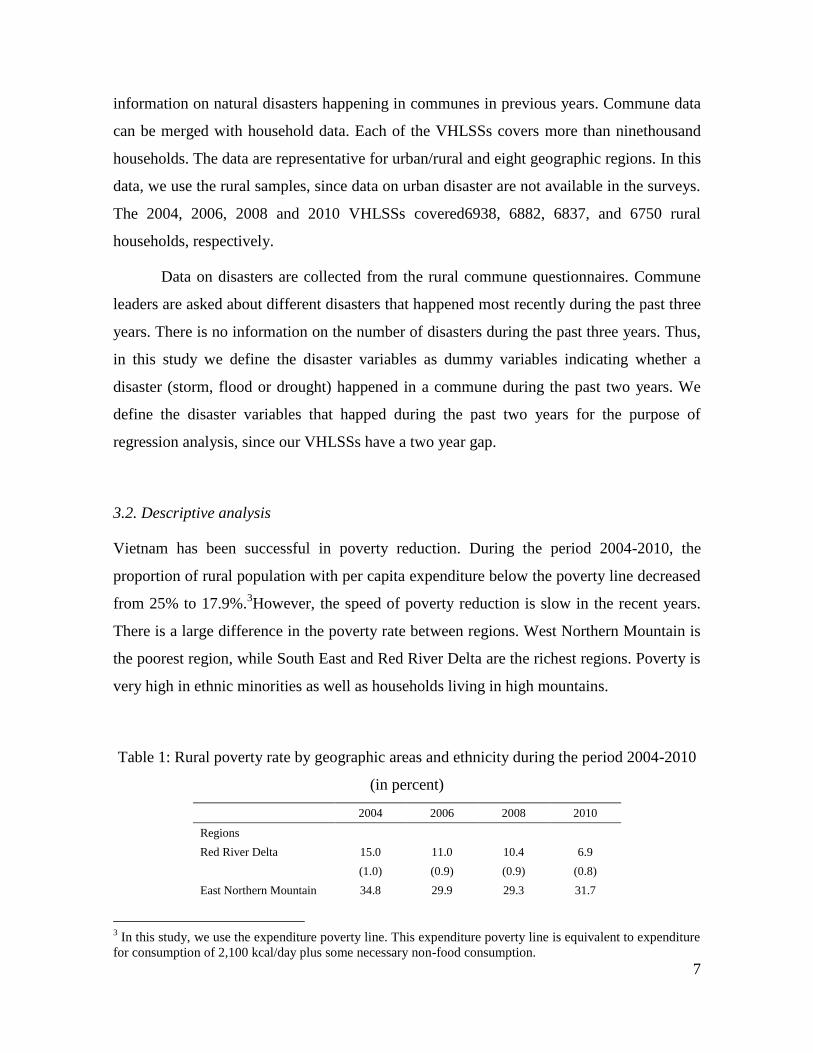
Table 1: Rural poverty rate by geographic areas and ethnicity during the period 2004-2010
(in percent)
2004 2006 2008 2010
Regions
Red River Delta 15.0 11.0 10.4 6.9
(1.0) (0.9) (0.9) (0.8)
East Northern Mountain 34.8 29.9 29.3 31.7
3 In this study, we use the expenditure poverty line. This expenditure poverty line is equivalent to expenditure
for consumption of 2,100 kcal/day plus some necessary non-food consumption.
8
2004 2006 2008 2010
(1.6) (1.6) (1.6) (1.6)
West Northern Mountain 65.5 56.4 52.0 50.7
(2.8) (3.0) (3.2) (3.0)
North Central Coast 36.4 33.1 25.9 21.0
(1.9) (1.9) (1.9) (1.7)
South Central Coast 25.0 17.1 18.2 18.1
(2.0) (1.8) (1.9) (1.8)
Central Highlands 41.4 34.4 31.4 28.8
(2.8) (2.7) (2.7) (2.5)
South East 10.9 9.9 5.7 10.4
(1.4) (1.4) (1.0) (1.4)
Mekong Delta 18.1 11.8 13.6 13.9
(1.1) (0.9) (1.0) (1.0)
Geographic types
Coastal 22.4 18.3 13.6 10.0
(2.2) (2.1) (1.8) (1.7)
Delta 16.8 12.1 11.9 10.7
(0.7) (0.6) (0.7) (0.6)
Midlands/hill 18.8 14.8 10.1 6.6
(2.2) (1.9) (1.6) (1.4)
Low mountains 31.3 26.2 20.6 18.3
(1.7) (1.5) (1.4) (1.3)
High mountains 53.3 48.8 49.5 45.9
(1.7) (1.8) (1.8) (1.6)
Ethnic minorities
Kinh/Hoa 17.9 13.5 11.7 9.7
(0.6) (0.5) (0.5) (0.5)
Ethnic minorities 62.7 54.0 52.5 52.7
(1.5) (1.6) (1.6) (1.5)
All rural Vietnam 25.0 20.4 18.7 17.9
(0.6) (0.6) (0.6) (0.5)
Note: Standard errors are in parentheses.
Source: Authors‟ estimation from the VHLSSs 2004, 2006, 2008 and 2010.
The four popular natural disasters are earthquakes, storms, floods and droughts
(World Bank, 2010). In the world, droughts are the deadliest of the four hazard
categories(World Bank, 2010). However, earthquakes rarely happens in Vietnam, while
storms, floods and droughts take place more frequently and they are typical threats for a
large part of Vietnam‟s agricultural areas.
9
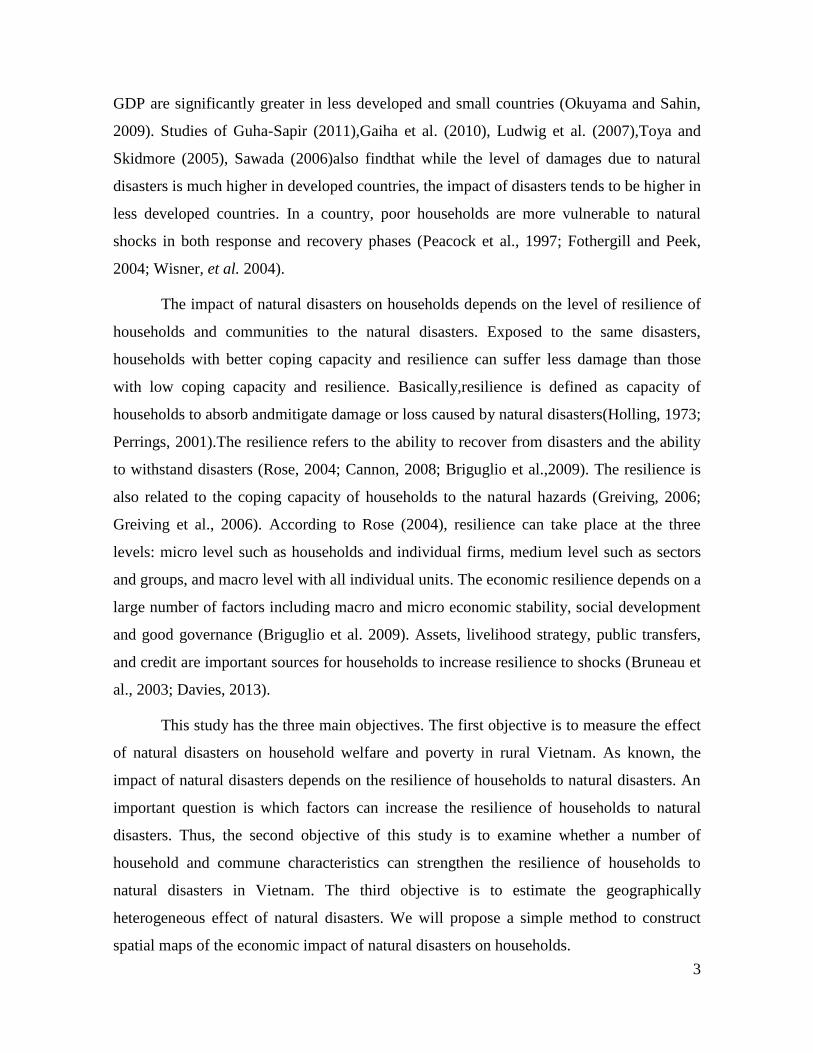
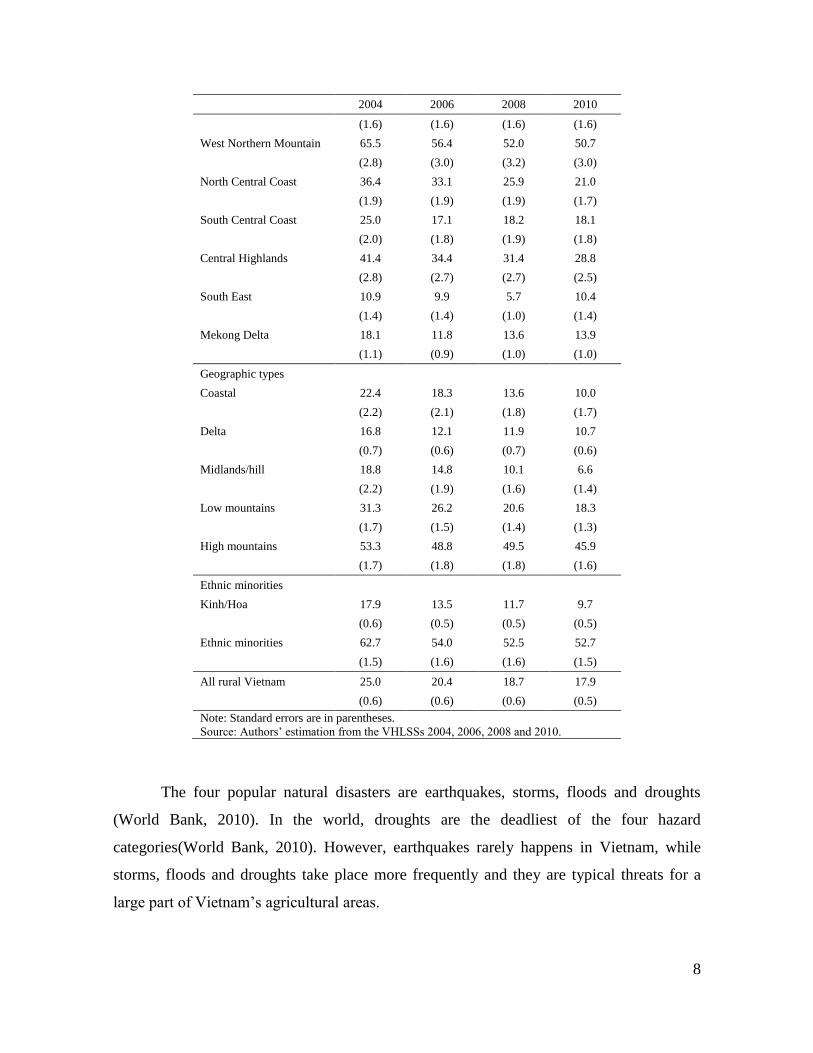
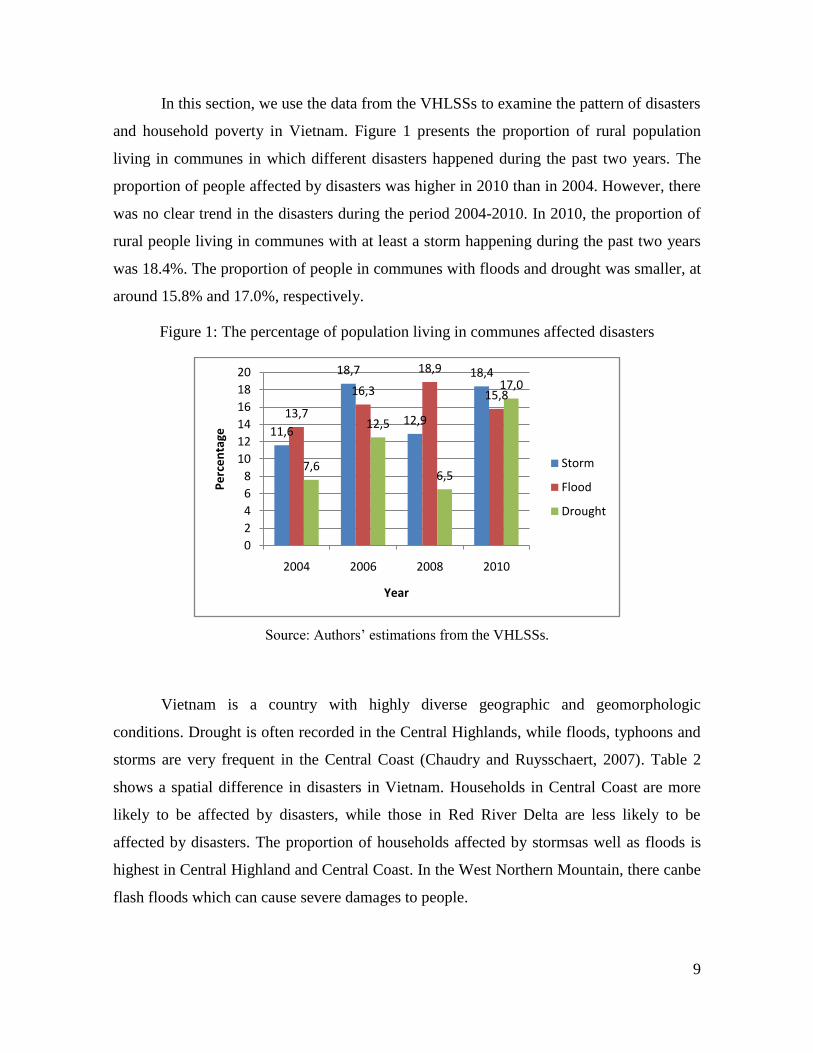
In this section, we use the data from the VHLSSs to examine the pattern of disasters
and household poverty in Vietnam. Figure 1 presents the proportion of rural population
living in communes in which different disasters happened during the past two years. The
proportion of people affected by disasters was higher in 2010 than in 2004. However, there
was no clear trend in the disasters during the period 2004-2010. In 2010, the proportion of
rural people living in communes with at least a storm happening during the past two years
was 18.4%. The proportion of people in communes with floods and drought was smaller, at
around 15.8% and 17.0%, respectively.
Figure 1: The percentage of population living in communes affected disasters
Source: Authors‟ estimations from the VHLSSs.
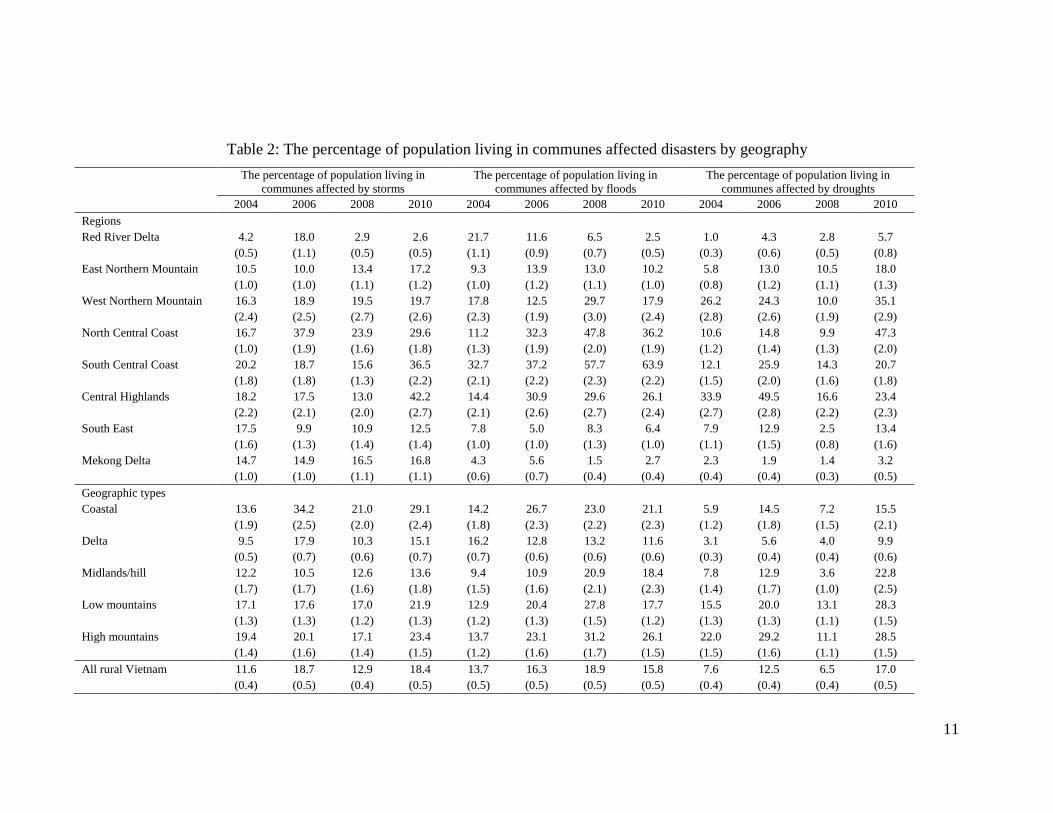
Vietnam is a country with highly diverse geographic and geomorphologic
conditions. Drought is often recorded in the Central Highlands, while floods, typhoons and
storms are very frequent in the Central Coast (Chaudry and Ruysschaert, 2007). Table 2
shows a spatial difference in disasters in Vietnam. Households in Central Coast are more
likely to be affected by disasters, while those in Red River Delta are less likely to be
affected by disasters. The proportion of households affected by stormsas well as floods is
highest in Central Highland and Central Coast. In the West Northern Mountain, there canbe
flash floods which can cause severe damages to people.
11,6
18,7
12,9
18,4
13,7
16,3
18,9
15,8
7,6
12,5
6,5
17,0
0
2
4
6
8
10
12
14
16
18
20
2004 2006 2008 2010
Percentage
Year
Storm
Flood
Drought
10
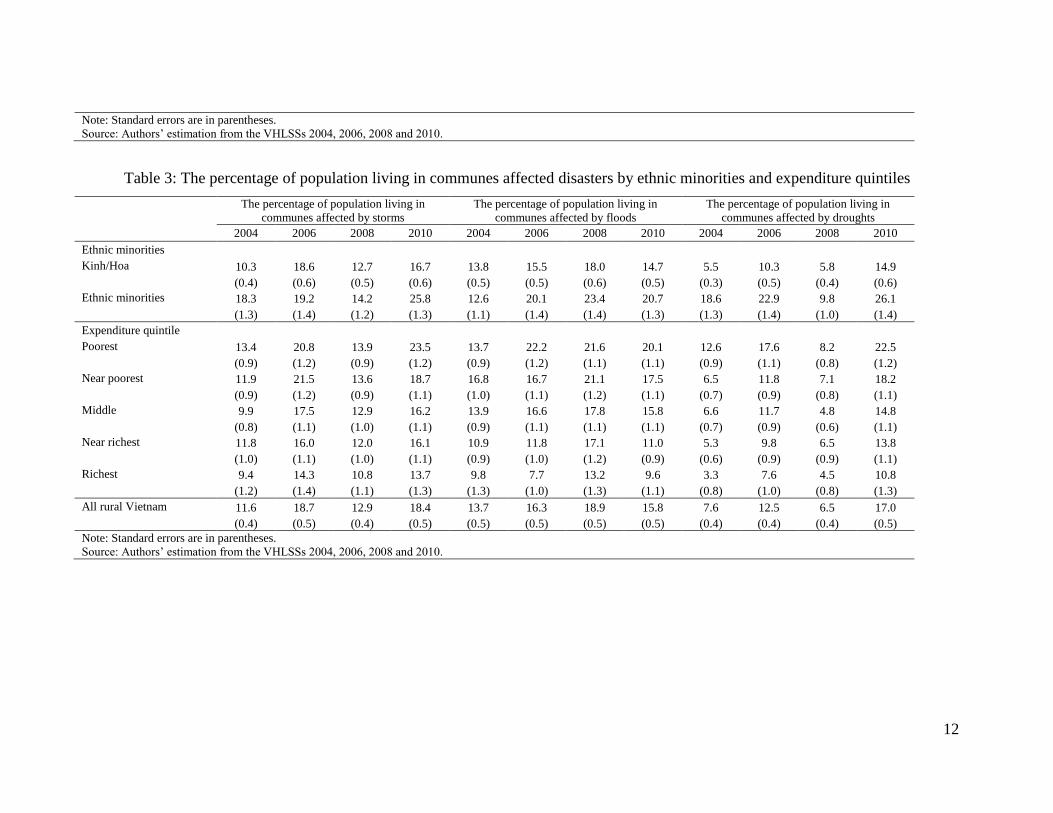
Vietnam has 54 ethnic groups, of which Kinh (Vietnamese) people account for
around 85% of the total population.4 Table 3 shows that ethnic minorities are more likely to
live in communes with more frequent disasters than Kinh and Hoa. This is because ethnic
minorities tend to stay in Northern Mountain, Central Highlands and Central Coast which
are more exposed to disasters than other regions. The gap is highest for droughts: 26.1% of
ethnic minorities and 14.9% of Kinh/Hoa live in communes with droughts happening the
past two years, respectively.
Table 3 also presents the proportion of households living in communes with
disasters by expenditure quintiles. There is quite clear correlation between poverty rate and
disasters. Poor households tend to live in communes with high probabilities of disasters. In
2010, the proportion of people in the lowest expenditure quintile faced storms, floods, and
droughts during the past two years is 23.5%, 20.1%, and 22.5%, respectively. The
corresponding figures for people in the highest expenditure quintile are 13.7%, 9.6%, and
10.8%.
4Hoa (Chinese) mainly lives in cities and have higher income than other ethnic minorities. Thus Hoa is
grouped with Kinh (Vietnamese) in this study.
11
Table 2: The percentage of population living in communes affected disasters by geography
The percentage of population living in
communes affected by storms
The percentage of population living in
communes affected by floods
The percentage of population living in
communes affected by droughts
2004 2006 2008 2010 2004 2006 2008 2010 2004 2006 2008 2010
Regions
Red River Delta 4.2 18.0 2.9 2.6 21.7 11.6 6.5 2.5 1.0 4.3 2.8 5.7
(0.5) (1.1) (0.5) (0.5) (1.1) (0.9) (0.7) (0.5) (0.3) (0.6) (0.5) (0.8)
East Northern Mountain 10.5 10.0 13.4 17.2 9.3 13.9 13.0 10.2 5.8 13.0 10.5 18.0
(1.0) (1.0) (1.1) (1.2) (1.0) (1.2) (1.1) (1.0) (0.8) (1.2) (1.1) (1.3)
West Northern Mountain 16.3 18.9 19.5 19.7 17.8 12.5 29.7 17.9 26.2 24.3 10.0 35.1
(2.4) (2.5) (2.7) (2.6) (2.3) (1.9) (3.0) (2.4) (2.8) (2.6) (1.9) (2.9)
North Central Coast 16.7 37.9 23.9 29.6 11.2 32.3 47.8 36.2 10.6 14.8 9.9 47.3
(1.0) (1.9) (1.6) (1.8) (1.3) (1.9) (2.0) (1.9) (1.2) (1.4) (1.3) (2.0)
South Central Coast 20.2 18.7 15.6 36.5 32.7 37.2 57.7 63.9 12.1 25.9 14.3 20.7
(1.8) (1.8) (1.3) (2.2) (2.1) (2.2) (2.3) (2.2) (1.5) (2.0) (1.6) (1.8)
Central Highlands 18.2 17.5 13.0 42.2 14.4 30.9 29.6 26.1 33.9 49.5 16.6 23.4
(2.2) (2.1) (2.0) (2.7) (2.1) (2.6) (2.7) (2.4) (2.7) (2.8) (2.2) (2.3)
South East 17.5 9.9 10.9 12.5 7.8 5.0 8.3 6.4 7.9 12.9 2.5 13.4
(1.6) (1.3) (1.4) (1.4) (1.0) (1.0) (1.3) (1.0) (1.1) (1.5) (0.8) (1.6)
Mekong Delta 14.7 14.9 16.5 16.8 4.3 5.6 1.5 2.7 2.3 1.9 1.4 3.2
(1.0) (1.0) (1.1) (1.1) (0.6) (0.7) (0.4) (0.4) (0.4) (0.4) (0.3) (0.5)
Geographic types
Coastal 13.6 34.2 21.0 29.1 14.2 26.7 23.0 21.1 5.9 14.5 7.2 15.5
(1.9) (2.5) (2.0) (2.4) (1.8) (2.3) (2.2) (2.3) (1.2) (1.8) (1.5) (2.1)
Delta 9.5 17.9 10.3 15.1 16.2 12.8 13.2 11.6 3.1 5.6 4.0 9.9
(0.5) (0.7) (0.6) (0.7) (0.7) (0.6) (0.6) (0.6) (0.3) (0.4) (0.4) (0.6)
Midlands/hill 12.2 10.5 12.6 13.6 9.4 10.9 20.9 18.4 7.8 12.9 3.6 22.8
(1.7) (1.7) (1.6) (1.8) (1.5) (1.6) (2.1) (2.3) (1.4) (1.7) (1.0) (2.5)
Low mountains 17.1 17.6 17.0 21.9 12.9 20.4 27.8 17.7 15.5 20.0 13.1 28.3
(1.3) (1.3) (1.2) (1.3) (1.2) (1.3) (1.5) (1.2) (1.3) (1.3) (1.1) (1.5)
High mountains 19.4 20.1 17.1 23.4 13.7 23.1 31.2 26.1 22.0 29.2 11.1 28.5
(1.4) (1.6) (1.4) (1.5) (1.2) (1.6) (1.7) (1.5) (1.5) (1.6) (1.1) (1.5)
All rural Vietnam 11.6 18.7 12.9 18.4 13.7 16.3 18.9 15.8 7.6 12.5 6.5 17.0
(0.4) (0.5) (0.4) (0.5) (0.5) (0.5) (0.5) (0.5) (0.4) (0.4) (0.4) (0.5)
12
Note: Standard errors are in parentheses.
Source: Authors‟ estimation from the VHLSSs 2004, 2006, 2008 and 2010.
Table 3: The percentage of population living in communes affected disasters by ethnic minorities and expenditure quintiles
The percentage of population living in
communes affected by storms
The percentage of population living in
communes affected by floods
The percentage of population living in
communes affected by droughts
2004 2006 2008 2010 2004 2006 2008 2010 2004 2006 2008 2010
Ethnic minorities
Kinh/Hoa 10.3 18.6 12.7 16.7 13.8 15.5 18.0 14.7 5.5 10.3 5.8 14.9
(0.4) (0.6) (0.5) (0.6) (0.5) (0.5) (0.6) (0.5) (0.3) (0.5) (0.4) (0.6)
Ethnic minorities 18.3 19.2 14.2 25.8 12.6 20.1 23.4 20.7 18.6 22.9 9.8 26.1
(1.3) (1.4) (1.2) (1.3) (1.1) (1.4) (1.4) (1.3) (1.3) (1.4) (1.0) (1.4)
Expenditure quintile
Poorest 13.4 20.8 13.9 23.5 13.7 22.2 21.6 20.1 12.6 17.6 8.2 22.5
(0.9) (1.2) (0.9) (1.2) (0.9) (1.2) (1.1) (1.1) (0.9) (1.1) (0.8) (1.2)
Near poorest 11.9 21.5 13.6 18.7 16.8 16.7 21.1 17.5 6.5 11.8 7.1 18.2
(0.9) (1.2) (0.9) (1.1) (1.0) (1.1) (1.2) (1.1) (0.7) (0.9) (0.8) (1.1)
Middle 9.9 17.5 12.9 16.2 13.9 16.6 17.8 15.8 6.6 11.7 4.8 14.8
(0.8) (1.1) (1.0) (1.1) (0.9) (1.1) (1.1) (1.1) (0.7) (0.9) (0.6) (1.1)
Near richest 11.8 16.0 12.0 16.1 10.9 11.8 17.1 11.0 5.3 9.8 6.5 13.8
(1.0) (1.1) (1.0) (1.1) (0.9) (1.0) (1.2) (0.9) (0.6) (0.9) (0.9) (1.1)
Richest 9.4 14.3 10.8 13.7 9.8 7.7 13.2 9.6 3.3 7.6 4.5 10.8
(1.2) (1.4) (1.1) (1.3) (1.3) (1.0) (1.3) (1.1) (0.8) (1.0) (0.8) (1.3)
All rural Vietnam 11.6 18.7 12.9 18.4 13.7 16.3 18.9 15.8 7.6 12.5 6.5 17.0
(0.4) (0.5) (0.4) (0.5) (0.5) (0.5) (0.5) (0.5) (0.4) (0.4) (0.4) (0.5)
Note: Standard errors are in parentheses.
Source: Authors‟ estimation from the VHLSSs 2004, 2006, 2008 and 2010.
13
4. Estimation methods
4.1. Effects on natural disasters on household welfare
The main estimation method used in this study is econometric regression. We assume a
household welfare indicator is a function of characteristics of households and communities
as follows (Glewwe, 1991):
ijttjtjtjtijtjtjtijtijtGDCDXDCXY
6543210)ln( , (1)
whereijt
Y is an welfare indicator of household i in commune j in the year t; ijt
X is a vector
of characteristics of households such as demographical variables and assets; jt
C is a vector
of characteristics of communities such as infrastructure; jt
D is a vector of three dummy
variables indicating whether storms, floods and droughts happened in communes during the
past two years;t
G is the dummy variable of years; ijt
is unobserved variables.
We use different indicators of household welfare including per capita income, per
capita expenditure, the poverty status of households, and share of incomes by different
sources. We use similar specifications as equation (1) for different dependent variables.
The effect of natural disaster on households is measured by parameters 3
, 4
and
5 . The effect of disasters also reflects the resilience level of households. Households with
more resilience to disasters are less affected by disasters. The equation (1) includes
interactions between the natural disasters and variables of communes and households. It
allows the effect of natural disasters to vary across different households.
A problem is estimating the effect of natural disasters is the endogeneity of natural
disasters. The unobserved variables can be correlated with the disaster variables. In
equation (1), unobserved variables ijt
include both commune-level and household-level
14
variables. Since our disaster variables are the commune-level variables, they are more
likely to be correlated with unobserved commune-level variables. The unobserved
commune-level variables can be decomposed into time-variant and time-invariant
commune-level variables.In this study, we use the commune fixed-effect regression to
eliminate unobserved time-invariant commune-level variables. It is expected that the
endogeneity bias will be negligible after the elimination of these unobserved time-invariant
variables and the control of observed variables. In addition, the natural shocks are expected
more exogenous than social economic shocks.5
The equation (1) includes interactions between the natural disaster variable and
variables of communes and households. It allows the effect of natural disasters to vary
across different households. Households who are more resilient to natural disasters are less
likely to be affected by natural disasters. In this study, we interact the disasters variables
with a large number of household and commune variables to examine whether the effect of
disasters varies across these variables.
4.2. Geographic effects of natural disasters on household expenditure
In this study, we will measure the effect of disasters on household welfare at provincial and
district levels. From model (1), the partial effect of a disaster on log of per capita
expenditure is estimated by taking partial derivative of the dependent variable with respect
to the disaster variable:
.543_)log(
jtijtijtY
CXPE (2)
This effect varies across households, communes and years. Since the dependent variable is
measured in logarithm, ijtY
PE_)log(
is interpreted as the percentage change in per capita
expenditure of household i if their commune is exposed to disasters.To measure the partial
effect of the natural disasters on the absolute value of per capita expenditure, we can take
5A better approach is to use household fixed-effect regressions. However, this approach requires panel data at
the household level, and there are no household panel data from the 2004 VHLSS to the 2010 VHLSS.
15
the partial derivative of per capita expenditure with respect to the disaster variable as
follows:
.
543
543
_
6543210
6543210
ijtjtijt
uGDCDXDCX
jtijt
jt
uGDCDXDCX
jt
ijt
ijtY
YCX
eCX
D
e
D
YPE
ijtijtjtjtjtijtjtjtijt
ijtijtjtjtjtijtjtjtijt
(3)
We can take the average of this partial effect across households within an area such
a province or a district to compute the average partial effect of disasters for that area.
Because the VHLSSs are sampled surveys which are not representative for provinces as
well as smaller areas, we will use the Agriculture and Fishery Census 2006 (RAFC) to
estimate the effect of disasters at small areas.6The estimated effects are interpreted for the
year 2006.
For an areaK, the estimator is expressed as follows:
Kk
RAFC
k
RAFC
k
K
KYLogCX
nEPA )ˆˆˆ(
1ˆ543_)(
, (4)
where3
, 4
and 5
are estimates from the model (1), nK is the number of people in
areaK. The upper-subscript „RAFC‟ means the household and commune variables from the
2006 RAFC. The standard error of K
EPA ˆ can be easily obtained by a delta method.
KYLogEPA
_)(ˆ is interpreted as the percentage change in the average per capita expenditure of
area K if a disaster happens in that area. We can also estimate the average partial effect of
disasters on the absolute value of per capita expenditure for district Kby taking the average
of ijtY
PE_
in equation (3) across population in district K:
Kk k
RAFC
k
RAFC
k
K
KYYCX
nEPA )ˆˆˆ(
1ˆ543_
(5)
6The Rural Agriculture and Fishery Census (RAFC) was carried out by the GSO in 2006. The censuses
covered all households in rural areas. The censuses contain data on individuals and households including
basic demography, employment and housing, and agricultural activities. There are also commune-level data
on socio-economic conditions, agricultural production, infrastructure and transportation, education, health,
and social affairs, natural disasters affecting households of all the rural communes throughout the country.
16
The average partial effect can be estimated for all small areas such as districts or
communes. In some areas, there are no disasters in recent years. Thus, KYLog
EPA_)(
ˆ and
KYEPA
_ˆ are not measures of the actual loss caused by disasters. It can be regarded as the
measures of the potential loss for an area if there is a disaster happens in that area. In this
study, we will estimate KYLog
EPA_)(
ˆ and KY
EPA_
ˆ for all the districts and provinces of the
country. Districts or provinces with high value of EPA ˆ are more likely affected by disasters
if the disasters happen in these districts and provinces. High value of EPA ˆ also means low
resilience to disasters.
It should be noted that we cannot estimate the potential loss of districts or provinces
using data only from the VHLSSs. These surveys are not representative at the district and
province level. On the other hand, we cannot use data from only the 2006 RAFC to
estimate model (1), since the 2006 RAFC does not contain data on household income and
consumption expenditure.7 Thus we have to combine the VHLSSs and the 2006 RAFC to
estimate the potential loss in household income caused by natural disaster at the commune
level. It is worth noting that we have to limit the explanatory variables in model (1) to those
that are available in both the VHLSSs and the 2006 RAFC in order to apply the predicted
model of the effect of natural disasters on household income into the 2006 RAFC.8
5. Empirical results
5.1. The effect of natural disasters on household welfare
7To estimate in equation (5) which contains per capita expenditure of households in districts, we have to use
the predicted per capita expenditure of households that is estimated from small area estimation method using
data from the 2006 VHLSS and the 2006 RAFC. We obtained the predicted expenditure data from Nguyen et
al. (2010). 8The method to combine household survey and censes is called the small area estimation method. Elbers et al.
(2002, 2003) develop this method to estimate the poverty and welfare indexes at the small areas. In Vietnam,
it has been widely applied to construct the poverty maps (e.g., Nguyen et al., 2010; Nguyen, 2011).
17
In Table 4, we present the commune fixed-effects regression of log of per capita income,
log of per capita expenditure and the poverty status of households. We used two models
which differ in the number of explanatory variables to examine the sensitivity of the
estimates of disaster impacts to the selection of explanatory variables. The small model
contains only disaster variables and demographical variables. The large models include
additional variables of education, land, living area, and commune infrastructures. We tend
to use a small set of control variables that are more exogenous or less likely to be affected
by natural disasters. The control variables should not be affected by the treatment variable
of interest, i.e., the disasters in this study (Heckman and others, 1999; Angrist and Pischke,
2008). The summary statistics of dependent variables and explanatory variables is
presented in Table A.1 in Appendix.
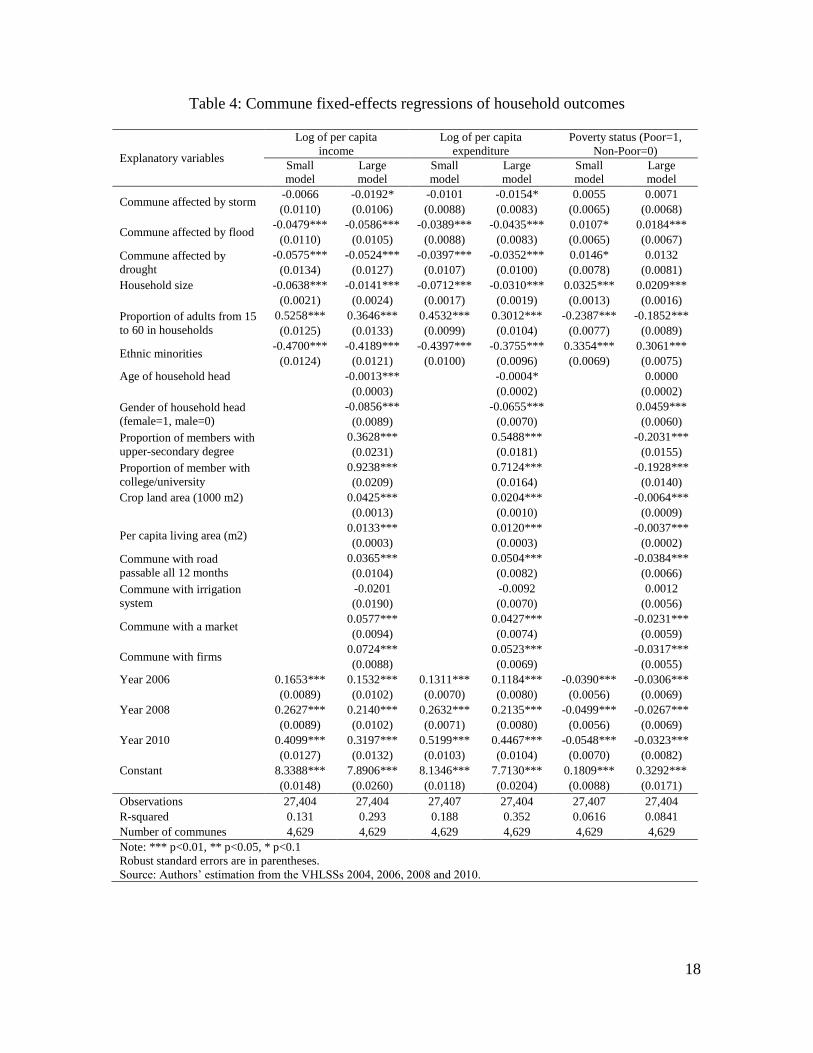
All the three disaster types (storms, floods and droughts) have a negative effect on
household welfare. The effect of storms tends to be smaller than the effect of floods and
droughts. According to the large models in Table 4, per capita income of households living
in a commune with storms, floods and droughts decreases approximately by 1.9%, 5.9%,
and 5.2%, respectively. Storms, floods and drought also have an expenditure reducing
effect, by 1.5%, 4.4%, and 3.5% on average, respectively. Since disasters reduce per capita
expenditure, they increase the expenditure poverty rate. All the three disaster variables have
positive signs in the regressions of poverty. However, only the effect of floods on the
probability of being poor is statistically significant in the large model. Living in a commune
with floods during the past two years can increase the probability of being poor 0.018.
Table 4 also reportsthe estimated coefficients on household and community
characteristics, and these estimated coefficients have expected signs. More specifically,
households with larger size and lower proportion of working-age people tend to have lower
per capita income and expenditure. Ethnic minority households and households with female
and older heads also have lower per capita income and expenditure. The more educated
households with more crop land and living areas are more likely to have higher per capita
income and expenditure and lower poverty. Commune roads, markets and firms are
positively correlated with household income and expenditure. The year dummies suggest
that household income and expenditure increased over the period 2004-2010.
18
Table 4: Commune fixed-effects regressions of household outcomes
Explanatory variables
Log of per capita
income
Log of per capita
expenditure
Poverty status (Poor=1,
Non-Poor=0)
Small
model
Large
model
Small
model
Large
model
Small
model
Large
model
Commune affected by storm -0.0066 -0.0192* -0.0101 -0.0154* 0.0055 0.0071
(0.0110) (0.0106) (0.0088) (0.0083) (0.0065) (0.0068)
Commune affected by flood -0.0479*** -0.0586*** -0.0389*** -0.0435*** 0.0107* 0.0184***
(0.0110) (0.0105) (0.0088) (0.0083) (0.0065) (0.0067)
Commune affected by
drought
-0.0575*** -0.0524*** -0.0397*** -0.0352*** 0.0146* 0.0132
(0.0134) (0.0127) (0.0107) (0.0100) (0.0078) (0.0081)
Household size -0.0638*** -0.0141*** -0.0712*** -0.0310*** 0.0325*** 0.0209***
(0.0021) (0.0024) (0.0017) (0.0019) (0.0013) (0.0016)
Proportion of adults from 15
to 60 in households
0.5258*** 0.3646*** 0.4532*** 0.3012*** -0.2387*** -0.1852***
(0.0125) (0.0133) (0.0099) (0.0104) (0.0077) (0.0089)
Ethnic minorities -0.4700*** -0.4189*** -0.4397*** -0.3755*** 0.3354*** 0.3061***
(0.0124) (0.0121) (0.0100) (0.0096) (0.0069) (0.0075)
Age of household head
-0.0013*** -0.0004*
0.0000
(0.0003) (0.0002)
(0.0002)
Gender of household head
(female=1, male=0)
-0.0856*** -0.0655***
0.0459***
(0.0089) (0.0070)
(0.0060)
Proportion of members with
upper-secondary degree
0.3628*** 0.5488***
-0.2031***
(0.0231) (0.0181)
(0.0155)
Proportion of member with
college/university
0.9238*** 0.7124***
-0.1928***
(0.0209) (0.0164)
(0.0140)
Crop land area (1000 m2)
0.0425*** 0.0204***
-0.0064***
(0.0013) (0.0010)
(0.0009)
Per capita living area (m2) 0.0133*** 0.0120***
-0.0037***
(0.0003) (0.0003)
(0.0002)
Commune with road
passable all 12 months
0.0365*** 0.0504***
-0.0384***
(0.0104) (0.0082)
(0.0066)
Commune with irrigation
system
-0.0201 -0.0092
0.0012
(0.0190) (0.0070)
(0.0056)
Commune with a market 0.0577*** 0.0427***
-0.0231***
(0.0094) (0.0074)
(0.0059)
Commune with firms 0.0724*** 0.0523***
-0.0317***
(0.0088) (0.0069)
(0.0055)
Year 2006 0.1653*** 0.1532*** 0.1311*** 0.1184*** -0.0390*** -0.0306***
(0.0089) (0.0102) (0.0070) (0.0080) (0.0056) (0.0069)
Year 2008 0.2627*** 0.2140*** 0.2632*** 0.2135*** -0.0499*** -0.0267***
(0.0089) (0.0102) (0.0071) (0.0080) (0.0056) (0.0069)
Year 2010 0.4099*** 0.3197*** 0.5199*** 0.4467*** -0.0548*** -0.0323***
(0.0127) (0.0132) (0.0103) (0.0104) (0.0070) (0.0082)
Constant 8.3388*** 7.8906*** 8.1346*** 7.7130*** 0.1809*** 0.3292***
(0.0148) (0.0260) (0.0118) (0.0204) (0.0088) (0.0171)
Observations 27,404 27,404 27,407 27,404 27,407 27,404
R-squared 0.131 0.293 0.188 0.352 0.0616 0.0841
Number of communes 4,629 4,629 4,629 4,629 4,629 4,629
Note: *** p<0.01, ** p<0.05, * p<0.1
Robust standard errors are in parentheses.
Source: Authors‟ estimation from the VHLSSs 2004, 2006, 2008 and 2010.
19
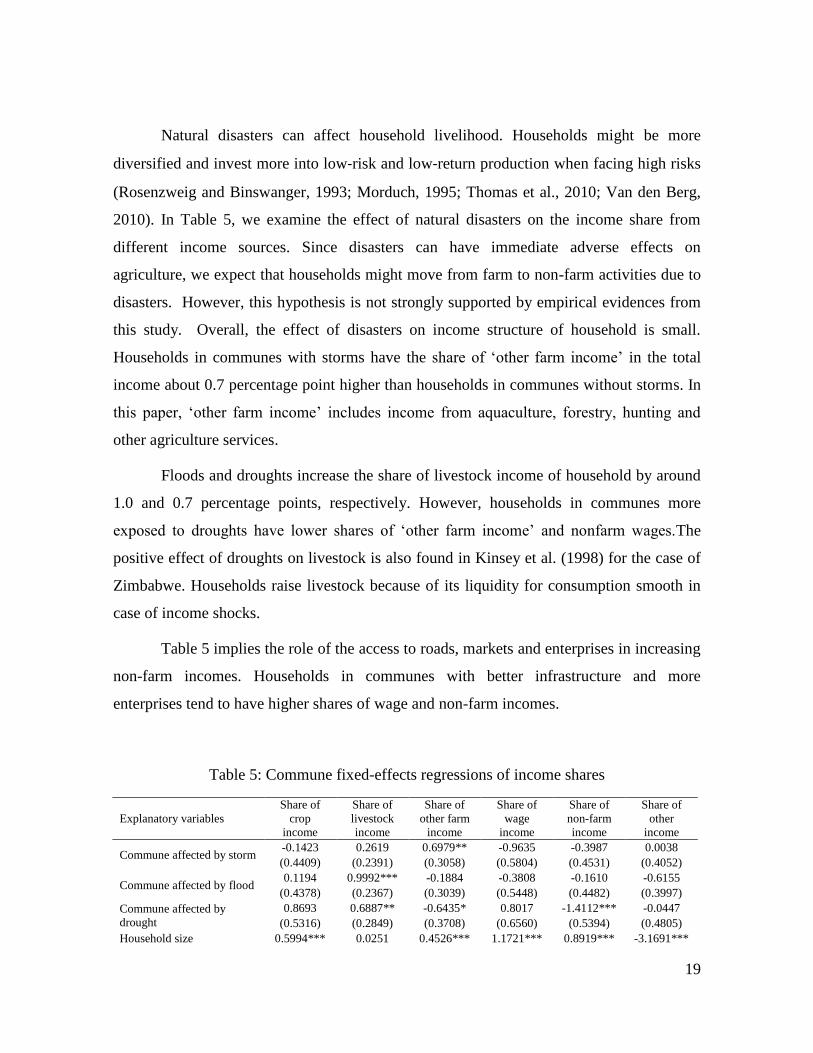
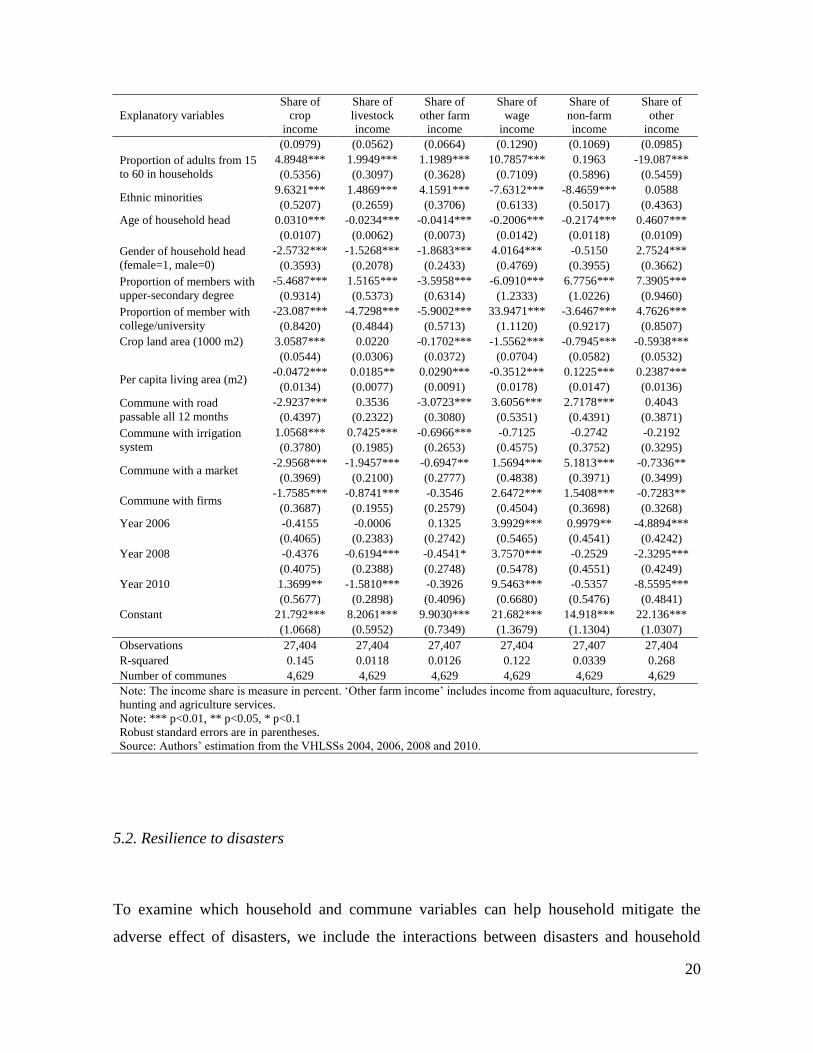
Natural disasters can affect household livelihood. Households might be more
diversified and invest more into low‐risk and low‐return production when facing high risks
(Rosenzweig and Binswanger, 1993; Morduch, 1995; Thomas et al., 2010; Van den Berg,
2010). In Table 5, we examine the effect of natural disasters on the income share from
different income sources. Since disasters can have immediate adverse effects on
agriculture, we expect that households might move from farm to non-farm activities due to
disasters. However, this hypothesis is not strongly supported by empirical evidences from
this study. Overall, the effect of disasters on income structure of household is small.
Households in communes with storms have the share of „other farm income‟ in the total
income about 0.7 percentage point higher than households in communes without storms. In
this paper, „other farm income‟ includes income from aquaculture, forestry, hunting and
other agriculture services.
Floods and droughts increase the share of livestock income of household by around
1.0 and 0.7 percentage points, respectively. However, households in communes more
exposed to droughts have lower shares of „other farm income‟ and nonfarm wages.The
positive effect of droughts on livestock is also found in Kinsey et al. (1998) for the case of
Zimbabwe. Households raise livestock because of its liquidity for consumption smooth in
case of income shocks.
Table 5 implies the role of the access to roads, markets and enterprises in increasing
non-farm incomes. Households in communes with better infrastructure and more
enterprises tend to have higher shares of wage and non-farm incomes.
Table 5: Commune fixed-effects regressions of income shares
Explanatory variables
Share of
crop
income
Share of
livestock
income
Share of
other farm
income
Share of
wage
income
Share of
non-farm
income
Share of
other
income
Commune affected by storm -0.1423 0.2619 0.6979** -0.9635 -0.3987 0.0038
(0.4409) (0.2391) (0.3058) (0.5804) (0.4531) (0.4052)
Commune affected by flood 0.1194 0.9992*** -0.1884 -0.3808 -0.1610 -0.6155
(0.4378) (0.2367) (0.3039) (0.5448) (0.4482) (0.3997)
Commune affected by
drought
0.8693 0.6887** -0.6435* 0.8017 -1.4112*** -0.0447
(0.5316) (0.2849) (0.3708) (0.6560) (0.5394) (0.4805)
Household size 0.5994*** 0.0251 0.4526*** 1.1721*** 0.8919*** -3.1691***
20
Explanatory variables
Share of
crop
income
Share of
livestock
income
Share of
other farm
income
Share of
wage
income
Share of
non-farm
income
Share of
other
income
(0.0979) (0.0562) (0.0664) (0.1290) (0.1069) (0.0985)
Proportion of adults from 15
to 60 in households
4.8948*** 1.9949*** 1.1989*** 10.7857*** 0.1963 -19.087***
(0.5356) (0.3097) (0.3628) (0.7109) (0.5896) (0.5459)
Ethnic minorities 9.6321*** 1.4869*** 4.1591*** -7.6312*** -8.4659*** 0.0588
(0.5207) (0.2659) (0.3706) (0.6133) (0.5017) (0.4363)
Age of household head 0.0310*** -0.0234*** -0.0414*** -0.2006*** -0.2174*** 0.4607***
(0.0107) (0.0062) (0.0073) (0.0142) (0.0118) (0.0109)
Gender of household head
(female=1, male=0)
-2.5732*** -1.5268*** -1.8683*** 4.0164*** -0.5150 2.7524***
(0.3593) (0.2078) (0.2433) (0.4769) (0.3955) (0.3662)
Proportion of members with
upper-secondary degree
-5.4687*** 1.5165*** -3.5958*** -6.0910*** 6.7756*** 7.3905***
(0.9314) (0.5373) (0.6314) (1.2333) (1.0226) (0.9460)
Proportion of member with
college/university
-23.087*** -4.7298*** -5.9002*** 33.9471*** -3.6467*** 4.7626***
(0.8420) (0.4844) (0.5713) (1.1120) (0.9217) (0.8507)
Crop land area (1000 m2) 3.0587*** 0.0220 -0.1702*** -1.5562*** -0.7945*** -0.5938***
(0.0544) (0.0306) (0.0372) (0.0704) (0.0582) (0.0532)
Per capita living area (m2) -0.0472*** 0.0185** 0.0290*** -0.3512*** 0.1225*** 0.2387***
(0.0134) (0.0077) (0.0091) (0.0178) (0.0147) (0.0136)
Commune with road
passable all 12 months
-2.9237*** 0.3536 -3.0723*** 3.6056*** 2.7178*** 0.4043
(0.4397) (0.2322) (0.3080) (0.5351) (0.4391) (0.3871)
Commune with irrigation
system
1.0568*** 0.7425*** -0.6966*** -0.7125 -0.2742 -0.2192
(0.3780) (0.1985) (0.2653) (0.4575) (0.3752) (0.3295)
Commune with a market -2.9568*** -1.9457*** -0.6947** 1.5694*** 5.1813*** -0.7336**
(0.3969) (0.2100) (0.2777) (0.4838) (0.3971) (0.3499)
Commune with firms -1.7585*** -0.8741*** -0.3546 2.6472*** 1.5408*** -0.7283**
(0.3687) (0.1955) (0.2579) (0.4504) (0.3698) (0.3268)
Year 2006 -0.4155 -0.0006 0.1325 3.9929*** 0.9979** -4.8894***
(0.4065) (0.2383) (0.2742) (0.5465) (0.4541) (0.4242)
Year 2008 -0.4376 -0.6194*** -0.4541* 3.7570*** -0.2529 -2.3295***
(0.4075) (0.2388) (0.2748) (0.5478) (0.4551) (0.4249)
Year 2010 1.3699** -1.5810*** -0.3926 9.5463*** -0.5357 -8.5595***
(0.5677) (0.2898) (0.4096) (0.6680) (0.5476) (0.4841)
Constant 21.792*** 8.2061*** 9.9030*** 21.682*** 14.918*** 22.136***
(1.0668) (0.5952) (0.7349) (1.3679) (1.1304) (1.0307)
Observations 27,404 27,404 27,407 27,404 27,407 27,404
R-squared 0.145 0.0118 0.0126 0.122 0.0339 0.268
Number of communes 4,629 4,629 4,629 4,629 4,629 4,629
Note: The income share is measure in percent. „Other farm income‟ includes income from aquaculture, forestry,
hunting and agriculture services.
Note: *** p<0.01, ** p<0.05, * p<0.1
Robust standard errors are in parentheses.
Source: Authors‟ estimation from the VHLSSs 2004, 2006, 2008 and 2010.
5.2. Resilience to disasters
To examine which household and commune variables can help household mitigate the
adverse effect of disasters, we include the interactions between disasters and household
21
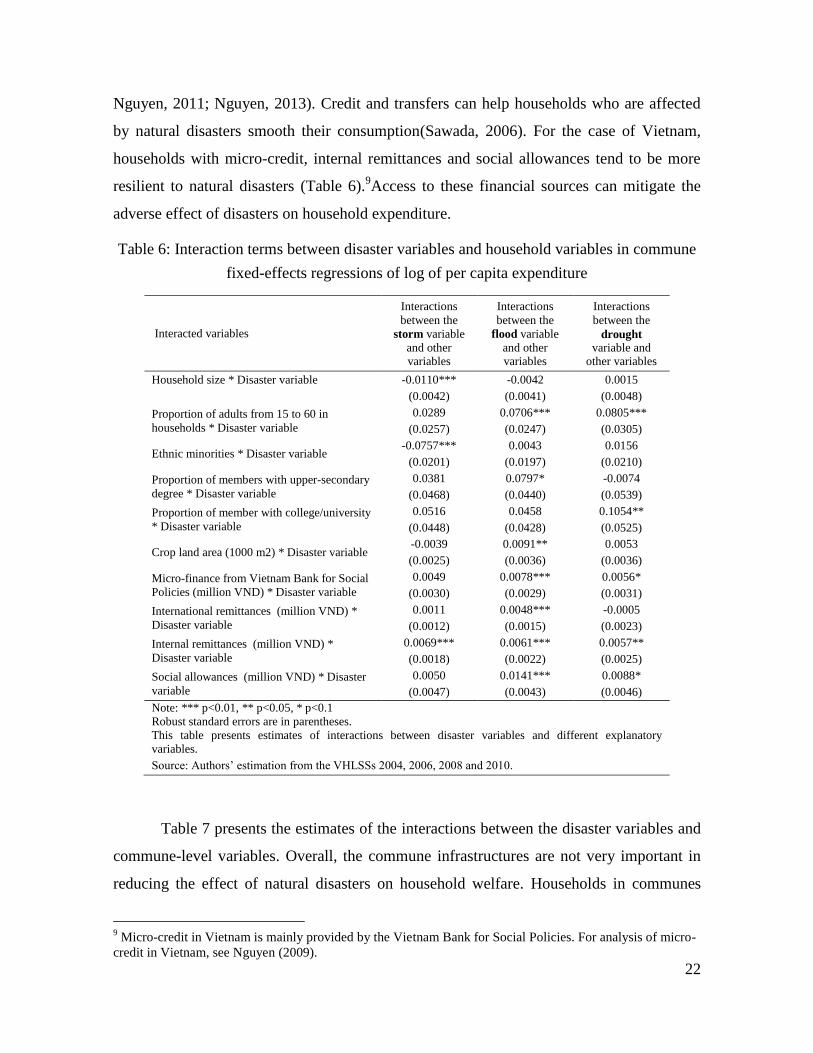
variables in the regressions of log of per capita expenditure. In this section we use
consumption expenditure instead of income as the dependent variable, since consumption
expenditure is widely used as an aggregate indicator of household welfare and expenditure
data contain less measurement errors than income data.
In each regression, we include only one interaction between a disaster variable and
an interacted variable. We also control for other disaster variables and explanatory
variables (as presented in the large model in Tables 4 and 5). We do not include all
interaction terms and the interacted variables in one regression, since it can result in the
multicollinearity problem and high standard errors of these interactions. In Table 6, we
present only the estimated coefficient of the interactions. For example, the estimate -0.0110
in the upper-left cell of Table 6 is the estimated coefficient of the interaction between
household size and the storm variable in the regression of log of per capita expenditure.
There are three disaster variables which are interacted in turn with ten household-level
variables. Thus there are 30 regressions, and the estimated coefficients of 30 interactions
are presented in Table 6.
The effect of storms tends to be higher for households with larger size. This implies
that households with a smaller number of members are more resilient to storm. However,
the effect of floods and droughts does not vary significantly across households with
different household size. Households with a higher proportion of working-age members are
more resilient to disasters. This finding is as our expectation since households who suffer
from adverse shocks tend to increase labor supply to mitigate the income and consumption
loss (Kochar, 1999; Rose, 2001).
Ethnic minorities are more vulnerable to storms than Kinh/Hoa. Possibly, ethnic
minority households face more credit constraints and have fewer assets to smooth
consumptions. Households with high education are less affected by floods and droughts
than those with low education. Households with larger croplands tend to more resilient to
droughts but not storms and floods.
Micro-credit and transfers are very important for household to increase income and
consumption. In Vietnam, several studies find positive effects of micro-credit and transfers
on household welfare (e.g., Quach and Mullineux, 2007;Nguyen, 2008; Van den Berg and
22
Nguyen, 2011; Nguyen, 2013). Credit and transfers can help households who are affected
by natural disasters smooth their consumption(Sawada, 2006). For the case of Vietnam,
households with micro-credit, internal remittances and social allowances tend to be more
resilient to natural disasters (Table 6).9Access to these financial sources can mitigate the
adverse effect of disasters on household expenditure.
Table 6: Interaction terms between disaster variables and household variables in commune
fixed-effects regressions of log of per capita expenditure
Interacted variables
Interactions
between the
storm variable
and other variables
Interactions
between the
flood variable
and other variables
Interactions
between the
drought variable and
other variables
Household size * Disaster variable -0.0110*** -0.0042 0.0015
(0.0042) (0.0041) (0.0048)
Proportion of adults from 15 to 60 in
households * Disaster variable
0.0289 0.0706*** 0.0805***
(0.0257) (0.0247) (0.0305)
Ethnic minorities * Disaster variable -0.0757*** 0.0043 0.0156
(0.0201) (0.0197) (0.0210)
Proportion of members with upper-secondary
degree * Disaster variable
0.0381 0.0797* -0.0074
(0.0468) (0.0440) (0.0539)
Proportion of member with college/university
* Disaster variable
0.0516 0.0458 0.1054**
(0.0448) (0.0428) (0.0525)
Crop land area (1000 m2) * Disaster variable -0.0039 0.0091** 0.0053
(0.0025) (0.0036) (0.0036)
Micro-finance from Vietnam Bank for Social
Policies (million VND) * Disaster variable
0.0049 0.0078*** 0.0056*
(0.0030) (0.0029) (0.0031)
International remittances (million VND) *
Disaster variable
0.0011 0.0048*** -0.0005
(0.0012) (0.0015) (0.0023)
Internal remittances (million VND) *
Disaster variable
0.0069*** 0.0061*** 0.0057**
(0.0018) (0.0022) (0.0025)
Social allowances (million VND) * Disaster
variable
0.0050 0.0141*** 0.0088*
(0.0047) (0.0043) (0.0046)
Note: *** p<0.01, ** p<0.05, * p<0.1
Robust standard errors are in parentheses.
This table presents estimates of interactions between disaster variables and different explanatory
variables.
Source: Authors‟ estimation from the VHLSSs 2004, 2006, 2008 and 2010.
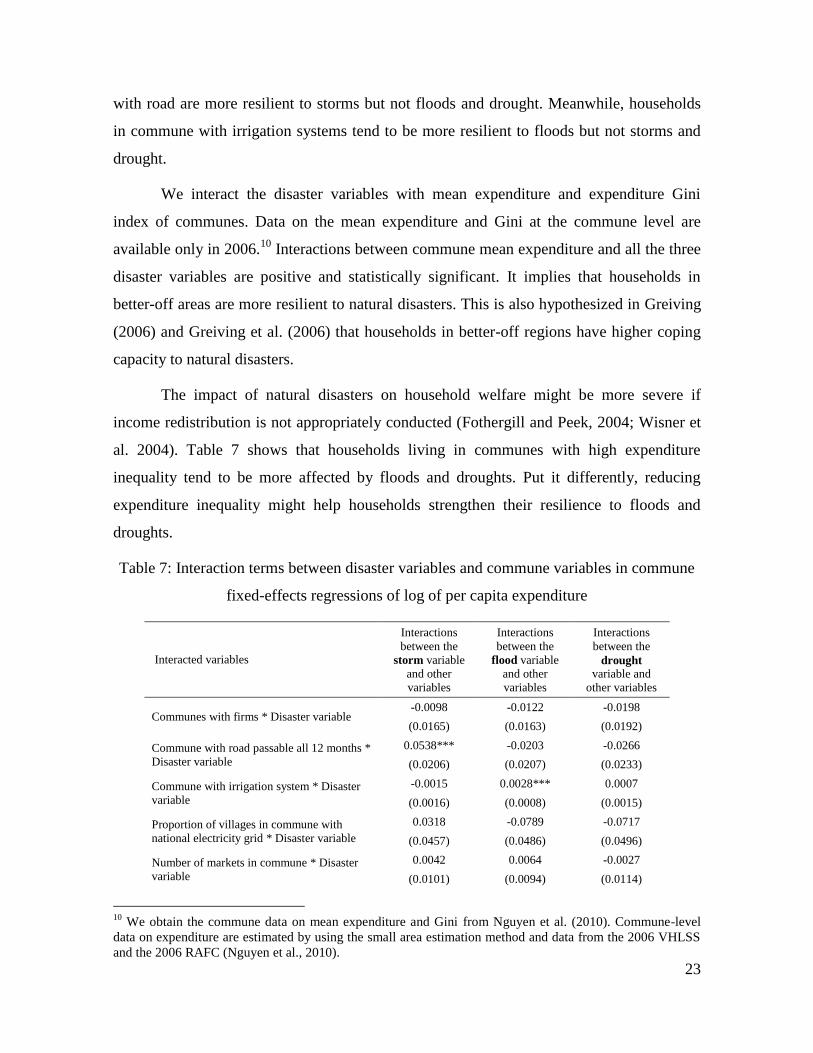
Table 7 presents the estimates of the interactions between the disaster variables and
commune-level variables. Overall, the commune infrastructures are not very important in
reducing the effect of natural disasters on household welfare. Households in communes
9 Micro-credit in Vietnam is mainly provided by the Vietnam Bank for Social Policies. For analysis of micro-
credit in Vietnam, see Nguyen (2009).
23
with road are more resilient to storms but not floods and drought. Meanwhile, households
in commune with irrigation systems tend to be more resilient to floods but not storms and
drought.
We interact the disaster variables with mean expenditure and expenditure Gini
index of communes. Data on the mean expenditure and Gini at the commune level are
available only in 2006.10
Interactions between commune mean expenditure and all the three
disaster variables are positive and statistically significant. It implies that households in
better-off areas are more resilient to natural disasters. This is also hypothesized in Greiving
(2006) and Greiving et al. (2006) that households in better-off regions have higher coping
capacity to natural disasters.
The impact of natural disasters on household welfare might be more severe if
income redistribution is not appropriately conducted (Fothergill and Peek, 2004; Wisner et
al. 2004). Table 7 shows that households living in communes with high expenditure
inequality tend to be more affected by floods and droughts. Put it differently, reducing
expenditure inequality might help households strengthen their resilience to floods and
droughts.
Table 7: Interaction terms between disaster variables and commune variables in commune
fixed-effects regressions of log of per capita expenditure
Interacted variables
Interactions
between the
storm variable
and other
variables
Interactions
between the
flood variable
and other
variables
Interactions
between the
drought variable and
other variables
Communes with firms * Disaster variable -0.0098 -0.0122 -0.0198
(0.0165) (0.0163) (0.0192)
Commune with road passable all 12 months *
Disaster variable
0.0538*** -0.0203 -0.0266
(0.0206) (0.0207) (0.0233)
Commune with irrigation system * Disaster
variable
-0.0015 0.0028*** 0.0007
(0.0016) (0.0008) (0.0015)
Proportion of villages in commune with
national electricity grid * Disaster variable
0.0318 -0.0789 -0.0717
(0.0457) (0.0486) (0.0496)
Number of markets in commune * Disaster
variable
0.0042 0.0064 -0.0027
(0.0101) (0.0094) (0.0114)
10
We obtain the commune data on mean expenditure and Gini from Nguyen et al. (2010). Commune-level
data on expenditure are estimated by using the small area estimation method and data from the 2006 VHLSS
and the 2006 RAFC (Nguyen et al., 2010).
24
Interacted variables
Interactions
between the
storm variable
and other variables
Interactions
between the
flood variable
and other variables
Interactions
between the
drought variable and
other variables
Population of commune (thousand VND) *
Disaster variable
0.0028 -0.0009 -0.0038
(0.0021) (0.0022) (0.0026)
Mean per capita expenditure of commune (million VND) * Disaster variable
0.0244*** 0.0143** 0.0094*
(0.0074) (0.0064) (0.0051)
Gini index of per capita expenditure of
commune (million VND) * Disaster variable
-0.0575 -0.5583** -0.7618***
(0.2536) (0.2707) (0.2796)
Note: *** p<0.01, ** p<0.05, * p<0.1
Robust standard errors are in parentheses.
This table presents estimates of interactions between disaster variables and different explanatory
variables.
Source: Authors‟ estimation from the VHLSSs 2004, 2006, 2008 and 2010.
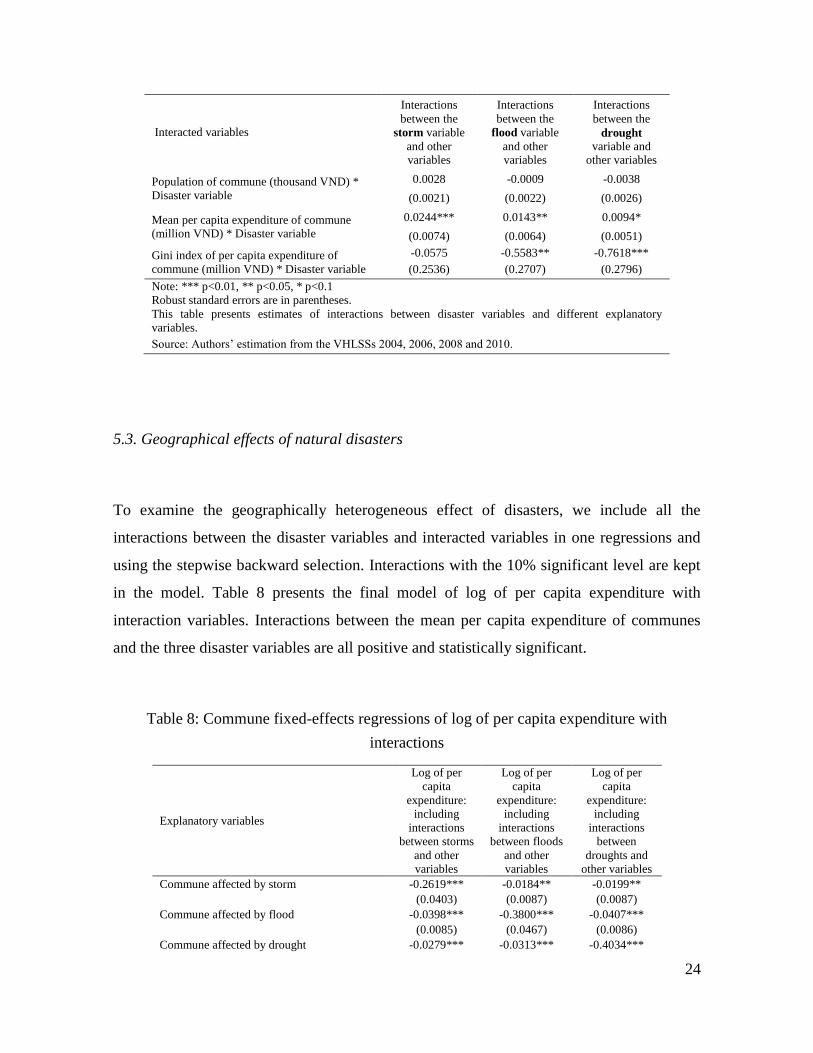
5.3. Geographical effects of natural disasters
To examine the geographically heterogeneous effect of disasters, we include all the
interactions between the disaster variables and interacted variables in one regressions and
using the stepwise backward selection. Interactions with the 10% significant level are kept
in the model. Table 8 presents the final model of log of per capita expenditure with
interaction variables. Interactions between the mean per capita expenditure of communes
and the three disaster variables are all positive and statistically significant.
Table 8: Commune fixed-effects regressions of log of per capita expenditure with
interactions
Explanatory variables
Log of per
capita
expenditure:
including
interactions
between storms
and other
variables
Log of per
capita
expenditure:
including
interactions
between floods
and other
variables
Log of per
capita
expenditure:
including
interactions
between
droughts and
other variables
Commune affected by storm -0.2619*** -0.0184** -0.0199**
(0.0403) (0.0087) (0.0087)
Commune affected by flood -0.0398*** -0.3800*** -0.0407***
(0.0085) (0.0467) (0.0086)
Commune affected by drought -0.0279*** -0.0313*** -0.4034***
25
Explanatory variables
Log of per
capita
expenditure:
including
interactions
between storms
and other
variables
Log of per
capita
expenditure:
including
interactions
between floods
and other
variables
Log of per
capita
expenditure:
including
interactions
between
droughts and
other variables
(0.0104) (0.0104) (0.0504)
Proportion of adults from 15 to 60 *
Commune affected by flood
0.0691***
(0.0256)
Ethnic minorities * Commune affected by
flood
0.0904***
(0.0248)
Crop land area (1000 m2) * Commune
affected by flood
0.0097**
(0.0039)
Population of commune (thousand VND) *
Commune affected by flood
0.0042*
(0.0023)
Population of commune (thousand VND) *
Commune affected by flood
0.0582***
(0.0104)
Household size * Commune affected by storm -0.0077*
(0.0044)
Crop land area (1000 m2) * Commune
affected by storm
-0.0043*
(0.0026)
Commune with road passable all 12 months *
Commune affected by storm
0.0488**
(0.0202)
Population of commune (thousand VND) *
Commune affected by storm
0.0578***
(0.0077)
Proportion of adults from 15 to 60 *
Commune affected by drought
0.0677**
(0.0316)
Ethnic minorities * Commune affected by
drought
0.0762***
(0.0257)
Crop land area (1000 m2) * Commune
affected by drought
0.0130***
(0.0045)
Population of commune (thousand VND) *
Commune affected by drought
0.0617***
(0.0105)
Control variables Yes Yes Yes
Constant 7.7083*** 7.7245*** 7.7176***
(0.0218) (0.0218) (0.0217)
Observations 27,404 27,404 27,407
R-squared 0.352 0.351 0.352
Number of communes 4,629 4,629 4,629
Note: *** p<0.01, ** p<0.05, * p<0.1
Robust standard errors are in parentheses.
Source: Authors‟ estimation from the VHLSSs 2004, 2006, 2008 and 2010.
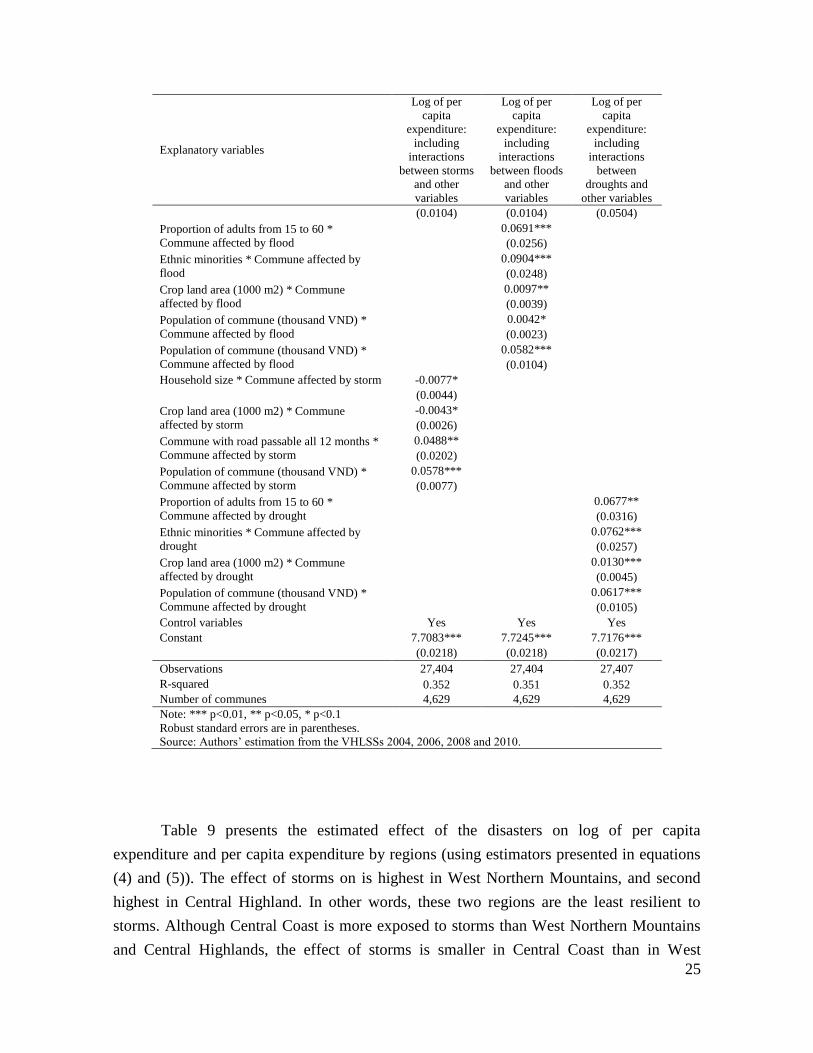
Table 9 presents the estimated effect of the disasters on log of per capita
expenditure and per capita expenditure by regions (using estimators presented in equations
(4) and (5)). The effect of storms on is highest in West Northern Mountains, and second
highest in Central Highland. In other words, these two regions are the least resilient to
storms. Although Central Coast is more exposed to storms than West Northern Mountains
and Central Highlands, the effect of storms is smaller in Central Coast than in West
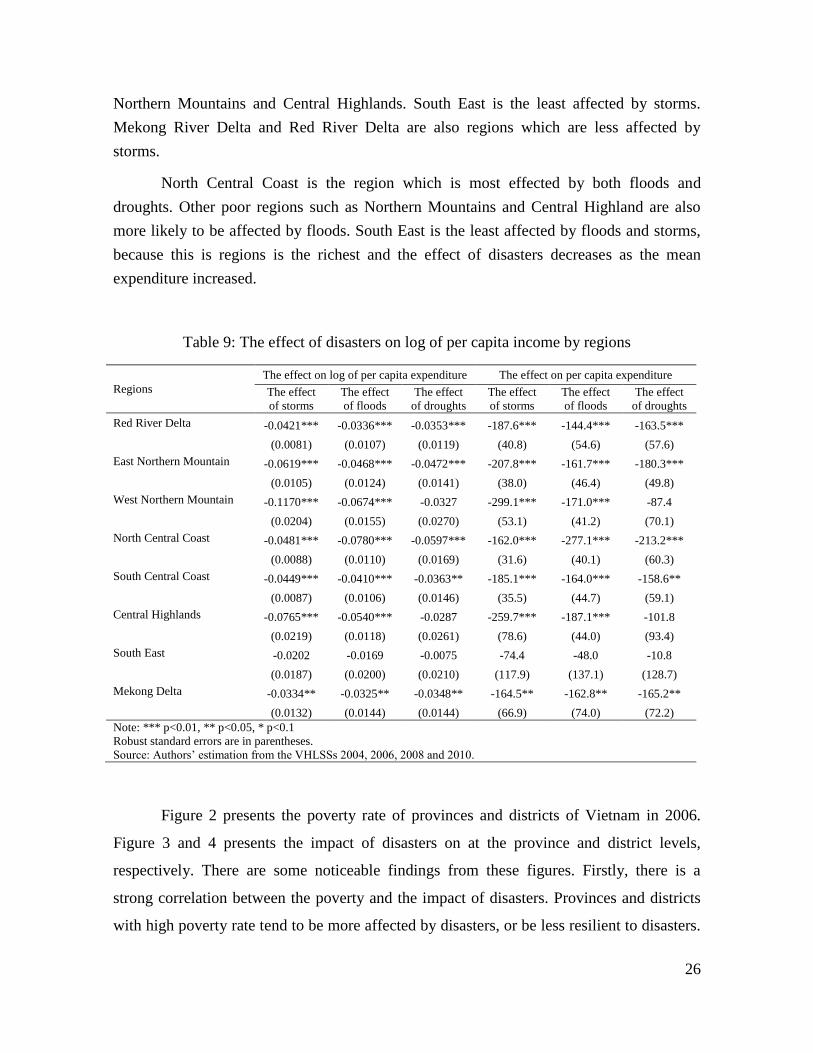
26
Northern Mountains and Central Highlands. South East is the least affected by storms.
Mekong River Delta and Red River Delta are also regions which are less affected by
storms.
North Central Coast is the region which is most effected by both floods and
droughts. Other poor regions such as Northern Mountains and Central Highland are also
more likely to be affected by floods. South East is the least affected by floods and storms,
because this is regions is the richest and the effect of disasters decreases as the mean
expenditure increased.
Table 9: The effect of disasters on log of per capita income by regions
Regions
The effect on log of per capita expenditure The effect on per capita expenditure
The effect
of storms
The effect
of floods
The effect
of droughts
The effect
of storms
The effect
of floods
The effect
of droughts
Red River Delta -0.0421*** -0.0336*** -0.0353*** -187.6*** -144.4*** -163.5***
(0.0081) (0.0107) (0.0119) (40.8) (54.6) (57.6)
East Northern Mountain -0.0619*** -0.0468*** -0.0472*** -207.8*** -161.7*** -180.3***
(0.0105) (0.0124) (0.0141) (38.0) (46.4) (49.8)
West Northern Mountain -0.1170*** -0.0674*** -0.0327 -299.1*** -171.0*** -87.4
(0.0204) (0.0155) (0.0270) (53.1) (41.2) (70.1)
North Central Coast -0.0481*** -0.0780*** -0.0597*** -162.0*** -277.1*** -213.2***
(0.0088) (0.0110) (0.0169) (31.6) (40.1) (60.3)
South Central Coast -0.0449*** -0.0410*** -0.0363** -185.1*** -164.0*** -158.6**
(0.0087) (0.0106) (0.0146) (35.5) (44.7) (59.1)
Central Highlands -0.0765*** -0.0540*** -0.0287 -259.7*** -187.1*** -101.8
(0.0219) (0.0118) (0.0261) (78.6) (44.0) (93.4)
South East -0.0202 -0.0169 -0.0075 -74.4 -48.0 -10.8
(0.0187) (0.0200) (0.0210) (117.9) (137.1) (128.7)
Mekong Delta -0.0334** -0.0325** -0.0348** -164.5** -162.8** -165.2**
(0.0132) (0.0144) (0.0144) (66.9) (74.0) (72.2)
Note: *** p<0.01, ** p<0.05, * p<0.1
Robust standard errors are in parentheses.
Source: Authors‟ estimation from the VHLSSs 2004, 2006, 2008 and 2010.
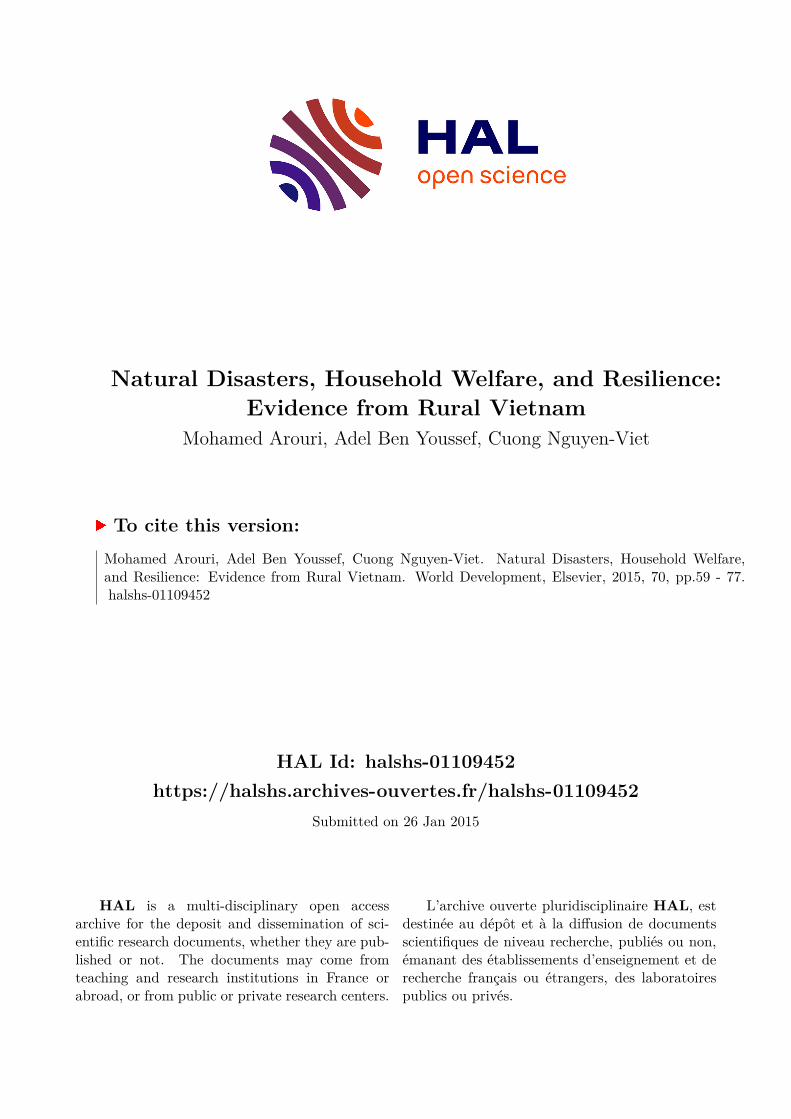
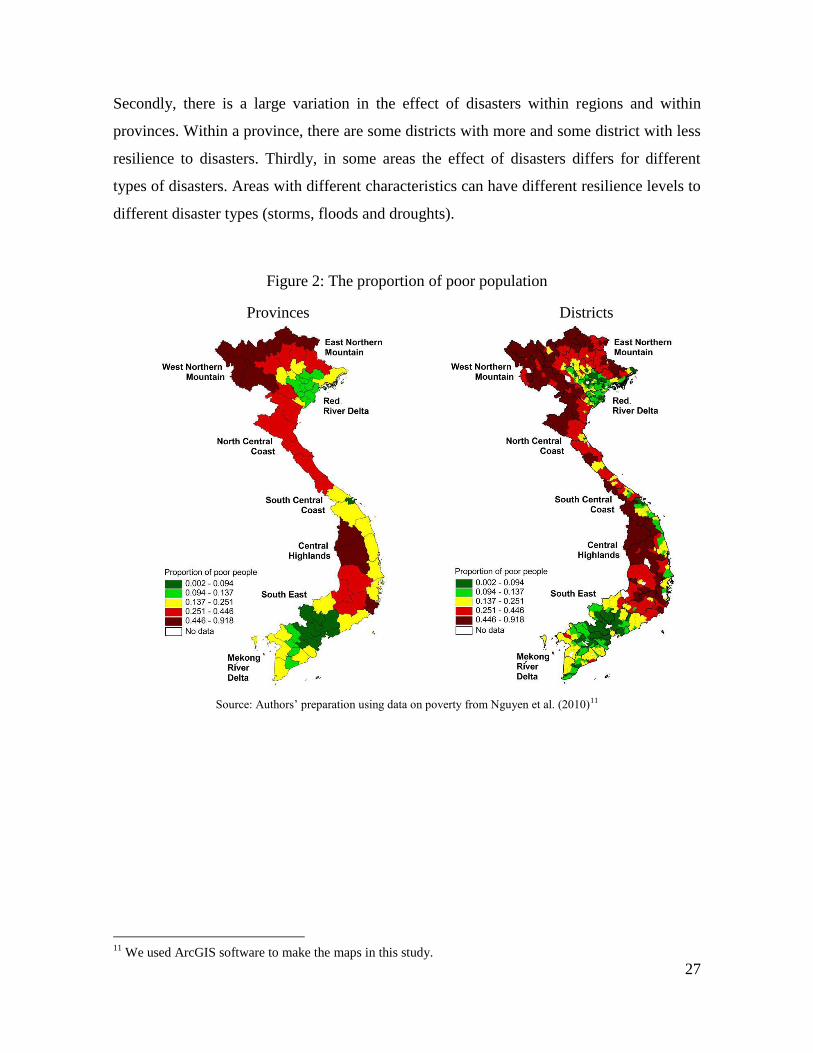
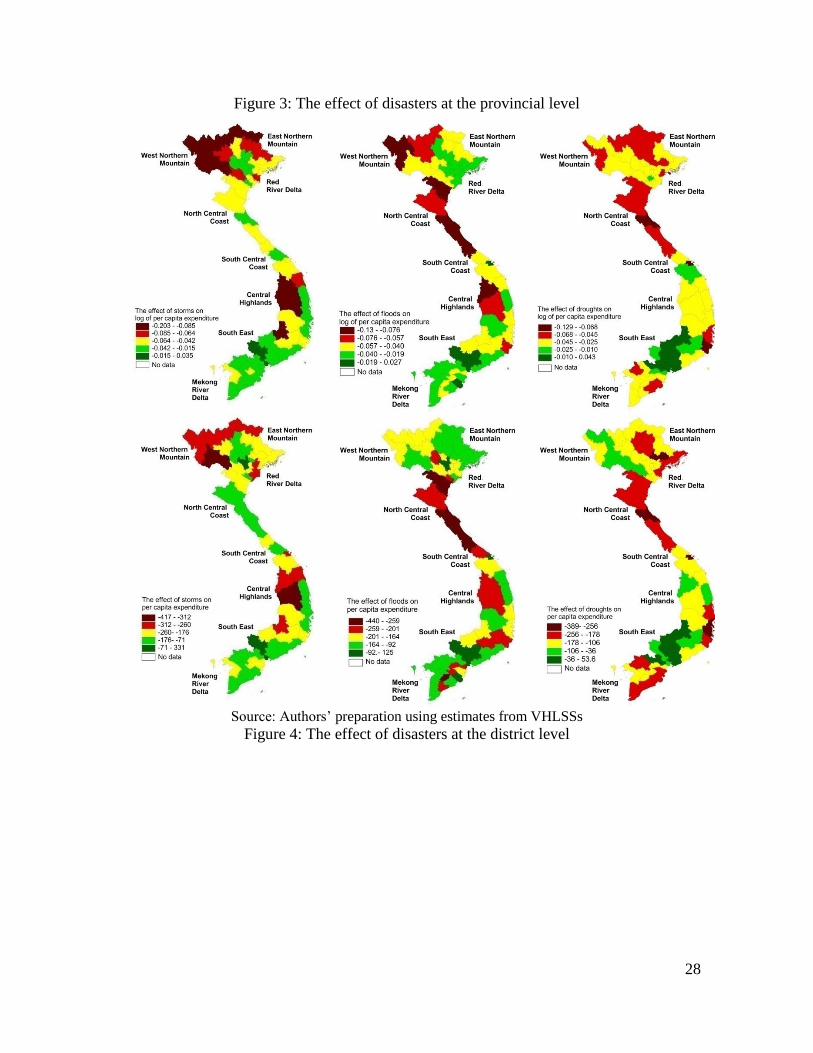
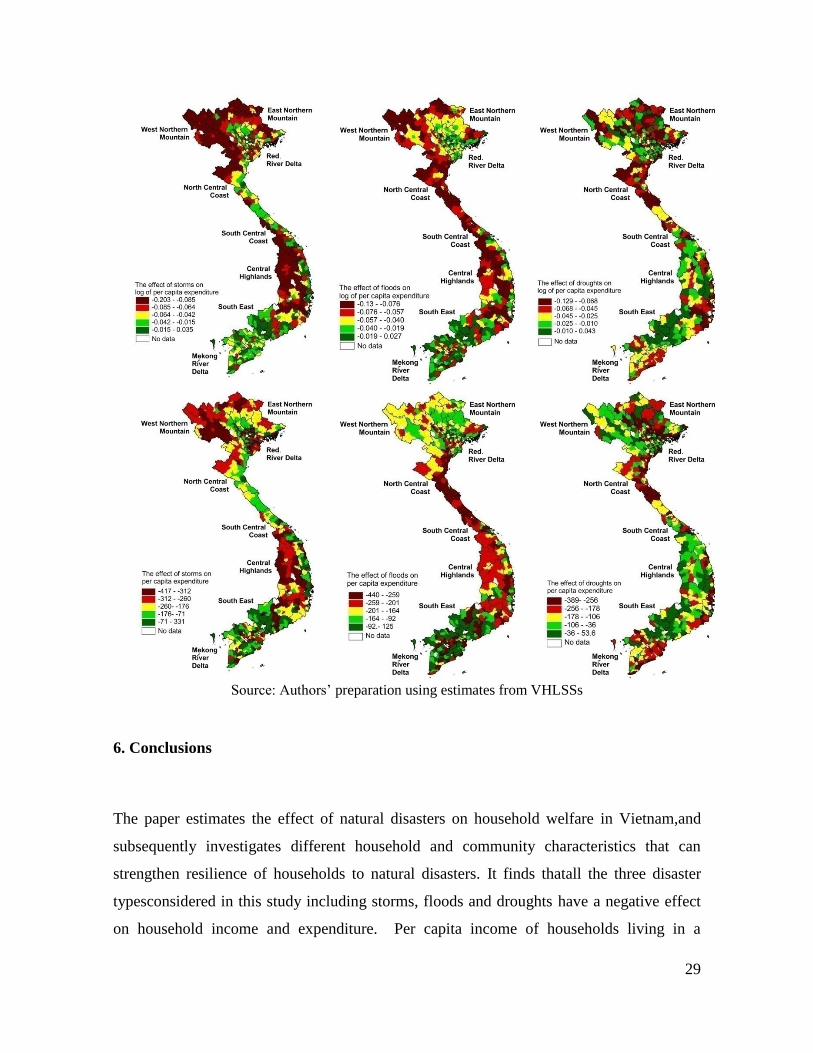
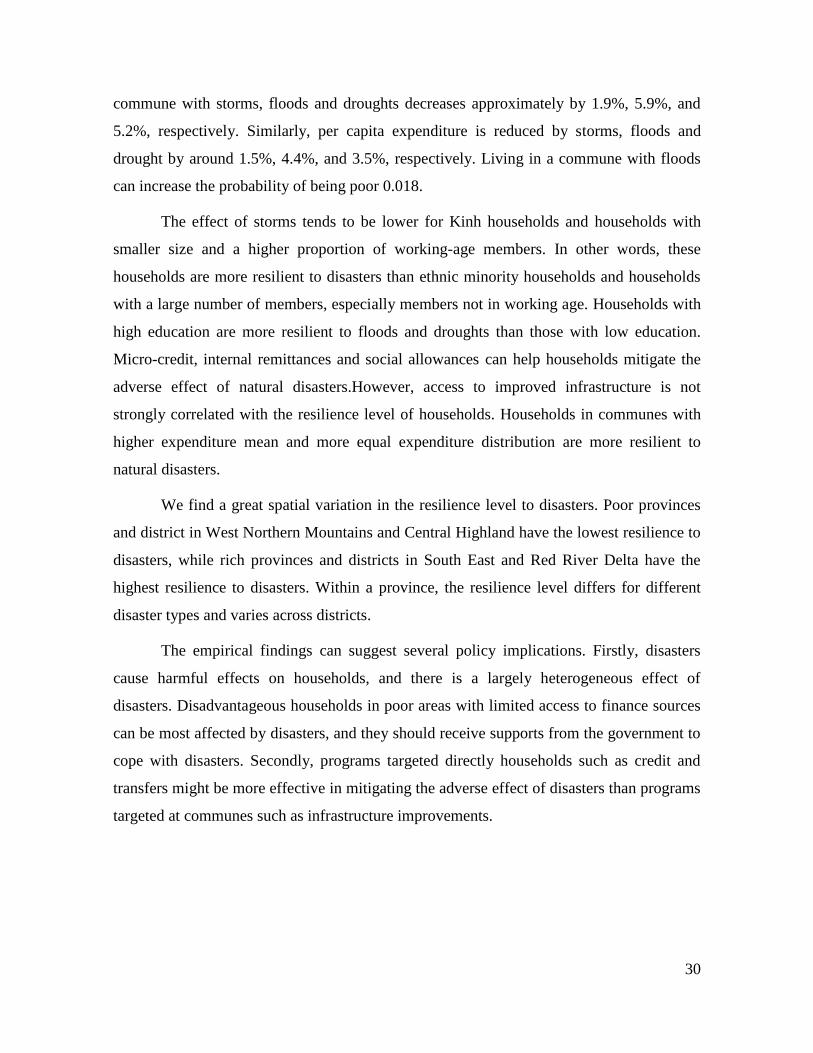
Figure 2 presents the poverty rate of provinces and districts of Vietnam in 2006.
Figure 3 and 4 presents the impact of disasters on at the province and district levels,
respectively. There are some noticeable findings from these figures. Firstly, there is a
strong correlation between the poverty and the impact of disasters. Provinces and districts
with high poverty rate tend to be more affected by disasters, or be less resilient to disasters.
27
Secondly, there is a large variation in the effect of disasters within regions and within
provinces. Within a province, there are some districts with more and some district with less
resilience to disasters. Thirdly, in some areas the effect of disasters differs for different
types of disasters. Areas with different characteristics can have different resilience levels to
different disaster types (storms, floods and droughts).
Figure 2: The proportion of poor population
Provinces Districts
Source: Authors‟ preparation using data on poverty from Nguyen et al. (2010)11
11
We used ArcGIS software to make the maps in this study.
28
Figure 3: The effect of disasters at the provincial level
Source: Authors‟ preparation using estimates from VHLSSs
Figure 4: The effect of disasters at the district level
29
Source: Authors‟ preparation using estimates from VHLSSs
6. Conclusions
The paper estimates the effect of natural disasters on household welfare in Vietnam,and
subsequently investigates different household and community characteristics that can
strengthen resilience of households to natural disasters. It finds thatall the three disaster
typesconsidered in this study including storms, floods and droughts have a negative effect
on household income and expenditure. Per capita income of households living in a
30
commune with storms, floods and droughts decreases approximately by 1.9%, 5.9%, and
5.2%, respectively. Similarly, per capita expenditure is reduced by storms, floods and
drought by around 1.5%, 4.4%, and 3.5%, respectively. Living in a commune with floods
can increase the probability of being poor 0.018.
The effect of storms tends to be lower for Kinh households and households with
smaller size and a higher proportion of working-age members. In other words, these
households are more resilient to disasters than ethnic minority households and households
with a large number of members, especially members not in working age. Households with
high education are more resilient to floods and droughts than those with low education.
Micro-credit, internal remittances and social allowances can help households mitigate the
adverse effect of natural disasters.However, access to improved infrastructure is not
strongly correlated with the resilience level of households. Households in communes with
higher expenditure mean and more equal expenditure distribution are more resilient to
natural disasters.
We find a great spatial variation in the resilience level to disasters. Poor provinces
and district in West Northern Mountains and Central Highland have the lowest resilience to
disasters, while rich provinces and districts in South East and Red River Delta have the
highest resilience to disasters. Within a province, the resilience level differs for different
disaster types and varies across districts.
The empirical findings can suggest several policy implications. Firstly, disasters
cause harmful effects on households, and there is a largely heterogeneous effect of
disasters. Disadvantageous households in poor areas with limited access to finance sources
can be most affected by disasters, and they should receive supports from the government to
cope with disasters. Secondly, programs targeted directly households such as credit and
transfers might be more effective in mitigating the adverse effect of disasters than programs
targeted at communes such as infrastructure improvements.
31
References
Angrist J. and J. S. Pischke (2008). Mostly Harmless Econometrics: An Empiricist's
Companion. Princeton University Press.
Benson, C. (1997), “The economic impact of natural disasters in Vietnam”, Research
Report.
Briguglio, L., Cordina, G., Farrugia, N., and Vella, S. (2009) “Economic vulnerability and
resilience: concepts and measurements”, Oxford Development Studies, 37(3), 229-247.
Bruneau, M., Chang, S., Eguchi, R., Lee, G., O‟Rourke, T., Reinhorn, A., Shinozuka, M.,
Tierney, K., Wallace, W. and von Winterfelt, D. (2003), “A framework to quantitatively
assess and enhance seismic resilience of communities”, Earthquake Spectra, 19, 733-52.
Cannon, T. (2008), “Reducing people‟s vulnerability to natural hazards: communities and
resilience”, Research Paper No. 2008/34, UNU World Institute for Development
Economics Research.
Chaudry, P. and G. Ruysschaert (2007): “Climate change and human development in
Vietnam: A case study”, Human Development Report 2007/2008 Occasional Paper, UNDP.
Clark, G. E., S. C. Moser, S. J. Ratick, K. Dow, W. B. Meyer, S. Emani, W. Jin, J. X.
Kasperson, R. E. Kasperson and H. E. Schwarz, (1998), Assessing the vulnerability of
coastal communities to extreme storms: the case of Revere, MA., USA, Mitigation and
Adaptation Strategies for Global Change 3, 59-82.
Cochrane H. C. (1975), “Natural hazards and their distributive effects: a research
assessment”. Monograph NSF-RA-E-75-003, Institute of Behavioral Science, University of
Colorado, Boulder.
Dasgupta, S., B. Laplante, C. Meisner, D. Wheeler, J. Yan (2009), “The impact of sea level
rise on developing countries: a comparative analysis”, Climatic Change, 93(3-4), 379-388.
Davies, M., Christophe Béné, Alexander Arnall, Thomas Tanner, Andrew Newsham and
Cristina Coirolo (2013), “Promoting Resilient Livelihoods through Adaptive Social
Protection: Lessons from 124 programmes in South Asia”, Development Policy Review,
31(1): 27-58.
Deaton, A., (1997), The Analysis of Household Surveys, the Johns Hopkins University
Press, Baltimore, Maryland, U.S.A.
Elbers, C., Lanjouw, J. and Lanjouw, P., (2002), Micro-Level estimation of welfare. Policy
Research Working Paper No. WPS 2911. The World Bank.
Elbers, C., Lanjouw, J. and Lanjouw, P., (2003), Micro-level estimation of poverty and
inequality, Econometrica, 71(1), 355-364.
Fothergill, A. and L. A. Peek, (2004), Poverty and disasters in the United States: A review
of recent sociological findings, Natural Hazards 32, 89-110.
Gaiha, R., K. Hill, G. Thapa, (2010), Natural disasters in South Asia. ASARC Working
Paper 2010/06.
32
Glewwe, P (1991). “Investigating the determinants of household welfare in Cote d'Ivoire.”
Journal of Development Economics 35, 307-37.
Greiving, S. (2006). Integrated risk assessment of multi-hazards: a new methodology. Pp.
75–81 of: Schmidt-Thomé, Philipp (ed), Natural and Technological Hazards and Risks
Affecting the Spatial Development of European Regions, vol. 42. Geological Survey of
Finland.
Greiving, S., Fleischhauer, F.and J. Lückenkötter (2006), “Methodology for an integrated
risk assessment of spatially relevant hazards”, Journal of Environmental Planning and
Management, 49(1), 1-19.
Guha-Sapir, D., (2011), EMDAT and trends in Natural Disasters. CRED, Louvain School
of Medicine Brussels. Venice, 2011.
Guha-Sapir, D., D. Hargitt and P. Hoyois, (2004), Thirty Years of Natural Disasters 1974-
2003: The Numbers (PUL, Lovain-la-Neuve).
Haen, H., and G. Hemrich, (2006). The Economics of Natural Disasters – Implications and
Challenges for Food Security.
Heckman, J., R. Lalonde and J. Smith (1999). “The economics and econometrics of active
labor market programs”, in A. Ashenfelter and D. Card (eds.), Handbook of Labor
Economics1999, vol. 3. Elsevier Science.
Hentschel, J., Lanjouw, J., Lanjouw, P. and Poggi, J., (2000), “Combining census and
survey data to trace the spatial dimensions of poverty: a case study of Ecuador”, World
Bank Economic Review, 14(1), 147-65.
Holling, C. (1973), “Resiliency and stability of ecological systems”, Annual Review of
Ecological Systems, 4, 1-24.
Imai, K. and R. Gaiha, (2007), Poverty, inequality and ethnic minorities in Vietnam,
Brooks World Poverty Institute, Working Paper No 10.
IPCC (2007), Climate Change 2007. Impacts, adaptation, and vulnerability. Contribution of
Working Group II to the Fourth Assessment Report of the Intergovernmental Panel of
Climate Change, Cambridge University Press.
Kaplan, D., (2010). Natural disasters and differential household effects: Evidence from the
May 2006 Java Earthquake.
Kinsey, B., K. Burger, and J.W. Gunning (1998), Coping with drought in Zimbabwe:
Survey evidence on responses of rural households to risk. World Development 26(1): 89-
110
Kochar, A. (1999), Smoothing Consumption by smoothing income: hours-of-work
responses to idiosyncratic agricultural shocks in Rural India. Review of Economics and
Statistics, 81(1): 50-61.
Kurosaki T., (2010), „Vulnerability of Household Consumption to Natural Disasters in
Rural Pakistan‟
Ludwig, F., van Scheltinga, C., Verhagen, J., Kruijt, B., Van Ierland, E., Dellink, R., De
Bruin, K., De Bruin, K., and Kabat, P. (2007), Climate change impacts on developing
countries – EU accountability. IP/A/ENVI/ST/2007-04.
33
Masozera, M., M. Bailey and C. Kerchner (2007), Distribution of impacts of natural
disasters across income groups: A case study of New Orleans, Ecological Economics 63,
299-306.
Minot, N., B. Baulch and M. Epprecht, (2006), Poverty and inequality in Vietnam: spatial
patterns and geographic determinants, International Food Policy Research Institute,
Reseach report No 148.
Morduch, J. (1995) Income smoothing and consumption smoothing, Journal of Economic
Perspectives 9(3): 103-114
Narsey Lal, P., Singh, R. and Holland P. (2009), “Relationship between natural disasters
and poverty: a Fiji case study”, International Strategy for Disaster Reduction.
Nguyen V. C., 2013. "The impact of social security on household welfare: evidence from a
transition country, " The European Journal of Development Research, Palgrave Macmillan,
vol. 25(5), pages 737-757, December.
Nguyen, C. (2011), “Poverty projection using a small area estimation method: evidence
from Vietnam”, Journal of Comparative Economics, Vol. 39(3), 2011, pp. 368-382.
Nguyen, C., Tran, T., and van der Weide R. (2010), “Construction of Poverty Maps using
Agricultural Census in Rural Vietnam”, Asian Economic Journal, Vol. 24(4), 2010, pp.
355-390.
Nguyen, V.C. 2008. “Is a governmental microcredit program for the poor really pro-poor?
evidence from Vietnam.” The Developing Economies, 46(2), 151 – 187.
Noy, I. (2009), The macroeconomic consequences of disasters. Journal of Development
Economics, 88(2); 221-231.
Noy, I. and T. B. Vu, (2010), The economics of natural disasters in a developing country:
The case of Vietnam, Journal of Asian Economics 21, 345-354.
Okuyama, Y., and S. Sahin, (2009), Impact Estimation of Disasters, A Global Aggregate
for 1960 to 2007.
Peacock, W. G., H. Gladwin and B. H. Morrow, (1997). Hurricane Andrew: Ethnicity,
Gender and the Sociology of Disasters (Routledge, New York).
Pelling, M., A. Ozerdem and S. Barakat, (2002), The macro-economic of Disasters.
Progress in Development Studies, 2-4, 2002.
Perrings, C. (2001), “Resilience and sustainability”, in Folmer, H., Gabel, H.L., Gerking, S.
and Rose, A. (Eds), Frontiers of EnvironmentalEconomics, Edward Elgar, Cheltenham.
Phung, D. T. and Nguyen, P., (2008), Vietnam Household Living Standard Survey
(VHLSS) 2002 and 2004: Basic Information. In: Nguyen, N and Hansen, H., ed. 2007.
Market, Policy and Poverty reduction in Vietnam. Hanoi: Vietnam Culture and Information
Publishing House.
Quach, M. H. and A. W. Mullineux (2007), “The impact of access to credit on household
welfare in rural Vietnam.” Research In Accounting In Emerging Economies Vol. 7, pp:
279–307.
34
Rodriguez-Oreggia, E., A. D. L. Fuente, R. D. L. Torre and H. A. Moreno, (2012), “Natural
disasters, human development and poverty at the municipal level in Mexico”, The Journal
of Development Studies 49:3, 442-455.
Rose, A. (2004), “Defining and measuring economic resilience to disasters”, Disaster
Prevention and Management, 13(4), 307-314
Rose, E. (2001) Ex ante and ex post labor supply response to risk in a low-income
area.Journal of Development Economics, 64(2), 371-388.
Rosenzweig, Mark, and Hans, Binswanger, (1993). Wealth, weather risk, and the
composition and profitability of agricultural investments, Economic Journal, 103‐416:
56‐78.
Sawada, Y. (2006), “The Impact of Natural and Manmade Disaster on Household Welfare”,
Discussion Paper 148, Graduate School of International Development, Nagoya University,
Japan.
Skidmore M., Toya H., 2002. „Do natural disasters promote long-run growth?‟, Economic
Inquiry 40(4), 664-687.
The World Bank (2009).Climate adaptation and development, The World Bank Group,
Washington, DC.
Thomas, T., L. Christiaensen, Q. T. Do and D. T. Le, (2010), Natural disasters and
household welfare: evidence from Vietnam, World Bank Policy Research Working Paper
WPS5491.
Toya, H. and M. Skidmore, (2005), Economic Development and the Impacts of natural
disasters. Working Paper 05-04. University of Wisconsin - Whitewater, September, 2005.
UNISDR, (2009), Global Assessment Report on Disaster Risk Reduction, United Nations
International Strategy for Disaster Reduction Secretariat: Geneva.
Van den Berg, M. (2010), “Household income strategies and natural disasters: Dynamic
livelihoods in rural Nicaragua”, Ecological Economics, Vol. 69(3), 592–602.
Van den Berg, M., and Nguyen V. C., 2011. "Impact of public and private cash transfers on
poverty and inequality: evidence from Vietnam," Development Policy Review, Overseas
Development Institute, vol. 29(6), 689-728.
Wainwright, F. and C. Newman, (2011), Income Shocks and Household Risk-Coping
Strategies: Evidence from rural Vietnam, Institute for International Integration Studies
Discussion paper No.358.
Wisner, B., P. Blaikie, T. Cannon and I. Davis, 2004. At Risk: natural hazards, people’s
vulnerability and disasters (Routledge, New York.).
Wooldridge, J. (2010), Econometric Analysis of Cross Section and Panel Data, Second
edition.
World Bank (2010), Natural Hazards, UnNatural Disasters, The Economics of Effective
Prevention, The World Bank, Washington DC., The USA.
35
Appendix
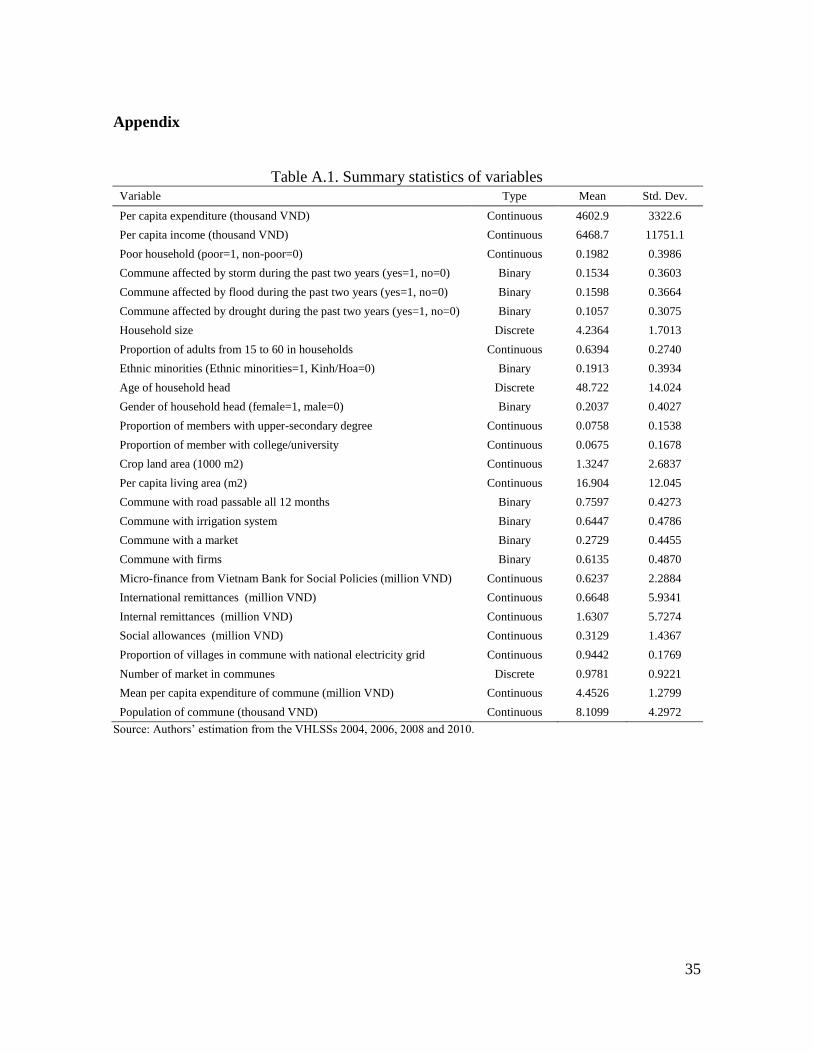
Table A.1. Summary statistics of variables Variable Type Mean Std. Dev.
Per capita expenditure (thousand VND) Continuous 4602.9 3322.6
Per capita income (thousand VND) Continuous 6468.7 11751.1
Poor household (poor=1, non-poor=0) Continuous 0.1982 0.3986
Commune affected by storm during the past two years (yes=1, no=0) Binary 0.1534 0.3603
Commune affected by flood during the past two years (yes=1, no=0) Binary 0.1598 0.3664
Commune affected by drought during the past two years (yes=1, no=0) Binary 0.1057 0.3075
Household size Discrete 4.2364 1.7013
Proportion of adults from 15 to 60 in households Continuous 0.6394 0.2740
Ethnic minorities (Ethnic minorities=1, Kinh/Hoa=0) Binary 0.1913 0.3934
Age of household head Discrete 48.722 14.024
Gender of household head (female=1, male=0) Binary 0.2037 0.4027
Proportion of members with upper-secondary degree Continuous 0.0758 0.1538
Proportion of member with college/university Continuous 0.0675 0.1678
Crop land area (1000 m2) Continuous 1.3247 2.6837
Per capita living area (m2) Continuous 16.904 12.045
Commune with road passable all 12 months Binary 0.7597 0.4273
Commune with irrigation system Binary 0.6447 0.4786
Commune with a market Binary 0.2729 0.4455
Commune with firms Binary 0.6135 0.4870
Micro-finance from Vietnam Bank for Social Policies (million VND) Continuous 0.6237 2.2884
International remittances (million VND) Continuous 0.6648 5.9341
Internal remittances (million VND) Continuous 1.6307 5.7274
Social allowances (million VND) Continuous 0.3129 1.4367
Proportion of villages in commune with national electricity grid Continuous 0.9442 0.1769
Number of market in communes Discrete 0.9781 0.9221
Mean per capita expenditure of commune (million VND) Continuous 4.4526 1.2799
Population of commune (thousand VND) Continuous 8.1099 4.2972
Source: Authors‟ estimation from the VHLSSs 2004, 2006, 2008 and 2010.
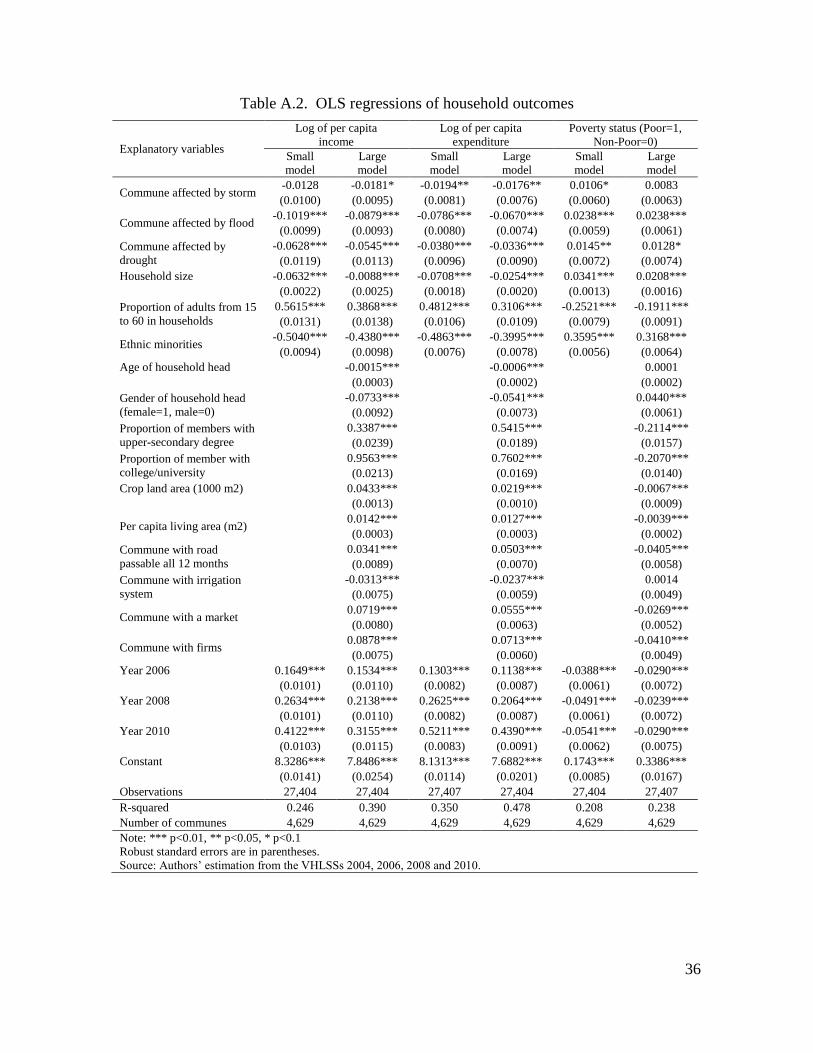
36
Table A.2. OLS regressions of household outcomes
Explanatory variables
Log of per capita
income
Log of per capita
expenditure
Poverty status (Poor=1,
Non-Poor=0)
Small
model
Large
model
Small
model
Large
model
Small
model
Large
model
Commune affected by storm -0.0128 -0.0181* -0.0194** -0.0176** 0.0106* 0.0083
(0.0100) (0.0095) (0.0081) (0.0076) (0.0060) (0.0063)
Commune affected by flood -0.1019*** -0.0879*** -0.0786*** -0.0670*** 0.0238*** 0.0238***
(0.0099) (0.0093) (0.0080) (0.0074) (0.0059) (0.0061)
Commune affected by
drought
-0.0628*** -0.0545*** -0.0380*** -0.0336*** 0.0145** 0.0128*
(0.0119) (0.0113) (0.0096) (0.0090) (0.0072) (0.0074)
Household size -0.0632*** -0.0088*** -0.0708*** -0.0254*** 0.0341*** 0.0208***
(0.0022) (0.0025) (0.0018) (0.0020) (0.0013) (0.0016)
Proportion of adults from 15
to 60 in households
0.5615*** 0.3868*** 0.4812*** 0.3106*** -0.2521*** -0.1911***
(0.0131) (0.0138) (0.0106) (0.0109) (0.0079) (0.0091)
Ethnic minorities -0.5040*** -0.4380*** -0.4863*** -0.3995*** 0.3595*** 0.3168***
(0.0094) (0.0098) (0.0076) (0.0078) (0.0056) (0.0064)
Age of household head
-0.0015*** -0.0006***
0.0001
(0.0003) (0.0002)
(0.0002)
Gender of household head
(female=1, male=0)
-0.0733*** -0.0541***
0.0440***
(0.0092) (0.0073)
(0.0061)
Proportion of members with
upper-secondary degree
0.3387*** 0.5415***
-0.2114***
(0.0239) (0.0189)
(0.0157)
Proportion of member with
college/university
0.9563*** 0.7602***
-0.2070***
(0.0213) (0.0169)
(0.0140)
Crop land area (1000 m2)
0.0433*** 0.0219***
-0.0067***
(0.0013) (0.0010)
(0.0009)
Per capita living area (m2) 0.0142*** 0.0127***
-0.0039***
(0.0003) (0.0003)
(0.0002)
Commune with road
passable all 12 months
0.0341*** 0.0503***
-0.0405***
(0.0089) (0.0070)
(0.0058)
Commune with irrigation
system
-0.0313*** -0.0237***
0.0014
(0.0075) (0.0059)
(0.0049)
Commune with a market 0.0719*** 0.0555***
-0.0269***
(0.0080) (0.0063)
(0.0052)
Commune with firms 0.0878*** 0.0713***
-0.0410***
(0.0075) (0.0060)
(0.0049)
Year 2006 0.1649*** 0.1534*** 0.1303*** 0.1138*** -0.0388*** -0.0290***
(0.0101) (0.0110) (0.0082) (0.0087) (0.0061) (0.0072)
Year 2008 0.2634*** 0.2138*** 0.2625*** 0.2064*** -0.0491*** -0.0239***
(0.0101) (0.0110) (0.0082) (0.0087) (0.0061) (0.0072)
Year 2010 0.4122*** 0.3155*** 0.5211*** 0.4390*** -0.0541*** -0.0290***
(0.0103) (0.0115) (0.0083) (0.0091) (0.0062) (0.0075)
Constant 8.3286*** 7.8486*** 8.1313*** 7.6882*** 0.1743*** 0.3386***
(0.0141) (0.0254) (0.0114) (0.0201) (0.0085) (0.0167)
Observations 27,404 27,404 27,407 27,404 27,404 27,407
R-squared 0.246 0.390 0.350 0.478 0.208 0.238
Number of communes 4,629 4,629 4,629 4,629 4,629 4,629
Note: *** p<0.01, ** p<0.05, * p<0.1
Robust standard errors are in parentheses.
Source: Authors‟ estimation from the VHLSSs 2004, 2006, 2008 and 2010.