Embed Size (px)
Citation preview

September 19, 2017
Natural Gas Conservation ConferenceBy: Peter Klein, VP Finance
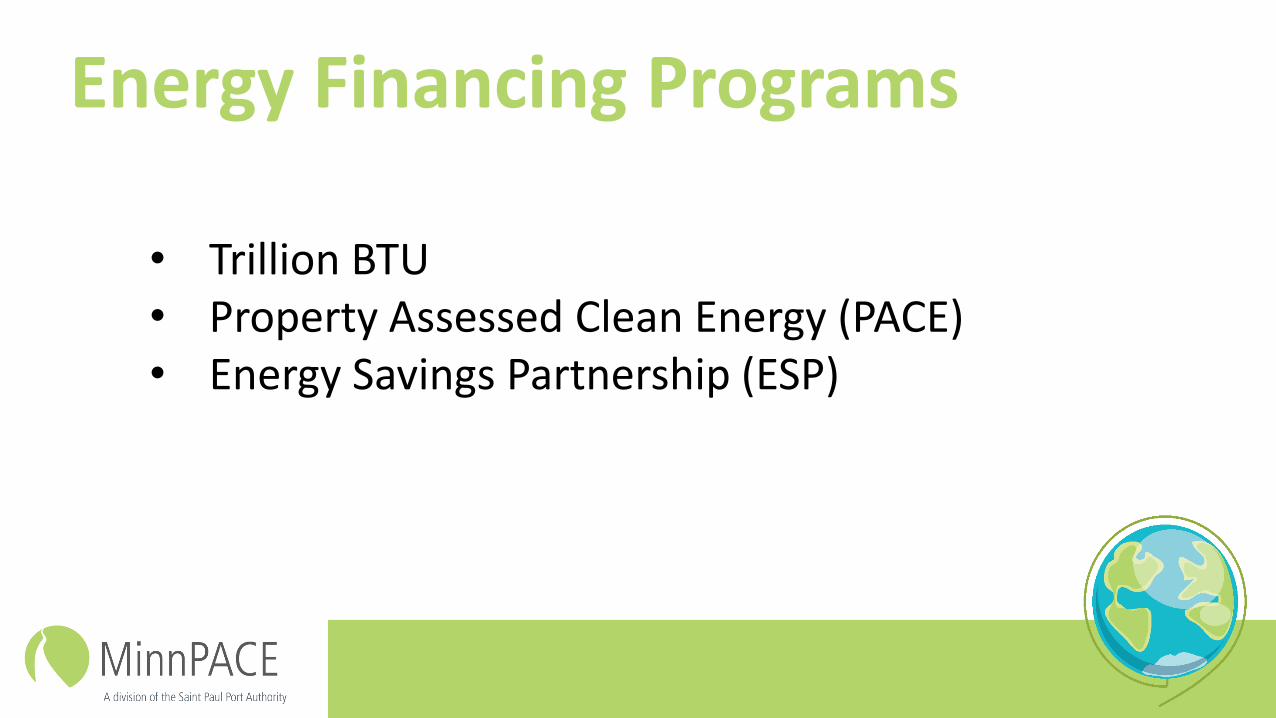
Energy Financing Programs
• Trillion BTU• Property Assessed Clean Energy (PACE)• Energy Savings Partnership (ESP)
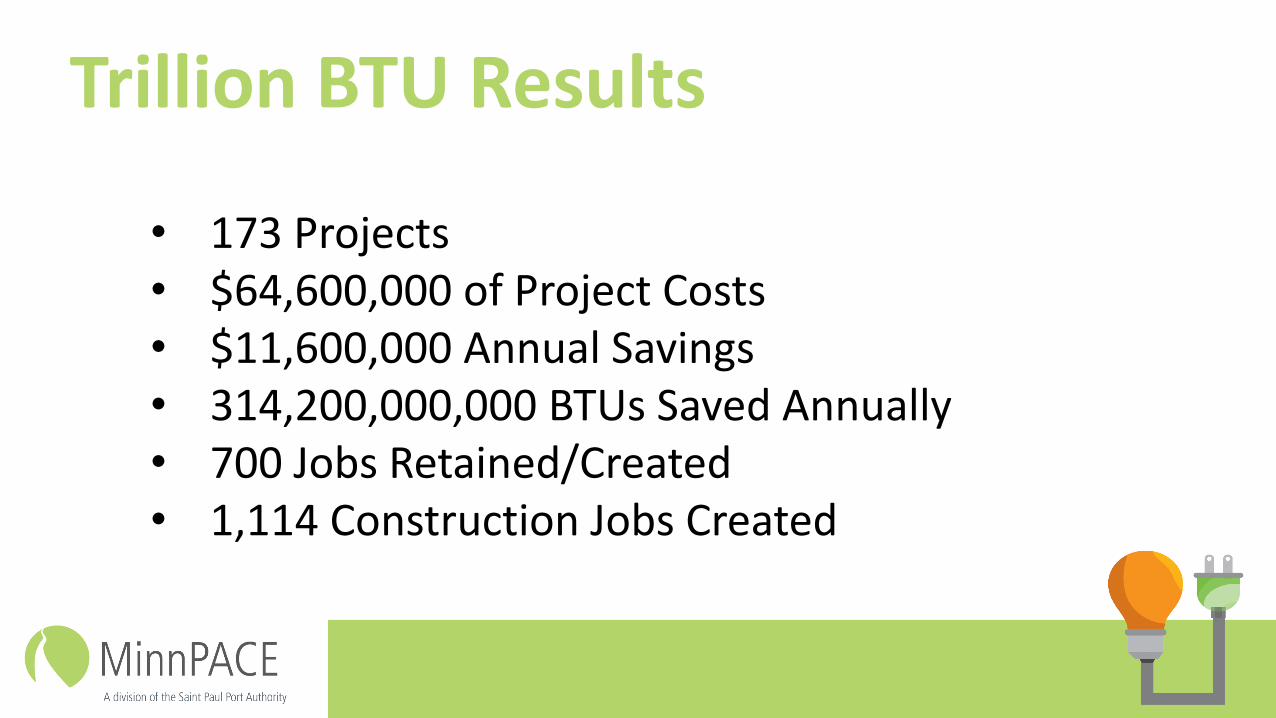
Trillion BTU Results
• 173 Projects• $64,600,000 of Project Costs• $11,600,000 Annual Savings• 314,200,000,000 BTUs Saved Annually• 700 Jobs Retained/Created• 1,114 Construction Jobs Created
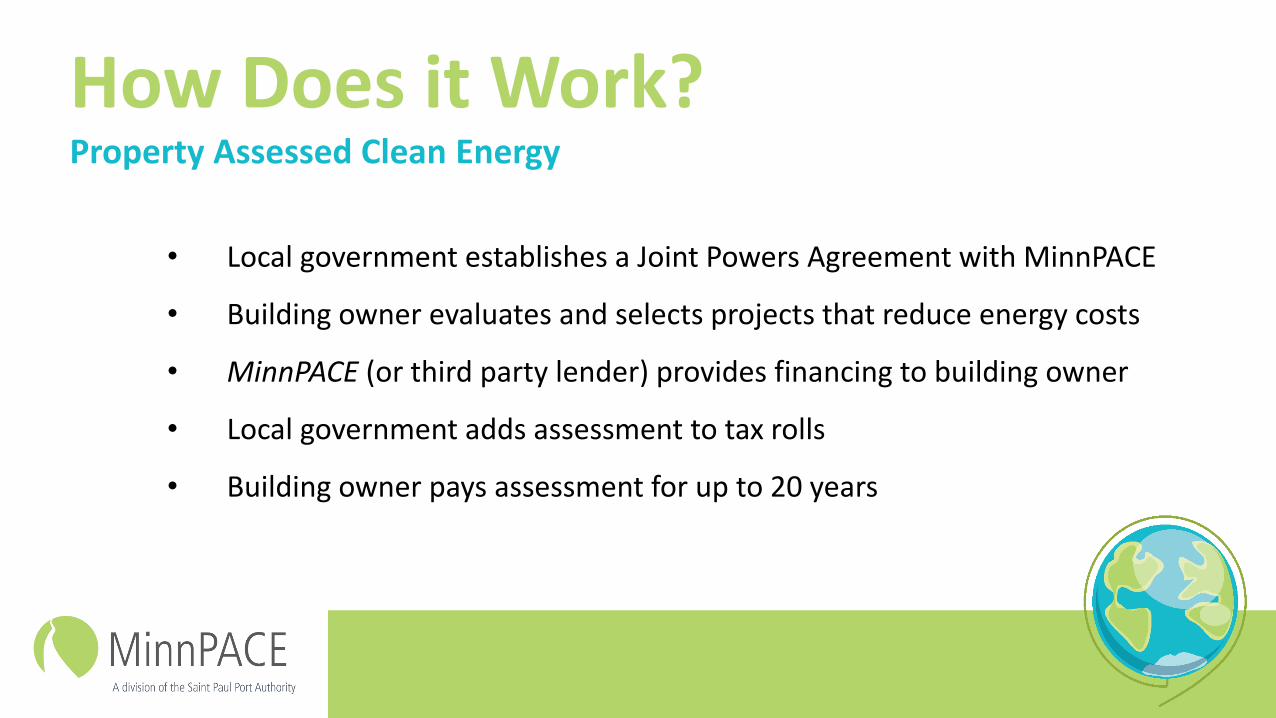
How Does it Work?Property Assessed Clean Energy
• Local government establishes a Joint Powers Agreement with MinnPACE
• Building owner evaluates and selects projects that reduce energy costs
• MinnPACE (or third party lender) provides financing to building owner
• Local government adds assessment to tax rolls
• Building owner pays assessment for up to 20 years
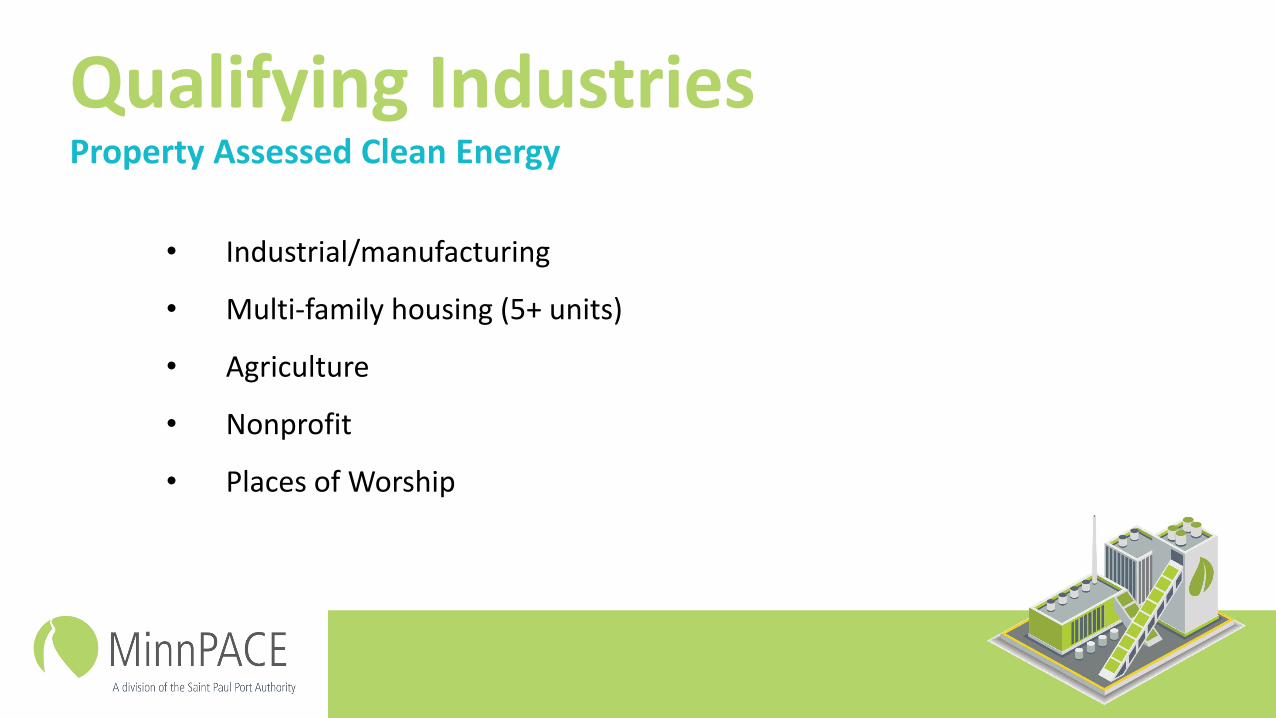
Qualifying IndustriesProperty Assessed Clean Energy
• Industrial/manufacturing
• Multi-family housing (5+ units)
• Agriculture
• Nonprofit
• Places of Worship
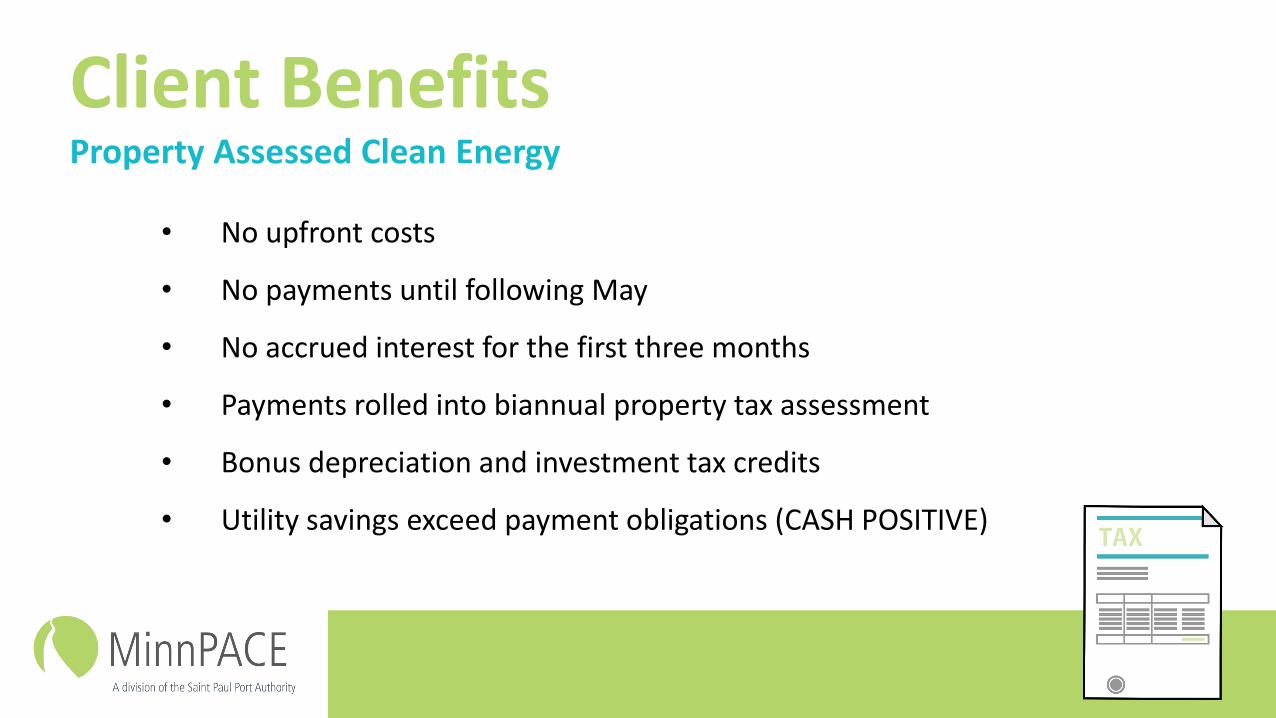
Client BenefitsProperty Assessed Clean Energy
• No upfront costs
• No payments until following May
• No accrued interest for the first three months
• Payments rolled into biannual property tax assessment
• Bonus depreciation and investment tax credits
• Utility savings exceed payment obligations (CASH POSITIVE)
Potential HurdlesProperty Assessed Clean Energy
• Financing limited to 20% of the current assessed value of the property
• Application requires signature from existing mortgage holder(s)
Niches for PACEProperty Assessed Clean Energy
Renewable Energy Projects
• ITC & MACRS before first payment• Positive cash flow
Multi-tenant Buildings
• Owner does not pay the utilities• Line item on real estate taxes
• Passed through to tenants along with regular property taxes• Still positive cash flow to tenant• Not a negative cash flow to owner
Motives of Building OwnersProperty Assessed Clean Energy
Renewable Energy Projects
• Cost reduction / positive cash flow• Marketing
Energy Efficiency Projects
• Tenant comfort• Tenants increasingly requiring more efficiency
• Governmental requirements• Public disclosures & rankings of building efficiencies
PACE ResultsProperty Assessed Clean Energy
• 103 Projects• $39,227,000 of Project Costs• $3,524,000 Annual Savings• 135,678,000,000 BTUs Saved Annually• 71 Jobs Retained/Created• 407 Construction Jobs Created
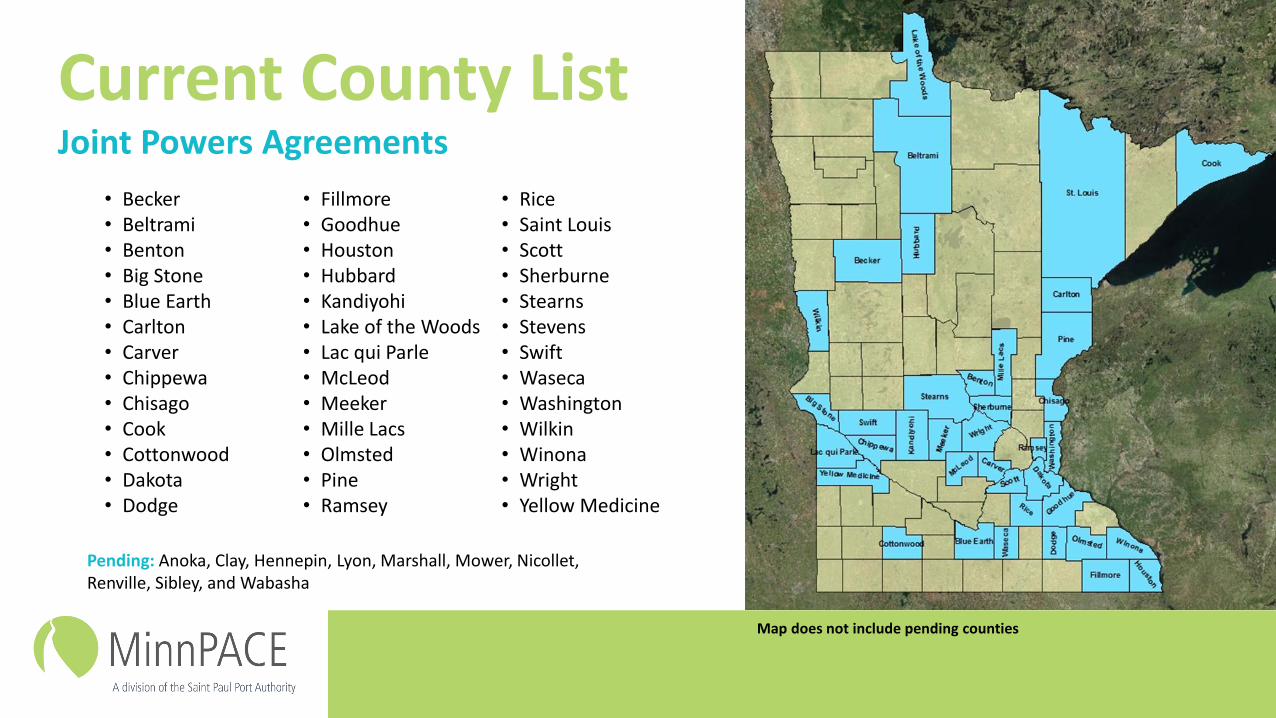
Current County ListJoint Powers Agreements
• Becker• Beltrami• Benton• Big Stone• Blue Earth• Carlton• Carver• Chippewa• Chisago• Cook• Cottonwood• Dakota• Dodge
• Fillmore• Goodhue• Houston• Hubbard• Kandiyohi• Lake of the Woods• Lac qui Parle• McLeod• Meeker• Mille Lacs• Olmsted• Pine• Ramsey
• Rice• Saint Louis• Scott• Sherburne• Stearns• Stevens• Swift• Waseca• Washington• Wilkin• Winona• Wright• Yellow Medicine
Pending: Anoka, Clay, Hennepin, Lyon, Marshall, Mower, Nicollet, Renville, Sibley, and Wabasha
Map does not include pending counties
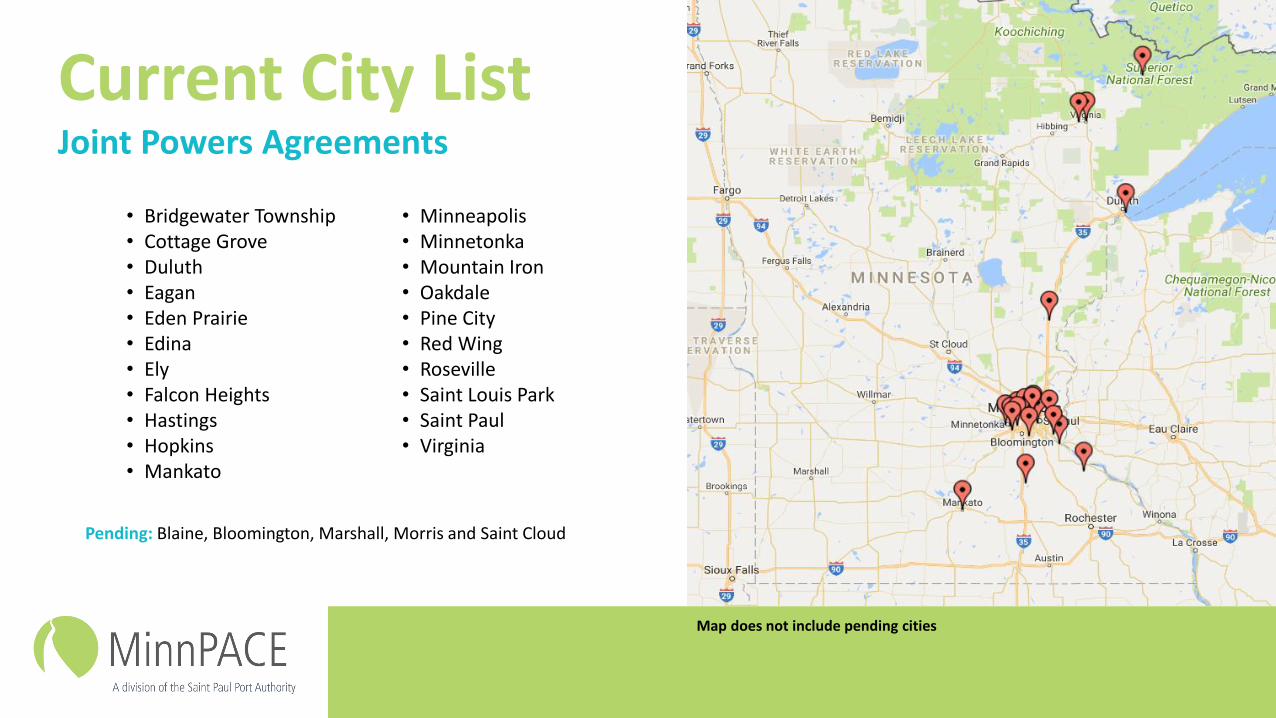
Current City ListJoint Powers Agreements
• Bridgewater Township• Cottage Grove• Duluth• Eagan• Eden Prairie• Edina• Ely• Falcon Heights• Hastings• Hopkins• Mankato
• Minneapolis• Minnetonka• Mountain Iron• Oakdale• Pine City• Red Wing• Roseville• Saint Louis Park• Saint Paul• Virginia
Pending: Blaine, Bloomington, Marshall, Morris and Saint Cloud
Map does not include pending cities
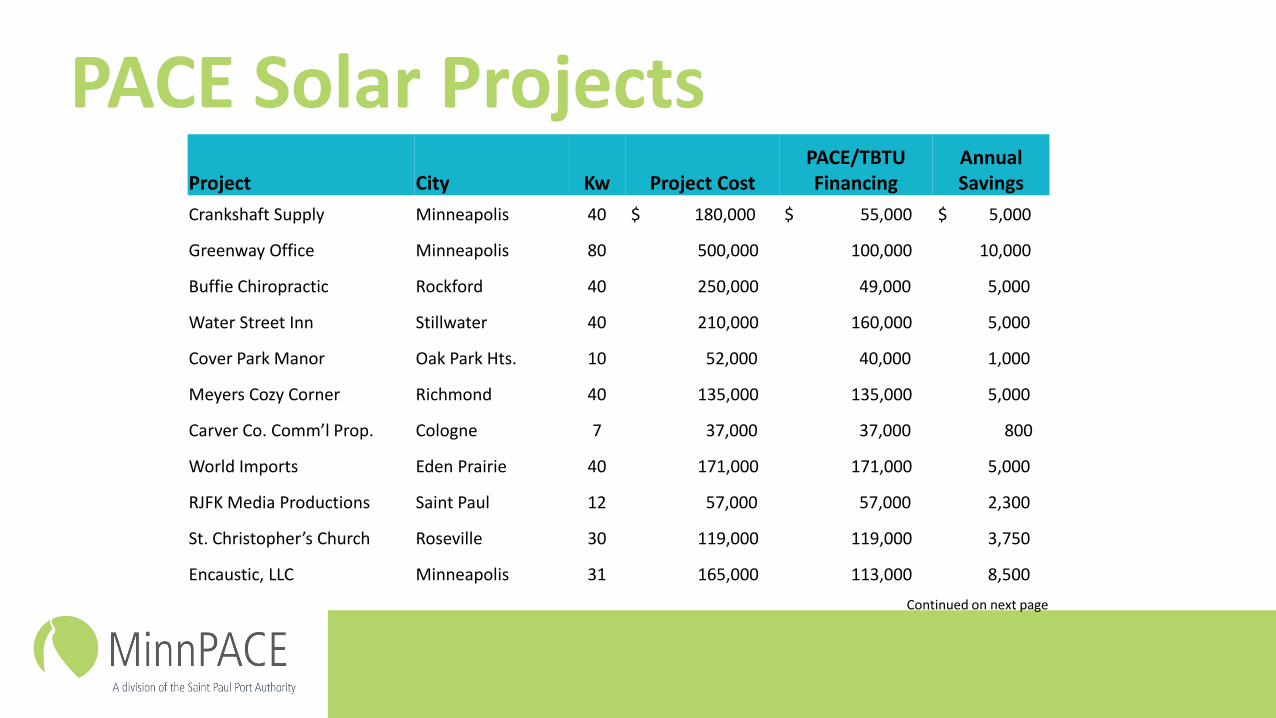
PACE Solar ProjectsProject City Kw Project Cost
PACE/TBTU Financing
Annual Savings
Crankshaft Supply Minneapolis 40 $ 180,000 $ 55,000 $ 5,000
Greenway Office Minneapolis 80 500,000 100,000 10,000
Buffie Chiropractic Rockford 40 250,000 49,000 5,000
Water Street Inn Stillwater 40 210,000 160,000 5,000
Cover Park Manor Oak Park Hts. 10 52,000 40,000 1,000
Meyers Cozy Corner Richmond 40 135,000 135,000 5,000
Carver Co. Comm’l Prop. Cologne 7 37,000 37,000 800
World Imports Eden Prairie 40 171,000 171,000 5,000
RJFK Media Productions Saint Paul 12 57,000 57,000 2,300
St. Christopher’s Church Roseville 30 119,000 119,000 3,750
Encaustic, LLC Minneapolis 31 165,000 113,000 8,500
Continued on next page
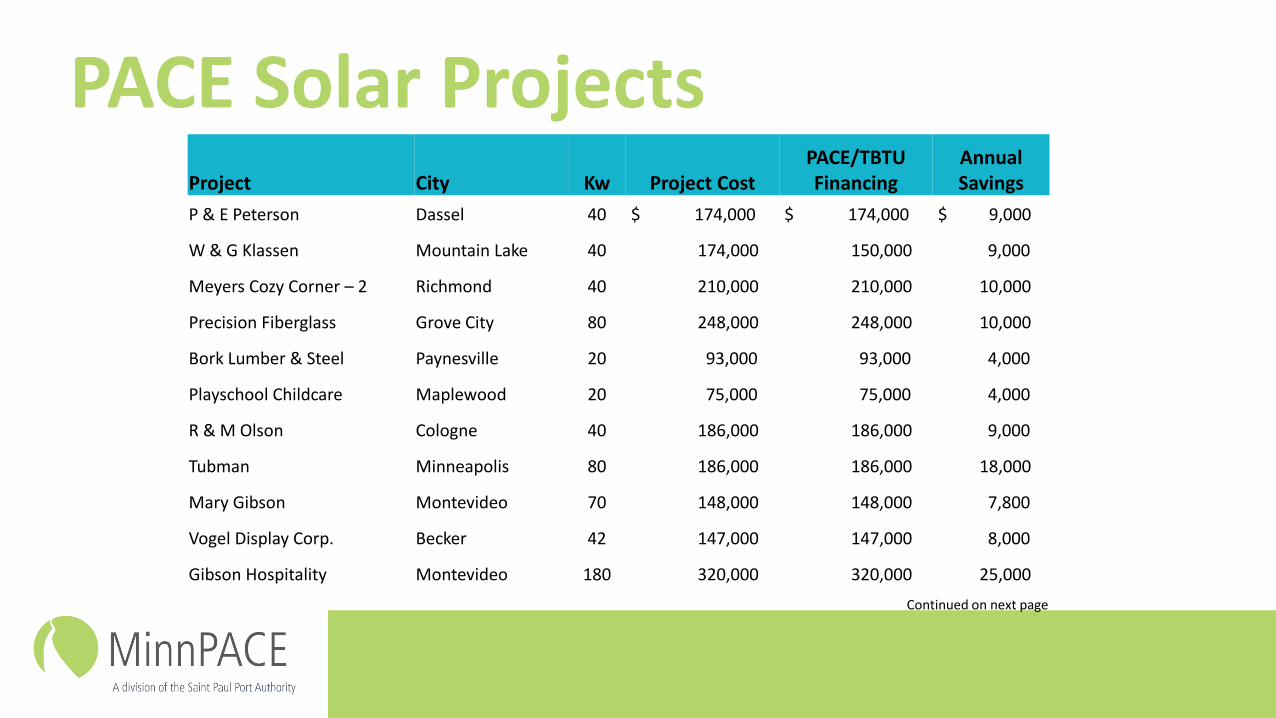
PACE Solar ProjectsProject City Kw Project Cost
PACE/TBTU Financing
Annual Savings
P & E Peterson Dassel 40 $ 174,000 $ 174,000 $ 9,000
W & G Klassen Mountain Lake 40 174,000 150,000 9,000
Meyers Cozy Corner – 2 Richmond 40 210,000 210,000 10,000
Precision Fiberglass Grove City 80 248,000 248,000 10,000
Bork Lumber & Steel Paynesville 20 93,000 93,000 4,000
Playschool Childcare Maplewood 20 75,000 75,000 4,000
R & M Olson Cologne 40 186,000 186,000 9,000
Tubman Minneapolis 80 186,000 186,000 18,000
Mary Gibson Montevideo 70 148,000 148,000 7,800
Vogel Display Corp. Becker 42 147,000 147,000 8,000
Gibson Hospitality Montevideo 180 320,000 320,000 25,000
Continued on next page
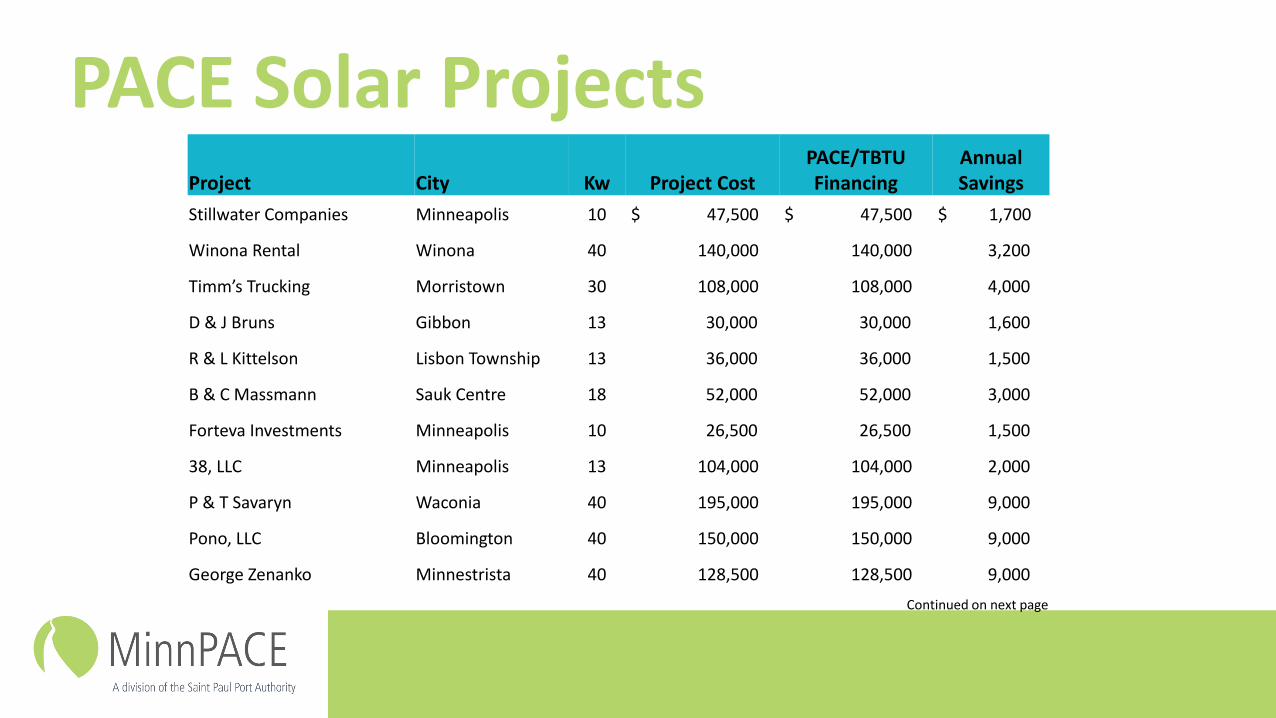
PACE Solar ProjectsProject City Kw Project Cost
PACE/TBTU Financing
Annual Savings
Stillwater Companies Minneapolis 10 $ 47,500 $ 47,500 $ 1,700
Winona Rental Winona 40 140,000 140,000 3,200
Timm’s Trucking Morristown 30 108,000 108,000 4,000
D & J Bruns Gibbon 13 30,000 30,000 1,600
R & L Kittelson Lisbon Township 13 36,000 36,000 1,500
B & C Massmann Sauk Centre 18 52,000 52,000 3,000
Forteva Investments Minneapolis 10 26,500 26,500 1,500
38, LLC Minneapolis 13 104,000 104,000 2,000
P & T Savaryn Waconia 40 195,000 195,000 9,000
Pono, LLC Bloomington 40 150,000 150,000 9,000
George Zenanko Minnestrista 40 128,500 128,500 9,000
Continued on next page
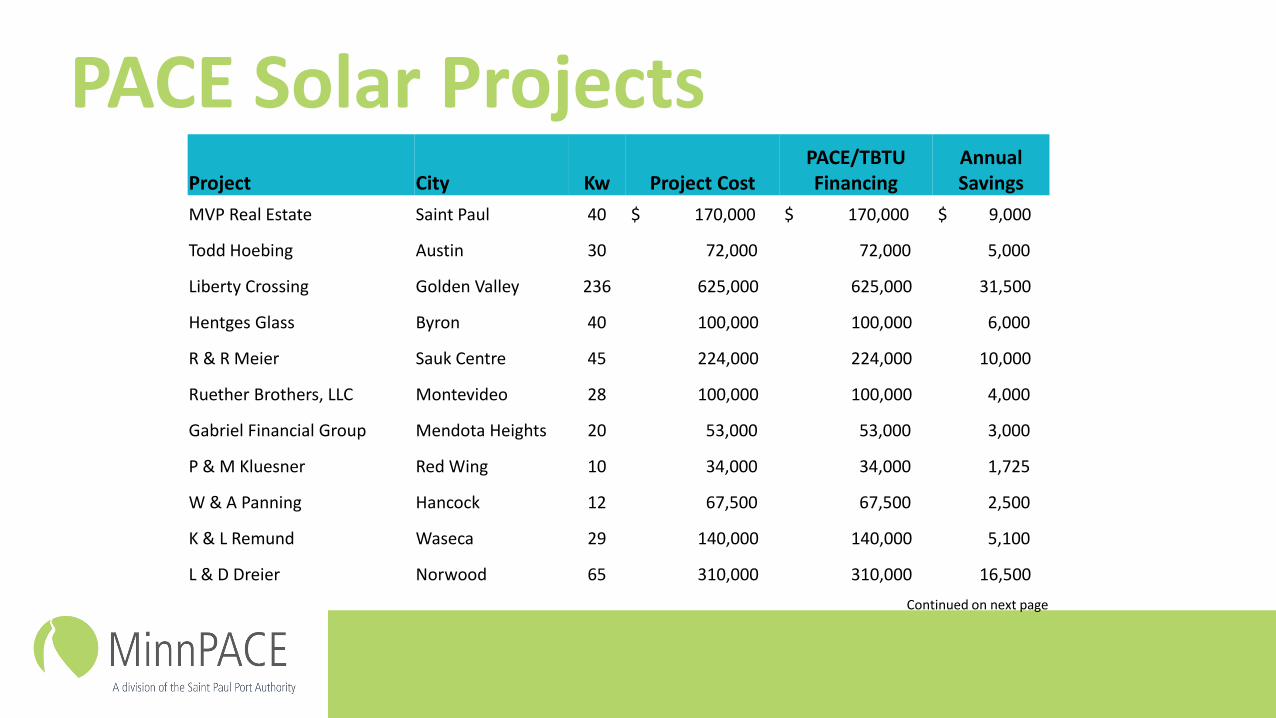
PACE Solar ProjectsProject City Kw Project Cost
PACE/TBTU Financing
Annual Savings
MVP Real Estate Saint Paul 40 $ 170,000 $ 170,000 $ 9,000
Todd Hoebing Austin 30 72,000 72,000 5,000
Liberty Crossing Golden Valley 236 625,000 625,000 31,500
Hentges Glass Byron 40 100,000 100,000 6,000
R & R Meier Sauk Centre 45 224,000 224,000 10,000
Ruether Brothers, LLC Montevideo 28 100,000 100,000 4,000
Gabriel Financial Group Mendota Heights 20 53,000 53,000 3,000
P & M Kluesner Red Wing 10 34,000 34,000 1,725
W & A Panning Hancock 12 67,500 67,500 2,500
K & L Remund Waseca 29 140,000 140,000 5,100
L & D Dreier Norwood 65 310,000 310,000 16,500
Continued on next page
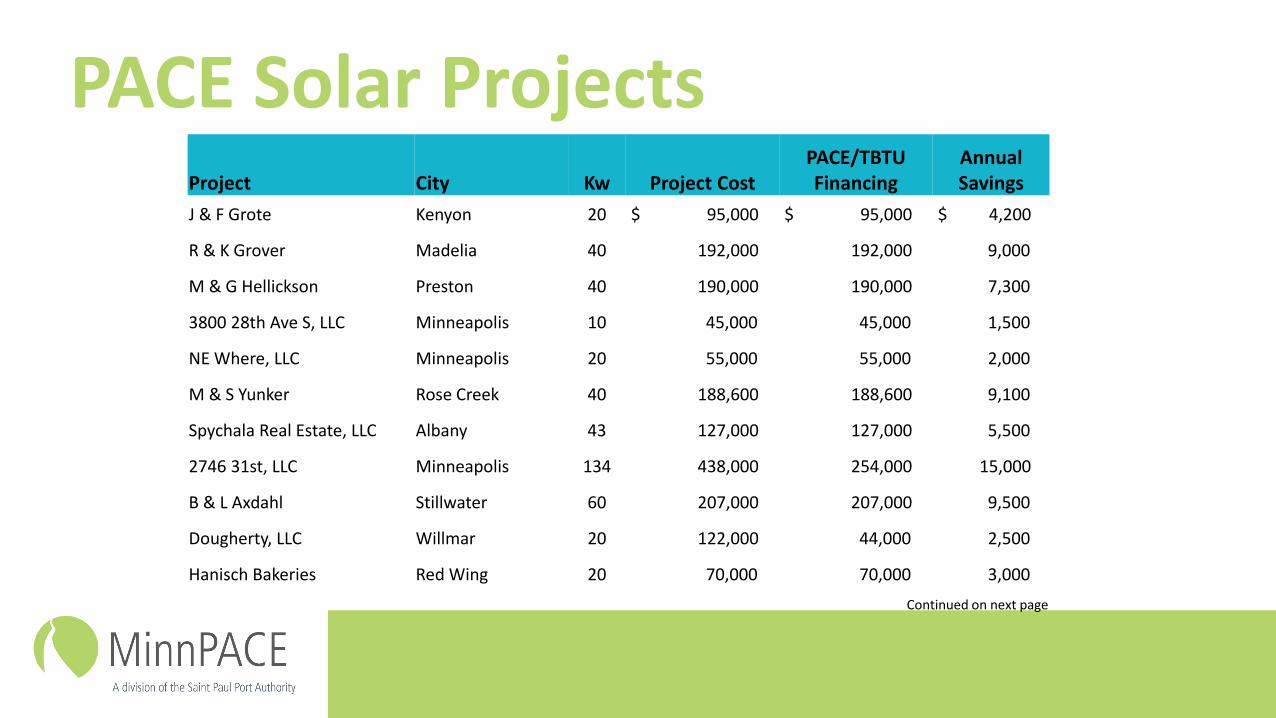
PACE Solar ProjectsProject City Kw Project Cost
PACE/TBTU Financing
Annual Savings
J & F Grote Kenyon 20 $ 95,000 $ 95,000 $ 4,200
R & K Grover Madelia 40 192,000 192,000 9,000
M & G Hellickson Preston 40 190,000 190,000 7,300
3800 28th Ave S, LLC Minneapolis 10 45,000 45,000 1,500
NE Where, LLC Minneapolis 20 55,000 55,000 2,000
M & S Yunker Rose Creek 40 188,600 188,600 9,100
Spychala Real Estate, LLC Albany 43 127,000 127,000 5,500
2746 31st, LLC Minneapolis 134 438,000 254,000 15,000
B & L Axdahl Stillwater 60 207,000 207,000 9,500
Dougherty, LLC Willmar 20 122,000 44,000 2,500
Hanisch Bakeries Red Wing 20 70,000 70,000 3,000
Continued on next page
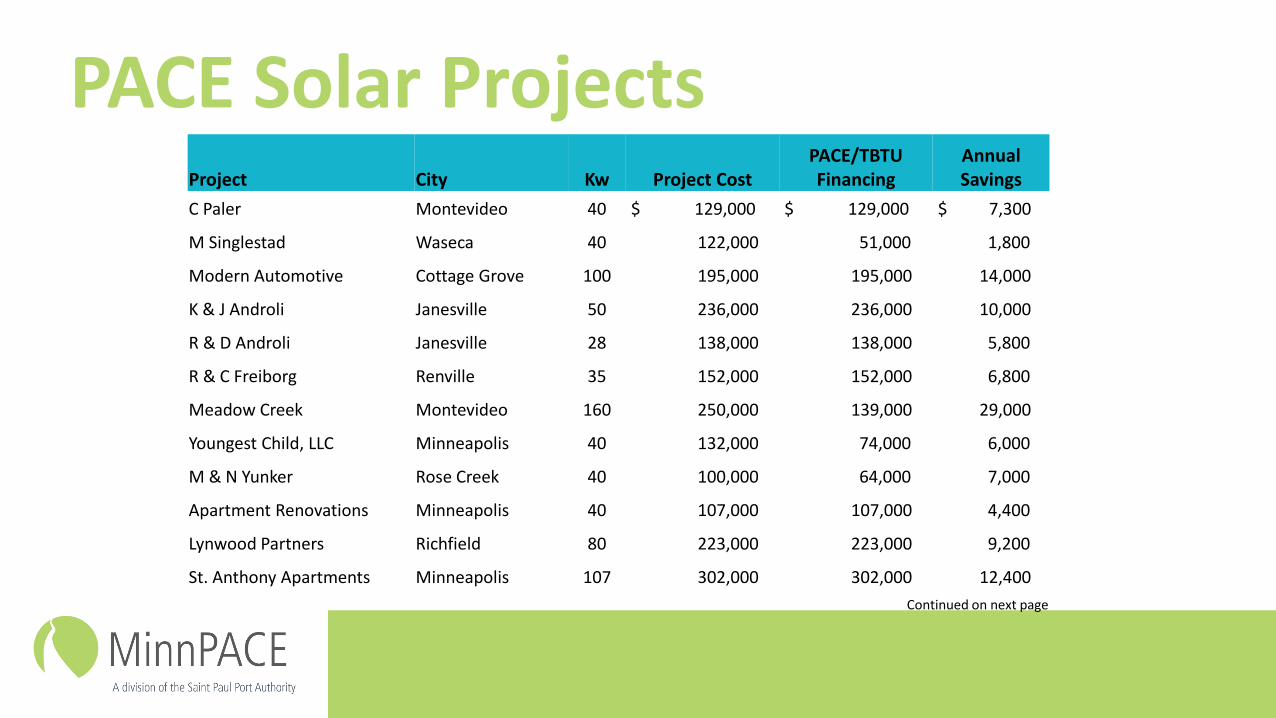
PACE Solar ProjectsProject City Kw Project Cost
PACE/TBTU Financing
Annual Savings
C Paler Montevideo 40 $ 129,000 $ 129,000 $ 7,300
M Singlestad Waseca 40 122,000 51,000 1,800
Modern Automotive Cottage Grove 100 195,000 195,000 14,000
K & J Androli Janesville 50 236,000 236,000 10,000
R & D Androli Janesville 28 138,000 138,000 5,800
R & C Freiborg Renville 35 152,000 152,000 6,800
Meadow Creek Montevideo 160 250,000 139,000 29,000
Youngest Child, LLC Minneapolis 40 132,000 74,000 6,000
M & N Yunker Rose Creek 40 100,000 64,000 7,000
Apartment Renovations Minneapolis 40 107,000 107,000 4,400
Lynwood Partners Richfield 80 223,000 223,000 9,200
St. Anthony Apartments Minneapolis 107 302,000 302,000 12,400
Continued on next page
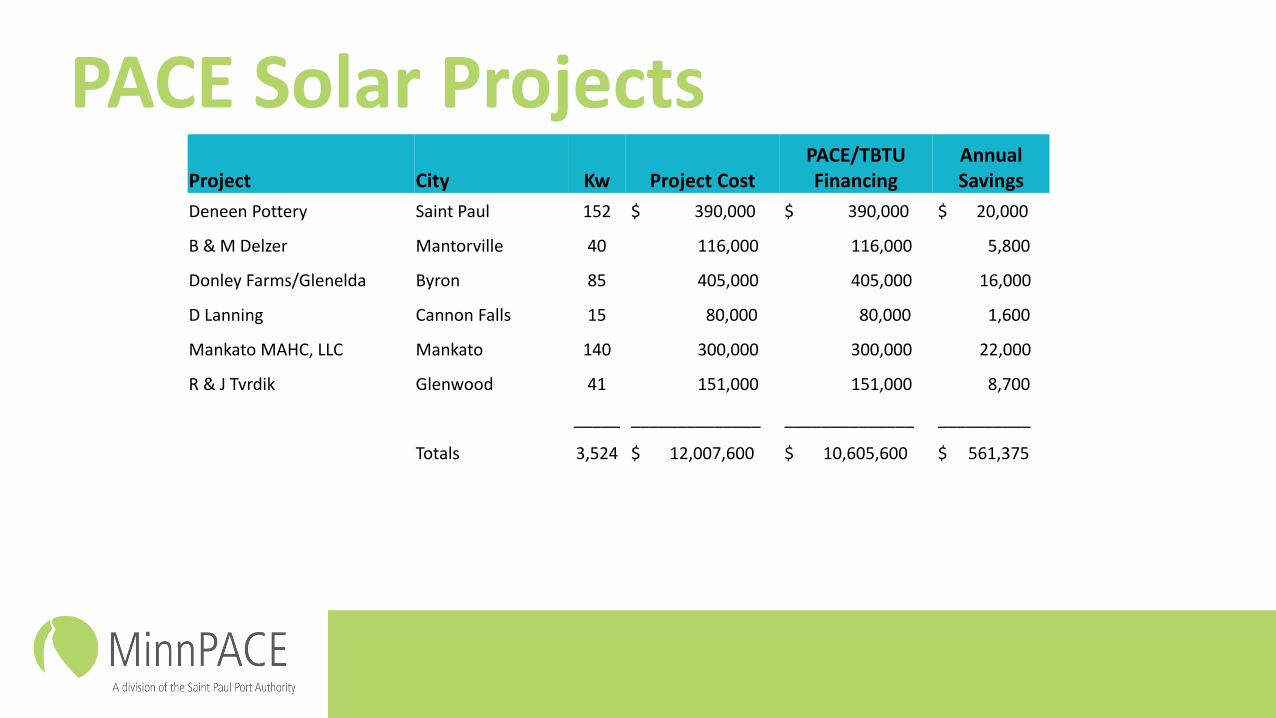
PACE Solar ProjectsProject City Kw Project Cost
PACE/TBTU Financing
Annual Savings
Deneen Pottery Saint Paul 152 $ 390,000 $ 390,000 $ 20,000
B & M Delzer Mantorville 40 116,000 116,000 5,800
Donley Farms/Glenelda Byron 85 405,000 405,000 16,000
D Lanning Cannon Falls 15 80,000 80,000 1,600
Mankato MAHC, LLC Mankato 140 300,000 300,000 22,000
R & J Tvrdik Glenwood 41 151,000 151,000 8,700
_____ ______________ ______________ __________
Totals 3,524 $ 12,007,600 $ 10,605,600 $ 561,375
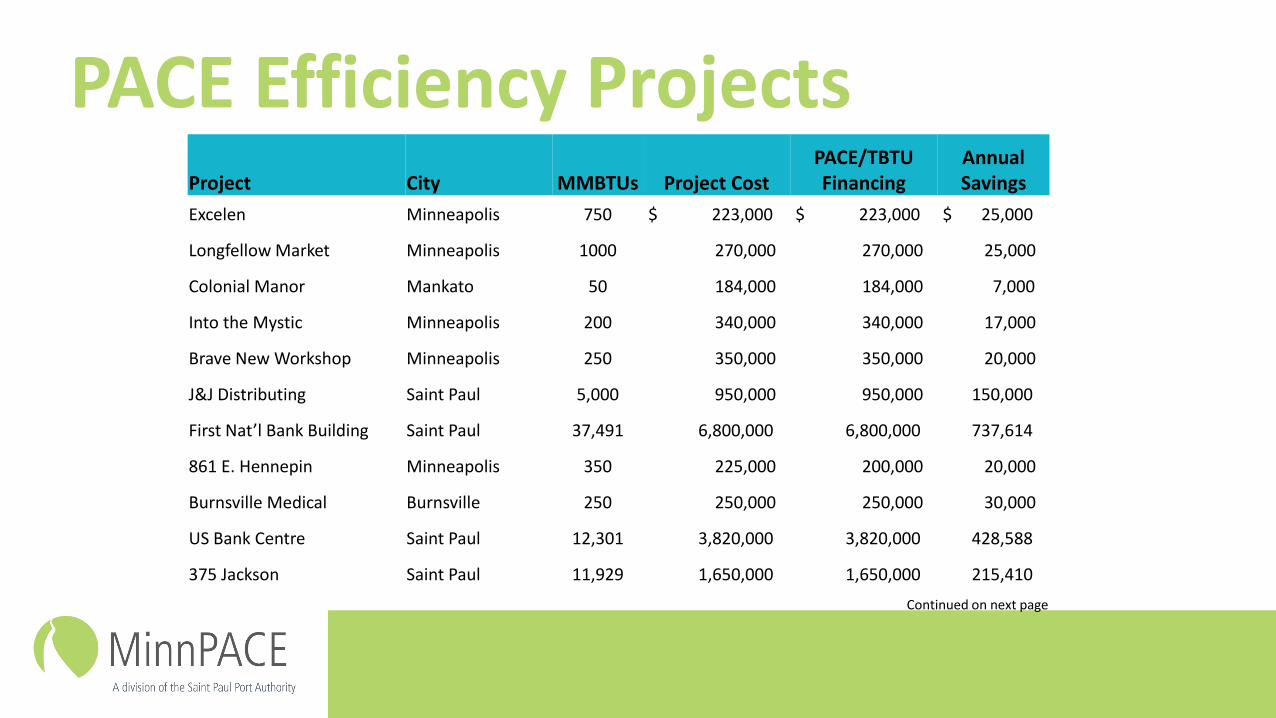
PACE Efficiency ProjectsProject City MMBTUs Project Cost
PACE/TBTU Financing
Annual Savings
Excelen Minneapolis 750 $ 223,000 $ 223,000 $ 25,000
Longfellow Market Minneapolis 1000 270,000 270,000 25,000
Colonial Manor Mankato 50 184,000 184,000 7,000
Into the Mystic Minneapolis 200 340,000 340,000 17,000
Brave New Workshop Minneapolis 250 350,000 350,000 20,000
J&J Distributing Saint Paul 5,000 950,000 950,000 150,000
First Nat’l Bank Building Saint Paul 37,491 6,800,000 6,800,000 737,614
861 E. Hennepin Minneapolis 350 225,000 200,000 20,000
Burnsville Medical Burnsville 250 250,000 250,000 30,000
US Bank Centre Saint Paul 12,301 3,820,000 3,820,000 428,588
375 Jackson Saint Paul 11,929 1,650,000 1,650,000 215,410
Continued on next page

PACE Efficiency ProjectsProject City MMBTUs Project Cost
PACE/TBTU Financing
Annual Savings
Mesabi Family YMCA Virginia 150 $ 24,500 $ 24,500 $ 4,000
Bemidji Holdings Bemidji 659 25,000 25,000 6,075
Bigos – Jackson/Sibley Saint Paul 5,000 2,100,000 2,100,000 200,000
990 Payne Ave, LLC Saint Paul 285 73,000 73,000 11,500
Atrium, LLC Saint Paul 800 120,000 120,000 15,000
R & R Flynn Cloquet 120 42,000 42,000 4,000
3800 28th Ave, LLC Minneapolis 52 15,000 15,000 1,500
Brooklyn Park Auto Mall Brooklyn Park 181 39,000 39,000 5,430
Burnsville Auto Mall Burnsville 153 33,000 33,000 4,595
Eagan Auto Mall Eagan 181 39,000 39,000 5,430
Hopkins Auto Mall Hopkins 65 14,000 14,000 1,950
Continued on next page
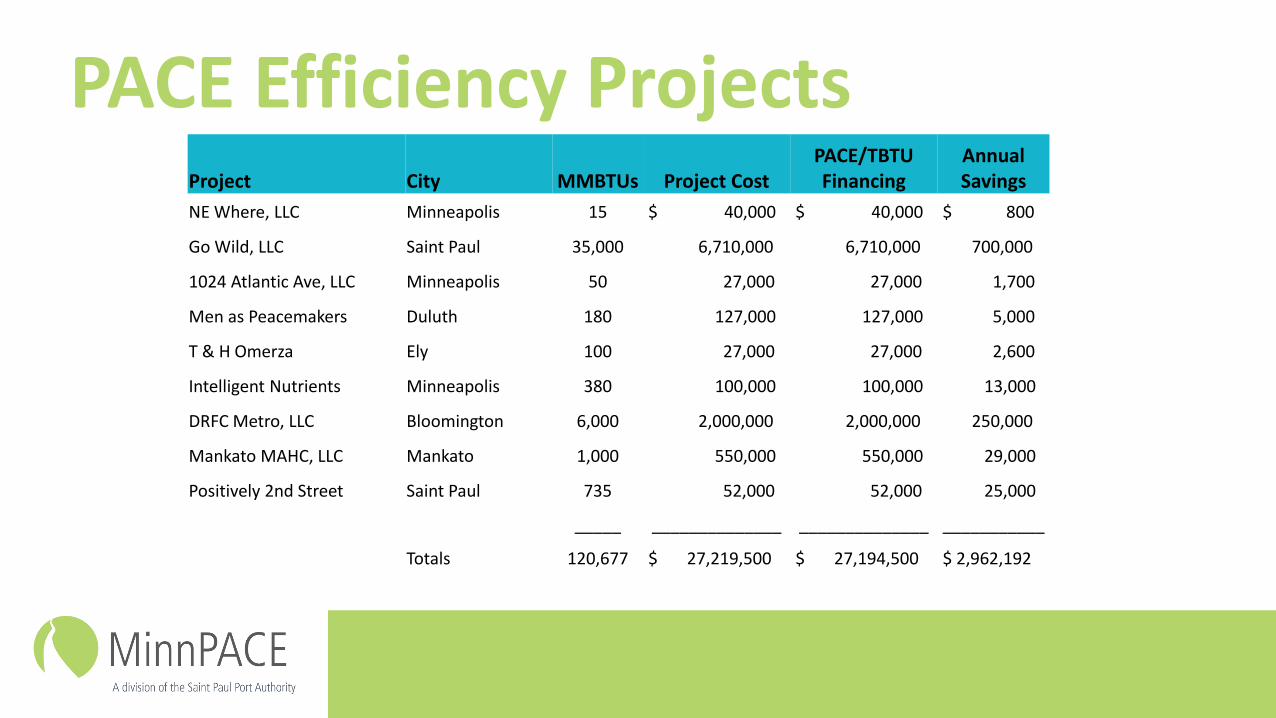
PACE Efficiency ProjectsProject City MMBTUs Project Cost
PACE/TBTU Financing
Annual Savings
NE Where, LLC Minneapolis 15 $ 40,000 $ 40,000 $ 800
Go Wild, LLC Saint Paul 35,000 6,710,000 6,710,000 700,000
1024 Atlantic Ave, LLC Minneapolis 50 27,000 27,000 1,700
Men as Peacemakers Duluth 180 127,000 127,000 5,000
T & H Omerza Ely 100 27,000 27,000 2,600
Intelligent Nutrients Minneapolis 380 100,000 100,000 13,000
DRFC Metro, LLC Bloomington 6,000 2,000,000 2,000,000 250,000
Mankato MAHC, LLC Mankato 1,000 550,000 550,000 29,000
Positively 2nd Street Saint Paul 735 52,000 52,000 25,000
_____ ______________ ______________ ___________
Totals 120,677 $ 27,219,500 $ 27,194,500 $ 2,962,192
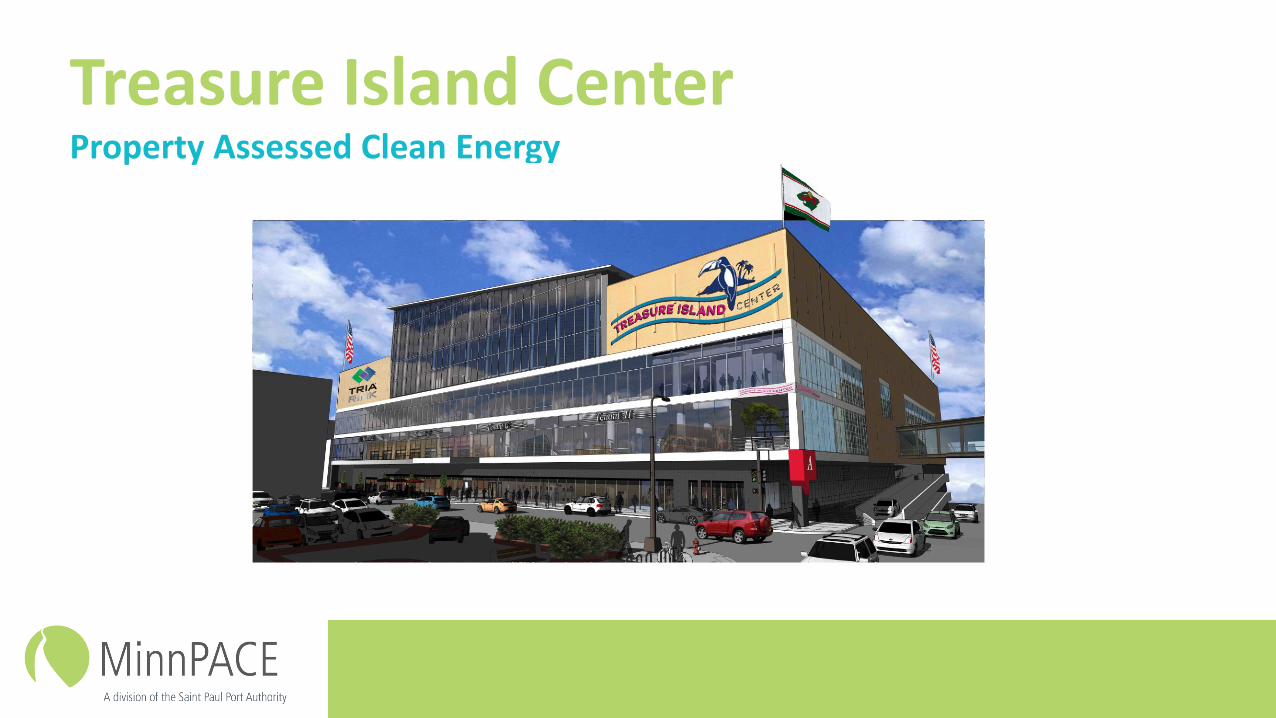
Treasure Island CenterProperty Assessed Clean Energy
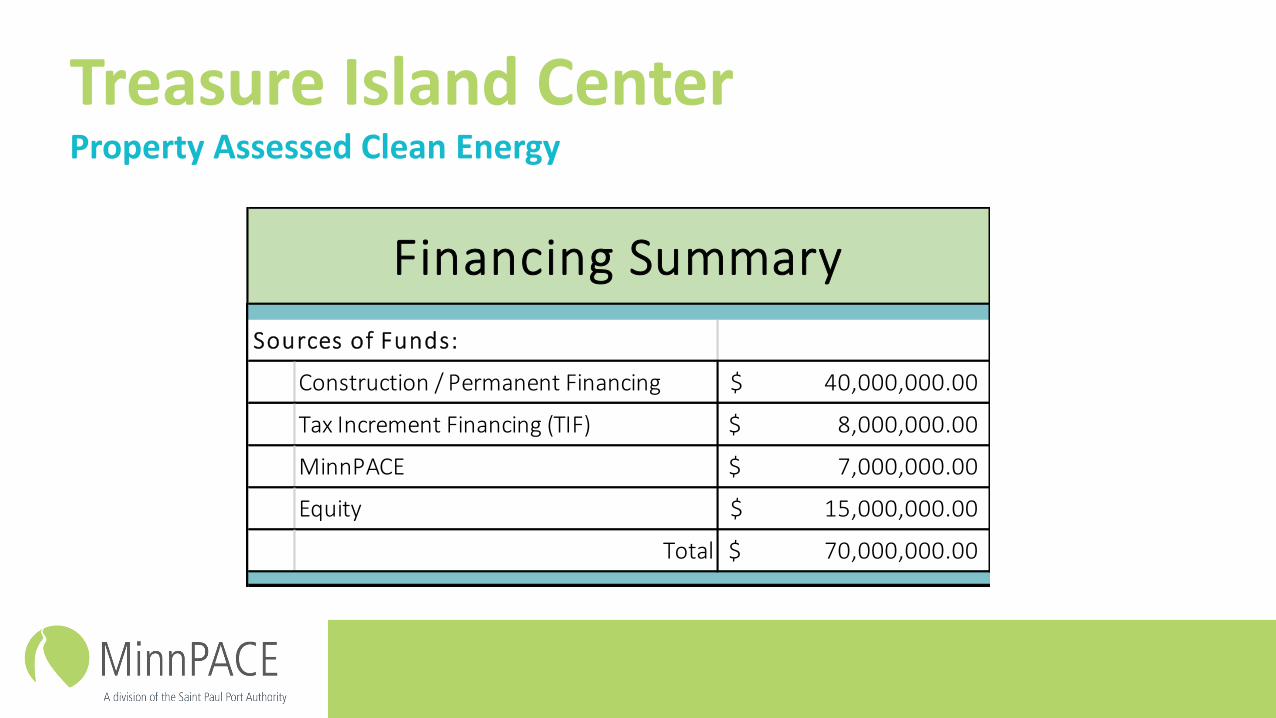
Treasure Island CenterProperty Assessed Clean Energy
Sources of Funds:
Construction / Permanent Financing 40,000,000.00$
Tax Increment Financing (TIF) 8,000,000.00$
MinnPACE 7,000,000.00$
Equity 15,000,000.00$
Total 70,000,000.00$
Financing Summary
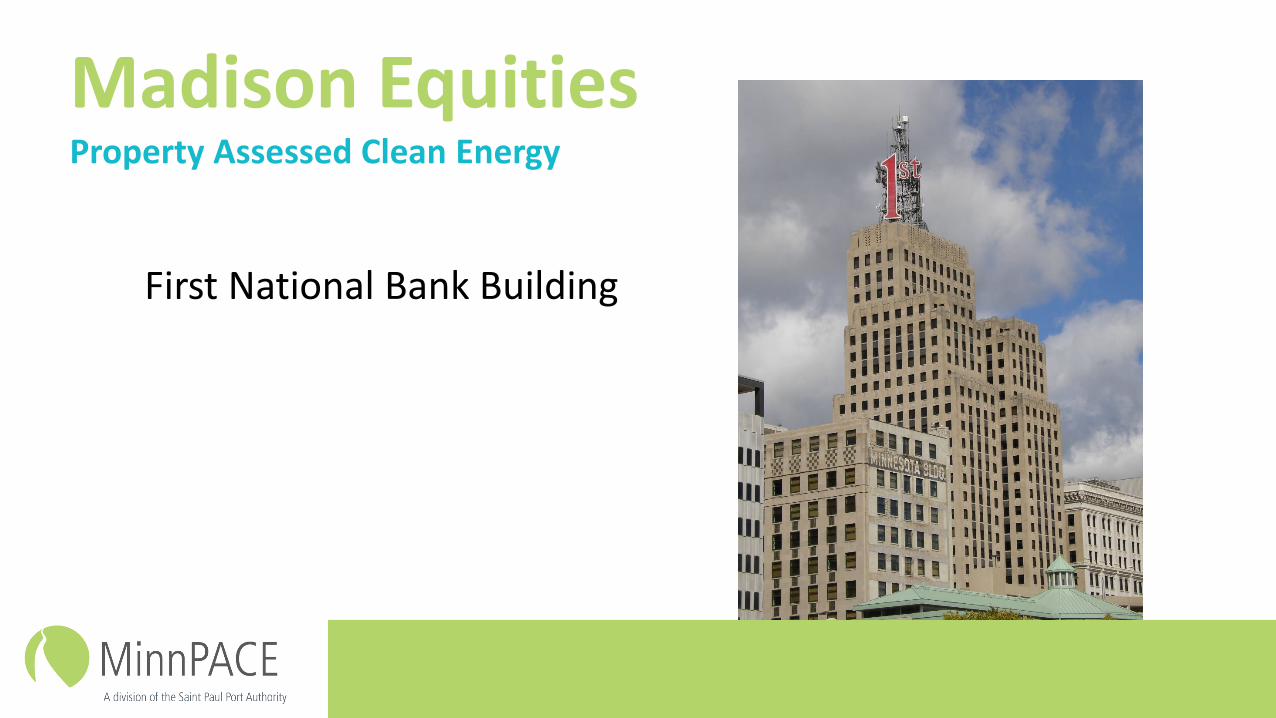
Madison EquitiesProperty Assessed Clean Energy
First National Bank Building
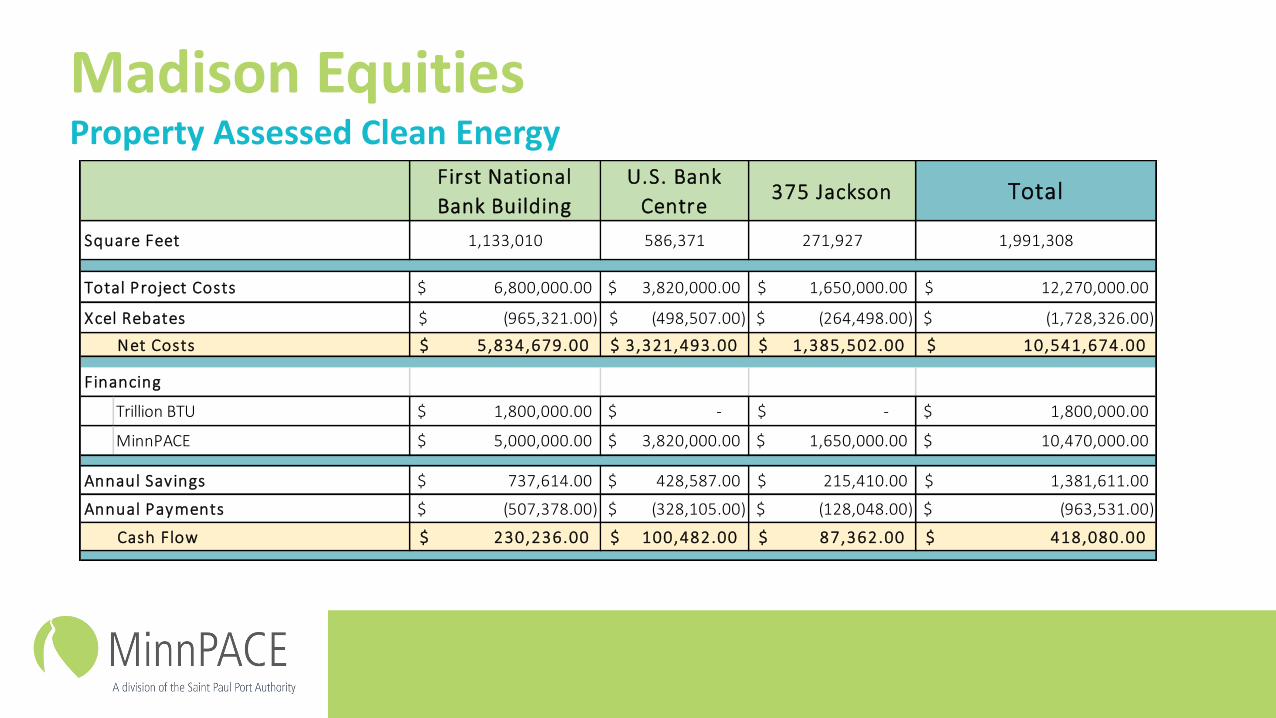
Madison EquitiesProperty Assessed Clean Energy
First National
Bank Building
U.S. Bank
Centre375 Jackson Total
Square Feet 1,133,010 586,371 271,927 1,991,308
Total Project Costs 6,800,000.00$ 3,820,000.00$ 1,650,000.00$ 12,270,000.00$
Xcel Rebates (965,321.00)$ (498,507.00)$ (264,498.00)$ (1,728,326.00)$
Net Costs 5,834,679.00$ 3,321,493.00$ 1,385,502.00$ 10,541,674.00$
Financing
Trillion BTU 1,800,000.00$ -$ -$ 1,800,000.00$
MinnPACE 5,000,000.00$ 3,820,000.00$ 1,650,000.00$ 10,470,000.00$
Annaul Savings 737,614.00$ 428,587.00$ 215,410.00$ 1,381,611.00$
Annual Payments (507,378.00)$ (328,105.00)$ (128,048.00)$ (963,531.00)$
Cash Flow 230,236.00$ 100,482.00$ 87,362.00$ 418,080.00$
Questions?
www.minnpace.com
“MinnPACE allows us to sell more projects, install more systems, and in some cases it allows us to increase project size.”
-Eric PasiIPS Solar


![Natural Language Processing - University of California, …klein/cs288/fa14/...Slide credit: Slav Petrov [Petrov & Klein, 2007] 70 CPU Parsing Grammar S NP VP × ××× Skip Spans](https://img.pdfslide.net/doc/110x75/5b060c2f7f8b9a79538be486/natural-language-processing-university-of-california-kleincs288fa14slide.jpg)