Embed Size (px)
DESCRIPTION
October 13 research note for US Natural Gas Drivers.
Citation preview

Important Notice: In relation to European MIF directive, this publication could not be characterised as independent investment research. Please refer to disclaimer on last page.
Global
Weekly
13 October 200913 October 200913 October 200913 October 2009
IIIImportant Notice: The circumstances in which this publication has been produced are such that it is not appropriate to characterise it as independent investment research as referred to in
European MIF directive and that it should be treated as a marketing material even if it contains a research recommendation (« recommandation d�investissement à caractère promotionnel »).
US Natural Gas US Natural Gas US Natural Gas US Natural Gas Drivers
Laurent Key +1 212 278 57 36 [email protected]
Stephanie Aymes +44 207 762 58 98 [email protected]
www.commodiwww.commodiwww.commodiwww.commodittttiiiies.sgcib.comes.sgcib.comes.sgcib.comes.sgcib.com
US NATURAL GAS SCOREBOARDUS NATURAL GAS SCOREBOARDUS NATURAL GAS SCOREBOARDUS NATURAL GAS SCOREBOARD
ScoreScoreScoreScore WeightWeightWeightWeight CommentCommentCommentComment
Market Fundamentals 2.9 60% Neutral: unexpected rise in production will offset stronger residential demand.
U.S. Demand 3.1 40% Expected colder than normal temperatures in the Northeast and the Midwest are the only bullish factor.
Res/comm 4 55% Up 2 Bcf/d last week with cool temperatures. The rising trend in res. demand should continue with
expected colder than normal temps in high consuming area.
Industrial - US Economy 2 35% Stable w/w but still more than 1 Bcf/d below pre-crisis levels.
Power generation (EG) 2 10% The seasonal decline in EG demand is compounded by less price-related coal-to-gas switching.
U.S. Supply 2.0 30% Production is already back to H1 '09 levels, due to the combined effect of a strong cash market and pipelines returning from maintenance.
Domestic Production 1 60%
A two-week increase of 1.4 Bcf/d, to 56.4 Bcf/d, as Gulf pipeline maintenances finish ahead of
schedule. Current spot prices above $3.5 may result in increasing shale gas production for Oct.
Rising Southeast output may already be offsetting depressed Rockies production.
Canadian Imports 5 20% Down 0.3 Bcf/d last week, on increased domestic demand and declining production.
LNG 2 20% Slightly up last week by 0.3 bcf/d. The completion of global liquefaction facilities, and rising US
spot margins, will boost imports to more than1 Bcf/d for the coming winter.
Inventories (Storage) 3.4 30% Bullish short-term on injection reports; bearish for the medium-term.
Short-term expectations 4 40% Cold weather decreases daily injections: Thursday's EIA report expected at 54 Bcf . Next week in the
30-40 Bcf range, respectively 5 Bcf and 25 Bcf below the 5-yr average.
Long-term expectations 3 60% Since domestic production may have plateaued at high levels, we expect a tighter supply-and-
demand balance by end-of-March 2010. Neutral since inv. Levels will still be high.
Market signals 2.6 40% Bearish short-term, bullish medium term.
Hedge Funds 3 20% As of last week, funds are longer by 5,000 contracts. Total Open Interest is unchanged. With prices
range bound at $4.8-4.9 , ATM vol. may end its decline and stay around 60%.
Implied Probability 1 20% A strong bearish skew on the Nov '09 contract.
Technical Analysis 3 40% Bearish short-term, bullish medium term on a possible reverse head and shoulder pattern.
Global markets 3 20% Rising energy markets may provide a support to NG, but no clear correlation for the moment.
THIS WEEK TREND 2.8 100% A looser supply and demand balance may weigh on prices for the short term. However, flattening production adds a bullish skew for the medium term.
Scoring: 1Scoring: 1Scoring: 1Scoring: 1 = = = = strongly bearis strongly bearis strongly bearis strongly bearishhhh 2222 ==== bearishbearishbearishbearish 3333 ==== neutral neutral neutral neutral 4444 ==== bullishbullishbullishbullish 5555 = = = = strongly bullishstrongly bullishstrongly bullishstrongly bullish
Editorial 2
Natural Gas Price Information 4
Natural Gas Price Information &
Supply/Demand Balance 5
Supply Components 6
Demand Forecasts 7
Demand Breakdown & Inventory 8
Inventory & Withdrawal 9
Weather 10
Technical Analysis NatGas 11
US Natural Gas Forecasts - Last
updated 25/09/09 12
Economic Indicators 13
Trading Contacts 16

���� EDITORIAL
13 October 2009 US Natural Gas US Natural Gas US Natural Gas US Natural Gas DriversDriversDriversDrivers
2222
Editorial
A fundamentally bear market, but only for the short term.
Two Southeast supply area pipelines, recently back from
maintenance, have boosted output to Q1 �09 highs. Total US dry
NG production jumped to 56.4 Bcf/d from 55 Bcf/d by the end-of-
Sept.
The two pipelines, Fayetteville and Greenville laterals, bring natural
gas from the Woodford and Fayetteville shale plays to the Texas
Gas system for exports to the Midwest and Mid-Atlantic consuming
areas. The the Arkoma (Arkansas � Oklahoma) basin flow � which
include the Woodford shale and part of the Fayetteville shale - has
jumped 0.7 Bcf/d from Sep 27. It now sits at 2.6 Bcf/d as of
yesterday. About 60% of the total Arkoma basin gross production
can be monitored with this sample, so the increase in output in this
region may in fact be more than 1 Bcf/d.
This increase in production is bearish for the short-term, until more
winter demand rebalances the market. The total count of drilling
application permits for September suggests that the US output
should remain steady for the next month and then start rising again,
though at a slower pace than by H2 �08. This contradicts SG
research�s previous forecast of a mid-December 2009 rebound.
Arkansas horizontal drilling permit application count peaked in
August 2009 at 152 and was down to 114 for September. After 12
days in October, the count sits at 52, suggesting that total October
applications may reach August levels. This increase will be
reflected in total Fayetteville shale output as early as mid-
November.
The situation is similar to Louisiana�s Haynesville shale: Drilling
application count peaked at 70 in July and fell by 43% in August. It
remained steady m/m for September at about 40. It now sits at 22
after 12 days in October, possibly the first application count
increase since last summer.
The Rockies and Pennsylvania are the only areas to have increases
in horizontal drilling permit applications for September. The one
exception is Colorado, where September permit application count
is down to 72 from 534 in July �09. Colorado production should
continue to head south for the near term � mainly due to concerns
over the environmental cost of shale extraction. The Rockies
remain the region most hurt by the 2009 price decline, due to
higher marginal production costs than in the rest of the US.
Southeast horizontal drilling application countSoutheast horizontal drilling application countSoutheast horizontal drilling application countSoutheast horizontal drilling application count
0
50
100
150
200
250
300
350
Mar-08 Jun-08 Sep-08 Dec-08 Mar-09 Jun-09 Sep-09
Ar - Vertical Ar - Horizontal
La - Vertical La - Horizontal
Source: ZDM, Inc, SG Commodities Research
Overall, US production is now expected to remain at high levels,
since increases in Southeast and Pennsylvania output will offset
decreases in the Rockies. Nov �09 prices should then correct to the
downside, despite the expected below-normal temperatures for the
next 11 days. The resulting increase in residential demand should
impact the cash market, not futures, but at least will keep storage
facilities from high congestion-related pressure issues.

���� EDITORIAL
US Natural Gas US Natural Gas US Natural Gas US Natural Gas DriversDriversDriversDrivers 13 October 2009
3333
A tighter supply-and-demand balance should arise later in the
winter, after the market: 1/ experiences the first withdrawals of the
heating season, and 2/ gets a better view of Canadian imports. The
November temperature forecast is seasonal, which will spur a
consequent y/y increase in residential demand due to the � slowly -
improving economy. In Canada, cold weather and rising rig count
suggest the start of the winter drilling season. In a few weeks, the
market will have a better idea of how much depletion in
conventional production fields is hurting total Canadian output. For
the short-term, Asia and Europe will remain the main spot LNG
buyers, until a 2010 rebound in US imports.
Given the current large contango along the curve, the expectation
for this tighter winter supply-and-demand balance may already be
priced in levels along the curve. To benefit from the expected
medium term tighter S/D balance, SG Research recommends
buying the March/April spread (Buy March, sell April) � at the right
time of course: The spread fell to 0 cents too early in the season,
and then bounced back to 5 cents with the September rise on the
front of the curve. With the October looser supply and demand
balance, it is expected to fall back to below 0 cents. We see this
move as a buying opportunity since the spread will have to return
to high positive levels to encourage withdrawals, as winter gets
underway.
Mar/April 2010 Spread (USD/MMBtu)Mar/April 2010 Spread (USD/MMBtu)Mar/April 2010 Spread (USD/MMBtu)Mar/April 2010 Spread (USD/MMBtu)
-0.04
-0.02
0
0.02
0.04
0.06
0.08
0.1
Jul-09 Aug-09 Sep-09
Daily Close
Source: NYMEX, SG Commodities Research
���� NATURAL GAS PRICE INFORMATION
13 October 2009 US Natural Gas US Natural Gas US Natural Gas US Natural Gas DriversDriversDriversDrivers 4444
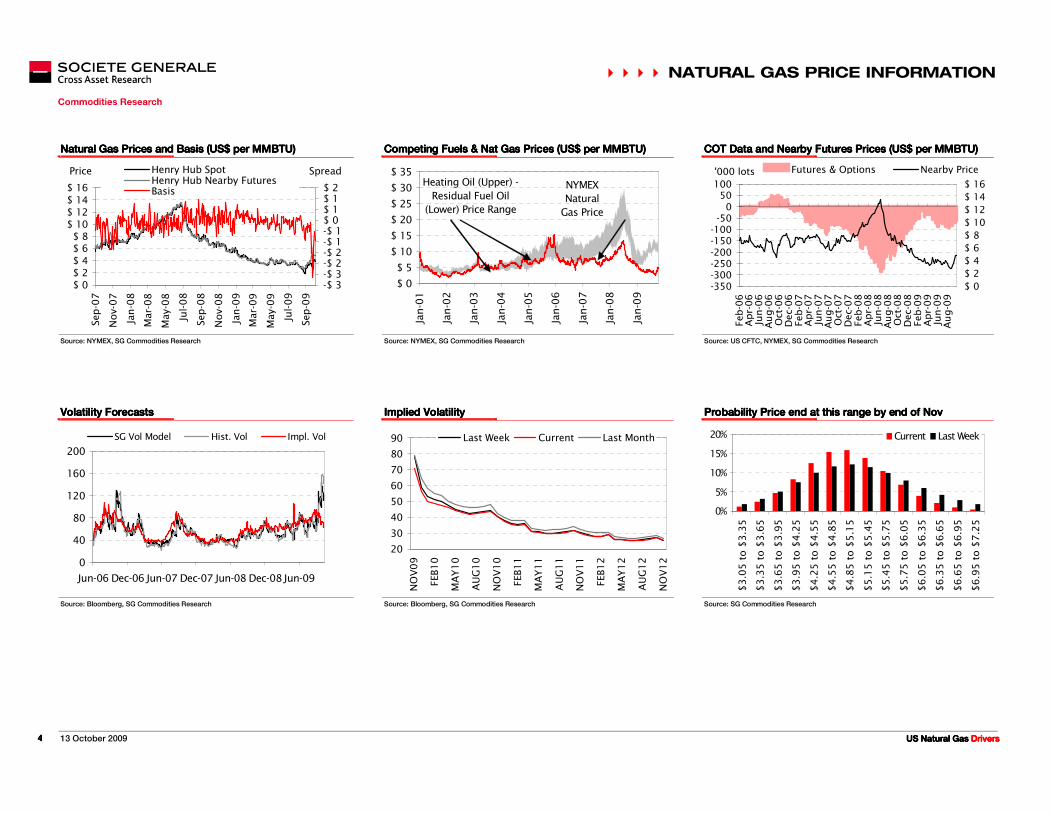
Natural G as Price I nformation
Natural Gas Prices and Basis (US$ per MMBTU)Natural Gas Prices and Basis (US$ per MMBTU)Natural Gas Prices and Basis (US$ per MMBTU)Natural Gas Prices and Basis (US$ per MMBTU) Competing Fuels & Nat Gas Prices (US$ per MMBTU)Competing Fuels & Nat Gas Prices (US$ per MMBTU)Competing Fuels & Nat Gas Prices (US$ per MMBTU)Competing Fuels & Nat Gas Prices (US$ per MMBTU) COT Data and Nearby Futures PricesCOT Data and Nearby Futures PricesCOT Data and Nearby Futures PricesCOT Data and Nearby Futures Prices (US$ per MMBTU) (US$ per MMBTU) (US$ per MMBTU) (US$ per MMBTU)
$ 0$ 2$ 4
$ 6$ 8$ 10$ 12$ 14
$ 16
Sep-07
Nov-07
Jan-08
Mar-08
May-08
Jul-08
Sep-08
Nov-08
Jan-09
Mar-09
May-09
Jul-09
Sep-09
Price
-$ 3-$ 3-$ 2-$ 2-$ 1-$ 1$ 0$ 1$ 1$ 2
SpreadHenry Hub Spot Henry Hub Nearby FuturesBasis
NYMEX
Natural
Gas Price
$ 0
$ 5
$ 10
$ 15
$ 20
$ 25
$ 30
$ 35
Jan
-01
Jan
-02
Jan
-03
Jan
-04
Jan
-05
Jan
-06
Jan
-07
Jan
-08
Jan
-09
Heating Oil (Upper) -
Residual Fuel Oil
(Lower) Price Range
-350-300-250-200-150-100
-500
50100
Feb
-06
Ap
r-0
6Ju
n-0
6A
ug
-06
Oct-
06
Dec-0
6Feb
-07
Ap
r-0
7Ju
n-0
7A
ug
-07
Oct-
07
Dec-0
7Feb
-08
Ap
r-0
8Ju
n-0
8A
ug
-08
Oct-
08
Dec-0
8Feb
-09
Ap
r-0
9Ju
n-0
9A
ug
-09
'000 lots
$ 0
$ 2
$ 4
$ 6
$ 8
$ 10
$ 12
$ 14
$ 16
Futures & Options Nearby Price
Source: NYMEX, SG Commodities Research Source: NYMEX, SG Commodities Research Source: US CFTC, NYMEX, SG Commodities Research
Volatility ForecastsVolatility ForecastsVolatility ForecastsVolatility Forecasts Implied VolatilityImplied VolatilityImplied VolatilityImplied Volatility Probability Price end at this range bProbability Price end at this range bProbability Price end at this range bProbability Price end at this range by end of Novy end of Novy end of Novy end of Nov
0
40
80
120
160
200
Jun-06 Dec-06 Jun-07 Dec-07 Jun-08 Dec-08 Jun-09
SG Vol Model Hist. Vol Impl. Vol
20
30
40
50
60
70
80
90
NO
V0
9
FEB
10
MA
Y1
0
AU
G1
0
NO
V1
0
FEB
11
MA
Y1
1
AU
G1
1
NO
V1
1
FEB
12
MA
Y1
2
AU
G1
2
NO
V1
2
Last Week Current Last Month
0%
5%
10%
15%
20%
$3
.05
to
$3
.35
$3
.35
to
$3
.65
$3
.65
to
$3
.95
$3
.95
to
$4
.25
$4
.25
to
$4
.55
$4
.55
to
$4
.85
$4
.85
to
$5
.15
$5
.15
to
$5
.45
$5
.45
to
$5
.75
$5
.75
to
$6
.05
$6
.05
to
$6
.35
$6
.35
to
$6
.65
$6
.65
to
$6
.95
$6
.95
to
$7
.25
Current Last Week
Source: Bloomberg, SG Commodities Research Source: Bloomberg, SG Commodities Research Source: SG Commodities Research

���� NATURAL GAS PRICE INFORMATION & SUPPLY/DEMAND BALANCE
US Natural Gas US Natural Gas US Natural Gas US Natural Gas DriversDriversDriversDrivers 13 October 2009
5555
Natural G as Price I nformation & Supply/Dem and Balance
Spread NBP (UK) Spread NBP (UK) Spread NBP (UK) Spread NBP (UK) ---- Henry Hub (US) (US$ per Henry Hub (US) (US$ per Henry Hub (US) (US$ per Henry Hub (US) (US$ per MMBTU) MMBTU) MMBTU) MMBTU) Forward CurvesForward CurvesForward CurvesForward Curves US, UK + Shipping Natural Gas Prices (US$ per MMBTU)US, UK + Shipping Natural Gas Prices (US$ per MMBTU)US, UK + Shipping Natural Gas Prices (US$ per MMBTU)US, UK + Shipping Natural Gas Prices (US$ per MMBTU)
-1.0
0.0
1.0
2.0
3.0
4.0
No
v-0
9
Feb
-10
May-1
0
Au
g-1
0
No
v-1
0
Feb
-11
May-1
1
Au
g-1
1
No
v-1
1
Feb
-12
May-1
2
Au
g-1
2
No
v-1
2
Feb
-13
Latest Last Week Last Month
3
4
5
6
7
8
9
NOV09 SEP10 JUL11 MAY12 MAR13 JAN14 NOV14
Latest Last Month Last Week
0
2
4
6
8
10
12
14
16
Oct-
08
No
v-0
8
Dec-0
8
Jan
-09
Feb
-09
Mar-
09
Ap
r-0
9
May-0
9
Jun
-09
Jul-
09
Au
g-0
9
Sep
-09
Oct-
09
UK US UK + cost of shipping
Source: NYMEX, SG Commodities Research Source: Bloomberg, SG Commodities Research Source: NYMEX, SG Commodities Research
Supply and Demand (Bcf/Supply and Demand (Bcf/Supply and Demand (Bcf/Supply and Demand (Bcf/d)d)d)d) Net Supply and DemandNet Supply and DemandNet Supply and DemandNet Supply and Demand Demand in Bcf/d (w/o Bal. Items w/o Mexican Exports)Demand in Bcf/d (w/o Bal. Items w/o Mexican Exports)Demand in Bcf/d (w/o Bal. Items w/o Mexican Exports)Demand in Bcf/d (w/o Bal. Items w/o Mexican Exports)
25
35
45
55
65
20-Jun 20-Jul 20-Aug 20-Sep 20-Oct
SG Supply Estimate SG Demand Estimate
-10
0
10
20
30
20-Jun 20-Jul 20-Aug 20-Sep 20-Oct
2006-2007 2007-2008 2008-2009
25
35
45
55
65
75
20-Jun 20-Jul 20-Aug 20-Sep 20-Oct
2006-2007 2007-2008 2008-2009
Source: Bentek Energy LLC, DOE EIA, SG Commodities Research Source: Bentek Energy LLC, DOE EIA, SG Commodities Research Source: Bentek Energy LLC, DOE EIA, SG Commodities Research

���� SUPPLY COMPONENTS
13 October 2009 US Natural Gas US Natural Gas US Natural Gas US Natural Gas DriversDriversDriversDrivers 6666
Supply Compo nents
Supply (Bcf/d, incl. netting of Mexican Exports)Supply (Bcf/d, incl. netting of Mexican Exports)Supply (Bcf/d, incl. netting of Mexican Exports)Supply (Bcf/d, incl. netting of Mexican Exports) Domestic Production (Bcf/d)Domestic Production (Bcf/d)Domestic Production (Bcf/d)Domestic Production (Bcf/d) Net Imports (Bcf/d)Net Imports (Bcf/d)Net Imports (Bcf/d)Net Imports (Bcf/d)
47
49
51
53
55
57
59
61
63
65
20-Jun 20-Jul 20-Aug 20-Sep 20-Oct
2006-2007 2007-2008 2008-2009
37
39
41
43
45
47
49
51
53
20-Jun 20-Jul 20-Aug 20-Sep 20-Oct
2006-2007 2007-2008 2008-2009
6
8
10
12
14
16
20-Jun 20-Jul 20-Aug 20-Sep 20-Oct
2006-2007 2007-2008 2008-2009
Source: Bentek Energy LLC, DOE EIA, SG Commodities Research Source: Bentek Energy LLC, DOE EIA, SG Commodities Research Source: Bentek Energy LLC, DOE EIA, SG Commodities Research
Net Imports from Canada (Bcf/d)Net Imports from Canada (Bcf/d)Net Imports from Canada (Bcf/d)Net Imports from Canada (Bcf/d) LNG Sendout (Bcf/d)LNG Sendout (Bcf/d)LNG Sendout (Bcf/d)LNG Sendout (Bcf/d) Rig CountsRig CountsRig CountsRig Counts
4
5
6
7
8
9
10
11
12
20-Jun 20-Jul 20-Aug 20-Sep 20-Oct
2006-2007 2007-2008 2008-2009
0
1
2
3
4
20-Jun 20-Jul 20-Aug 20-Sep 20-Oct
2006-2007 2007-2008 2008-2009
0
400
800
1200
1600
2000
2000200120022003200420052006200720082009
North America US Canada
Source: Bentek Energy LLC, DOE EIA, SG Commodities Research Source: Bentek Energy LLC, DOE EIA, SG Commodities Research Source: Baker Hughes, SG Commodities Research

���� DEMAND FORECASTS
US NaturaUS NaturaUS NaturaUS Natural Gas l Gas l Gas l Gas DriversDriversDriversDrivers 13 October 2009
7777
Demand Forecasts
LNG Sendout by Location (MMcf/d)LNG Sendout by Location (MMcf/d)LNG Sendout by Location (MMcf/d)LNG Sendout by Location (MMcf/d) Lower 48 States (Observed) Demand Forecast (Bcf/d)Lower 48 States (Observed) Demand Forecast (Bcf/d)Lower 48 States (Observed) Demand Forecast (Bcf/d)Lower 48 States (Observed) Demand Forecast (Bcf/d) NorthEast (Observed) Demand Forecast (BNorthEast (Observed) Demand Forecast (BNorthEast (Observed) Demand Forecast (BNorthEast (Observed) Demand Forecast (Bcf/d)cf/d)cf/d)cf/d)
0
500
1000
1500
2000
2500
3000
Mar-07 Sep-07 Mar-08 Sep-08 Mar-09 Sep-09
Lake Charles Excelerate
Elba Island Cove Pt
Everett Sabine Pass
34
38
42
29-Sep 4-Oct 9-Oct 14-Oct 19-Oct 24-Oct
2008 Demand 2009 Demand Forecast
5
7
9
11
29-
Sep
6-
Oct
13-
Oct
20-
Oct
2008 Demand 2009 Demand Forecast
Source: Bentek Energy LLC, SG Commodities Research Source: Bentek Energy LLC, SG Commodities Research Source: Bentek Energy LLC, SG Commodities Research
SouthEast (Observed) Demand (Bcf/d)SouthEast (Observed) Demand (Bcf/d)SouthEast (Observed) Demand (Bcf/d)SouthEast (Observed) Demand (Bcf/d) Gulf (Observed) Demand (BcGulf (Observed) Demand (BcGulf (Observed) Demand (BcGulf (Observed) Demand (Bcf/d)f/d)f/d)f/d) Midwest (Observed) Demand (Bcf/d)Midwest (Observed) Demand (Bcf/d)Midwest (Observed) Demand (Bcf/d)Midwest (Observed) Demand (Bcf/d)
5
6
7
8
29-Sep 4-Oct 9-Oct 14-Oct 19-Oct 24-Oct
2008 Demand 2009 Demand Forecast
0
1
2
3
4
5
6
29-Sep 4-Oct 9-Oct 14-Oct 19-Oct 24-Oct
2008 Demand 2009 Demand Forecast
9
10
11
12
13
29-Sep 4-Oct 9-Oct 14-Oct 19-Oct 24-Oct
2008 Demand 2009 Demand Forecast
Source: Bentek Energy LLC, SG Commodities Research Source: Bentek Energy LLC, SG Commodities Research Source: Bentek Energy LLC, SG Commodities Research

���� DEMAND BREAKDOWN & INVENTORY
13 October 2009 US Natural Gas US Natural Gas US Natural Gas US Natural Gas DriversDriversDriversDrivers 8888
Demand Breakdown & I nv entory
WestWestWestWest (Observed) Demand (Bcf/d) (Observed) Demand (Bcf/d) (Observed) Demand (Bcf/d) (Observed) Demand (Bcf/d) Power Demand (Bcf/d)Power Demand (Bcf/d)Power Demand (Bcf/d)Power Demand (Bcf/d) Industrial Demand (Bcf/d)Industrial Demand (Bcf/d)Industrial Demand (Bcf/d)Industrial Demand (Bcf/d)
9
10
11
12
29-Sep 4-Oct 9-Oct 14-Oct 19-Oct 24-Oct
2008 Demand 2009 Demand Forecast
5
15
25
35
Jan Feb Mar Apr May Jun Jul Aug Sep Oct Nov Dec
Power 2006 Power 2007
Power 2008 Power 2009
15
16
17
18
19
20
Jan FebMar Apr May Jun Jul Aug Sep Oct Nov Dec
Industrial 2006 Industrial 2007
Industrial 2008 Industrial 2009
Source: Bentek Energy LLC, SG Commodities Research Source: Bentek Energy LLC, SG Commodities Research Source: Bentek Energy LLC, SG Commodities Research
Residential/Commercial Demand (Bcf/d)Residential/Commercial Demand (Bcf/d)Residential/Commercial Demand (Bcf/d)Residential/Commercial Demand (Bcf/d) US Working Gas Inventory (Bcf)US Working Gas Inventory (Bcf)US Working Gas Inventory (Bcf)US Working Gas Inventory (Bcf) Eastern Region Gas Inventory (Bcf)Eastern Region Gas Inventory (Bcf)Eastern Region Gas Inventory (Bcf)Eastern Region Gas Inventory (Bcf)
0
10
20
30
40
50
60
70
Jan Feb Mar Apr May Jun Jul Aug Sep Oct Nov Dec
Res/Comm/Bal 2006 Res/Comm/Bal 2007
Res/Comm/Bal 2008 Res/Comm/Bal 2009
0
1 000
2 000
3 000
4 000
Jan FebMar Apr May Jun Jul Aug Sep Oct Nov Dec
2004-2008 Range 2004-2008 Average
2008 2009
0
500
1 000
1 500
2 000
2 500
Jan FebMar AprMay Jun Jul AugSep Oct NovDec
2004-2008 Range 2004-2008 Average
2008 2009
Source: Bentek Energy LLC, DOE EIA, SG Commodities Research Source: DOE EIA, SG Commodities Research Source: DOE EIA, SG Commodities Research

���� INVENTORY & WITHDRAWAL
US Natural Gas US Natural Gas US Natural Gas US Natural Gas DriversDriversDriversDrivers 13 October 2009
9999
Inventory & Withdrawal
Western Region Gas Inventory (Bcf)Western Region Gas Inventory (Bcf)Western Region Gas Inventory (Bcf)Western Region Gas Inventory (Bcf) Producing Region Gas Inventory (Bcf)Producing Region Gas Inventory (Bcf)Producing Region Gas Inventory (Bcf)Producing Region Gas Inventory (Bcf) Total Lower 48 States Injection/Withdrawal (Bcf)Total Lower 48 States Injection/Withdrawal (Bcf)Total Lower 48 States Injection/Withdrawal (Bcf)Total Lower 48 States Injection/Withdrawal (Bcf)
100
200
300
400
500
Jan Feb Mar Apr May Jun Jul Aug Sep Oct Nov Dec
2004-2008 Range 2004-2008 Average
2008 2009
0
200
400
600
800
1 000
1 200
1 400
Jan FebMar Apr May Jun Jul Aug Sep Oct Nov Dec
2004-2008 Range 2004-2008 Average
2008 2009
-300-250-200-150-100
-500
50100150
Jan FebMar Apr May Jun Jul Aug Sep Oct Nov Dec
2004-2008 Range 2004-2008 Average
2008 2009
Source: DOE EIA, SG Commodities Research Source: DOE EIA, SG Commodities Research Source: DOE EIA, SG Commodities Research
Producing U.S. Region Injection/Withdrawal (Bcf)Producing U.S. Region Injection/Withdrawal (Bcf)Producing U.S. Region Injection/Withdrawal (Bcf)Producing U.S. Region Injection/Withdrawal (Bcf) Eastern Region Injection/Withdrawal (Bcf)Eastern Region Injection/Withdrawal (Bcf)Eastern Region Injection/Withdrawal (Bcf)Eastern Region Injection/Withdrawal (Bcf) Western U.S. Region Injection/Withdrawal (Bcf)Western U.S. Region Injection/Withdrawal (Bcf)Western U.S. Region Injection/Withdrawal (Bcf)Western U.S. Region Injection/Withdrawal (Bcf)
-100
-50
0
50
100
Jan FebMar Apr May Jun Jul Aug Sep Oct Nov Dec
2004-2008 Range 2004-2008 Average
2008 2009
-200
-150
-100
-50
0
50
100
Jan FebMar Apr May Jun Jul Aug Sep Oct Nov Dec
2004-2008 Range 2004-2008 Average
2008 2009
-40
-30
-20
-10
0
10
20
30
Jan Feb Mar Apr May Jun Jul Aug Sep Oct Nov Dec
2004-2008 Range 2004-2008 Average
2008 2009
Source: DOE EIA, SG Commodities Research Source: DOE EIA, SG Commodities Research Source: DOE EIA, SG Commodities Research

���� WEATHER
13 October 2009 US Natural Gas US Natural Gas US Natural Gas US Natural Gas DriversDriversDriversDrivers 10101010
Weather
Actual v Normal HDD in U.S.Actual v Normal HDD in U.S.Actual v Normal HDD in U.S.Actual v Normal HDD in U.S. Actual v Normal CDD in U.S.Actual v Normal CDD in U.S.Actual v Normal CDD in U.S.Actual v Normal CDD in U.S. Heating/Cooling Demand Forecast (U.S)Heating/Cooling Demand Forecast (U.S)Heating/Cooling Demand Forecast (U.S)Heating/Cooling Demand Forecast (U.S)
0
50
100
150
200
250
Dec-0
5
Mar-
06
Jun
-06
Sep
-06
Dec-0
6
Mar-
07
Jun
-07
Sep
-07
Dec-0
7
Mar-
08
Jun
-08
Au
g-0
8
No
v-0
8
Feb
-09
May-0
9
Au
g-0
9
Normal HDD Actual HDD
0
20
40
60
80
100
120
140
Dec-0
5
Mar-
06
Jun
-06
Sep
-06
Dec-0
6
Mar-
07
Jun
-07
Sep
-07
Dec-0
7
Mar-
08
Jun
-08
Au
g-0
8
No
v-0
8
Feb
-09
May-0
9
Au
g-0
9
Normal CDD Actual CDD
% Difference from Normal
0
10
20
30
40
50
60
70
14-Oct 15-Oct 16-Oct 17-Oct 18-Oct
Source: Bloomberg, SG Commodities Research Source: Bloomberg, SG Commodities Research Source: Dominion Energy Index, Dominion
Heating/Cooling Demand Forecast Heating/Cooling Demand Forecast Heating/Cooling Demand Forecast Heating/Cooling Demand Forecast ---- Central Central Central Central Heating/Cooling Demand Forecast Heating/Cooling Demand Forecast Heating/Cooling Demand Forecast Heating/Cooling Demand Forecast ---- Eastern Eastern Eastern Eastern Heating/Cooling Demand Forecast Heating/Cooling Demand Forecast Heating/Cooling Demand Forecast Heating/Cooling Demand Forecast ---- Western Western Western Western
% Difference from Normal
-50
0
50
100
150
200
14-Oct 15-Oct 16-Oct 17-Oct 18-Oct
Great Lakes Great Plains Lower Mississippi
% Difference from Normal
-50
0
50
100
150
200
250
300
350
400
450
14-Oct 15-Oct 16-Oct 17-Oct 18-Oct
Mid-Atlantic New England South Atlantic
% Difference from Normal
-60
-40
-20
0
20
40
60
80
14-Oct 15-Oct 16-Oct 17-Oct 18-Oct
Pacific Rocky Mountains Southwest
Source: Dominion Energy Index, Dominion Source: Dominion Energy Index, Dominion Source: Dominion Energy Index, Dominion
����TECHNICAL ANALYSIS NATGAS
US Natural Gas US Natural Gas US Natural Gas US Natural Gas DriversDriversDriversDrivers 13 October 2009
11111111
chnical Analysis NatGas
NATURAL GAS NYMEXNATURAL GAS NYMEXNATURAL GAS NYMEXNATURAL GAS NYMEX Technical Analysis SnapshotTechnical Analysis SnapshotTechnical Analysis SnapshotTechnical Analysis Snapshot
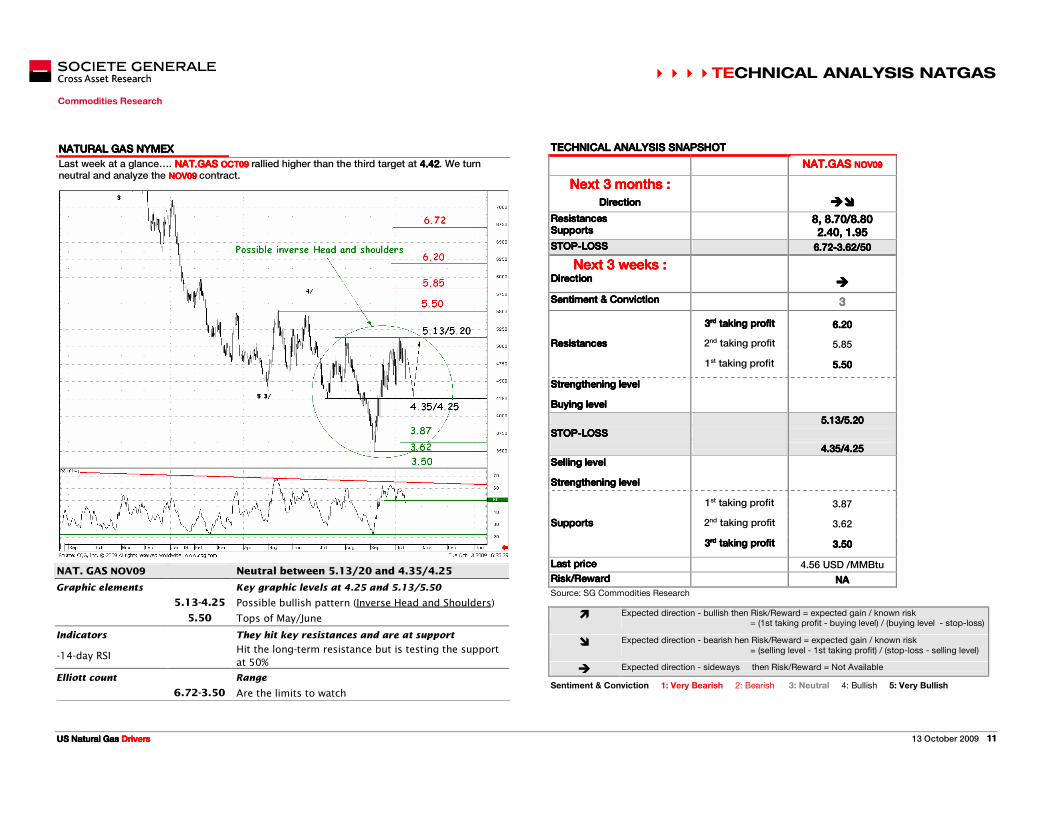
Last week at a glance…. NAT.GAS NAT.GAS NAT.GAS NAT.GAS OCTOCTOCTOCT09090909 rallied higher than the third target at 4.424.424.424.42. We turn neutral and analyze the NOVNOVNOVNOV09090909 contract.
TECHNICAL ANALYSIS SNAPSHOTTECHNICAL ANALYSIS SNAPSHOTTECHNICAL ANALYSIS SNAPSHOTTECHNICAL ANALYSIS SNAPSHOT
NAT.GAS NAT.GAS NAT.GAS NAT.GAS NOV09NOV09NOV09NOV09
Next 3 months :Next 3 months :Next 3 months :Next 3 months :
DirectionDirectionDirectionDirection ��������
ResistancesResistancesResistancesResistances SupportsSupportsSupportsSupports
8, 8.70/8.808, 8.70/8.808, 8.70/8.808, 8.70/8.80 2.40, 1.952.40, 1.952.40, 1.952.40, 1.95
STOPSTOPSTOPSTOP----LOSSLOSSLOSSLOSS 6.726.726.726.72----3.62/503.62/503.62/503.62/50
Next 3 weeks :Next 3 weeks :Next 3 weeks :Next 3 weeks :
DirectionDirectionDirectionDirection ����
Sentiment & ConvictionSentiment & ConvictionSentiment & ConvictionSentiment & Conviction 3333
3333rdrdrdrd taking profit taking profit taking profit taking profit 6.206.206.206.20
ResistancesResistancesResistancesResistances 2nd taking profit 5.85
1st taking profit 5.505.505.505.50
Strengthening levelStrengthening levelStrengthening levelStrengthening level
Buying levelBuying levelBuying levelBuying level
5.13/5.205.13/5.205.13/5.205.13/5.20
STOPSTOPSTOPSTOP----LOSSLOSSLOSSLOSS
4.35/4.254.35/4.254.35/4.254.35/4.25
Selling levelSelling levelSelling levelSelling level
Strengthening levelStrengthening levelStrengthening levelStrengthening level
1st taking profit 3.87
SupportsSupportsSupportsSupports 2nd taking profit 3.62
3333rdrdrdrd taking profit taking profit taking profit taking profit 3.503.503.503.50
Last priceLast priceLast priceLast price 4.56 USD /MMBtu
Risk/RewardRisk/RewardRisk/RewardRisk/Reward NANANANA
Source: SG Commodities Research
� Expected direction - bullish then Risk/Reward = expected gain / known risk = (1st taking profit - buying level) / (buying level - stop-loss)
� Expected direction - bearish hen Risk/Reward = expected gain / known risk = (selling level - 1st taking profit) / (stop-loss - selling level)
� Expected direction - sideways then Risk/Reward = Not Available
Sentiment & Conviction 1: Very Bearish 2: Bearish 3: Neutral 4: Bullish 5: Very Bullish
NAT. GAS NOV09 Neutral between 5.13/20 and 4.35/4.25
Graphic elements Key graphic levels at 4.25 and 5.13/5.50
5.13-4.25 Possible bullish pattern (Inverse Head and Shoulders)
5.50 Tops of May/June
Indicators They hit key resistances and are at support
-14-day RSI Hit the long-term resistance but is testing the support
at 50%
Elliott count Range
6.72-3.50 Are the limits to watch
���� US NATURAL GAS FORECASTS - LAST UPDATED 25/09/09
13 October 2009 XXXXXX XXXXXX XXXXXX XXXXXX YYYYYYYYYYYYYYYYYYYYYYYYYYYYYYYY
12121212
US Natur al Gas Forecasts - Last updated 25/09/09
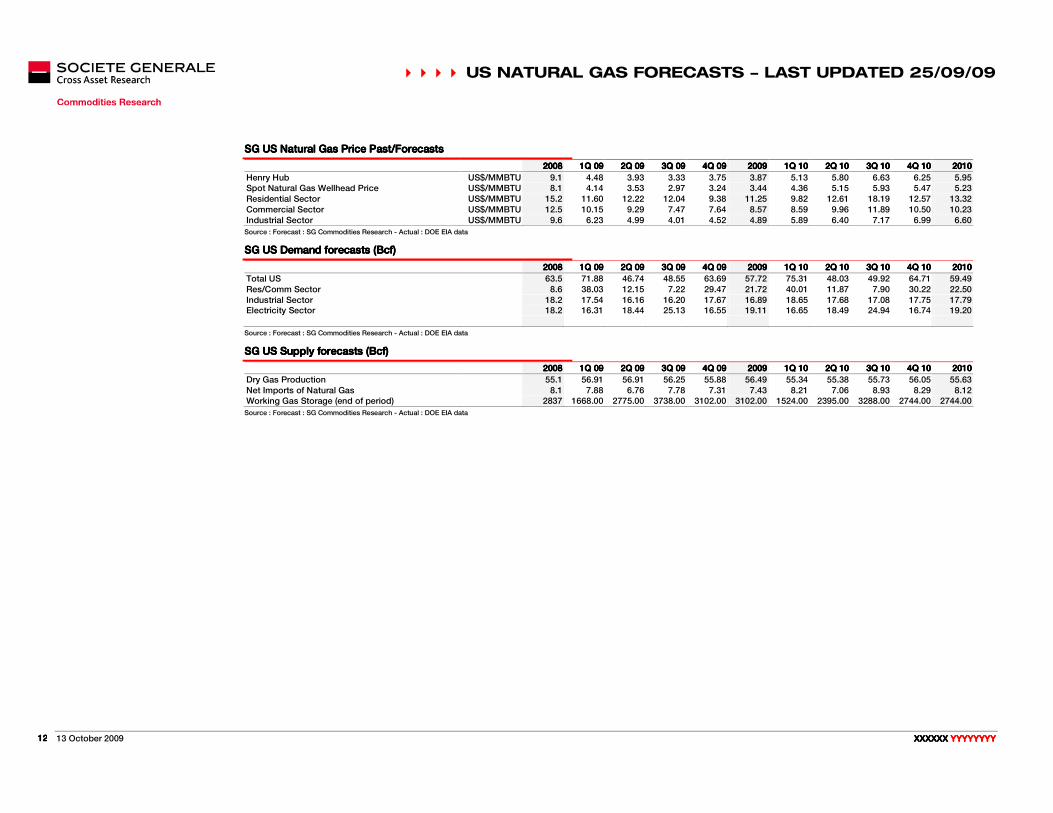
SG US Natural Gas Price Past/ForecastsSG US Natural Gas Price Past/ForecastsSG US Natural Gas Price Past/ForecastsSG US Natural Gas Price Past/Forecasts
2008200820082008 1Q 091Q 091Q 091Q 09 2Q 092Q 092Q 092Q 09 3Q 093Q 093Q 093Q 09 4Q 094Q 094Q 094Q 09 2009200920092009 1Q 101Q 101Q 101Q 10 2Q 102Q 102Q 102Q 10 3Q 103Q 103Q 103Q 10 4Q 104Q 104Q 104Q 10 2010201020102010
Henry Hub US$/MMBTU 9.1 4.48 3.93 3.33 3.75 3.87 5.13 5.80 6.63 6.25 5.95 Spot Natural Gas Wellhead Price US$/MMBTU 8.1 4.14 3.53 2.97 3.24 3.44 4.36 5.15 5.93 5.47 5.23 Residential Sector US$/MMBTU 15.2 11.60 12.22 12.04 9.38 11.25 9.82 12.61 18.19 12.57 13.32 Commercial Sector US$/MMBTU 12.5 10.15 9.29 7.47 7.64 8.57 8.59 9.96 11.89 10.50 10.23 Industrial Sector US$/MMBTU 9.6 6.23 4.99 4.01 4.52 4.89 5.89 6.40 7.17 6.99 6.60
Source : Forecast : SG Commodities Research - Actual : DOE EIA data
SSSSG US Demand forecasts (Bcf)G US Demand forecasts (Bcf)G US Demand forecasts (Bcf)G US Demand forecasts (Bcf)
2008200820082008 1Q 091Q 091Q 091Q 09 2Q 092Q 092Q 092Q 09 3Q 093Q 093Q 093Q 09 4Q 094Q 094Q 094Q 09 2009200920092009 1Q 101Q 101Q 101Q 10 2Q 102Q 102Q 102Q 10 3Q 103Q 103Q 103Q 10 4Q 104Q 104Q 104Q 10 2010201020102010
Total US 63.5 71.88 46.74 48.55 63.69 57.72 75.31 48.03 49.92 64.71 59.49 Res/Comm Sector 8.6 38.03 12.15 7.22 29.47 21.72 40.01 11.87 7.90 30.22 22.50 Industrial Sector 18.2 17.54 16.16 16.20 17.67 16.89 18.65 17.68 17.08 17.75 17.79 Electricity Sector 18.2 16.31 18.44 25.13 16.55 19.11 16.65 18.49 24.94 16.74 19.20
Source : Forecast : SG Commodities Research - Actual : DOE EIA data
SG US SuSG US SuSG US SuSG US Supply forecasts (Bcf)pply forecasts (Bcf)pply forecasts (Bcf)pply forecasts (Bcf)
2008200820082008 1Q 091Q 091Q 091Q 09 2Q 092Q 092Q 092Q 09 3Q 093Q 093Q 093Q 09 4Q 094Q 094Q 094Q 09 2009200920092009 1Q 101Q 101Q 101Q 10 2Q 102Q 102Q 102Q 10 3Q 103Q 103Q 103Q 10 4Q 104Q 104Q 104Q 10 2010201020102010
Dry Gas Production 55.1 56.91 56.91 56.25 55.88 56.49 55.34 55.38 55.73 56.05 55.63 Net Imports of Natural Gas 8.1 7.88 6.76 7.78 7.31 7.43 8.21 7.06 8.93 8.29 8.12 Working Gas Storage (end of period) 2837 1668.00 2775.00 3738.00 3102.00 3102.00 1524.00 2395.00 3288.00 2744.00 2744.00
Source : Forecast : SG Commodities Research - Actual : DOE EIA data

���� ECONOMIC INDICATORS
US Natural Gas US Natural Gas US Natural Gas US Natural Gas DriversDriversDriversDrivers 13 October 2009
13131313
Economic Indi cators
Economic indicatorsEconomic indicatorsEconomic indicatorsEconomic indicators
GMTGMTGMTGMT PeriodPeriodPeriodPeriod LastLastLastLast SG SG SG SG FcstFcstFcstFcst ConsConsConsCons
During the weekDuring the weekDuring the weekDuring the week
CH Actual FDI YTD (% YoY) SEP -17.5 na na
Foreign Exchange Reserves, USD SEP 2131.61 na na
Money Supply - M2 (% YoY) SEP 28.5 na 28.4
New Yuan Loans, bln SEP 410.4 na 420.0
JN BOJ to Hold Regular Policy Board Meeting
Monday12Monday12Monday12Monday12----OctOctOctOct----2009200920092009
IN Industrial Production (% YoY) AUG 6.8 na 9.7
SW AMV Unemployment Rate, % 8:00 SEP 5.4 na 5.4
US Treasury's Krueger Speaks to Economists in St. Louis
17:00
NZ Retail Sales (% MoM) 21:45 AUG -0.5 na 0.5
Retail Sales Ex-Auto (% MoM) 21:45 AUG -0.5 na 0.5
Tuesday13Tuesday13Tuesday13Tuesday13----OctOctOctOct----2009200920092009
CH Business Climate Index 3Q 115.9 na na
Entrepreneur Confidence Index 3Q 110.2 na na
UK BRC Retail Sales Monitor (00:01 BST) 23:01 SEP
RICS House Price Balance, % (00:01 BST) 23:01 SEP 10.7 na 15.0
JN Bank Lending (% YoY) (00:50 BST) 23:50 SEP 1.8 na 1.7
Bank Lending Banks (% YoY) (00:50 BST) 23:50 SEP 1.9 na
Money Stock M2 (% YoY) (00:50 BST) 23:50 SEP 2.8 na 2.9
BoJ Monetary Policy Meeting 4:00
FR Consumer Price Index (% MoM) 6:45 SEP 0.5 -0.1 -0.1
Consumer Price Index (% YoY) 6:45 SEP -0.2 -0.2 -0.2
CPI - EU Harmonised (% MoM) 6:45 SEP 0.6 0.0 0.0
CPI - EU Harmonised (% YoY) 6:45 SEP -0.2 -0.2 -0.3
CPI Ex Tobacco Index 6:45 SEP 118.41 118.35 na
Current Account, EUR bln 6:45 AUG -1.2 na na
SP House transactions (% YoY) 7:00 AUG -20.3 na na
SW CPI - Headline Rate (% MoM) 7:30 SEP 0.2 na 0.4
CPI - Headline Rate (% YoY) 7:30 SEP -0.8 na -1.4
UK Core CPI (% YoY) 8:30 SEP 1.8 na 1.7
CPI (% MoM) 8:30 SEP 0.4 0.1 0.2
CPI (% YoY) 8:30 SEP 1.6 1.1 1.3
DCLG House Prices (% YoY) 8:30 AUG -8.3 na na
RPI (% YoY) 8:30 SEP -1.3 na -1.5
RPI Ex Mort Int.Payments (% YoY) 8:30 SEP 1.4 na 1.2
GE Zew Survey (Current Situation) 9:00 OCT -74 -68 -68.3
Zew Survey (Econ. Sentiment) 9:00 OCT 57.7 50 59.0
US White House's Romer Speaks to Economists in St. Louis
12:30
Fed's Kohn Speaks to Economists in St. Louis 17:00
New York Fed's Dudley Speaks to International Bankers in NYC
17:15
ABC Consumer Confidence 21:00 OCT-11 -45.0 na na
���� ECONOMIC INDICATORS
13 October 2009 US Natural US Natural Gas US Natural US Natural Gas US Natural US Natural Gas US Natural US Natural Gas DriversDriversDriversDrivers
14141414
Economic indicatorsEconomic indicatorsEconomic indicatorsEconomic indicators
GMTGMTGMTGMT PeriodPeriodPeriodPeriod LastLastLastLast SG FcstSG FcstSG FcstSG Fcst ConsConsConsCons
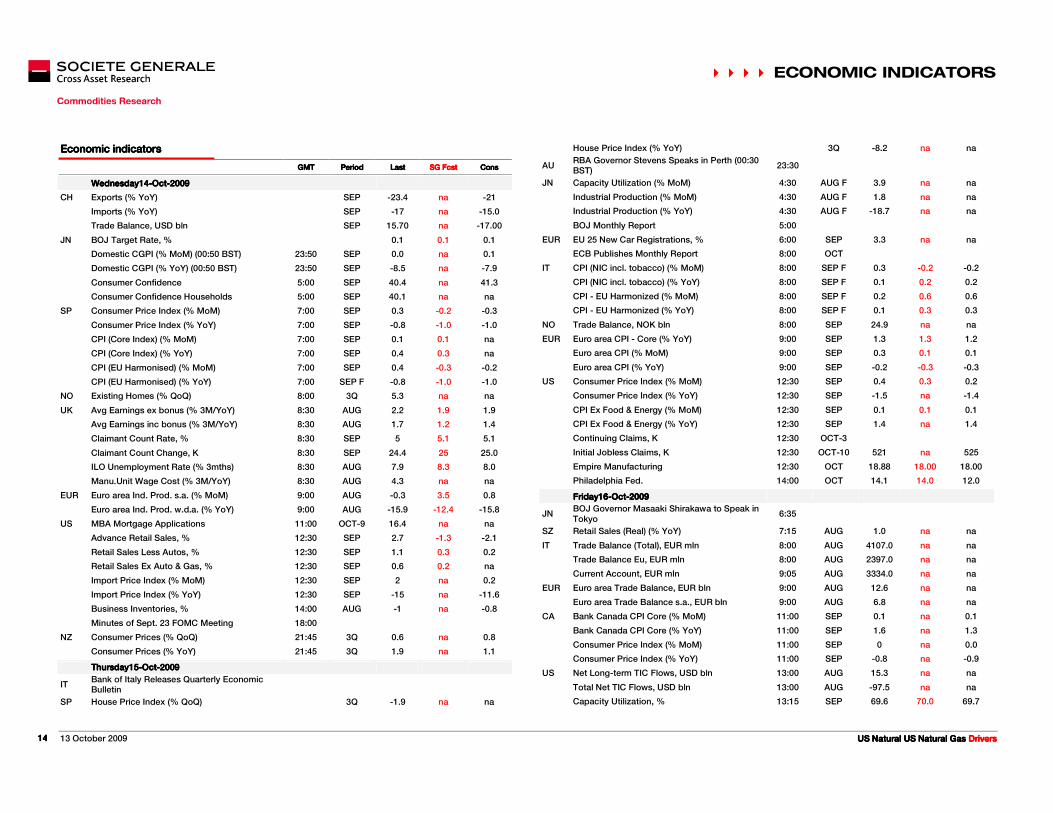
Wednesday14Wednesday14Wednesday14Wednesday14----OctOctOctOct----2009200920092009
CH Exports (% YoY) SEP -23.4 na -21
Imports (% YoY) SEP -17 na -15.0
Trade Balance, USD bln SEP 15.70 na -17.00
JN BOJ Target Rate, % 0.1 0.1 0.1
Domestic CGPI (% MoM) (00:50 BST) 23:50 SEP 0.0 na 0.1
Domestic CGPI (% YoY) (00:50 BST) 23:50 SEP -8.5 na -7.9
Consumer Confidence 5:00 SEP 40.4 na 41.3
Consumer Confidence Households 5:00 SEP 40.1 na na
SP Consumer Price Index (% MoM) 7:00 SEP 0.3 -0.2 -0.3
Consumer Price Index (% YoY) 7:00 SEP -0.8 -1.0 -1.0
CPI (Core Index) (% MoM) 7:00 SEP 0.1 0.1 na
CPI (Core Index) (% YoY) 7:00 SEP 0.4 0.3 na
CPI (EU Harmonised) (% MoM) 7:00 SEP 0.4 -0.3 -0.2
CPI (EU Harmonised) (% YoY) 7:00 SEP F -0.8 -1.0 -1.0
NO Existing Homes (% QoQ) 8:00 3Q 5.3 na na
UK Avg Earnings ex bonus (% 3M/YoY) 8:30 AUG 2.2 1.9 1.9
Avg Earnings inc bonus (% 3M/YoY) 8:30 AUG 1.7 1.2 1.4
Claimant Count Rate, % 8:30 SEP 5 5.1 5.1
Claimant Count Change, K 8:30 SEP 24.4 25 25.0
ILO Unemployment Rate (% 3mths) 8:30 AUG 7.9 8.3 8.0
Manu.Unit Wage Cost (% 3M/YoY) 8:30 AUG 4.3 na na
EUR Euro area Ind. Prod. s.a. (% MoM) 9:00 AUG -0.3 3.5 0.8
Euro area Ind. Prod. w.d.a. (% YoY) 9:00 AUG -15.9 -12.4 -15.8
US MBA Mortgage Applications 11:00 OCT-9 16.4 na na
Advance Retail Sales, % 12:30 SEP 2.7 -1.3 -2.1
Retail Sales Less Autos, % 12:30 SEP 1.1 0.3 0.2
Retail Sales Ex Auto & Gas, % 12:30 SEP 0.6 0.2 na
Import Price Index (% MoM) 12:30 SEP 2 na 0.2
Import Price Index (% YoY) 12:30 SEP -15 na -11.6
Business Inventories, % 14:00 AUG -1 na -0.8
Minutes of Sept. 23 FOMC Meeting 18:00
NZ Consumer Prices (% QoQ) 21:45 3Q 0.6 na 0.8
Consumer Prices (% YoY) 21:45 3Q 1.9 na 1.1
ThursdayThursdayThursdayThursday15151515----OctOctOctOct----2009200920092009
IT Bank of Italy Releases Quarterly Economic Bulletin
SP House Price Index (% QoQ) 3Q -1.9 na na
House Price Index (% YoY) 3Q -8.2 na na
AU RBA Governor Stevens Speaks in Perth (00:30 BST)
23:30
JN Capacity Utilization (% MoM) 4:30 AUG F 3.9 na na
Industrial Production (% MoM) 4:30 AUG F 1.8 na na
Industrial Production (% YoY) 4:30 AUG F -18.7 na na
BOJ Monthly Report 5:00
EUR EU 25 New Car Registrations, % 6:00 SEP 3.3 na na
ECB Publishes Monthly Report 8:00 OCT
IT CPI (NIC incl. tobacco) (% MoM) 8:00 SEP F 0.3 -0.2 -0.2
CPI (NIC incl. tobacco) (% YoY) 8:00 SEP F 0.1 0.2 0.2
CPI - EU Harmonized (% MoM) 8:00 SEP F 0.2 0.6 0.6
CPI - EU Harmonized (% YoY) 8:00 SEP F 0.1 0.3 0.3
NO Trade Balance, NOK bln 8:00 SEP 24.9 na na
EUR Euro area CPI - Core (% YoY) 9:00 SEP 1.3 1.3 1.2
Euro area CPI (% MoM) 9:00 SEP 0.3 0.1 0.1
Euro area CPI (% YoY) 9:00 SEP -0.2 -0.3 -0.3
US Consumer Price Index (% MoM) 12:30 SEP 0.4 0.3 0.2
Consumer Price Index (% YoY) 12:30 SEP -1.5 na -1.4
CPI Ex Food & Energy (% MoM) 12:30 SEP 0.1 0.1 0.1
CPI Ex Food & Energy (% YoY) 12:30 SEP 1.4 na 1.4
Continuing Claims, K 12:30 OCT-3
Initial Jobless Claims, K 12:30 OCT-10 521 na 525
Empire Manufacturing 12:30 OCT 18.88 18.00 18.00
Philadelphia Fed. 14:00 OCT 14.1 14.0 12.0
Friday16Friday16Friday16Friday16----OctOctOctOct----2009200920092009
JN BOJ Governor Masaaki Shirakawa to Speak in Tokyo
6:35
SZ Retail Sales (Real) (% YoY) 7:15 AUG 1.0 na na
IT Trade Balance (Total), EUR mln 8:00 AUG 4107.0 na na
Trade Balance Eu, EUR mln 8:00 AUG 2397.0 na na
Current Account, EUR mln 9:05 AUG 3334.0 na na
EUR Euro area Trade Balance, EUR bln 9:00 AUG 12.6 na na
Euro area Trade Balance s.a., EUR bln 9:00 AUG 6.8 na na
CA Bank Canada CPI Core (% MoM) 11:00 SEP 0.1 na 0.1
Bank Canada CPI Core (% YoY) 11:00 SEP 1.6 na 1.3
Consumer Price Index (% MoM) 11:00 SEP 0 na 0.0
Consumer Price Index (% YoY) 11:00 SEP -0.8 na -0.9
US Net Long-term TIC Flows, USD bln 13:00 AUG 15.3 na na
Total Net TIC Flows, USD bln 13:00 AUG -97.5 na na
Capacity Utilization, % 13:15 SEP 69.6 70.0 69.7

���� ECONOMIC INDICATORS
US Natural Gas US Natural Gas US Natural Gas US Natural Gas DriversDriversDriversDrivers 13 October 2009
15151515
Industrial Production, % 13:15 SEP 0.8 0.3 0.1
U. of Michigan Confidence 14:00 OCT P 73.5 75.0 73.5
���� TRADING CONTACTS
13 October 2009 US Natural Gas US Natural Gas US Natural Gas US Natural Gas DriversDriversDriversDrivers
16161616
Trading Contacts
COMMODITIESCOMMODITIESCOMMODITIESCOMMODITIES RESEARCH RESEARCH RESEARCH RESEARCH COMMODITY MARKETINGCOMMODITY MARKETINGCOMMODITY MARKETINGCOMMODITY MARKETING
HeaHeaHeaHeadddd HeadHeadHeadHead
Dr. Frederic LasserreDr. Frederic LasserreDr. Frederic LasserreDr. Frederic Lasserre (33) 1 42 13 44 06 Xavier LannegraceXavier LannegraceXavier LannegraceXavier Lannegrace (33) 1 42 13 88 10 ParisParisParisParis ParisParisParisParis HoustonHoustonHoustonHouston Carbon & Coal Energy Energy
Dr. Emmanuel Fages (33) 1 42 13 30 29 [email protected] (33) 1 42 13 90 35 [email protected] (1) 713 759 63 60 Oil & Products / Cross Commodity Strategy Metals, Steel CalgaryCalgaryCalgaryCalgary
Remy Penin (33) 1 42 13 55 74 [email protected] (33) 1 42 13 88 10 [email protected] Energy
Agricultural Commodities [email protected] (1) 403 698 89 10 Emmanuel Jayet (33) 1 42 13 57 03 Investors [email protected] (33) 1 42 13 69 59 HongHongHongHong----KongKongKongKong Energy Special Advisor
Sadek Boussena (33) 1 42 14 59 11 LondonLondonLondonLondon Energy, Metals, Steel [email protected] (852) 2166 5515 LondonLondonLondonLondon Energy, Plastics
[email protected] (44) 207 867 87 21 Cross Commodity Technical Analysis
Stephanie Aymes (44) 207 762 58 98 Plastics & Steel Specialist Sebastian Castelli (44) 207 762 52 75 Oil & Products
Michael Wittner (44) 207 762 57 25 Metals [email protected] (44) 207 867 87 21 Cross Commodity Strategy
Jesper Dannesboe (44) 207 762 56 03 New YorkNew YorkNew YorkNew York Metals Energy
David Wilson (44) 207 762 53 84 [email protected] (1) 212 278 56 08 New YorkNew YorkNew YorkNew York Base Metals, Steel [email protected] (1) 212 278 56 61 US Natural Gas
Laurent Key (1) 212 278 57 36 Precious Metals [email protected] (1) 212 278 56 61 Société GénéraleSociété GénéraleSociété GénéraleSociété Générale Corporate & Investment BankingCorporate & Investment BankingCorporate & Investment BankingCorporate & Investment Banking Plastics Tours Société Générale
[email protected] (1) 212 278 56 08 17, cours Valmy 92972 Paris - La Défense Cedex Email:Email:Email:Email: Please click on the analyst name Investors France
([email protected]) [email protected] (1) 212 278 62 55 www.commodities.sgcib.comwww.commodities.sgcib.comwww.commodities.sgcib.comwww.commodities.sgcib.com

���� DISCLAIMER
US Natural Gas US Natural Gas US Natural Gas US Natural Gas DriversDriversDriversDrivers 13 October 2009
17171717
The information herein is not intended to be an offer to buy or sell, or a solicitation of an offer to buy or sell, any securities and including any expression of opinion, has been obtained from or is based upon sources believed to be reliable but is not guaranteed as to accuracy or completeness although Société Générale (�SG�) believe it to be fair and not misleading or deceptive. SG, and their affiliated companies in the SG Group, may from time to time deal in, profit from the trading of, hold or act as market-makers or act as advisers, brokers or bankers in relation to the securities, or derivatives thereof, of persons, firms or entities mentioned in this document or be represented on the board of such persons, firms or entities. Employees of SG, and their affiliated companies in the SG Group, or individuals connected to them may from time to time have a position in or be holding any of the investments or related investments mentioned in this document. SG and their affiliated companies in the SG Group are under no obligation to disclose or take account of this document when advising or dealing with or for their customers. The views of SG reflected in this document may change without notice. To the maximum extent possible at law, SG does not accept any liability whatsoever arising from the use of the material or information contained herein. Dealing in warrants and/or
derivative products such as futures, options, and contracts for differences has specific risks and other significant aspects. You should not deal in these products unless you understand their nature and the extent of your exposure to risk. This research document
is not intended for use by or targeted at retail customers. Should a retail customer obtain a copy of this report they should not base their investment decisions solely on the basis of this document but must seek independent financial advice. Important Notice: The circumstances in which this publication has been produced are such (for example because of reporting or remuneration structures or the physical location of the author of the material), that it is not appropriate to characterise it as independent investment
research as referred to in European MIF directive and that it should be treated as a marketing material even if it contains a research recommendation (« recommandation d�investissement à caractère promotionnel »). This publication is also not subject to any prohibition on
dealing ahead of the dissemination of investment research. However, it must be made clear that all publications issued by SG will be clear, fair, and not misleading. Analyst Certification: Each author of this research report hereby certifies that the views expressed in the research report accurately reflect his or her personal views about any and all of the subject securities or issuers.
Notice to French Investors: This publication is issued in France by or through Société Générale ("SG") which is authorised by the CECEI and regulated by the AMF (Autorité des Marchés Financiers). Notice to UK Investors: This publication is issued in the United Kingdom by or through Société Générale ("SG") London Branch which is regulated by the Financial Services Authority ("FSA") for the conduct of its UK business.
Notice to US Investors: This report is issued solely to major US institutional investors pursuant to SEC Rule 15a-6. Any US person wishing to discuss this report or effect transactions in any security discussed herein should do so with or through SG Americas Securities, LLC to
conform with the requirements of US securities law. SG Americas Securities, LLC, 1221 Avenue of the Americas, New York, NY, 10020. (212) 278-6000. Some of the securities mentioned herein may not be qualified for sale under the securities laws of certain states, except for unsolicited orders. Customer purchase orders made on the basis of this report cannot be considered to be unsolicited by SG Americas Securities, LLC and therefore may not be accepted by SG Americas Securities, LLC investment executives unless the security is qualified for sale in the state. Notice to Japanese Investors: This report is distributed in Japan by Société Générale Securities (North Pacific) Ltd., Tokyo Branch, which is regulated by the Financial Services Agency of Japan. The products mentioned in this report may not be eligible for sale in Japan and
they may not be suitable for all types of investors. Notice to Australian Investors: Société Générale Australia Branch (ABN 71 092 516 286) (SG) takes responsibility for publishing this document. SG holds an AFSL no. 236651 issued under the Corporations Act 2001 (Cth) ("Act"). The information contained in this newsletter is
only directed to recipients who are aware they are wholesale clients as defined under the Act. http://www.sgcib.com. Copyright: The Société Générale Group 2009. All rights reserved.