Embed Size (px)
Citation preview
PRESS RELATIONS LAETITIA MAUREL +33(0)1 42 13 88 68 [email protected]
HELENE AGABRIEL +33(0)1 41 45 98 33 [email protected] NATHALIE BOSCHAT +33(0)1 42 14 83 21 [email protected]
ASTRID BRUNINI +33(0)1 42 13 68 71 [email protected] ANTOINE LHERITIER +33(0)1 42 13 68 99 [email protected]
SOCIETE GENERALE COMM/PRS 75886 PARIS CEDEX 18 SOCIETEGENERALE.COM A FRENCH CORPORATION WITH SHARE CAPITAL OF EUR 998,320,373.75 552 120 222 RCS PARIS
1
Ost of ri
QUARTERLY FINANCIAL INFORMATION
Paris, November 7th 2013
Q3 2013: SOLID GROUP PERFORMANCE
Core Tier 1 ratio (Basel 3): 9.9% NBI: EUR 5.7bn (+14.3%* vs. Q3 12)
Business revenues up +3.8%* vs. Q3 12, evenly-balanced contribution from the three pillars
Significant progress in the cost-cutting plan: EUR 260m of savings secured for one-off transformation costs of EUR -170m
Cost of risk(1) stable at 69 basis points Book Group net income: EUR 534m, a sixfold increase vs. Q3 12
Group net income**: EUR 976m (+14.3% vs. Q3 12) ROE**: 8.5% in Q3 13
Exclusive negotiations initiated for the purchase of Newedge, continued refocusing of the businesses
9M 13: GROUP NET INCOME** OF EUR 2,934m (+4.3% vs. 9M 12), BUSINESSES’ GROSS OPERATING INCOME UP +10.5%* vs. 9M 12
Book Group net income: EUR 1.9bn (EUR 1.3bn in 9M 12) Stable cost to income ratio** vs. 9M 12 ROE**: 8.6% in 9M 13
EPS(2): EUR 2.12
* When adjusted for changes in Group structure and at constant exchange rates ** Excluding non-economic items (revaluation of own financial liabilities), legacy assets, and non-recurring items. See methodology note No. 8. Items relating to the results for 2012 have been restated due to the implementation of the revised IAS 19: the change in accounting method involves the adjustment of data for the previous year.
(1) Excluding litigation issues, legacy assets in respect of assets at the beginning of the period. Cost of risk: 67bp in Q2 13 and 71bp in Q3 12. (2) After deducting interest, net of tax effect, to be paid to holders of deeply subordinated notes and undated subordinated notes for 9M 13 (respectively
EUR 190 million and EUR 43 million). At end-September 2013, the capital gain net of tax and accrued unpaid interest relating to buybacks of deeply subordinated notes was nil. See methodology note No. 3.
2/26
The Board of Directors of Societe Generale met on November 6th, 2013 and examined the Group’s financial statements for Q3 and the first 9 months of 2013. Q3 net banking income and Group net income amounted to respectively EUR 5,728 million (+14.3%* vs. Q3 12) and EUR 534 million (a sixfold increase vs. Q3 12). When restated for non-economic items, non-recurring items and legacy assets(1), net banking income and Group net income amounted to respectively EUR 5,898 million and EUR 976 million in Q3, generating a ROE of 8.5%**. For the first 9 months of the year, net banking income totalled EUR 17,049 million (stable* vs. the previous year) and Group net income EUR 1,853 million (vs. EUR 1,261 million in 9M 12). When restated for non-economic items, non-recurring items and legacy assets(1), net banking income and Group net income amounted to respectively EUR 18,274 million and EUR 2,934 million. The Group has continued with its transformation, rolling out a new organisational set-up focused on its three pillars of excellence: the French Networks, whose structure is unchanged; International Banking & Financial Services (IBFS), which encompasses the activities of the International Retail Banking and Specialised Financial Services & Insurance divisions; Global Banking & Investor Solutions (GBIS), incorporating the activities of Corporate & Investment Banking and the Private Banking, Global Investment Management & Services division. They benefit from an evenly-balanced capital allocation, which is reflected in their respective contribution to earnings. This new organisational set-up will strengthen the revenue and cost synergies between the businesses, with the more effective integration of the customer services offering and simplified internal operating methods. At the same time, Societe Generale has proactively pursued the refocusing of its business portfolio and the optimisation of allocated capital, by refinining its model. Accordingly, the Group has consolidated its positions in Russia through the planned purchase of VTB’s share in Rosbank. Private Banking activities in Japan have been sold. Finally, Societe Generale has entered into exclusive negotiations to acquire 100% of Newedge. This will enable it to broaden its services offering from the execution of transactions to post-trade (clearing operations and associated services), and intensify its presence in the Americas and Asia regions. The businesses have demonstrated their ability to adapt, with revenues up +3.8%* vs. Q3 12. This constitutes a good performance given the environment. The French Networks posted solid revenues (+2.0% excluding PEL/CEL provisions vs. Q3 12), underpinned by dynamic deposit inflow, against the backdrop of weak credit demand. IBFS net banking income grew +2.7%* overall, with record revenues in Specialised Financial Services & Insurance. Within the GBIS pillar, net banking income rose +7.2%*, with comparable growth* in Corporate & Investment Banking and in the Private Banking, Global Investment Management & Services division. Operating expenses were down -0.9% vs. Q3 12. All in all, the businesses’ gross operating income improved by +0.6%* in Q3 13 vs. Q3 12. At the same time, the cost savings plan announced at the beginning of the year has now helped secure EUR 260 million of recurring savings by 2015 (cumulative total at end-September 2013), for cumulative one-off transformation costs of EUR -170 million at end-September 2013. The commercial cost of risk, measured in basis points(2) was stable at 69 basis points in Q3 13 (67 basis points in Q2 13), whereas the coverage ratio increased to 79% (+1 point).
(1) Non-economic items, non-recurring items and legacy assets: EUR -170 million in net banking income in Q3 13 (including the revaluation of own financial liabilities for EUR -223 million, legacy assets for EUR +61 million); in operating expenses: EUR -22 million in Q3 13 (legacy assets); net cost of risk in Q3 13: EUR -354 million, including a collective provision for litigation issues EUR -200 million and legacy assets EUR -154 million. In 9M 13, total in net banking income: EUR -1,225 million (including EUR -1,215 million for the revaluation of own financial liabilities); operating expenses: EUR -52 million for legacy assets; EUR +433 million in respect of disposals or write-downs related to subsidiaries or shareholdings (including NSGB EUR +417 million and TCW EUR +24 million); net cost of risk EUR -720 million, including collective provisions for litigation issues EUR -400 million and legacy assets EUR -320 million. Details and 2012 data in methodology note No. 8. (2) Annualised, excluding litigation issues and legacy assets, in respect of assets at the beginning of the period.
3/26
The Group’s fully loaded “Basel 3” Core Tier 1 ratio stood at 9.9%(1) at the end of the quarter, a significant increase of +51 basis points, due to the earnings contribution and the ongoing reduction in the legacy asset portfolio. Under “Basel 2.5”, it amounted to 11.6%(2). Commenting on the Group’s results for Q3 2013, Frédéric Oudéa – Chairman and CEO – stated: “With underlying Group net income of EUR 976 million in Q3 and approximately EUR 3 billion in the first 9 months of 2013, and a ROE of 8.6%, Societe Generale’s businesses have once again demonstrated their ability to adapt to a rapidly changing environment. The Group is supported by a solid financial structure that now meets all the Basel 3 regulatory requirements. The second phase of transformation is under way. It will enable us to deliver medium-term growth and profitability, with a ROE target of 10% by end-2015. The Group will continue to reinforce and optimise its Universal Banking model centred around the customer. The implementation of a new, refocused and simplified, organisational set-up will help improve the Group’s efficiency by strengthening the synergies between the businesses.”
(1) Pro-forma fully loaded Basel 3 Core Tier 1 ratio, based on our understanding of the CRR/CRD4 rules published on June 26th, 2013, including the Danish compromise. Basel 2.5 Core Tier 1 ratio calculated according to EBA Basel 2.5 standards (Basel 2 standards incorporating CRD3 requirements) (2) It was 10.3% in Q3 12.
4/26
1 - GROUP CONSOLIDATED RESULTS CONSOLIDATED INCOME STATEMENT (in EUR millions)
French Networks
International Banking and
Financial Services
Global Banking and Investor
Solutions
Corporate Centre Group
Q3 13 Change
Q3 vs. Q3
Q3 13 Change
Q3 vs. Q3
Q3 13 Change
Q3 vs. Q3
Q3 13 Change
Q3 vs. Q3
Q3 13 Change
Q3 vs. Q3
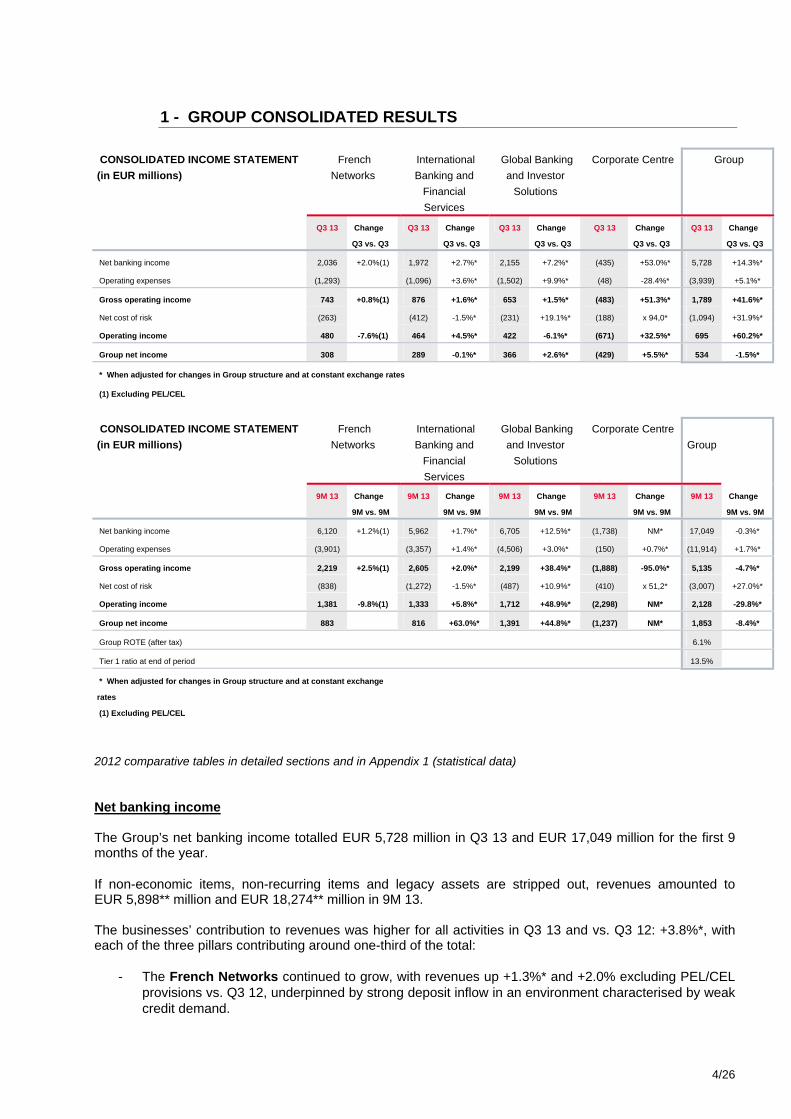
Net banking income 2,036 +2.0%(1) 1,972 +2.7%* 2,155 +7.2%* (435) +53.0%* 5,728 +14.3%*
Operating expenses (1,293) (1,096) +3.6%* (1,502) +9.9%* (48) -28.4%* (3,939) +5.1%*
Gross operating income 743 +0.8%(1) 876 +1.6%* 653 +1.5%* (483) +51.3%* 1,789 +41.6%*
Net cost of risk (263) (412) -1.5%* (231) +19.1%* (188) x 94,0* (1,094) +31.9%*
Operating income 480 -7.6%(1) 464 +4.5%* 422 -6.1%* (671) +32.5%* 695 +60.2%*
Group net income 308 289 -0.1%* 366 +2.6%* (429) +5.5%* 534 -1.5%*
* When adjusted for changes in Group structure and at constant exchange rates
(1) Excluding PEL/CEL
CONSOLIDATED INCOME STATEMENT (in EUR millions)
French Networks
International Banking and
Financial Services
Global Banking and Investor
Solutions
Corporate Centre Group
9M 13 Change
9M vs. 9M
9M 13 Change
9M vs. 9M
9M 13 Change
9M vs. 9M
9M 13 Change
9M vs. 9M
9M 13 Change
9M vs. 9M
Net banking income 6,120 +1.2%(1) 5,962 +1.7%* 6,705 +12.5%* (1,738) NM* 17,049 -0.3%*
Operating expenses (3,901) (3,357) +1.4%* (4,506) +3.0%* (150) +0.7%* (11,914) +1.7%*
Gross operating income 2,219 +2.5%(1) 2,605 +2.0%* 2,199 +38.4%* (1,888) -95.0%* 5,135 -4.7%*
Net cost of risk (838) (1,272) -1.5%* (487) +10.9%* (410) x 51,2* (3,007) +27.0%*
Operating income 1,381 -9.8%(1) 1,333 +5.8%* 1,712 +48.9%* (2,298) NM* 2,128 -29.8%*
Group net income 883 816 +63.0%* 1,391 +44.8%* (1,237) NM* 1,853 -8.4%*
Group ROTE (after tax) 6.1%
Tier 1 ratio at end of period 13.5%
* When adjusted for changes in Group structure and at constant exchange
rates
(1) Excluding PEL/CEL 2012 comparative tables in detailed sections and in Appendix 1 (statistical data) Net banking income The Group’s net banking income totalled EUR 5,728 million in Q3 13 and EUR 17,049 million for the first 9 months of the year. If non-economic items, non-recurring items and legacy assets are stripped out, revenues amounted to EUR 5,898** million and EUR 18,274** million in 9M 13. The businesses’ contribution to revenues was higher for all activities in Q3 13 and vs. Q3 12: +3.8%*, with each of the three pillars contributing around one-third of the total:
- The French Networks continued to grow, with revenues up +1.3%* and +2.0% excluding PEL/CEL provisions vs. Q3 12, underpinned by strong deposit inflow in an environment characterised by weak credit demand.
5/26
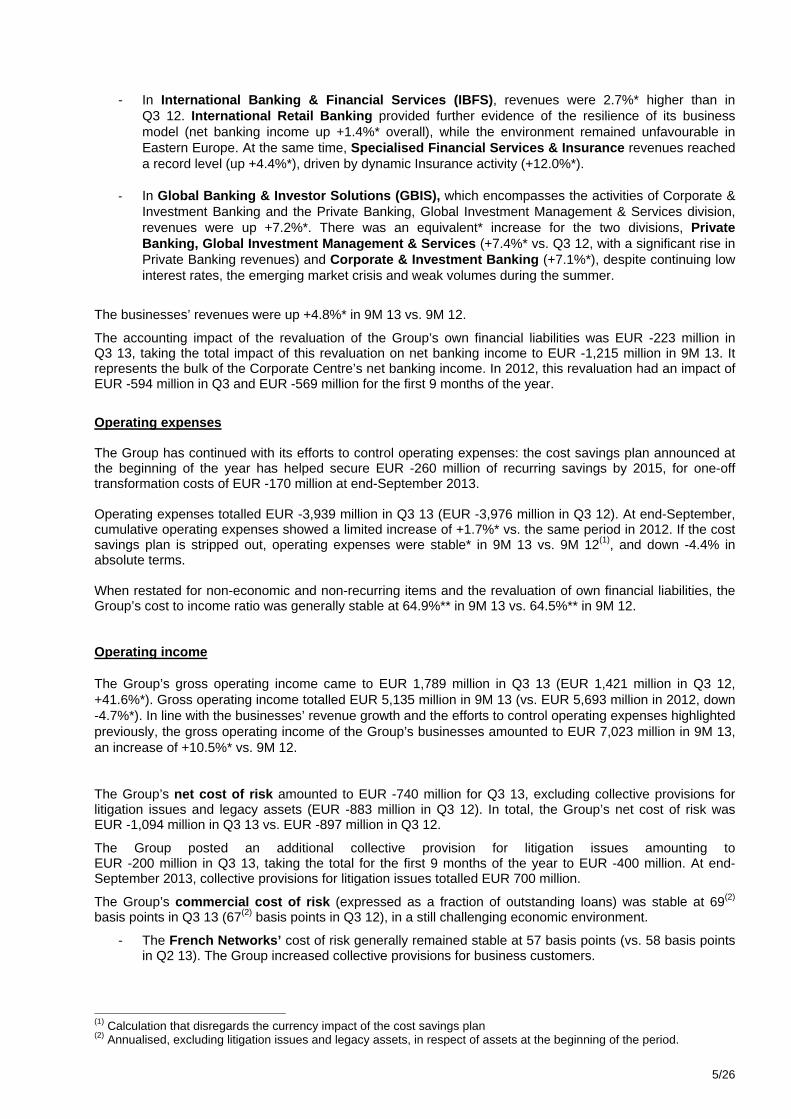
- In International Banking & Financial Services (IBFS), revenues were 2.7%* higher than in Q3 12. International Retail Banking provided further evidence of the resilience of its business model (net banking income up +1.4%* overall), while the environment remained unfavourable in Eastern Europe. At the same time, Specialised Financial Services & Insurance revenues reached a record level (up +4.4%*), driven by dynamic Insurance activity (+12.0%*).
- In Global Banking & Investor Solutions (GBIS), which encompasses the activities of Corporate &
Investment Banking and the Private Banking, Global Investment Management & Services division, revenues were up +7.2%*. There was an equivalent* increase for the two divisions, Private Banking, Global Investment Management & Services (+7.4%* vs. Q3 12, with a significant rise in Private Banking revenues) and Corporate & Investment Banking (+7.1%*), despite continuing low interest rates, the emerging market crisis and weak volumes during the summer.
The businesses’ revenues were up +4.8%* in 9M 13 vs. 9M 12.
The accounting impact of the revaluation of the Group’s own financial liabilities was EUR -223 million in Q3 13, taking the total impact of this revaluation on net banking income to EUR -1,215 million in 9M 13. It represents the bulk of the Corporate Centre’s net banking income. In 2012, this revaluation had an impact of EUR -594 million in Q3 and EUR -569 million for the first 9 months of the year.
Operating expenses The Group has continued with its efforts to control operating expenses: the cost savings plan announced at the beginning of the year has helped secure EUR -260 million of recurring savings by 2015, for one-off transformation costs of EUR -170 million at end-September 2013. Operating expenses totalled EUR -3,939 million in Q3 13 (EUR -3,976 million in Q3 12). At end-September, cumulative operating expenses showed a limited increase of +1.7%* vs. the same period in 2012. If the cost savings plan is stripped out, operating expenses were stable* in 9M 13 vs. 9M 12(1), and down -4.4% in absolute terms. When restated for non-economic and non-recurring items and the revaluation of own financial liabilities, the Group’s cost to income ratio was generally stable at 64.9%** in 9M 13 vs. 64.5%** in 9M 12. Operating income The Group’s gross operating income came to EUR 1,789 million in Q3 13 (EUR 1,421 million in Q3 12, +41.6%*). Gross operating income totalled EUR 5,135 million in 9M 13 (vs. EUR 5,693 million in 2012, down -4.7%*). In line with the businesses’ revenue growth and the efforts to control operating expenses highlighted previously, the gross operating income of the Group’s businesses amounted to EUR 7,023 million in 9M 13, an increase of +10.5%* vs. 9M 12.
The Group’s net cost of risk amounted to EUR -740 million for Q3 13, excluding collective provisions for litigation issues and legacy assets (EUR -883 million in Q3 12). In total, the Group’s net cost of risk was EUR -1,094 million in Q3 13 vs. EUR -897 million in Q3 12.
The Group posted an additional collective provision for litigation issues amounting to EUR -200 million in Q3 13, taking the total for the first 9 months of the year to EUR -400 million. At end-September 2013, collective provisions for litigation issues totalled EUR 700 million.
The Group’s commercial cost of risk (expressed as a fraction of outstanding loans) was stable at 69(2)
basis points in Q3 13 (67(2) basis points in Q3 12), in a still challenging economic environment.
- The French Networks’ cost of risk generally remained stable at 57 basis points (vs. 58 basis points in Q2 13). The Group increased collective provisions for business customers.
(1) Calculation that disregards the currency impact of the cost savings plan (2) Annualised, excluding litigation issues and legacy assets, in respect of assets at the beginning of the period.
6/26
- At 151 basis points (vs. 150 basis points in Q2 13), International Retail Banking’s cost of risk was also stable, with mixed trends according to region: return to a normal situation in the Czech Republic, increase in Russia and Romania. It declined in the Mediterranean Basin.
- Specialised Financial Services’ cost of risk remained low (119 basis points vs. 115 basis points in Q2 13), despite a challenging economic environment.
- The cost of risk of Corporate & Investment Banking’s core activities remained low at 19 basis points (vs. 22 basis points in Q2 13), confirming the quality of the loan portfolio. Legacy assets’ net cost of risk amounted to EUR -154 million in Q3 13.
The Group’s NPL coverage ratio was 79% at end-September 2013, up +1 point vs. end-June 2013 and September 2012.
The Group’s operating income came to EUR 695 million in Q3 13 vs. EUR 524 million in Q3 12 and EUR 2,128 million in 9M 13 vs. EUR 3,072 million in 9M 12. These variations can be attributed primarily to the impact of the revaluation of the Group’s own financial liabilities, with a favourable relative impact in Q3 13 vs. Q3 12 and unfavourable relative impact in the first 9 months. Net income
Group net income totalled EUR 534 million for Q3 13 (EUR 90 million in Q3 12), after taking into account tax (the Group’s effective tax rate was 13.2% in Q3 13 – insignificant in Q3 12) and the contribution of non-controlling interests. When corrected for non-economic items, non-recurring items and legacy assets(1), Group net income totalled EUR 976 million in Q3 13 vs. EUR 854 million in Q3 12 (+14.3%). Group net income amounted to EUR 1,853 million for 9M 13 (vs. EUR 1,261 million in 9M 12), with an effective tax rate of 20.1% at end-September 2013 (and 24.1% in 2012). When corrected for non-economic and non-recurring items as well as the effect of legacy assets, Group net income came to EUR 2,934 million for 9M 13, up +4.3% vs. 9M 12.
The Group’s ROE, excluding non-economic items, non-recurring items and legacy assets, stood at 8.5% in Q3 13 (4.3% in absolute terms). ROTE calculated on the same basis came to 9.9% (5.0% in absolute terms). When calculated for 9M 13, ROE was 8.6% excluding non-economic items, non-recurring items and legacy assets (and 5.2% in absolute terms) for a ROTE of 10.1% (6.1% in absolue terms). Earnings per share amounts to EUR 2.12 for the first 9 months of the year, after deducting interest payable to holders of deeply subordinated notes and undated subordinated notes(2). In view of the significant reinforcement of the Group’s capital ratios, the Group confirms the hypothesis of a cash dividend on the basis of a payout ratio of 25%, without use of a scrip dividend option.
(1) See methodology note No. 8. (2) The interest, net of tax effect, payable to holders of deeply subordinated notes and undated subordinated notes
amounts to respectively EUR -65 million and EUR -14 million for Q3 13 and EUR -190 million and EUR -43 million for 9M 13.
7/26
2 - THE GROUP’S FINANCIAL STRUCTURE Group shareholders’ equity totalled EUR 50.9 billion(1) at September 30th, 2013 and tangible net asset value per share was EUR 48.83 (corresponding to net asset value per share of EUR 56.73, including EUR 1.04 of unrealised capital gains). The consolidated balance sheet totalled EUR 1,254 billion at September 30th, 2013 (EUR 1,282 billion in Q3 12 and EUR 1,250 billion at December 31st, 2012). The net amount of customer loans was EUR 338 billion, down EUR -12 billion vs. December 31st, 2012 (EUR -22 billion in Q3 12), reflecting the slowdown in credit demand. At the same time, customer deposits amounted to EUR 350 billion, up EUR +13 billion vs. December 31st, 2012 (EUR +4 billion in Q3 12). The Group’s funded balance sheet (see methodology note No. 7) totalled EUR 629 billion at September 30th, 2013, down EUR -23 billion vs. December 31st, 2012, with a loan/deposit ratio of 110% vs. 118% at December 31st, 2012. To-date(2), the Group has raised EUR 23.4 billion of medium/long-term debt in 2013, with an average maturity of 5.8 years, exceeding its financing needs for the year. The Group’s liquid asset buffer (net available central bank deposits and unencumbered central bank eligible assets) totalled EUR 137 billion at September 30th (vs. EUR 133 billion at December 31st, 2012), covering 129% of short-term financing needs. The Group’s risk-weighted assets (calculated according to Basel 2.5 rules) amounted to EUR 310.4 billion at end-September 2013 (vs. EUR 337.1 billion at end-September 2012 and EUR 324.1 billion at end-2012). The decline in the Group’s risk-weighted assets continued, especially for market risks (-9.0% in the space of a year). Each of the Group’s pillars accounts for around one-third of prudential commitments, with a predominance of retail banking activities: EUR 91.4 billion in the French Networks, EUR 106.4 billion for International Banking & Financial Services and EUR 106.2 billion for Global Banking & Investor Solutions. In line with continuing efforts to reduce the legacy asset portfolio, this portfolio’s risk-weighted assets were down -24.4% in Q3 (and reduced by almost two-thirds in the space of a year); they now account for 1.8% of the Group’s risk-weighted commitments. The Group’s Core Tier 1 ratio, calculated according to Basel 2.5 rules, stood at 11.6%(3). According to Basel 3 rules(4), it amounted to 9.9% at September 30th, up +51 basis points in Q3. The majority of this increase is due to capital generation (income, net of dividends, for Q3 and capital increase reserved for employees, +22 basis points) and initiatives to reduce the Group’s legacy asset portfolio (+21 basis points). The Tier 1 ratio (Basel 2.5) stood at 13.5% at end-September 2013 (vs.12.0% a year earlier). The leverage ratio stood at 3.3% according to Basel 3 rules(4). The Group is rated by the rating agencies DBRS (AA – low), FitchRatings (A, rating allocated on July 17th, 2013), Moody’s (A2) and Standard & Poor’s (A).
(1) This figure includes notably (i) EUR 5.3 billion of deeply subordinated notes and (ii) EUR 1.5 billion of undated
subordinated notes (2) As at October 28th, 2013 (3) It was 10.3% at September 30th, 2012 (4) Basel 3 Core Tier 1 ratio and leverage ratio calculated according to our understanding of the CRR/CRD4 rules published on June 26th, 2013. Fully loaded Core Tier 1, including the Danish compromise.
8/26
3 - FRENCH NETWORKS In EUR m Q3 12 Q3 13 Change
Q3 vs. Q3 9M 12 9M 13 Change
9M vs. 9M Net banking income 2,010 2,036 +1.3% 6,093 6,120 +0.4%
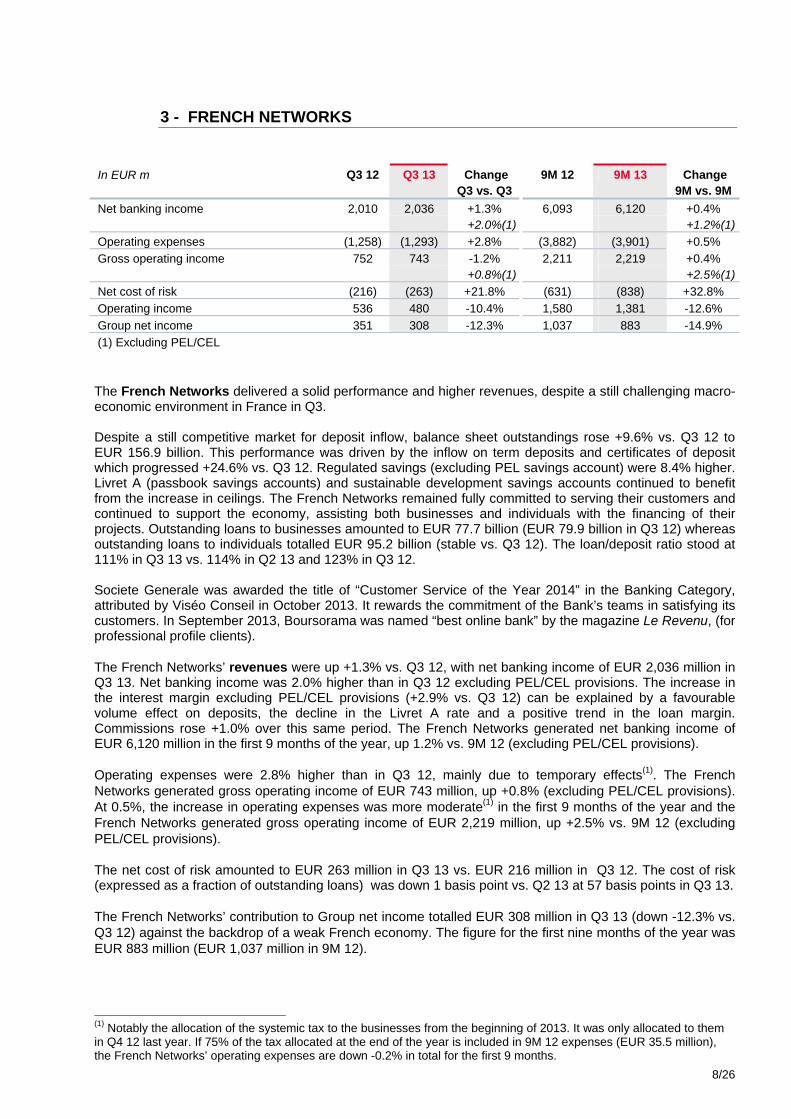
+2.0%(1) +1.2%(1) Operating expenses (1,258) (1,293) +2.8% (3,882) (3,901) +0.5% Gross operating income 752 743 -1.2% 2,211 2,219 +0.4% +0.8%(1) +2.5%(1) Net cost of risk (216) (263) +21.8% (631) (838) +32.8% Operating income 536 480 -10.4% 1,580 1,381 -12.6% Group net income 351 308 -12.3% 1,037 883 -14.9% (1) Excluding PEL/CEL The French Networks delivered a solid performance and higher revenues, despite a still challenging macro-economic environment in France in Q3. Despite a still competitive market for deposit inflow, balance sheet outstandings rose +9.6% vs. Q3 12 to EUR 156.9 billion. This performance was driven by the inflow on term deposits and certificates of deposit which progressed +24.6% vs. Q3 12. Regulated savings (excluding PEL savings account) were 8.4% higher. Livret A (passbook savings accounts) and sustainable development savings accounts continued to benefit from the increase in ceilings. The French Networks remained fully committed to serving their customers and continued to support the economy, assisting both businesses and individuals with the financing of their projects. Outstanding loans to businesses amounted to EUR 77.7 billion (EUR 79.9 billion in Q3 12) whereas outstanding loans to individuals totalled EUR 95.2 billion (stable vs. Q3 12). The loan/deposit ratio stood at 111% in Q3 13 vs. 114% in Q2 13 and 123% in Q3 12. Societe Generale was awarded the title of “Customer Service of the Year 2014” in the Banking Category, attributed by Viséo Conseil in October 2013. It rewards the commitment of the Bank’s teams in satisfying its customers. In September 2013, Boursorama was named “best online bank” by the magazine Le Revenu, (for professional profile clients). The French Networks’ revenues were up +1.3% vs. Q3 12, with net banking income of EUR 2,036 million in Q3 13. Net banking income was 2.0% higher than in Q3 12 excluding PEL/CEL provisions. The increase in the interest margin excluding PEL/CEL provisions (+2.9% vs. Q3 12) can be explained by a favourable volume effect on deposits, the decline in the Livret A rate and a positive trend in the loan margin. Commissions rose +1.0% over this same period. The French Networks generated net banking income of EUR 6,120 million in the first 9 months of the year, up 1.2% vs. 9M 12 (excluding PEL/CEL provisions). Operating expenses were 2.8% higher than in Q3 12, mainly due to temporary effects(1). The French Networks generated gross operating income of EUR 743 million, up +0.8% (excluding PEL/CEL provisions). At 0.5%, the increase in operating expenses was more moderate(1) in the first 9 months of the year and the French Networks generated gross operating income of EUR 2,219 million, up +2.5% vs. 9M 12 (excluding PEL/CEL provisions). The net cost of risk amounted to EUR 263 million in Q3 13 vs. EUR 216 million in Q3 12. The cost of risk (expressed as a fraction of outstanding loans) was down 1 basis point vs. Q2 13 at 57 basis points in Q3 13. The French Networks’ contribution to Group net income totalled EUR 308 million in Q3 13 (down -12.3% vs. Q3 12) against the backdrop of a weak French economy. The figure for the first nine months of the year was EUR 883 million (EUR 1,037 million in 9M 12).
(1) Notably the allocation of the systemic tax to the businesses from the beginning of 2013. It was only allocated to them in Q4 12 last year. If 75% of the tax allocated at the end of the year is included in 9M 12 expenses (EUR 35.5 million), the French Networks’ operating expenses are down -0.2% in total for the first 9 months.
9/26
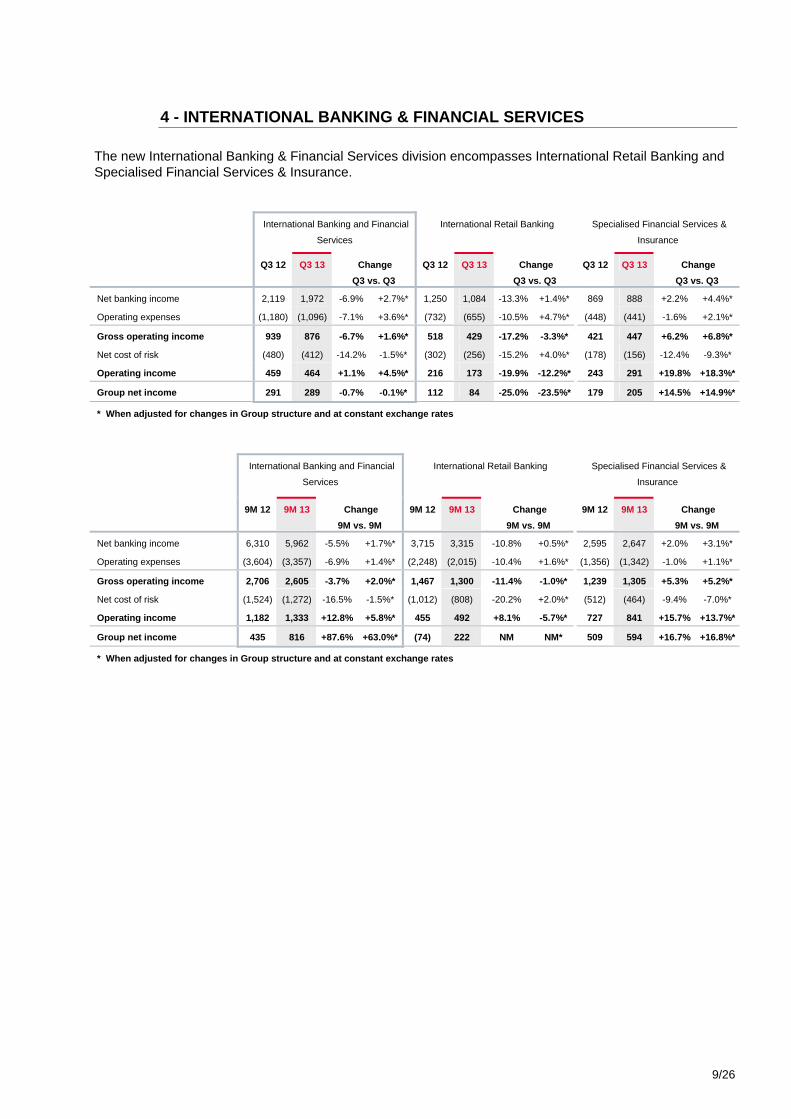
4 - INTERNATIONAL BANKING & FINANCIAL SERVICES The new International Banking & Financial Services division encompasses International Retail Banking and Specialised Financial Services & Insurance. International Banking and Financial
Services
International Retail Banking Specialised Financial Services &
Insurance
Q3 12 Q3 13 Change Q3 vs. Q3
Q3 12 Q3 13 Change Q3 vs. Q3
Q3 12 Q3 13 Change Q3 vs. Q3
Net banking income 2,119 1,972 -6.9% +2.7%* 1,250 1,084 -13.3% +1.4%* 869 888 +2.2% +4.4%*
Operating expenses (1,180) (1,096) -7.1% +3.6%* (732) (655) -10.5% +4.7%* (448) (441) -1.6% +2.1%*
Gross operating income 939 876 -6.7% +1.6%* 518 429 -17.2% -3.3%* 421 447 +6.2% +6.8%*
Net cost of risk (480) (412) -14.2% -1.5%* (302) (256) -15.2% +4.0%* (178) (156) -12.4% -9.3%*
Operating income 459 464 +1.1% +4.5%* 216 173 -19.9% -12.2%* 243 291 +19.8% +18.3%*
Group net income 291 289 -0.7% -0.1%* 112 84 -25.0% -23.5%* 179 205 +14.5% +14.9%*
* When adjusted for changes in Group structure and at constant exchange rates International Banking and Financial
Services
International Retail Banking Specialised Financial Services &
Insurance
9M 12 9M 13 Change 9M vs. 9M
9M 12 9M 13 Change 9M vs. 9M
9M 12 9M 13 Change 9M vs. 9M
Net banking income 6,310 5,962 -5.5% +1.7%* 3,715 3,315 -10.8% +0.5%* 2,595 2,647 +2.0% +3.1%*
Operating expenses (3,604) (3,357) -6.9% +1.4%* (2,248) (2,015) -10.4% +1.6%* (1,356) (1,342) -1.0% +1.1%*
Gross operating income 2,706 2,605 -3.7% +2.0%* 1,467 1,300 -11.4% -1.0%* 1,239 1,305 +5.3% +5.2%*
Net cost of risk (1,524) (1,272) -16.5% -1.5%* (1,012) (808) -20.2% +2.0%* (512) (464) -9.4% -7.0%*
Operating income 1,182 1,333 +12.8% +5.8%* 455 492 +8.1% -5.7%* 727 841 +15.7% +13.7%*
Group net income 435 816 +87.6% +63.0%* (74) 222 NM NM* 509 594 +16.7% +16.8%*
* When adjusted for changes in Group structure and at constant exchange rates
10/26
4.1 International Retail Banking
In EUR m Q3 12 Q3 13 ChangeQ3 vs. Q3 9M 12 9M 13 Change
9M vs. 9M Net banking income 1,250 1,084 -13.3% 3,715 3,315 -10.8%
On a like-for-like basis* +1.4% +0.5% Operating expenses (732) (655) -10.5% (2,248) (2,015) -10.4%
On a like-for-like basis* +4.7% +1.6% Gross operating income 518 429 -17.2% 1,467 1,300 -11.4%
On a like-for-like basis* -3.3% -1.0% Net cost of risk (302) (256) -15.2% (1,012) (808) -20.2% Operating income 216 173 -19.9% 455 492 +8.1%
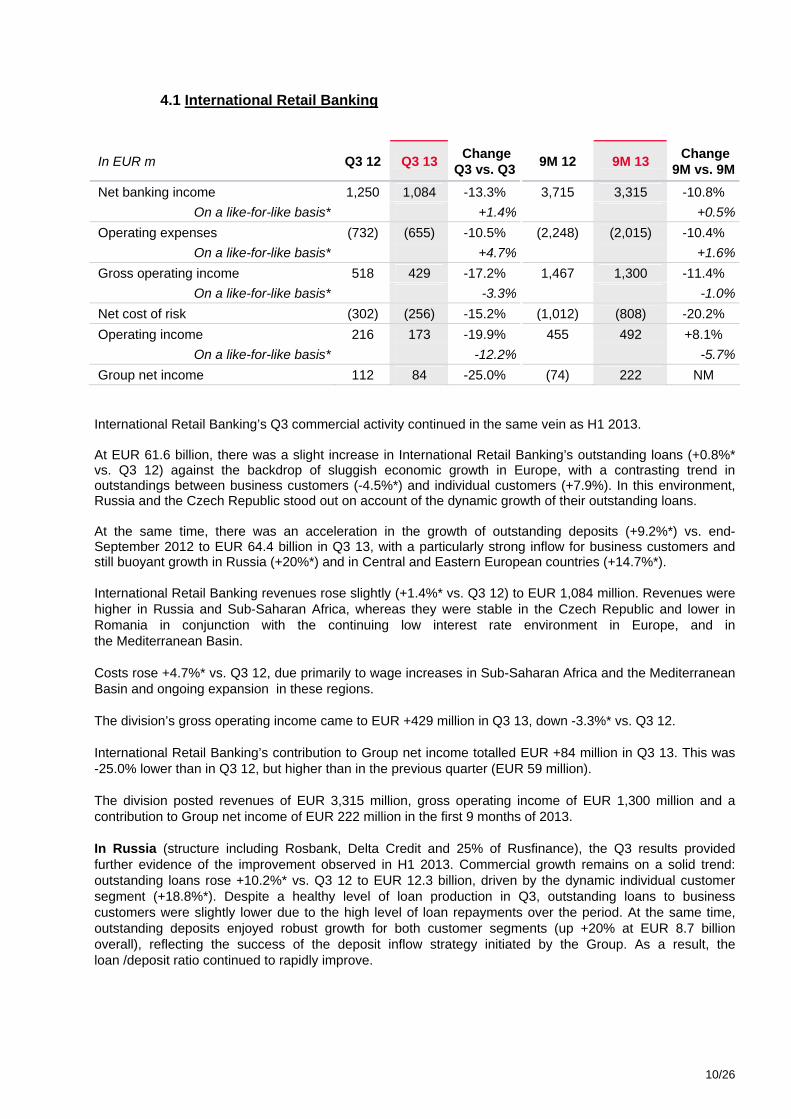
On a like-for-like basis* -12.2% -5.7% Group net income 112 84 -25.0% (74) 222 NM International Retail Banking’s Q3 commercial activity continued in the same vein as H1 2013. At EUR 61.6 billion, there was a slight increase in International Retail Banking’s outstanding loans (+0.8%* vs. Q3 12) against the backdrop of sluggish economic growth in Europe, with a contrasting trend in outstandings between business customers (-4.5%*) and individual customers (+7.9%). In this environment, Russia and the Czech Republic stood out on account of the dynamic growth of their outstanding loans. At the same time, there was an acceleration in the growth of outstanding deposits (+9.2%*) vs. end-September 2012 to EUR 64.4 billion in Q3 13, with a particularly strong inflow for business customers and still buoyant growth in Russia (+20%*) and in Central and Eastern European countries (+14.7%*). International Retail Banking revenues rose slightly (+1.4%* vs. Q3 12) to EUR 1,084 million. Revenues were higher in Russia and Sub-Saharan Africa, whereas they were stable in the Czech Republic and lower in Romania in conjunction with the continuing low interest rate environment in Europe, and in the Mediterranean Basin. Costs rose +4.7%* vs. Q3 12, due primarily to wage increases in Sub-Saharan Africa and the Mediterranean Basin and ongoing expansion in these regions. The division’s gross operating income came to EUR +429 million in Q3 13, down -3.3%* vs. Q3 12. International Retail Banking’s contribution to Group net income totalled EUR +84 million in Q3 13. This was -25.0% lower than in Q3 12, but higher than in the previous quarter (EUR 59 million). The division posted revenues of EUR 3,315 million, gross operating income of EUR 1,300 million and a contribution to Group net income of EUR 222 million in the first 9 months of 2013. In Russia (structure including Rosbank, Delta Credit and 25% of Rusfinance), the Q3 results provided further evidence of the improvement observed in H1 2013. Commercial growth remains on a solid trend: outstanding loans rose +10.2%* vs. Q3 12 to EUR 12.3 billion, driven by the dynamic individual customer segment (+18.8%*). Despite a healthy level of loan production in Q3, outstanding loans to business customers were slightly lower due to the high level of loan repayments over the period. At the same time, outstanding deposits enjoyed robust growth for both customer segments (up +20% at EUR 8.7 billion overall), reflecting the success of the deposit inflow strategy initiated by the Group. As a result, the loan /deposit ratio continued to rapidly improve.
11/26
These good results were reflected in the increase in net banking income (+16.8%*)(1) vs. Q3 12. Over the same period, costs remained under control (+4.8%*) against the backdrop of inflation close to 6.5% in 2013. The contribution to Group net income came to EUR 13 million, up +44%* vs. Q3 12. All in all, the SG Russia(2) entity made a EUR 32 million contribution to Q3 Group net income. The SG Russia entity’s ROE stood at 10.3% in Q3 13, based on the normative capital allocated by the Group. In the Czech Republic, despite a sluggish economic environment and increased competition, Komercni Banka’s (KB) commercial activity remained buoyant: outstanding loans rose +3.2%* (to EUR 17.9 billion) and outstanding deposits increased +7.8%* vs. end-September 2012 (to EUR 23.8 billion). This positive volume effect was offset by the successive margin declines on deposits in 2013 due to low interest rates. As a result, there was a slight drop in revenues (-0.7%*) vs. Q3 12 to EUR 269 million. Over the same period, there was a limited increase (+0.8%*) in operating expenses to EUR 130 million. The contribution to Group net income amounted to EUR 60 million in Q3 13 (vs. EUR 63 million in Q3 12). In Romania, in a still fragile economic environment, BRD’s outstanding loans were down -10.1%* (at EUR 6.7 billion) vs. end-September 2012, adversely affected by the sharp decline in the business segment, whereas outstandings for individual customers were stable. Over the same period, outstanding deposits increased substantially (+6.7%* to EUR 7.6 billion), driven by the business segment and reflecting businesses’ wait-and-see attitude. Against this backdrop, Romania’s revenues came to EUR 145 million in Q3 13 (down -2.0%* vs. Q3 12) while operating expenses amounted to EUR 82 million. Net income was close to breakeven (loss of EUR -7 million vs. a loss of EUR -15 million in Q3 12). In the other Central and Eastern European countries, the Group gained new customers (number of customers up 6.1% vs. Q3 12) and substantially increased its outstanding deposits which rose +14.7%* (to EUR 7.5 billion) driven by business customers. In contrast with this momentum, loan activity experienced weak growth over the same period (+0.7%* to EUR 8.4 billion). Despite the positive volume effect from deposits, revenues were stable vs. Q3 12 at EUR 126 million (+0.3%*) due to the decline in activity in Croatia. Over the same period, costs were 6.4%* higher owing to an increase in payroll costs. The region’s net income came to EUR 4 million. In the Mediterranean Basin, deposits were 3.0%* higher than at end-September 2012 at EUR 7.8 billion, with a marked increase in Algeria. Outstanding loans remained lower in Q3 13 (-3.7%* vs. Q3 12 at EUR 7.9 billion), adversely affected by a decline in Morocco. Net banking income was down -3.4%* vs. Q3 12 due primarily to a change in commission and foreign exchange regulations in Algeria. Over the same period, operating expenses increased +5.8%* in conjunction with the network’s expansion (16 new branches in the space of a year) and due to the effect of high local inflation. In Sub-Saharan Africa, outstanding loans rose +2.3%* vs. Q3 12 to EUR 3.0 billion, despite the decline observed in Côte d’Ivoire, which partially masked the good performances in the individual customer segment. There was a further strong increase in outstanding deposits (+6.3%*) to EUR 4.2 billion over the same period, resulting in revenues up +6.8%* vs. Q3 12 at EUR 103 million. The Group expanded its network, with 14 new branches in the space of a year. This led to operating expenses rising +17.2%* vs. Q3 12. Gross operating income came to EUR 37 million.
(1) At end-2012, the entities BelRosbank (Byelorussia) and AVD, Rosbank’s debt recovery subsidiary, were sold as part
of the Group’s refocusing (2) SG Russia’s result: contribution of Rosbank, Delta Credit Bank, Rusfinance Bank, Societe Generale Insurance, ALD
automotive and their consolidated subsidiaries to the businesses’ results.
12/26
4.2 Specialised Financial Services & Insurance
In EUR m Q3 12 Q3 13
ChangeQ3 vs. Q3
9M 12 9M 13
Change9M vs. 9M
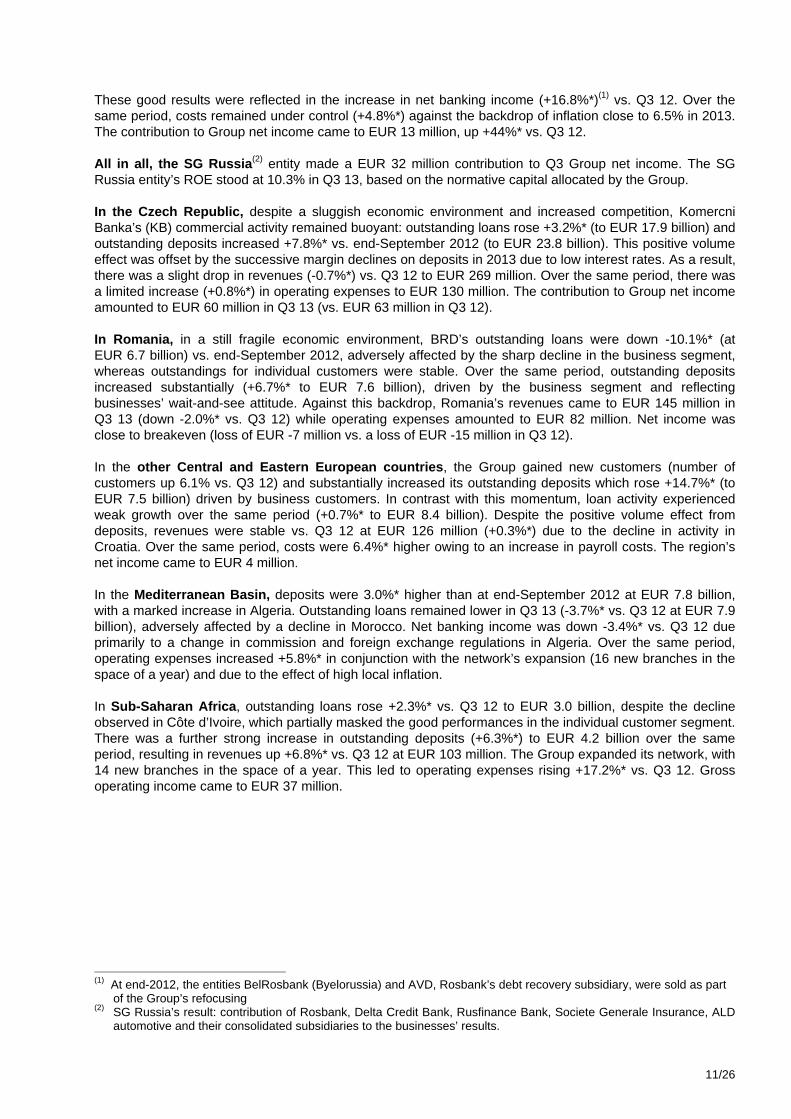
Net banking income 869 888 +2.2% 2,595 2,647 +2.0% On a like-for-like basis* +4.4% +3.1%
Operating expenses (448) (441) -1.6% (1,356) (1,342) -1.0% On a like-for-like basis* +2.1% +1.1%
Gross operating income 421 447 +6.2% 1,239 1,305 +5.3% On a like-for-like basis* +6.8% +5.2%
Net cost of risk (178) (156) -12.4% (512) (464) -9.4% Operating income 243 291 +19.8% 727 841 +15.7%
On a like-for-like basis* +18.3% +13.7% Group net income 179 205 +14.5% 509 594 +16.7% The Specialised Financial Services & Insurance division comprises:
(i) Specialised Financial Services (operational vehicle leasing and fleet management, equipment finance, consumer finance),
(ii) Insurance (Life, Personal Protection, Property and Casualty). Specialised Financial Services & Insurance posted a good performance in Q3 13, with a contribution to Group net income of EUR 205 million, up +14.5% vs. Q3 12. Operational Vehicle Leasing and Fleet Management experienced continued growth in its fleet: with approximately 990,000 vehicles at end-September 2013, the increase was +5.6%(1) vs. end-September 2012. Growth was underpinned by the successful development of its partnerships with car manufacturers and retail banking networks. Against the backdrop of a slowdown in investment, Equipment Finance proved resilient thanks to strong positions, particularly in vendor programs: new business experienced a limited decline (-2.6%*) vs. Q3 12 to EUR 1.6 billion (excluding factoring) – in Scandinavia and the UK, new business was buoyant (at respectively +7.2%* and +20.3%*). Margins held up well thanks to the business’ selective origination policy. Outstandings totalled EUR 16.9 billion excluding factoring, down -4.0%* vs. end-September 2012. In a still sluggish environment, new Consumer Finance business was nevertheless +3.7%* higher in Q3 13 than in Q3 12 at EUR 2.4 billion on the back of successful partnerships in Germany. Outstandings fell -2.2%* vs. end-September 2012 to EUR 21.3 billion. Specialised Financial Services’ net banking income was up +2.5%* vs. Q3 12 at EUR 701 million. Gross operating income increased +5.5%* to EUR 332 million, benefiting from stable operating expenses (EUR -369 million).
Specialised Financial Services’ net cost of risk fell to EUR 156 million in Q3 13 (119 basis points) vs. EUR 178 million in Q3 12 (123 basis points). It was slightly higher (EUR +3 million) than in Q2 13.
Specialised Financial Services’ contribution to Group net income totalled EUR 124 million (+19.2% vs. Q3 12) and ROE stood at 13.7% in Q3 13, with a stable capital allocation to the businesses since 2009. The contribution to Group net income was EUR 352 million in 9M 13 (+23.1% vs. 9M 12).
Specialised Financial Services continued with its external refinancing initiatives which totalled EUR 3.1 billion for 2013. They included, in particular, the successful placement of the second auto receivables securitisation deal in Germany for EUR 915 million. (1) At constant structure
13/26
The Insurance activity posted a good performance in Q3 13, with net banking income up +12.0%* vs. Q3 12, at EUR 187 million. Outstandings in life insurance savings continued to grow in Q3 to EUR 82.8 billion (+6.1%* vs. end-September 2012) and net inflow totalled EUR 0.1 billion in Q3 13. Personal Protection and Property/Casualty insurance continued to enjoyed robust growth, driven by their international expansion, notably in Poland, with premiums up +20.0%* vs. Q3 12.
The Insurance activity’s contribution to Group net income was EUR 81 million in Q3 13 and EUR 242 million in the first 9 months of 2013.
14/26
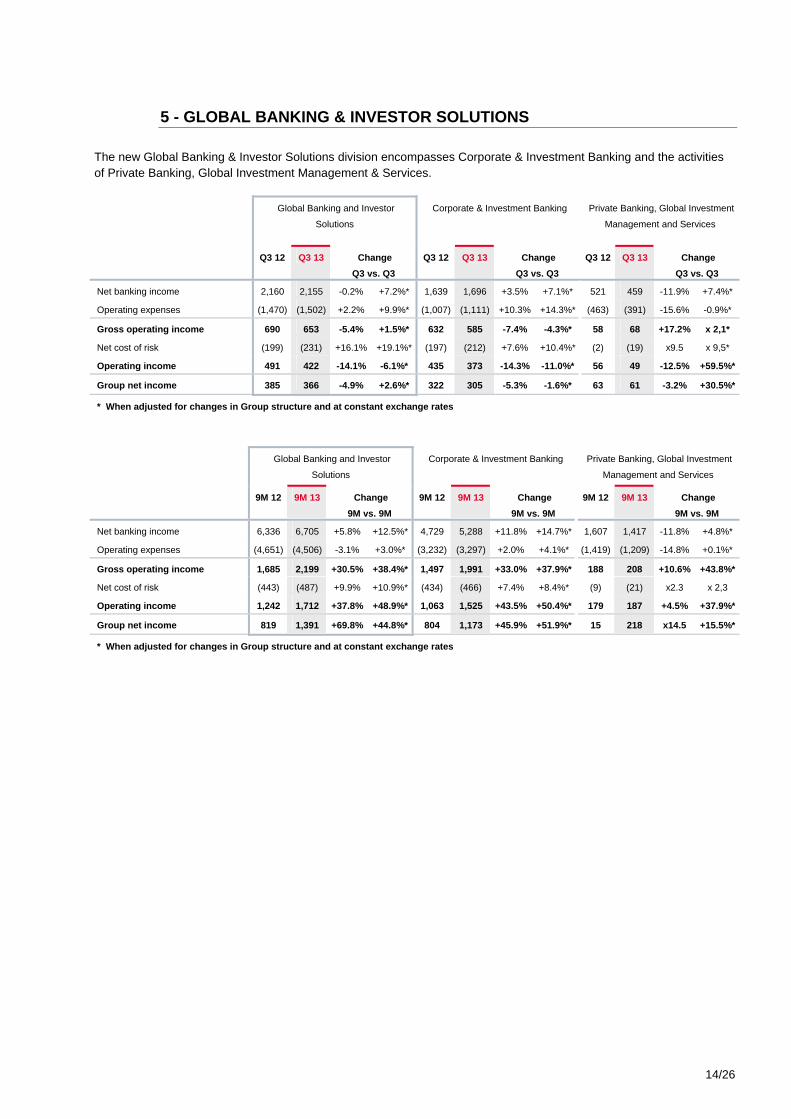
5 - GLOBAL BANKING & INVESTOR SOLUTIONS The new Global Banking & Investor Solutions division encompasses Corporate & Investment Banking and the activities of Private Banking, Global Investment Management & Services. Global Banking and Investor
Solutions
Corporate & Investment Banking Private Banking, Global Investment
Management and Services
Q3 12 Q3 13 Change Q3 vs. Q3
Q3 12 Q3 13 Change Q3 vs. Q3
Q3 12 Q3 13 Change Q3 vs. Q3
Net banking income 2,160 2,155 -0.2% +7.2%* 1,639 1,696 +3.5% +7.1%* 521 459 -11.9% +7.4%*
Operating expenses (1,470) (1,502) +2.2% +9.9%* (1,007) (1,111) +10.3% +14.3%* (463) (391) -15.6% -0.9%*
Gross operating income 690 653 -5.4% +1.5%* 632 585 -7.4% -4.3%* 58 68 +17.2% x 2,1*
Net cost of risk (199) (231) +16.1% +19.1%* (197) (212) +7.6% +10.4%* (2) (19) x9.5 x 9,5*
Operating income 491 422 -14.1% -6.1%* 435 373 -14.3% -11.0%* 56 49 -12.5% +59.5%*
Group net income 385 366 -4.9% +2.6%* 322 305 -5.3% -1.6%* 63 61 -3.2% +30.5%*
* When adjusted for changes in Group structure and at constant exchange rates
Global Banking and Investor
Solutions
Corporate & Investment Banking Private Banking, Global Investment
Management and Services
9M 12 9M 13 Change 9M vs. 9M
9M 12 9M 13 Change 9M vs. 9M
9M 12 9M 13 Change 9M vs. 9M
Net banking income 6,336 6,705 +5.8% +12.5%* 4,729 5,288 +11.8% +14.7%* 1,607 1,417 -11.8% +4.8%*
Operating expenses (4,651) (4,506) -3.1% +3.0%* (3,232) (3,297) +2.0% +4.1%* (1,419) (1,209) -14.8% +0.1%*
Gross operating income 1,685 2,199 +30.5% +38.4%* 1,497 1,991 +33.0% +37.9%* 188 208 +10.6% +43.8%*
Net cost of risk (443) (487) +9.9% +10.9%* (434) (466) +7.4% +8.4%* (9) (21) x2.3 x 2,3
Operating income 1,242 1,712 +37.8% +48.9%* 1,063 1,525 +43.5% +50.4%* 179 187 +4.5% +37.9%*
Group net income 819 1,391 +69.8% +44.8%* 804 1,173 +45.9% +51.9%* 15 218 x14.5 +15.5%*
* When adjusted for changes in Group structure and at constant exchange rates
15/26
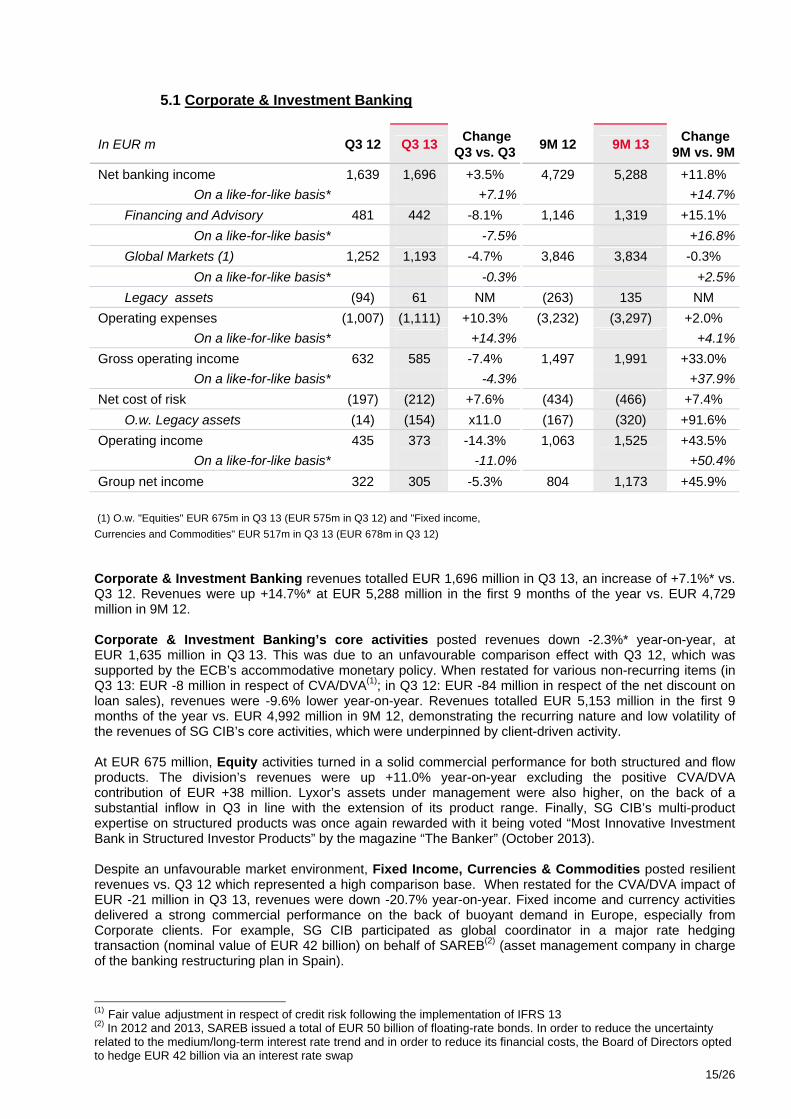
5.1 Corporate & Investment Banking
In EUR m Q3 12 Q3 13 ChangeQ3 vs. Q3 9M 12 9M 13 Change
9M vs. 9M Net banking income 1,639 1,696 +3.5% 4,729 5,288 +11.8%
On a like-for-like basis* +7.1% +14.7% Financing and Advisory 481 442 -8.1% 1,146 1,319 +15.1%
On a like-for-like basis* -7.5% +16.8% Global Markets (1) 1,252 1,193 -4.7% 3,846 3,834 -0.3%
On a like-for-like basis* -0.3% +2.5% Legacy assets (94) 61 NM (263) 135 NM
Operating expenses (1,007) (1,111) +10.3% (3,232) (3,297) +2.0% On a like-for-like basis* +14.3% +4.1%
Gross operating income 632 585 -7.4% 1,497 1,991 +33.0% On a like-for-like basis* -4.3% +37.9%
Net cost of risk (197) (212) +7.6% (434) (466) +7.4% O.w. Legacy assets (14) (154) x11.0 (167) (320) +91.6%
Operating income 435 373 -14.3% 1,063 1,525 +43.5% On a like-for-like basis* -11.0% +50.4%
Group net income 322 305 -5.3% 804 1,173 +45.9% (1) O.w. "Equities" EUR 675m in Q3 13 (EUR 575m in Q3 12) and "Fixed income, Currencies and Commodities" EUR 517m in Q3 13 (EUR 678m in Q3 12)
Corporate & Investment Banking revenues totalled EUR 1,696 million in Q3 13, an increase of +7.1%* vs. Q3 12. Revenues were up +14.7%* at EUR 5,288 million in the first 9 months of the year vs. EUR 4,729 million in 9M 12. Corporate & Investment Banking’s core activities posted revenues down -2.3%* year-on-year, at EUR 1,635 million in Q3 13. This was due to an unfavourable comparison effect with Q3 12, which was supported by the ECB’s accommodative monetary policy. When restated for various non-recurring items (in Q3 13: EUR -8 million in respect of CVA/DVA(1); in Q3 12: EUR -84 million in respect of the net discount on loan sales), revenues were -9.6% lower year-on-year. Revenues totalled EUR 5,153 million in the first 9 months of the year vs. EUR 4,992 million in 9M 12, demonstrating the recurring nature and low volatility of the revenues of SG CIB’s core activities, which were underpinned by client-driven activity. At EUR 675 million, Equity activities turned in a solid commercial performance for both structured and flow products. The division’s revenues were up +11.0% year-on-year excluding the positive CVA/DVA contribution of EUR +38 million. Lyxor’s assets under management were also higher, on the back of a substantial inflow in Q3 in line with the extension of its product range. Finally, SG CIB’s multi-product expertise on structured products was once again rewarded with it being voted “Most Innovative Investment Bank in Structured Investor Products” by the magazine “The Banker” (October 2013). Despite an unfavourable market environment, Fixed Income, Currencies & Commodities posted resilient revenues vs. Q3 12 which represented a high comparison base. When restated for the CVA/DVA impact of EUR -21 million in Q3 13, revenues were down -20.7% year-on-year. Fixed income and currency activities delivered a strong commercial performance on the back of buoyant demand in Europe, especially from Corporate clients. For example, SG CIB participated as global coordinator in a major rate hedging transaction (nominal value of EUR 42 billion) on behalf of SAREB(2) (asset management company in charge of the banking restructuring plan in Spain).
(1) Fair value adjustment in respect of credit risk following the implementation of IFRS 13 (2) In 2012 and 2013, SAREB issued a total of EUR 50 billion of floating-rate bonds. In order to reduce the uncertainty related to the medium/long-term interest rate trend and in order to reduce its financial costs, the Board of Directors opted to hedge EUR 42 billion via an interest rate swap
16/26
At EUR 443 million, Financing & Advisory revenues were lower than in Q3 12 (-17.0% when restated for the CVA/DVA impact of EUR -25 million in Q3 13 and the net discount on loan sales as part of deleveraging, amounting to EUR -84 million in Q3 12). Financing activities’ results were mixed: they were lower compared with a particularly strong Q3 12, but higher for the first 9 months of the year. SG CIB strengthened its capital markets positioning. It was ranked(1) No. 5 in “all international Euro denominated bonds”, No. 3 in “all Euro corporate bonds”, No. 6 in “all Euro financial institution bonds” and No. 7 in “ECM and EQL Euro denominated”. SG CIB played a leading role in several deals: in particular, it was mandated by the UK Debt Management Office as lead manager for the reopening of its GBP 30-year inflation-linked benchmark bond. This issue represents the fourth syndicated transaction by the UK DMO and the second for an index-linked bond in respect of its 2013/2014 programme. SG CIB also acted as Lead Arranger for the implementation of a USD 8 billion syndicated loan for Alibaba in Asia. Legacy assets made a positive revenue contribution of EUR 61 million in Q3 13. During the quarter, the Group continued with its policy of reducing the size of the portfolio of non-investment grade assets for which net exposure declined from EUR 1.8 billion to EUR 1.0 billion. Revenues totalled EUR 135 million in the first 9 months of the year vs. EUR -263 million in 9M 12. The division’s operating expenses amounted to EUR -1,111 million in Q3 13, up +14.3%* vs. Q3 12. This was due primarily to the allocation of systemic taxes to the businesses as from Q4 12, an increase in the “Contribution Sociale de Solidarité des Sociétés” (corporate social solidarity contribution), and other temporary factors. There was a limited increase in operating expenses in the first 9 months of the year (+4.1%* to EUR -3,297 million vs. EUR -3,232 million in 9M 12). Corporate & Investment Banking’s net cost of risk amounted to EUR -212 million in Q3 13, up +10.4%* year-on-year. Core activities’ cost of risk remained low at 19 basis points. Legacy assets’ net cost of risk came to EUR -154 million in Q3 13, due largely to the efforts to reduce the size of the portfolio. The net cost of risk increased +8.4%* to EUR -466 million in the first 9 months of the year (vs. EUR -434 million in 9M 12). Corporate & Investment Banking’s contribution to Group net income totalled EUR 305 million in Q3 vs. EUR 322 million in Q3 12. The contribution to Group net income was EUR 1,173 million in the first 9 months of the year, substantially higher than in 9M 12 (+45.9%). ROE came to 12% overall in the first 9 months of the year (Basel 3 at 10%) and 17% for core activities.
(1) As at October 24th, 2013
17/26
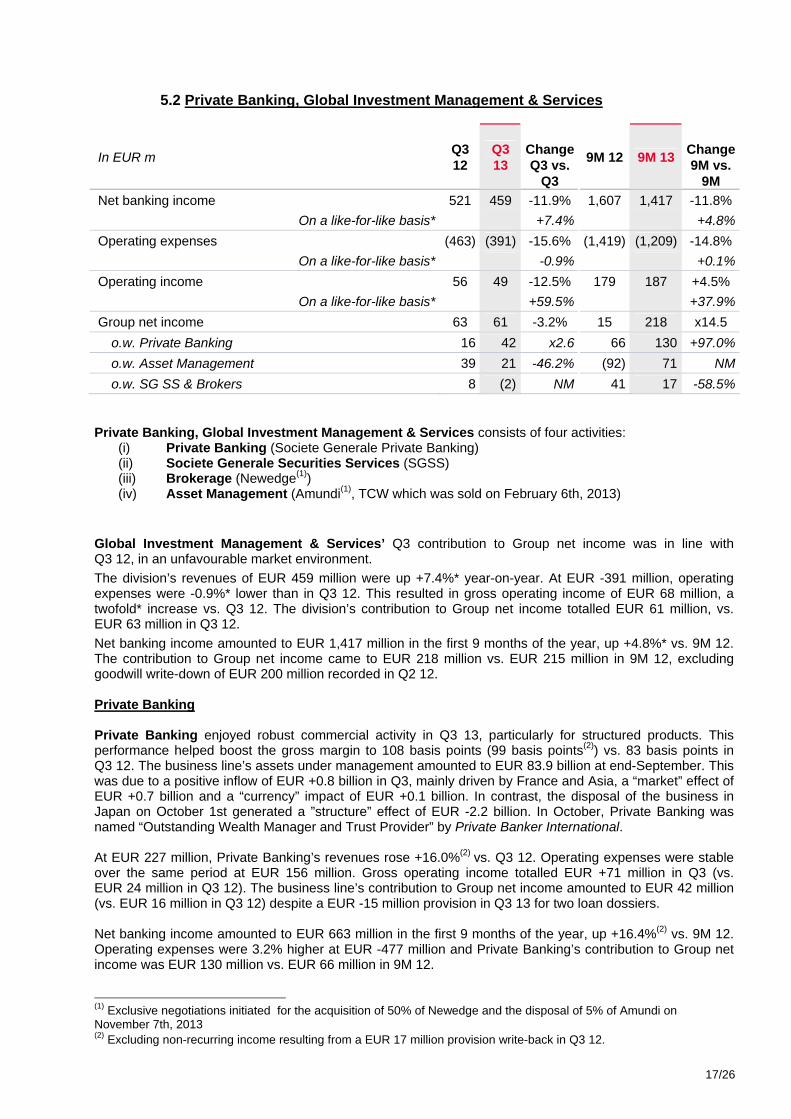
5.2 Private Banking, Global Investment Management & Services
In EUR m Q3 12
Q3 13
Change Q3 vs.
Q3
9M 12 9M 13
Change9M vs.
9M Net banking income 521 459 -11.9% 1,607 1,417 -11.8%
On a like-for-like basis* +7.4% +4.8% Operating expenses (463) (391) -15.6% (1,419) (1,209) -14.8%
On a like-for-like basis* -0.9% +0.1% Operating income 56 49 -12.5% 179 187 +4.5%
On a like-for-like basis* +59.5% +37.9% Group net income 63 61 -3.2% 15 218 x14.5
o.w. Private Banking 16 42 x2.6 66 130 +97.0% o.w. Asset Management 39 21 -46.2% (92) 71 NM o.w. SG SS & Brokers 8 (2) NM 41 17 -58.5%
Private Banking, Global Investment Management & Services consists of four activities:
(i) Private Banking (Societe Generale Private Banking) (ii) Societe Generale Securities Services (SGSS) (iii) Brokerage (Newedge(1)) (iv) Asset Management (Amundi(1), TCW which was sold on February 6th, 2013)
Global Investment Management & Services’ Q3 contribution to Group net income was in line with Q3 12, in an unfavourable market environment. The division’s revenues of EUR 459 million were up +7.4%* year-on-year. At EUR -391 million, operating expenses were -0.9%* lower than in Q3 12. This resulted in gross operating income of EUR 68 million, a twofold* increase vs. Q3 12. The division’s contribution to Group net income totalled EUR 61 million, vs. EUR 63 million in Q3 12. Net banking income amounted to EUR 1,417 million in the first 9 months of the year, up +4.8%* vs. 9M 12. The contribution to Group net income came to EUR 218 million vs. EUR 215 million in 9M 12, excluding goodwill write-down of EUR 200 million recorded in Q2 12. Private Banking Private Banking enjoyed robust commercial activity in Q3 13, particularly for structured products. This performance helped boost the gross margin to 108 basis points (99 basis points(2)) vs. 83 basis points in Q3 12. The business line’s assets under management amounted to EUR 83.9 billion at end-September. This was due to a positive inflow of EUR +0.8 billion in Q3, mainly driven by France and Asia, a “market” effect of EUR +0.7 billion and a “currency” impact of EUR +0.1 billion. In contrast, the disposal of the business in Japan on October 1st generated a ”structure” effect of EUR -2.2 billion. In October, Private Banking was named “Outstanding Wealth Manager and Trust Provider” by Private Banker International. At EUR 227 million, Private Banking’s revenues rose +16.0%(2) vs. Q3 12. Operating expenses were stable over the same period at EUR 156 million. Gross operating income totalled EUR +71 million in Q3 (vs. EUR 24 million in Q3 12). The business line’s contribution to Group net income amounted to EUR 42 million (vs. EUR 16 million in Q3 12) despite a EUR -15 million provision in Q3 13 for two loan dossiers. Net banking income amounted to EUR 663 million in the first 9 months of the year, up +16.4%(2) vs. 9M 12. Operating expenses were 3.2% higher at EUR -477 million and Private Banking’s contribution to Group net income was EUR 130 million vs. EUR 66 million in 9M 12. (1) Exclusive negotiations initiated for the acquisition of 50% of Newedge and the disposal of 5% of Amundi on November 7th, 2013
(2) Excluding non-recurring income resulting from a EUR 17 million provision write-back in Q3 12.
18/26
Societe Generale Securities Services (SGSS) and Brokerage (Newedge) Securities Services saw its assets under custody increase +7.7% to EUR 3,609 billion vs. end-September 2012. Assets under administration rose +11.6% over the same period to EUR 500 billion. Newedge retained a stable market share (11.9%) in 9M 13 vs. 9M 12 in a bear market environment, and despite a backdrop of restructuring.
At EUR 224 million, Securities Services and Brokerage revenues fell -9.7%* in Q3 vs. Q3 12, due to the decline in brokerage revenues. The businesses continued with their operating efficiency initiatives, which helped reduce operating expenses by -4.6%* vs. Q3 12 to EUR -226 million. The contribution to Group net income amounted to EUR -2 million. Net banking income amounted to EUR 734 million in the first 9 months of the year, down -8.1%* year-on-year. Operating expenses declined -4.7%* to EUR -706 million and the business line’s contribution to Group net income totalled EUR 17 million.
Asset Management Amundi’s contribution to Group net income came to EUR 22 million in Q3 13 (EUR 26 million in Q3 12) and EUR 75 million in the first 9 months of the year (EUR 87 million in 9M 12).
19/26
6 - CORPORATE CENTRE
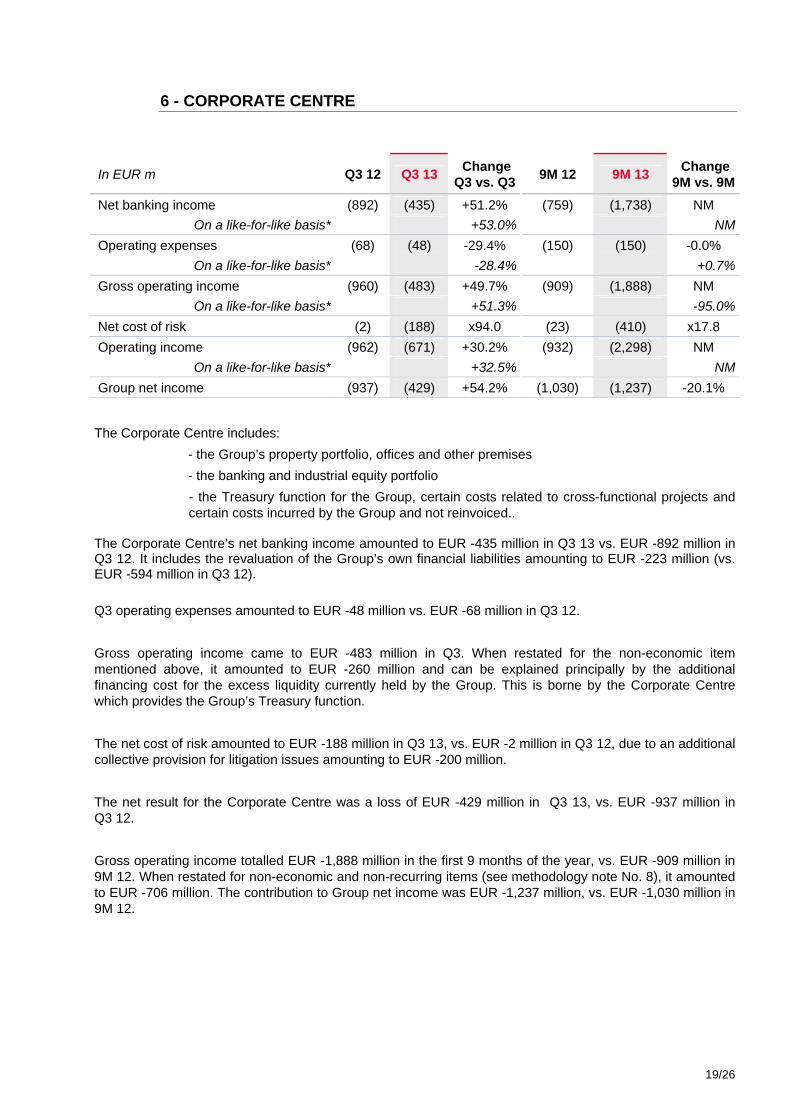
In EUR m Q3 12 Q3 13 ChangeQ3 vs. Q3 9M 12 9M 13 Change
9M vs. 9M Net banking income (892) (435) +51.2% (759) (1,738) NM
On a like-for-like basis* +53.0% NM Operating expenses (68) (48) -29.4% (150) (150) -0.0%
On a like-for-like basis* -28.4% +0.7% Gross operating income (960) (483) +49.7% (909) (1,888) NM
On a like-for-like basis* +51.3% -95.0% Net cost of risk (2) (188) x94.0 (23) (410) x17.8 Operating income (962) (671) +30.2% (932) (2,298) NM
On a like-for-like basis* +32.5% NM Group net income (937) (429) +54.2% (1,030) (1,237) -20.1%
The Corporate Centre includes:
- the Group’s property portfolio, offices and other premises - the banking and industrial equity portfolio
- the Treasury function for the Group, certain costs related to cross-functional projects and certain costs incurred by the Group and not reinvoiced..
The Corporate Centre’s net banking income amounted to EUR -435 million in Q3 13 vs. EUR -892 million in Q3 12. It includes the revaluation of the Group’s own financial liabilities amounting to EUR -223 million (vs. EUR -594 million in Q3 12). Q3 operating expenses amounted to EUR -48 million vs. EUR -68 million in Q3 12. Gross operating income came to EUR -483 million in Q3. When restated for the non-economic item mentioned above, it amounted to EUR -260 million and can be explained principally by the additional financing cost for the excess liquidity currently held by the Group. This is borne by the Corporate Centre which provides the Group’s Treasury function. The net cost of risk amounted to EUR -188 million in Q3 13, vs. EUR -2 million in Q3 12, due to an additional collective provision for litigation issues amounting to EUR -200 million. The net result for the Corporate Centre was a loss of EUR -429 million in Q3 13, vs. EUR -937 million in Q3 12. Gross operating income totalled EUR -1,888 million in the first 9 months of the year, vs. EUR -909 million in 9M 12. When restated for non-economic and non-recurring items (see methodology note No. 8), it amounted to EUR -706 million. The contribution to Group net income was EUR -1,237 million, vs. EUR -1,030 million in 9M 12.
20/26
7 - 2013/2014 FINANCIAL CALENDAR
2013 financial communication calendar February 12th, 2014 Publication of fourth quarter and FY 2013 results May 6th, 2014 Publication of first quarter 2014 results May 13th, 2014 Investor Day May 20th, 2014 Annual General Meeting This document may contain a number of forecasts and comments relating to the targets and strategies of the Societe Generale Group. These forecasts are based on a series of assumptions, both general and specific (notably – unless specified otherwise – the application of accounting principles and methods in accordance with IFRS as adopted in the European Union as well as the application of existing prudential regulations). This information was developed from scenarios based on a number of economic assumptions for a given competitive and regulatory environment. The Group may be unable to: - anticipate all the risks, uncertainties or other factors likely to affect its business and to appraise their potential impact on its operations; - precisely evaluate the extent to which the occurrence of a risk or combination of risks could cause actual results to differ materially from those contemplated in this press release. There is a risk that these projections will not be met. Investors are advised to take into account factors of uncertainty and risk likely to impact the operations of the Group when basing their investment decisions on information provided in this document. Unless otherwise specified, the sources for the rankings are internal.
21/26
8 - APPENDIX 1: STATISTICAL DATA CONSOLIDATED INCOME STATEMENT (in EUR millions)
Q3 12 Q3 13 Change Q3 vs. Q3
9M 12 9M 13 Change 9M vs. 9M
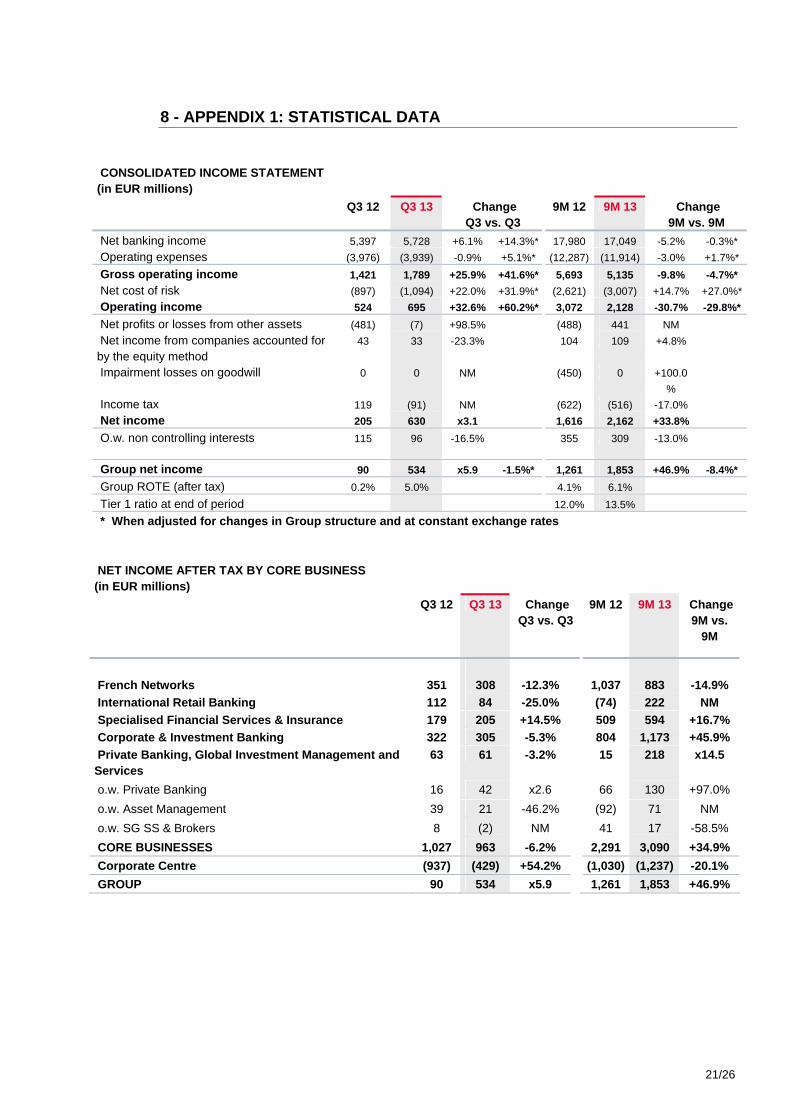
Net banking income 5,397 5,728 +6.1% +14.3%* 17,980 17,049 -5.2% -0.3%* Operating expenses (3,976) (3,939) -0.9% +5.1%* (12,287) (11,914) -3.0% +1.7%* Gross operating income 1,421 1,789 +25.9% +41.6%* 5,693 5,135 -9.8% -4.7%* Net cost of risk (897) (1,094) +22.0% +31.9%* (2,621) (3,007) +14.7% +27.0%* Operating income 524 695 +32.6% +60.2%* 3,072 2,128 -30.7% -29.8%* Net profits or losses from other assets (481) (7) +98.5% (488) 441 NM Net income from companies accounted for by the equity method
43 33 -23.3% 104 109 +4.8%
Impairment losses on goodwill 0 0 NM (450) 0 +100.0%
Income tax 119 (91) NM (622) (516) -17.0% Net income 205 630 x3.1 1,616 2,162 +33.8% O.w. non controlling interests 115 96 -16.5% 355 309 -13.0%
Group net income 90 534 x5.9 -1.5%* 1,261 1,853 +46.9% -8.4%* Group ROTE (after tax) 0.2% 5.0% 4.1% 6.1% Tier 1 ratio at end of period 12.0% 13.5% * When adjusted for changes in Group structure and at constant exchange rates NET INCOME AFTER TAX BY CORE BUSINESS (in EUR millions) Q3 12 Q3 13 Change
Q3 vs. Q3 9M 12 9M 13 Change
9M vs. 9M
French Networks 351 308 -12.3% 1,037 883 -14.9% International Retail Banking 112 84 -25.0% (74) 222 NM Specialised Financial Services & Insurance 179 205 +14.5% 509 594 +16.7% Corporate & Investment Banking 322 305 -5.3% 804 1,173 +45.9% Private Banking, Global Investment Management and Services
63 61 -3.2% 15 218 x14.5
o.w. Private Banking 16 42 x2.6 66 130 +97.0% o.w. Asset Management 39 21 -46.2% (92) 71 NM o.w. SG SS & Brokers 8 (2) NM 41 17 -58.5% CORE BUSINESSES 1,027 963 -6.2% 2,291 3,090 +34.9% Corporate Centre (937) (429) +54.2% (1,030) (1,237) -20.1% GROUP 90 534 x5.9 1,261 1,853 +46.9%
22/26
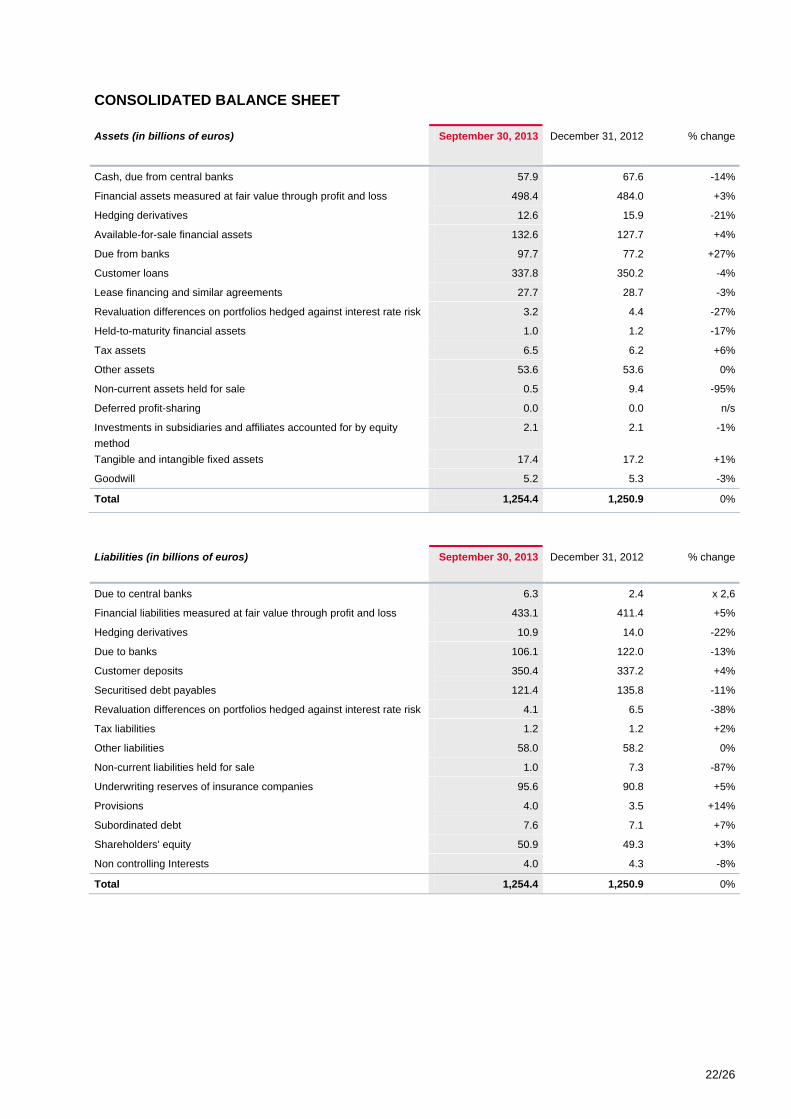
CONSOLIDATED BALANCE SHEET Assets (in billions of euros) September 30, 2013 December 31, 2012 % change
Cash, due from central banks 57.9 67.6 -14%
Financial assets measured at fair value through profit and loss 498.4 484.0 +3%
Hedging derivatives 12.6 15.9 -21%
Available-for-sale financial assets 132.6 127.7 +4%
Due from banks 97.7 77.2 +27%
Customer loans 337.8 350.2 -4%
Lease financing and similar agreements 27.7 28.7 -3%
Revaluation differences on portfolios hedged against interest rate risk 3.2 4.4 -27%
Held-to-maturity financial assets 1.0 1.2 -17%
Tax assets 6.5 6.2 +6%
Other assets 53.6 53.6 0%
Non-current assets held for sale 0.5 9.4 -95%
Deferred profit-sharing 0.0 0.0 n/s
Investments in subsidiaries and affiliates accounted for by equity method
2.1 2.1 -1%
Tangible and intangible fixed assets 17.4 17.2 +1%
Goodwill 5.2 5.3 -3%
Total 1,254.4 1,250.9 0%
Liabilities (in billions of euros) September 30, 2013 December 31, 2012 % change
Due to central banks 6.3 2.4 x 2,6
Financial liabilities measured at fair value through profit and loss 433.1 411.4 +5%
Hedging derivatives 10.9 14.0 -22%
Due to banks 106.1 122.0 -13%
Customer deposits 350.4 337.2 +4%
Securitised debt payables 121.4 135.8 -11%
Revaluation differences on portfolios hedged against interest rate risk 4.1 6.5 -38%
Tax liabilities 1.2 1.2 +2%
Other liabilities 58.0 58.2 0%
Non-current liabilities held for sale 1.0 7.3 -87%
Underwriting reserves of insurance companies 95.6 90.8 +5%
Provisions 4.0 3.5 +14%
Subordinated debt 7.6 7.1 +7%
Shareholders' equity 50.9 49.3 +3%
Non controlling Interests 4.0 4.3 -8%
Total 1,254.4 1,250.9 0%
23/26
9 - APPENDIX 2: METHODOLOGY 1- The Group’s consolidated results as at September 30th, 2013 were examined by the Board of Directors on November 6th, 2013. The financial information presented for the nine-month period ended September 30th, 2013 has been prepared in accordance with IFRS as adopted in the European Union and applicable at that date. This financial information does not constitute a set of financial statements for an interim period as defined by IAS 34 "Interim Financial Reporting". Societe Generale’s management intends to publish full consolidated financial statements in respect of the 2013 financial year. Note that the data for the 2012 financial year have been restated due to the implementation of the revised IAS 19, resulting in the publication of adjusted data for the previous financial year. 2- Group ROE is calculated on the basis of average Group shareholders’ equity under IFRS excluding (i) unrealised or deferred capital gains or losses booked directly under shareholders' equity excluding conversion reserves, (ii) deeply subordinated notes, (iii) undated subordinated notes recognised as shareholders’ equity (“restated”), and deducting (iv) interest payable to holders of deeply subordinated notes and of the restated, undated subordinated notes. The net income used to calculate ROE is based on Group net income excluding interest, net of tax impact, to be paid to holders of deeply subordinated notes for the period and, since 2006, holders of deeply subordinated notes and restated, undated subordinated notes (EUR 79 million at end-September 2013). As from January 1st, 2012, the allocation of capital to the different businesses is based on 9% of risk-weighted assets at the beginning of the period, vs. 7% previously. The published quarterly data related to allocated capital have been adjusted accordingly. At the same time, the normative capital remuneration rate has been adjusted for a neutral combined effect on the businesses’ historic revenues. 3- For the calculation of earnings per share, “Group net income for the period” is corrected (reduced in the case of a profit and increased in the case of a loss) for interest, net of tax impact, to be paid to holders of:
(i) deeply subordinated notes (EUR -65 million in respect of Q3 13 and EUR -190 million for 9M 13),
(ii) undated subordinated notes recognised as shareholders’ equity (EUR -14 million in respect of Q3 13 and EUR -43 million for 9M 13).
Earnings per share is therefore calculated as the ratio of corrected Group net income for the period to the average number of ordinary shares outstanding, excluding own shares and treasury shares but including (a) trading shares held by the Group and (b) shares held under the liquidity contract. 4- Net assets are comprised of Group shareholders’ equity, excluding (i) deeply subordinated notes (EUR 5.3 billion), undated subordinated notes previously recognised as debt (EUR 1.5 billion) and (ii) interest payable to holders of deeply subordinated notes and undated subordinated notes, but reinstating the book value of trading shares held by the Group and shares held under the liquidity contract. Tangible net assets are corrected for net goodwill in the assets and goodwill under the equity method. In order to calculate Net Asset Value Per Share or Tangible Net Asset Value Per Share, the number of shares used to calculate book value per share is the number of shares issued at September 30th, 2013, excluding own shares and treasury shares but including (a) trading shares held by the Group and (b) shares held under the liquidity contract. 5- The Societe Generale Group’s Core Tier 1 capital is defined as Tier 1 capital minus the outstandings of hybrid instruments eligible for Tier 1 and a share of Basel 2 deductions. This share corresponds to the ratio between core Tier 1 capital excluding hybrid instruments eligible for Tier 1 capital and Core Tier 1 capital. As from December 31st, 2011, Core Tier 1 capital is defined as Basel 2 Tier 1 capital minus Tier 1 eligible hybrid capital and after application of the Tier 1 deductions provided for by the Regulations. 6- The Group’s ROTE is calculated on the basis of tangible capital, i.e. excluding cumulative average book capital (Group share), average net goodwill in the assets and underlying average goodwill relating to shareholdings in companies accounted for by the equity method. The net income used to calculate ROTE is based on Group net income excluding interest, interest net of tax on deeply subordinated notes for the
24/26
period (including issuance fees paid, for the period, to external parties and the discount charge related to the issue premium for deeply subordinated notes and the redemption premium for government deeply subordinated notes) and interest net of tax on undated subordinated notes recognised as shareholders’ equity for the current period (including issuance fees paid, for the period, to external parties and the discount charge related to the issue premium for undated subordinated notes). 7- Funded balance sheet, loan/deposit ratio, liquidity reserve The funded balance sheet gives a representation of the Group’s balance sheet excluding the contribution of insurance subsidiaries and after netting derivatives, repurchase agreements and accruals. It has been restated to include: a) the reclassification under "repurchase agreements and securities lending/borrowing" of securities and assets delivered under repurchase agreements to clients, previously classified under “customer deposits” (excluding outstandings with the counterparty SG Euro CT amounting to EUR 3.0 billion in Q3 13); b) a line by line restatement, in the funded balance sheet, of the assets and liabilities of insurance subsidiaries; c) the reintegration in their original lines of financial assets reclassified under loans and receivables in 2008 in accordance with the conditions stipulated by the amendments to IAS 39; d) the reintegration within "long-term assets" of the operating lease fixed assets of specialised financing companies, previously classified under “customer loans”. Note that a loan to the ECB, in the funded balance sheet, was declassified from interbank assets and appears as a central bank cash deposit since it involves a very short period and is considered economically as central bank cash. The amount of the loan was EUR 14 billion at the end of Q1 13, EUR 12 billion at the end of Q2 13 and EUR 6 billion at the end of Q3 13. The Group’s loan/deposit ratio is calculated as the ratio between customer loans and customer deposits defined accordingly. The liquid asset buffer or liquidity reserve amounted to EUR 137 billion at the end of Q3 13. It consisted of EUR 58 billion of net central bank deposits and EUR 79 billion of central bank eligible assets (available, net of discount), made up primarily of so-called “HQLA” assets (High Quality Liquid Assets) eligible for the liquidity coverage ratio (LCR). All in all, these assets represented 129% of short-term outstandings (unsecured short-term debt and interbank liabilities). At September 30th, 2012, the total liquid asset buffer was EUR 142 billion (EUR 133 billion at December 31st, 2012), representing EUR 73 billion of central bank deposits (EUR 65 billion at December 31st, 2012) and EUR 69 billion of eligible assets, net of discount (EUR 68 billion at December 31st, 2012). All in all, these assets represented 100% of short-term outstandings (and 101% at December 31st, 2012). The Group also possessed EUR 31 billion of rapidly tradable assets (vs. EUR 14 billion at September 30th, 2012, and EUR 18 billion at December 31st, 2012).
25/26
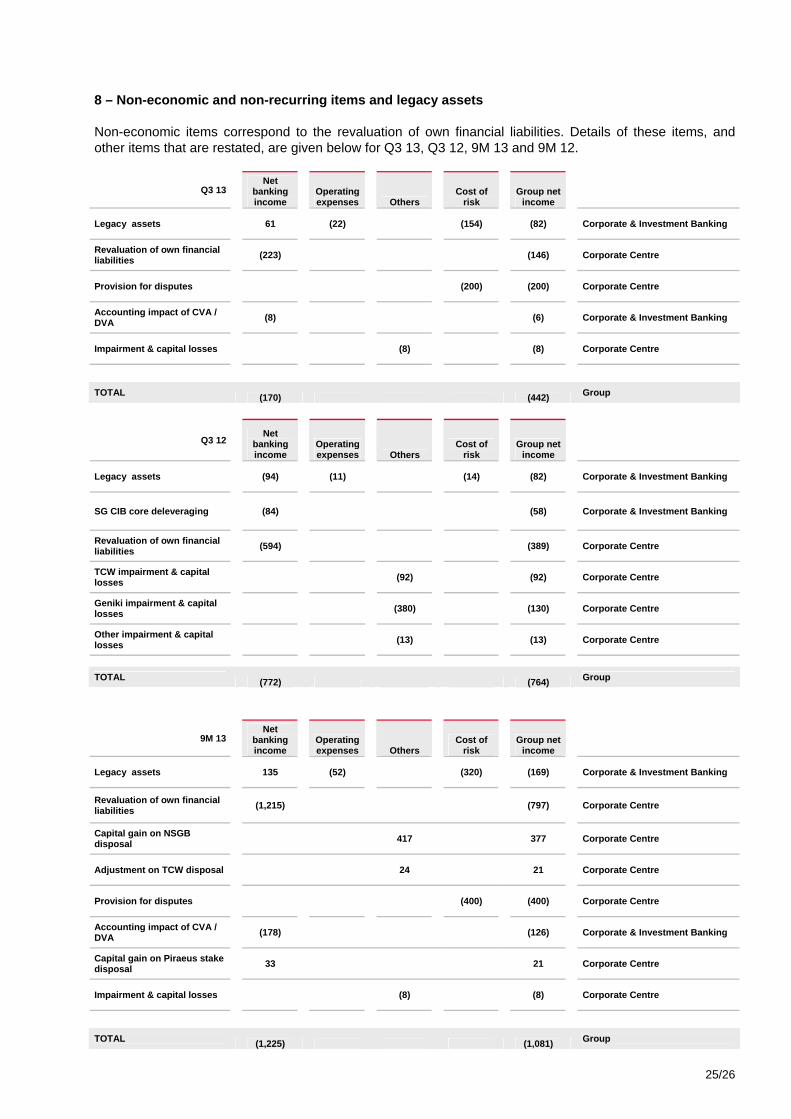
8 – Non-economic and non-recurring items and legacy assets Non-economic items correspond to the revaluation of own financial liabilities. Details of these items, and other items that are restated, are given below for Q3 13, Q3 12, 9M 13 and 9M 12.
Q3 13
Net banking income
Operating expenses Others
Cost of risk
Group net income
Legacy assets
61
(22)
(154)
(82)
Corporate & Investment Banking
Revaluation of own financial liabilities
(223)
(146)
Corporate Centre
Provision for disputes
(200)
(200)
Corporate Centre
Accounting impact of CVA / DVA
(8)
(6)
Corporate & Investment Banking
Impairment & capital losses
(8)
(8)
Corporate Centre
TOTAL (170) (442) Group
Q3 12
Net banking income
Operating expenses Others
Cost of risk
Group net income
Legacy assets
(94)
(11)
(14)
(82)
Corporate & Investment Banking
SG CIB core deleveraging
(84)
(58)
Corporate & Investment Banking
Revaluation of own financial liabilities
(594)
(389)
Corporate Centre
TCW impairment & capital losses
(92)
(92)
Corporate Centre
Geniki impairment & capital losses
(380)
(130)
Corporate Centre
Other impairment & capital losses
(13)
(13)
Corporate Centre
TOTAL (772) (764) Group
9M 13
Net banking income
Operating expenses Others
Cost of risk
Group net income
Legacy assets
135
(52)
(320)
(169)
Corporate & Investment Banking
Revaluation of own financial liabilities
(1,215)
(797)
Corporate Centre
Capital gain on NSGB disposal
417 377
Corporate Centre
Adjustment on TCW disposal
24 21
Corporate Centre
Provision for disputes
(400)
(400)
Corporate Centre
Accounting impact of CVA / DVA
(178)
(126)
Corporate & Investment Banking
Capital gain on Piraeus stake disposal
33 21 Corporate Centre
Impairment & capital losses
(8)
(8)
Corporate Centre
TOTAL (1,225) (1,081) Group
26/26
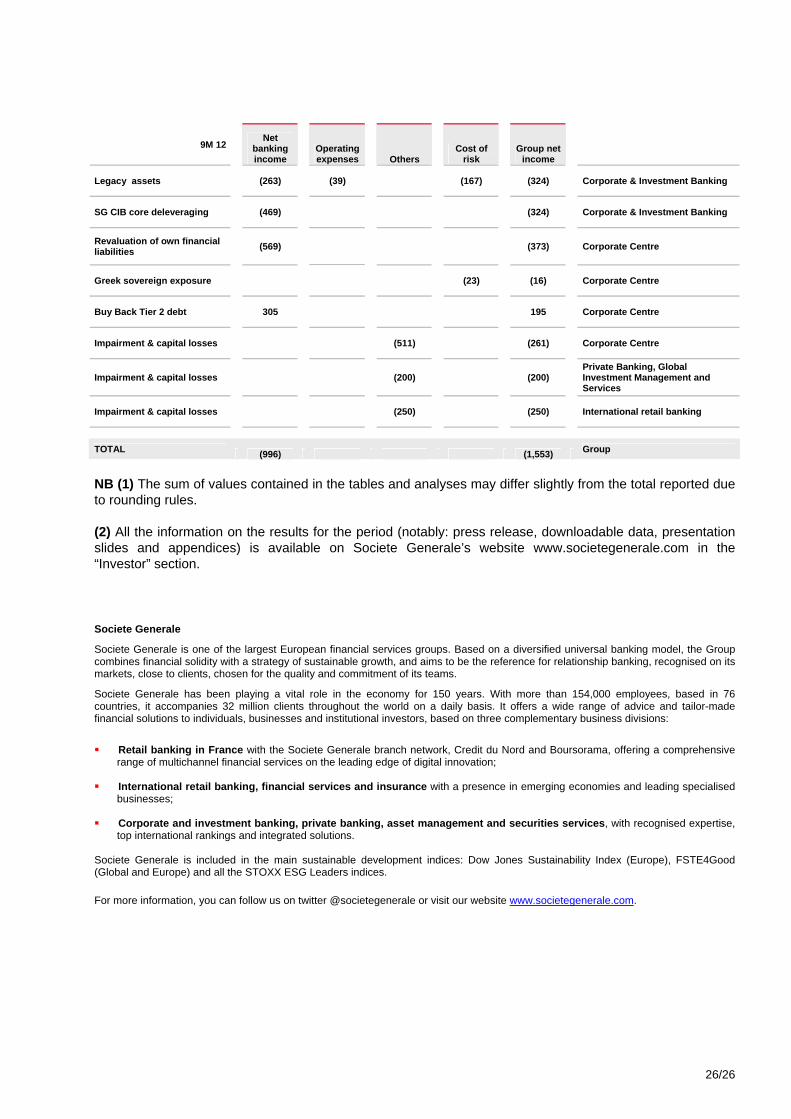
9M 12
Net banking income
Operating expenses Others
Cost of risk
Group net income
Legacy assets
(263)
(39)
(167)
(324)
Corporate & Investment Banking
SG CIB core deleveraging
(469)
(324)
Corporate & Investment Banking
Revaluation of own financial liabilities
(569)
(373)
Corporate Centre
Greek sovereign exposure
(23)
(16)
Corporate Centre
Buy Back Tier 2 debt
305
195
Corporate Centre
Impairment & capital losses
(511)
(261)
Corporate Centre
Impairment & capital losses
(200)
(200)
Private Banking, Global Investment Management and Services
Impairment & capital losses
(250)
(250)
International retail banking
TOTAL (996) (1,553) Group
NB (1) The sum of values contained in the tables and analyses may differ slightly from the total reported due to rounding rules. (2) All the information on the results for the period (notably: press release, downloadable data, presentation slides and appendices) is available on Societe Generale’s website www.societegenerale.com in the “Investor” section. Societe Generale
Societe Generale is one of the largest European financial services groups. Based on a diversified universal banking model, the Group combines financial solidity with a strategy of sustainable growth, and aims to be the reference for relationship banking, recognised on its markets, close to clients, chosen for the quality and commitment of its teams.
Societe Generale has been playing a vital role in the economy for 150 years. With more than 154,000 employees, based in 76 countries, it accompanies 32 million clients throughout the world on a daily basis. It offers a wide range of advice and tailor-made financial solutions to individuals, businesses and institutional investors, based on three complementary business divisions:
Retail banking in France with the Societe Generale branch network, Credit du Nord and Boursorama, offering a comprehensive range of multichannel financial services on the leading edge of digital innovation;
International retail banking, financial services and insurance with a presence in emerging economies and leading specialised
businesses; Corporate and investment banking, private banking, asset management and securities services, with recognised expertise,
top international rankings and integrated solutions. Societe Generale is included in the main sustainable development indices: Dow Jones Sustainability Index (Europe), FSTE4Good (Global and Europe) and all the STOXX ESG Leaders indices. For more information, you can follow us on twitter @societegenerale or visit our website www.societegenerale.com.