Embed Size (px)
Citation preview

I n tegra ted C rop Management Vol. 14–2012
ISSN 1020-4555
Natural Resource Assessmentfor Crop and Land Suitability:An application for selected bioenergy crops in Southern Africa region
Natural Resource Assessmentfor Crop and Land Suitability:An application for selected bioenergy crops in Southern Africa region

Natural Resource Assessment for Crop and Land Suitability:
An application for selected bioenergy crops in Southern Africa region
Integrated Crop Management Vol.14-2012
PLANT PRODUCTION AND PROTECTION DIVISIONFOOD AND AGRICULTURE ORGANIZATION OF THE UNITED NATIONSRome, 2012
Amir Kassam, NeBambi Lutaladio, Theodor Friedrichand Eric KuenemanPlant Production and Protection Division
and
Mirella Salvatore, Mario Bloise and Jeff TschirleyClimate, Energy and Tenure Division

The designations employed and the presentation of material in this information product do not imply the expression of any opinion whatsoever on the part of the Food and Agriculture Organization of the United Nations (FAO) concerning the legal or development status of any country, territory, city or area or of its authorities, or concerning the delimitation of its frontiers or boundaries. The mention of specific companies or products of manufacturers, whether or not these have been patented, does not imply that these have been endorsed or recommended by FAO in preference to others of a similar nature that are not mentioned.
The views expressed in this information product are those of the author(s) and do not necessarily reflect the views of FAO.
ISBN 978-92-5-107218-9
All rights reserved. FAO encourages reproduction and dissemination of material in this information product. Non-commercial uses will be authorized free of charge, upon request. Reproduction for resale or other commercial purposes, including educational purposes, may incur fees. Applications for permission to reproduce or disseminate FAO copyright materials, and all queries concerning rights and licences, should be addressed by e-mail to [email protected] or to the Chief, Publishing Policy and Support Branch, Office of Knowledge Exchange, Research and Extension, FAO, Viale delle Terme di Caracalla, 00153 Rome, Italy.
© FAO 2012

CONTENTS
iiiVol. 14–2012
FOREWORD
The cost of fossil fuel is soaring, and dependency on fossil fuels for energy is affecting the poor throughout the world with devastating effect. Increasing advocacy in favour of biofuel production worldwide and demands for new sources of energy have resulted in a growing interest in the domestication and cultivation of annual and perennial bioenergy crops, in particular species that are underutilized. Developing countries may be able to diversify their production and cope with increasing demands for energy by entering into bioenergy crop production.
However, there are constraints that must be considered before countries should make decisions to raise crops for biofuels, and many issues must be clearly articulated and managed beforehand. Among the issues to be addressed are the economic and environmental pressures on natural resources; the connected interrelationships among land resources for potential agricultural production; current and future land use to meet food security needs while managing an optimal balance of land use for crops, biofuels, habitat conservation, sustainable forestry, and so on; and the possible impact of biofuel land uses on food and energy security. To date, little systematic information on the agro-ecological conditions most favourable to cultivating many of these bioenergy crops has been available at national and regional level. Moreover, the way in which bioenergy crops can fit into a wide range of environmental and agricultural conditions is not well known.
Over the past 15 years, the ECOCROP database established by FAO has been used for global, regional and national assessments of agricultural potential. With ECOCROP, it should be possible to make use of the agro-ecological zones (AEZ) methodology and procedures, in conjunction with digitally referenced geographical databases, to characterise the crop and land suitability of plant species best adapted to different environments and uses. ECOCROP contains basic crop environmental information and makes possible the identification of plant species by matching important climate and soil requirements with the data on soil and climate entered by the user. There is thus every reason to believe that incorporating bioenergy crop requirement data into ECOCROP will help to map out suitable land areas where bioenergy crops can be developed in a cost-effective manner. It is important that suitable areas begin to be inventoried for national development strategies. Such information can assist policy-planners and decision-makers to formulate strategies and build capacity so as to support biofuel policy development, planning and implementation. However, it was recognized that no strategy would be successful if current application

iv
NATURAL RESOURCE ASSESSMENT FOR CROP AND LAND SUITABILITY: AN APPLICATION FOR SELECTED BIOENERGY CROPS IN SOUTHERN AFRICA REGION
Integrated Crop Management
and mapping functions of ECOCROP were not first adequately enhanced and expanded. Hence, the FAO Inter-Departmental Working Group on Bioenergy (IDWG-Bioenergy) provided a platform for cross-sectoral collaboration and critical resources for developing database-mapping functions and for strengthening land assessment activities related to bioenergy.
The pilot regional assessment described in the present publication was designed to initiate support for suitability assessments of bioenergy crops that are also food crops, namely cassava, sugarcane, sweet sorghum, sunflower and oil palm under rainfed production in developing countries in Southern Africa region. The goal of this work is to strengthen national policy and development capacity by providing critical bioenergy crop adaptability and land resources information (including mapping) to policy and decision-makers for socio-economic development. The assessment provides an up-to-date GIS database on climate, soil, terrain and vegetation, as well as critical data sets, methodological and analytical support and integration of FAO’s AEZ methodology including an inventory of land resources and specific ecological and agronomic adaptability requirements for selected bioenergy crops. The assessment also enhances and expands the current ECOCROP database and its applications by adding more detailed information on bioenergy crops and a mapping function to provide support to countries for decision-making and strategy development. This publication seeks to assist government and institutional policy- and decision-makers in identifying places where energy crops could be grown and in understanding the geographic (agro-ecological and economic) context of bioenergy supplies, at country and regional levels. We trust that it will not only increase awareness about the environmental challenges related to bioenergy crops production systems, but also contribute to the development of new production practices and technologies for sustainable intensification in the context of “Save and Grow”– a new FAO approach that will help cut agriculture’s contribution to climate change.
While aimed primarily at decision-makers, this publication will also be a valuable source of information for programme managers, international and multilateral development organizations, donors, NGOs, and the private sector – as well as researchers, advisors, teachers and professionals in agriculture. We trust that it will help to further strengthen FAO in-house technical capability for additional assessments within the context of national capacity development for land-use planning for bioenergy crops that are also food crops.
Shivaji Pandey Director
Plant Production and Protection Division

vVol. 14–2012
ACKNOWLEDGEMENTS
Development of the Natural resource assessment for crop and land suitability: An application for selected bioenergy crops in Southern Africa region was initiated at the end of 2009 within the context of the International Bioenergy Platform and its cross-sectorial collaboration, facilitated by FAO’s Climate, Energy and Tenure Division (NRC) in partnership with FAO’s Plant Production and Protection Division (AGP).
The preparation of the assessment described in this report has benefited FAO Bioenergy and Food Security (BEFS) project, which was funded by the Government of Germany and was one of the first efforts to ensure that food security concerns were taken into account within the bioenergy sector. Thanks to the BEFS project, opportunities for bioenergy development were explored, and tools for making informed decisions taking into account food security issues in the broader context of rural and agricultural development were made available. An analytical framework was developed in 2010 which included four key areas, of which one is related to natural resource analysis. Under the project, the crop and land suitability assessment software was developed for country analysis; for the purposes of this report the capability of the software and the analysis were extended so as to carry out the regional suitability assessment.
FAO Bioenergy Cross-sectoral Funds helped provide a campaign to raise awareness of the need for bioenergy crop information and support for its development, and AGP provided additional resources and served as a catalyst for the initiative aimed at overcoming technical and policy constraints to bioenergy crop production planning and development. The work reported in this publication was initiated and coordinated by NeBambi Lutaladio and Eric Kueneman of AGP in conjunction with Jeff Tschirley of NRC. They benefited from the close collaboration of colleagues in AGP – Amir Kassam and Theodor Friedrich, and in NRC – Mirella Salvatore and Mario Bloise.
Special thanks for their technical expertise in the compilation of the regional land resources database and in the application of the AEZ crop and land suitability methodology are due to Amir Kassam, Mirella Salvatore and Mario Bloise. Inputs from Michela Marinelli in the preparation of the climatic resources inventory and the contribution of participating experts and interested individuals in reviewing, providing constructive suggestions and in technical editing is gratefully acknowledged. Thanks are also due to Magda Morales for formatting the draft for printing and Claudia Tonini for the graphic layout.


viiVol. 14–2012
iii Forewordv Acknowledgementsxv Acronymsxvii Executive Summary
CHAPTER 11 Introduction1 Challenges and scenarios3 Main objective and scope of the report
CHAPTER 25 The framework for land resources appraisal and development
planning6 Linking productivity to ecosystem services sustainably8 Ecosystem services and climate change9 Land allocation for food security10 Linking investments to land potentials10 Research and extension11 Capacity development
CHAPTER 313 Land resources inventory13 Climatic resources inventory14 Major climate zones16 Thermal zones18 Length of rainfed growing period zones and pattern23 Soil resources inventory24 Soil information27 Soil mapping unit composition28 Landform information
CHAPTER 431 Assessing suitable land: The methodological framework and its
implementation31 Crop and land suitability assessment34 Crops and land utilization types35 Agro-climatic crop suitability36 Crop climatic adaptability and requirements39 Maximum agronomically attainable yield
CONTENTS

viii
NATURAL RESOURCE ASSESSMENT FOR CROP AND LAND SUITABILITY: AN APPLICATION FOR SELECTED BIOENERGY CROPS IN SOUTHERN AFRICA REGION
Integrated Crop Management
40 Thermal zone crop suitability42 LGP zone crop suitability43 Crop LGP suitability adjustment due to LGP pattern45 Crop LGP suitability adjustment in intermediate LGP zones46 Agro-edaphic crop suitability47 Soil unit evaluation47 Texture limitations48 Slope limitations48 Land suitability assessment
CHAPTER 551 Crop and land suitability assessments within a socio-economic
context51 Assessing the availability of land51 Land cover52 Protected areas55 Irrigation areas56 Land availability and conflicting usages59 Socio-economic context59 Infrastructure59 Population61 Poverty and malnutrition
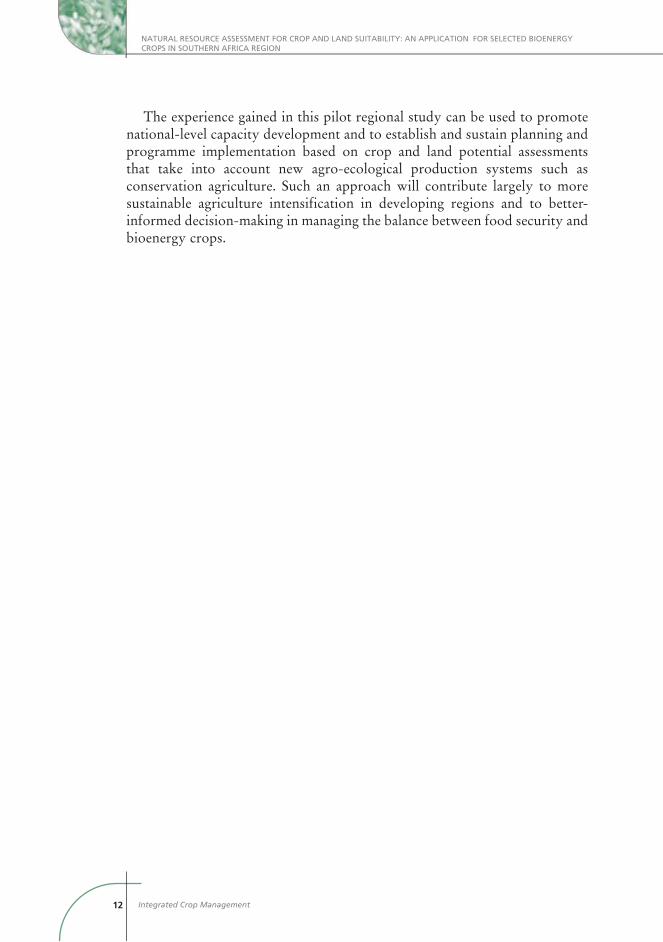
CHAPTER 665 Application: Land available for bioenergy crops66 Crops for ethanol production66 Cassava75 Sugarcane83 Sweet sorghum99 Crops for biodiesel production99 Oil Palm113 Sunflower120 Concluding remarks
123 References
125 Annex 1 – Applications of the agro-ecological zones approach127 Annex 2 – Sources of the Land Resources Inventory129 Annex 3 – An example of soil suitability ratings for sunflower133 Annex 4 – Land Suitability Assessment Software137 Annex 5 – CD Results

ixVol. 14–2012
LIST OF FIGURES AND TABLES
Figure 2.1 – Land Resources and Planning Framework 7Figure 3.1 – Meteorological stations 14Figure 3.2 – Major climate zones 16Figure 3.3 – Reference thermal zones: mean temperature during the rainfed
growing period17
Figure 3.4 – Length of rainfed growing period zones 19Figure 3.5 – Types of growing periods 20Figure 3.6 – Numbers of growing periods 21Figure 3.7 – Length of growing period pattern 22Figure 3.8 – Major soil 24Figure 3.9 – Dominant texture 25Figure 3.10 – HWSD viewer with soil mapping unit composition 28Figure 3.11 – Slope 29Figure 4.1 – Crop and Land Suitability Assessment flowchart 32Figure 5.1 – Land cover 52Figure 5.2 – Protected areas 54Figure 5.3 – Irrigation areas 56Figure 5.4 – Exclusion areas 57Figure 5.5 – Agricultural expansion and intensification areas 58Figure 5.6 – Infrastructure 60Figure 5.7 – Urban and rural population density 61Figure 5.8 – Chronic undernutrition among children 63Figure 6.1 – Agro-climatic suitability for cassava under tillage-based production
at high and low level of inputs67
Figure 6.2 – Agro-climatic suitability for cassava under Conservation Agriculture at high and low level of inputs
67
Figure 6.3 – Land suitability index for cassava under tillage-based production at low level of inputs
70
Figure 6.4 – Land suitability index for cassava under Conservation Agriculture at low level of inputs
70
Figure 6.5 – Land suitability index for cassava under tillage-based production at high level of inputs
71
Figure 6.6 – Land suitability index for cassava under Conservation Agriculture at high level of inputs
71
Figure 6.7 – Potential land for cassava expansion under tillage-based production at high level of inputs by suitability index
74
Figure 6.8 – Potential land for cassava expansion under Conservation Agriculture at high level of inputs by suitability index
74
Figure 6.9 – Agro-climatic suitability for sugarcane under tillage-based production at high and low level of inputs
76
Figure 6.10 – Agro-climatic suitability for sugarcane under Conservation Agriculture at high and low level of inputs
76

x
NATURAL RESOURCE ASSESSMENT FOR CROP AND LAND SUITABILITY: AN APPLICATION FOR SELECTED BIOENERGY CROPS IN SOUTHERN AFRICA REGION
Integrated Crop Management
Figure 6.11 – Land suitability index for sugarcane under tillage-based production at low level of inputs
78
Figure 6.12 – Land suitability index for sugarcane under Conservation Agriculture at low level of inputs
78
Figure 6.13 – Land suitability index for sugarcane under tillage-based production at high level of inputs
79
Figure 6.14 – Land suitability index for sugarcane under Conservation Agriculture at high level of inputs
79
Figure 6.15 – Potential land for sugarcane expansion under tillage-based production at high level of inputs by suitability index
82
Figure 6.16 – Potential land for sugarcane expansion under Conservation Agriculture at high level of inputs by suitability index
82
Figure 6.17 – Agro-climatic suitability for sweet sorghum (lowland) under tillage-based production at high and low level
85
Figure 6.18 – Agro-climatic suitability for sweet sorghum (lowland) under Conservation Agriculture at high and low level
85
Figure 6.19 – Agro-climatic suitability for sweet sorghum (highland) under tillage-based production at high and low level of inputs
87
Figure 6.20 – Agro-climatic suitability for sweet sorghum (highland) under Conservation Agriculture at high and low level of inputs
87
Figure 6.21 – Land suitability index for sweet sorghum (lowland) under tillage-based production at low level of inputs
89
Figure 6.22 – Land suitability index for sweet sorghum (lowland) under Conservation Agriculture at low level of inputs
89
Figure 6.23 – Land suitability index for sweet sorghum (lowland) under tillage-based production at high level of inputs
90
Figure 6.24 – Land suitability index for sweet sorghum (lowland) under Conservation Agriculture at high level of inputs
90
Figure 6.25 – Land suitability index for sweet sorghum (highland) under tillage-based production at low level of inputs
91
Figure 6.26 – Land suitability index for sweet sorghum (highland) under Conservation Agriculture at low level of inputs
91
Figure 6.27 – Land suitability index for sweet sorghum (highland) under tillage-based production at high level of inputs
92
Figure 6.28 – Land suitability index for sweet sorghum (highland) under Conservation Agriculture at high level of inputs
92
Figure 6.29 – Potential land for sweet sorghum (lowland) expansion under tillage-based production at high level of inputs by suitability index
95
Figure 6.30 – Potential land for sweet sorghum (lowland) expansion under Conservation Agriculture at high level of inputs by suitability index
95
Figure 6.31 – Potential land for sweet sorghum (highland) expansion under tillage-based production at high level of inputs by suitability index
98
Figure 6.32 – Potential land for sweet sorghum (highland) expansion under Conservation Agriculture at high level of inputs by suitability index
98
Figure 6.33 – Agro-climatic suitability for oil palm (tall) under tillage-based production at high and low level of inputs
101

xiVol. 14–2012
Figure 6.34 – Agro-climatic suitability for oil palm (tall) under Conservation Agriculture at high and low level of inputs
101
Figure 6.35 – Agro-climatic suitability for oil palm (compact) under tillage-based production at high and low level of inputs
102
Figure 6.36 – Agro-climatic suitability for oil palm (compact) under Conservation Agriculture at high and low level of inputs
102
Figure 6.37 – Land suitability index for oil palm (tall) under tillage-based production at high and low level of inputs
105
Figure 6.38 – Land suitability index for oil palm (tall) under Conservation Agriculture at high and low level of inputs
105
Figure 6.39 – Land suitability index for oil palm (compact) under tillage-based production at high and low level of inputs
106
Figure 6.40 – Land suitability index for oil palm (compact) under Conservation Agriculture at high and low level of inputs
106
Figure 6.41 – Potential land for oil palm (tall) expansion under tillage-based production at high level of inputs by suitability index
109
Figure 6.42 – Potential land for oil palm (tall) expansion under Conservation Agriculture at high level of inputs by suitability index
109
Figure 6.43 – Potential land for oil palm (compact) expansion under tillage-based production at high level of inputs by suitability index
112
Figure 6.44 – Potential land for oil palm (compact) expansion under Conservation Agriculture at high level of inputs by suitability index
112
Figure 6.45 – Agro-climatic suitability for sunflower under tillage-based production at high and low level of inputs
114
Figure 6.46 – Agro-climatic suitability for sunflower under Conservation Agriculture at high and low level of inputs
114
Figure 6.47 – Land suitability index for sunflower under tillage-based production at high and low level of inputs
116
Figure 6.48 – Land suitability index for sunflower under Conservation Agriculture at high and low level of inputs
116
Figure 6.49 – Potential land for sunflower expansion under tillage-based production at high level of inputs by suitability index
119
Figure 6.50 – Potential land for sunflower expansion under Conservation Agriculture at high level of inputs by suitability index
119
Figure A.1 – LSA interface 133Figure A.2 – Criteria manager mask 134Figure A.3 – Southern Africa project 135Figure A.4 – Introduction page 137Figure A.5 – Land Resources Inventory page 138Figure A.6 – Methodology page 138Figure A.7 – The context of the analysis page 139Figure A.8 – Map results 140Figure A.9 – Tabular results 140
Table 3.1 – Major climate classification 15Table 3.2 – Extent of major climate zones by country as percentage of total land
area15

xii
NATURAL RESOURCE ASSESSMENT FOR CROP AND LAND SUITABILITY: AN APPLICATION FOR SELECTED BIOENERGY CROPS IN SOUTHERN AFRICA REGION
Integrated Crop Management
Table 3.3 – Extent of thermal zones by country as percentage of total land area 18Table 3.4 – Extent of LGP zones by country as percentage of total land area 18Table 3.5 – Extent of LGP pattern by country as percentage of total land area 23Table 3.6 – Relationship between the first LGP and the second LGP 23Table 3.7 – Extent of major soils by country as percentage of total land area 26Table 3.8 – Extent of soil texture classes by country as percentage of total land
area27
Table 3.9 – Characteristics of the soil mapping unit 28327 27Table 3.10 – Extent of slope classes by country as percentage of total land area 30Table 4.1 – Agro-climatic, land suitability and suitability index classes 33Table 4.2 – Crops included in the assessment 34Table 4.3 – Attributes of Land Utilization Types 35Table 4.4 – Average photosynthesis response of individual leaves of four groups
of possible bioenergy crops to radiation and temperature37
Table 4.5 – Climatic adaptability attributes of crops 38Table 4.6 – Agronomically attainable reference potential yields, starch, sugar
and oil content, comparison between tillage-based agriculture (TA) and conservation agriculture (CA)
41
Table 4.7 – Crop growth cycle and thermal regime association 41Table 4.8 – Thermal zones suitability ratings 42Table 4.9 – Percentage of maximum attainable yield by LGP classes 43Table 4.10 – LGP pattern normal-normal with yields adjusted for second growing
period45
Table 4.11 – Yield reduction applied to intermediate LGP zones for tillage-based agriculture (TA) and conservation agriculture (CA)
46
Table 4.12 – Slope rating by production system 48Table 5.1 – Extent of protected areas by country as percentage of total land
area54
Table 5.2 – Extent of irrigation area by country as percentage of total land area 55Table 5.3 – Total land and total available land by country 59Table 5.4 – Population distribution by agro-climatic condition 62Table 6.1 – Percentage of agro-climatic suitable land for cassava 68Table 6.2 – Percentage of suitable land for cassava 68Table 6.3 – Percentage of suitable land for cassava expansion 72Table 6.4 – Percentage of suitable land for cassava intensification 72Table 6.5 – Cassava production (‘000 tons) in suitable land available for
expansion73
Table 6.6 – Cassava production (‘000 tons) in suitable land available for intensification
73
Table 6.7 – Percentage of agro-climatic suitable land for sugarcane 77Table 6.8 – Percentage of suitable land for sugarcane 77Table 6.9 – Percentage of suitable land for sugarcane expansion 80Table 6.10 – Percentage of suitable land for sugarcane intensification 80Table 6.11 – Sugarcane production (‘000 tons) in suitable land available for
expansion81
xiiiVol. 14–2012
Table 6.12 – Sugarcane production (‘000 tons) in suitable land available for intensification
81
Table 6.13 – Percentage of agro-climatic suitable land for sweet sorghum (lowland)
86
Table 6.14 – Percentage of suitable land for sweet sorghum (lowland) 86Table 6.15 – Percentage of agro-climatic suitable land for sweet sorghum
(highland)88
Table 6.16 – Percentage of suitable land for sweet sorghum (highland) 88Table 6.17 – Percentage of suitable land for sweet sorghum (lowland) expansion 93Table 6.18 – Percentage of suitable land for sweet sorghum (lowland)
intensification93
Table 6.19 – Sweet sorghum (lowland) production (‘000 tons) in suitable land available for expansion
94
Table 6.20 – Sweet sorghum (lowland) production (‘000 tons) in suitable land available for intensification
94
Table 6.21 – Percentage of suitable land for sweet sorghum (highland) expansion 96Table 6.22 – Percentage of suitable land for sweet sorghum (highland)
intensification96
Table 6.23 – Sweet sorghum (highland) production (‘000 tons) in suitable land available for expansion
97
Table 6.24 – Sweet sorghum (highland) production (‘000 tons) in suitable land available for intensification
97
Table 6.25 – Percentage of agro-climatic suitable land for oil palm (tall) 103Table 6.26 – Percentage of suitable land for oil palm (tall) 103Table 6.27 – Percentage of agro-climatic suitable land for oil palm (compact) 104Table 6.28 – Percentage of suitable land for oil palm (compact) 104Table 6.29 – Percentage of suitable land for oil palm (tall) expansion 107Table 6.30 – Percentage of suitable land for oil palm (tall) intensification 107Table 6.31 – Oil palm (tall) production (‘000 tons) in suitable land available for
expansion108
Table 6.32 – Oil palm (tall) production (‘000 tons) in suitable land available for intensification
108
Table 6.33 – Percentage of suitable land for oil palm (compact) expansion 110Table 6.34 – Percentage of suitable land for oil palm (compact) intensification 110Table 6.35 – Oil palm (compact) production (‘000 tons) in suitable land available
for expansion111
Table 6.36 – Oil palm (compact) production (‘000 tons) in suitable land available for intensification
111
Table 6.37 – Percentage of agro-climatic suitable land for sunflower 115Table 6.38 – Percentage of suitable land for sunflower 115Table 6.39 – Percentage of suitable land for sunflower expansion 117Table 6.40 – Percentage of suitable land for sunflower intensification 117Table 6.41 Sunflower production (‘000 tons) in suitable land available for
expansion118
Table 6.42 Sunflower production (‘000 tons) in suitable land available for intensification
118


xvVol. 14–2012
ACRONYMS AND ABBREVIATIONS
AEZ Agro-ecological zoneBEFS Bioenergy and Food SecurityCA Conservation AgricultureCC Climate changeCLSA Crop and Land Suitability AssessmentDCW Digital Chart of the WorldDEM Digital Elevation ModelDUE Data User ElementECOCROP The Crop Environmental Requirement database and the Crop
Environmental Response databaseEEA European Environmental AgencyESA European Space AgencyFAO Food and Agriculture OrganizationGAUL Global Administrative Unit LayerGIS Geographical Information SystemGOFC-GOLD Global Observations of Forest Cover and Global Observations
of Land DynamicsHWSD Harmonised World Soil DatabaseIGBP International Geosphere-Biosphere ProgrammeISRIC International Soil Reference and InformationITCZ Inter-Tropical Convergence ZoneIUCN International Union for Conservation of NatureJRC European Commission’s Joint Research CentreLCCS Land Cover Classification SystemLGP Length of growing periodLUT Land Utilization TypeMERIS Medium Resolution Imaging SpectrometerNASA National Aeronautics and Space AdministrationNGA National Geospatial-Intelligence AgencyNIMA National Imagery and Mapping AgencyPMUR Poverty Mapping Urban and RuralSCPI Sustainable crop production intensificationSI Suitability IndexSOTER Soil and terrain digital databaseSRTM Shuttle Radar Topography MissionTA Tillage-based agricultureUNEP United Nations Environment ProgrammeUNFPA United Nation Population FundVMAP0 Vector Map Level 0WPDA World Database on Protected Areas


xviiVol. 14–2012
EXECUTIVE SUMMARY
The growing demand for agricultural commodities to produce biofuels is a new force putting additional pressure on agricultural markets, in part through increased demand for agricultural commodities that have led to higher commodity prices. Concern exists over the potential impact of the demand for bioenergy crops on the food security of the poor. At the same time, the environmental effects of biofuels are under scrutiny, especially with respect to carbon sequestration and land use. Clearly, there is no “one-size-fits-all” bioenergy model; food security must always come as a first priority, and all countries should carefully consider their agricultural objectives and the means they use to encourage use of biofuels.
Natural resource assessment for crop and land suitability could help to ensure that bioenergy developments do not negatively influence short-term and longer-term food production and food security, or the environment (including protected areas, biodiversity, forests, etc.). To understand the complexity of the challenges involved and respond to them better, policy-planners and decision-makers need reliable technical information to help decide whether a country has enough land for bioenergy crops, or how existing land could produce more to allow for both food and bioenergy crop production. Investment decisions need to be based upon whether the two sectors can be managed in a balanced and sustainable way without putting the food security of the country at risk.
With these considerations in mind, FAO undertook the joint pilot work for this publication. The main objectives of the work were to:
provide a regional assessment of crop and land suitability for selected bioenergy crops – cassava, sugarcane, sweet sorghum, oil palm and sunflower– in Southern Africa region, which would involve a comparison between tillage-based production systems and Conservation Agriculture systems; andstrengthen in-house technical capability and awareness such that further bioenergy assessments and capacity development could be carried out during national planning exercises.
The methodology used is based on the FAO agro-ecological zones (AEZ) approach to crop and land suitability assessment. It is also in line with Sustainable crop production intensification (SCPI) principles, which strengthen the resilience of farming systems to socio-economic and climate risks. The reported work is a contribution to development planning processes and could be used to evaluate and test scenarios of bioenergy potential and food security risks for different time frames. Such information could be utilized by policy-makers and institutions in planning for a sustainable long-term use of national land and rural resources for development.

xviii
NATURAL RESOURCE ASSESSMENT FOR CROP AND LAND SUITABILITY: AN APPLICATION FOR SELECTED BIOENERGY CROPS IN SOUTHERN AFRICA REGION
Integrated Crop Management
The immediate outputs of the assessment are: (i) the characterisation of the climatic and soil resources of the region as part of the land resources inventory; and (ii) the analysis of crop agro-climatic suitability and crop land suitability under two production systems, each at two levels of production and management inputs.
The results of the assessment in Southern Africa region can be summarized as follow:
Sweet sorghum for bioethanol production and sunflower for biodiesel production show relatively high potential.Cassava for bioethanol production has good potential, but it should be taken into account that this is a staple food crop, second only to maize in most of the countries in the region.Sugarcane for bioethanol production and oil palm for biodiesel production have very limited potential under rainfed conditions for both production systems and at all levels of inputs.A high level of production and management inputs considerably increases potential production capacity, but in countries where accessibility to agricultural inputs is one of the most limiting factors, cost analysis and affordability studies would need to be carried out.The production management system greatly influences the extent of both potential suitable land and production, as can be seen by better agro-climatic and agro-edaphic suitability under a Conservation Agriculture system.
The land resources base and the crop and land suitability methodology are now fully available to assess additional crops to establish the geographical distribution of agro-ecological potentials. The portfolio of crops and production systems can then be deployed for other planning applications such as: linking productivity to ecosystem services sustainably; ecosystem services and climate change; land allocation for food security; research and extension; and capacity development.

1Vol. 14–2012
CHAPTER 1
Introduction
1.1 CHALLENGES AND SCENARIOSFrom 16–18 November 2009 world leaders participated in the World Summit on Food Security held at the Headquarters of the Food and Agriculture Organization of the United Nations (FAO) in Rome and renewed their commitment to eradicate world hunger. Three important events had prepared the way for this Summit:
How to Feed the World in 2050, 12–13 October 2009Committee on World Food Security, 14-15-17 October 2009The original World Food Summit, 13–17 November 1996
Each of these events highlighted the new challenges that the agriculture sector is facing: rapidly growing populations, increasing incomes that induce changes in consumer preferences (such as increased meat consumption), additional demands for both environmental services and production, and finally, stagnating investment in agriculture at both the national and international levels.
On the one hand, agriculture, especially for small- and medium-holders, has traditionally produced a wide variety of products – from food to livestock to fibres and other goods. In addition to the traditional demand for food, there is a highly significant new demand, namely growing crops – including food crops – as a source of bioenergy and raw material for other industrial purposes.
There is also a growing trend to ensure that agriculture produces crops on a sustainable basis. Numerous agro-ecosystem services, such as soil formation, nutrient cycling, food, fresh water, fuelwood, fibre, biochemicals, genetic resources, climate regulation, disease regulation, water purification, pollination; and many cultural services, such as spiritual practices, aesthetics, and heritage, were often considered “free” resources in the past. Today they are being recognized for their contribution to human well-being and economic growth.
Can the agriculture sector respond successfully to the additional new demand to produce crops for biofuels?
To date, the boom in liquid biofuels has been driven largely by policies in developed countries seeking to mitigate climate change by increasing their energy security and supporting their agricultural sectors. In the State of Food and Agriculture 2008, FAO explored biofuels by analysing their prospects, risks and opportunities, and the implications of their recent rapid growth.

2
NATURAL RESOURCE ASSESSMENT FOR CROP AND LAND SUITABILITY: AN APPLICATION FOR SELECTED BIOENERGY CROPS IN SOUTHERN AFRICA REGION
Integrated Crop Management
The growing demand for agricultural commodities to produce biofuels is an additional driver that has affected agricultural markets, in part through increased demand for agricultural commodities that have led to higher commodity prices. Concern exists over the potential impact of the demand for bioenergy crops on the food security of the poor. At the same time, the environmental effects of biofuels are under scrutiny, especially with respect to carbon sequestration and land use. Clearly, there is no “one-size-fits-all” bioenergy model; food security must always come as a first priority, and all countries should carefully consider their agricultural objectives and the means they use to encourage use of biofuels.
Nevertheless, at the same time biofuels can provide an additional avenue for agricultural diversification, income generation and rural development. They could help alleviate the chronic energy shortfall that exists in many of the poorest rural communities. Careful analysis of the agriculture value chain and its capacity to produce a range of products will reveal that there is often space to consider diversification towards biofuels. But reaping these benefits will be possible only if the appropriate policies, investments and management systems have been established beforehand. There is little doubt that over-reliance on maize and seed oils to produce biofuels is not a sustainable solution.
The effects of climate change introduce additional uncertainty about the capacity of agriculture to meet the diverse demands being placed upon it. High and volatile prices for food and agricultural commodities are a reflection of this uncertainty. They have strongly affected global markets since 2008 and are expected to do so for the longer term.
More than ever, decision-makers need clear evidence to demonstrate that the food production and food security priorities they are deciding have ensured a balanced use of the land in the context of all demands at national, regional and global levels, and that agriculture is making the most of its contribution to a country’s well-being.
To understand the complexity of the above challenges and respond to them, decision-makers require policy-relevant information about land resource potential for agriculture, in addition to current and future land use demands to meet food security needs. They also need to consider land use in the broader context of demands for biofuels, habitat conservation and forestry and the possible impact of such land uses on food security.
The methodology reported in this publication is a contribution to such proactive development planning processes. It can be used to evaluate challenges and test possible scenarios so that estimates of potential areas at risk for different future time horizons may be produced. Such information could be taken into consideration by policy-makers and institutions in planning for a sustainable long-term use of national land and rural resources for development.

3
INTRODUCTION
Vol. 14–2012
1.2 MAIN OBJECTIVE AND SCOPE OF THE REPORTThe main objective of the work reported in this publication is twofold:
provide a regional assessment of crop and land suitability for selected bioenergy crops – cassava, sugarcane, sweet sorghum, oil palm and sunflower– in Southern Africa region, involving a comparison between tillage-based production systems and Conservation Agriculture systems; andstrengthen in-house technical capability and awareness such that further bioenergy assessments and capacity development could be carried out during national planning exercises.
The assessment finds its relevance in the light of the recent increased interest in bioenergy development which could negatively affect food production if not managed on an informed basis. Natural resource assessments for crop suitability could help to ensure that bioenergy developments do not influence either short-term and longer-term food production, or impact negatively on food security or the environment (through destruction of protected areas, reduction of biodiversity, deforestation, and so on). Policy-makers need the information from such assessments to help decide whether a country has enough land for bioenergy crops and, if not, how existing land can yield more produce to allow for both food and bioenergy crop production, and how can the two sectors be managed in a sustainable way.
Chapter 2 describes the overall framework and the potential applications for development planning. Chapter 3 describes the preparatory steps in the land resources inventory required to perform the crop and land suitability analysis. Chapter 4 illustrates the methodological framework for assessing the crop and land suitability and all the steps required to perform the analysis. Chapter 5 identifies the availability of land and the socio-economic context to take into account in the analysis. Finally, Chapter 6 shows the results of the application for biofuel feedstocks. A CD in the back pocket provides an easy tool containing the land resources information compiled for the study region and the full results of the assessment.


5Vol. 14–2012
CHAPTER 2
The framework for land resources appraisal and development planning
Today’s national agricultural development challenges include food insecurity, widespread poverty, increasing energy and input costs, continuing degradation of agricultural land and decrease in biodiversity, water scarcity, climate change, globalisation and lack of international cooperation and partnerships. To respond to these challenges, countries and regional groups of countries must be able to develop and use databases of national land and agricultural resources to identify the best possible alternatives for investment in agriculture and rural development.
Reliable information has always been fundamental for the policy planning and institutional support needed for agricultural development. Over the past century the constant challenge for agriculture was to produce higher yields from a given set of inputs. The Green Revolution in Asia during the 1960s was one of the best examples of how the productivity challenge was met with great success, largely through cultivation of high-yielding varieties. The continuing challenge to increase the efficiency of the agricultural production system remains with us to this day, and with ever greater urgency and complexity.
Over the years, FAO has provided various methods to strengthen national capacity for development planning. The agro-ecological zones (AEZ) approach, which has been applied at regional and national levels for many years, has been widely recognized and used for numerous applications. In response to emerging challenges and development issues, the AEZ approach has been adapted to incorporate new knowledge, technology and analytical approaches (Annex 1).
Bioenergy crops are currently attracting considerable attention because of their potential economic and environmental advantages as well as the possible role they could play in poverty alleviation. However, these crops compete with food crops for good agricultural land, and in situations of land scarcity they can weaken national food security if suitable land for food crops or the capacity of the country to import food at competitive prices is not adequately taken into account.
The key here is to understand the agro-ecological potential of the land, while taking into account the role that crop and soil biology play in sustainable agriculture, and particularly in programmes to intensify such

6
NATURAL RESOURCE ASSESSMENT FOR CROP AND LAND SUITABILITY: AN APPLICATION FOR SELECTED BIOENERGY CROPS IN SOUTHERN AFRICA REGION
Integrated Crop Management
agriculture. Conservation agriculture (CA) systems are more sustainable, and economically, environmentally and socially superior to conventional tillage-based production systems. CA systems are also “climate-smart” in terms of adaptability and mitigation, requiring less energy and fewer agro-chemicals, thus producing more for less.
With this in mind, FAO’s Natural Resources and Agriculture and Consumer Departments undertook joint pilot work on five specific bioenergy crops to assess crop and land suitability at the regional level in one selected area, namely Southern Africa, and involving a comparison between tillage-based production systems and CA systems.
The methodology that was used called for coordinating and correlating multi-layered land resources inventory and layers of information on other land uses, with crop and land suitability assessment information. The resulting land resources base and the crop and land suitability methodology, having thus been tested in the assessment we describe in this report, can now be used to assess additional crops to establish the geographical distribution of agro-ecological potentials. The portfolio of crops and production systems can then be deployed for other planning applications as described in the following sections.
The Land Resources and Planning Framework is schematically described in Figure 2.1.
2.1 LINKING PRODUCTIVITY TO ECOSYSTEM SERVICES SUSTAINABLYAgriculture everywhere is being transformed towards systems that permit intensification without compromising on ecological sustainability. This implies producing more from the same area of land while increasing agriculture’s contribution to the natural capital and the flow of environmental services. Such systems are based on an agro-ecological approach exemplified by three core principles of CA: reduced or minimal soil disturbance practices; permanent soil cover; and crop rotations or associations, applied simultaneously together with other good agricultural practices related to integrated crop, nutrient, water and pest management.
These systems offer a range of advantages such as climate adaptability through better soil moisture regimes, or climate change mitigation through reduced greenhouse gas emissions and increased soil carbon sequestration. Such agro-ecological systems also avoid land degradation and enhance the land resources base through improvements in soil health and soil organic matter. These practices increase soil biota microorganisms and meso-fauna, water infiltration and drainage, soil moisture holding capacity, cation exchange capacity and soil aeration. They reduce soil compaction and eliminate hard plough pans, runoff and soil erosion, thus reducing pollution in water systems from soil particles, soil microorganisms and agro-chemicals. The improvements in the hydrological cycle with CA systems mean that water

7
THE FRAMEWORK FOR LAND RESOURCES APPRAISAL AND DEVELOPMENT PLANNING
Vol. 14–2012
FIGURE 2.1Land Resources and Planning Framework
resources and watershed services can be augmented in terms of quantity as well as quality with respect to sustainable intensification goals.
These positive effects and their resulting higher productivity (efficiency) along with their economic, environmental and social implications increasingly
Land ResourcesAppraisal
Land Resources Inventory
Crop and Land Suitability Assessment
informationinformation
information
Typeagro-climatic
criteriasuitability
suitability
LandAvailability and Socio-Economic
Context
PlanningApplications
Linking productivity to ecosystem services sustainably
Ecosystem services and climate change
Land allocation for food security
Land allocation for new agricultural activities’ development (i.e. biofuel)
Linking investments to land potentials
Research and extension
Capacity development
Land with environmental limitations
Other land use
Socio-economic data
areasForests
hotspot
areasareas
InfrastructurePopulation
malnutrition
Zonification

8
NATURAL RESOURCE ASSESSMENT FOR CROP AND LAND SUITABILITY: AN APPLICATION FOR SELECTED BIOENERGY CROPS IN SOUTHERN AFRICA REGION
Integrated Crop Management
need to be taken into account in development planning. By using the national and regional land resources database and crop suitability assessment approach described in this publication, it is possible to simulate the impact of sustainable intensification on various environmental parameters.
2.2 ECOSYSTEM SERVICES AND CLIMATE CHANGESocieties everywhere benefit from the many resources and processes supplied by nature. Collectively these are known as ecosystem services, and include the provisioning services of clean drinking water, and edible and non-edible biological products; processes that decompose and transform organic matter, carbon sequestration, and biologically fixed nitrogen; regulatory services that control air quality, soil erosion, pest and diseases, natural hazards; and supporting services of soil formation, nutrient cycling, water cycling, pollination (MEA, 2005). These ecosystem services operate at various nested levels from field scale to agro-ecological or watershed scale and beyond.
CA facilitates ecosystem services on agricultural land, particularly those services related to provisioning, regulating and supporting, and those derived as a result of improved conditions in the soil volume used by plant roots (Kassam et al., 2009). The improvement in the porosity of the soil is effected by the actions of the soil biota, which are present in greater abundance in the soil under CA. The mulch on the soil surface in CA systems protects against the compacting and erosive effects of heavy rain, buffers temperature fluctuations, and provides energy and nutrients to the organisms below the soil surface.
When these effects are reproduced across farms in a contiguous micro-catchment area within a landscape, the ecosystem services provided – such as clean water, sequestration of carbon, avoidance of erosion and runoff or of dust clouds – become more apparent. The benefits of more water infiltrating into the ground beyond the depth of plant roots is perceptible in terms of more regular stream flow from groundwater through the year, and/or more reliable yields of water from wells and boreholes. The benefits of carbon capture become apparent in terms of the darkening colour and more crumbly ‘feel’ of the soil, accompanied by improvements in crop growth, plus less erosion and hence less deposition of sediment in adjacent waterways. Legumes in CA rotations provide increased in situ availability of nitrogen, thus diminishing the need for large amounts of applied nitrogenous fertilizers.
The entire society benefits from CA, regardless of farm size, through diminished erosion and runoff, less downstream sedimentation and flood damage to infrastructure, better recharge of groundwater, and more regular stream flow throughout the year, resulting in a more reliable community water supply and overall better quality water. Cleaner civic water supplies also reduce treatment costs for urban/domestic use. CA contributes to increased stability of food supplies as well, because crops are more resilient when confronted

9
THE FRAMEWORK FOR LAND RESOURCES APPRAISAL AND DEVELOPMENT PLANNING
Vol. 14–2012
with drought. The rural community ultimately benefits from better nutrition, overall health and less pressure on curative health services.
In CA systems, the sequences and rotations of crops also encourage agrobiodiversity, because each crop attracts different overlapping spectra of microorganisms. The optimization of populations, range of species and effects of the soil-inhabiting biota are encouraged by recycling crop residues and other organic matter that provide the substrate for their metabolism. Crop rotation inhibits the infestation of weeds, insect pests and pathogens by interrupting their life cycles, making them more vulnerable to natural predator species, and by contributing to development-inhibiting allelochemicals. The same crop mixtures, sequences and rotations provide aboveground mixed habitats for insects, mammals and birds.
Under CA systems, it is possible to harness so many of the above-mentioned ecosystem services mostly because the ecosystem functions which generate these services are being enhanced and protected; agriculture is no longer in competition against nature but working in harmony with it.
The methodology described in this publication could be further developed in order to quantify potential effects of crops and crop production methods on specific ecosystem services such as carbon sequestration, or biological nitrogen fixation, or control of runoff and erosion. CA is considered to be a “Climate Smart Agriculture” system because it allows producers to harness higher productivities (“more for less”), while at the same time it offers greater climate change adaptability and climate change mitigation, thus imparting a greater degree of resilience and sustainability to agricultural production. The land suitability methodology can help assess the implication of climate change on food security based on different production systems such as tillage-based agriculture and CA. It can also help to assess the mitigation potential of other CA based systems, such as the System of Rice Intensification (SRI), organic farming, agroforestry or crop-livestock systems.
2.3 LAND ALLOCATION FOR FOOD SECURITYThe immediate outputs of this pilot regional study are the production estimates for bioenergy crops that are also food crops. With further work, additional crops can be added to the crop portfolio to provide such estimates. By comparing such estimates with existing production of these same crops, attention can be drawn to the priority land areas for future expansion and development of food security, and thus also provide a basis for crop forecasting and early warning programmes that are at the heart of food security management.
By using optimisation programmes that can operate on estimates of crop and land potentials, the most advantageous crops and best management levels for specific areas can be identified and selected according to policy objectives.

10
NATURAL RESOURCE ASSESSMENT FOR CROP AND LAND SUITABILITY: AN APPLICATION FOR SELECTED BIOENERGY CROPS IN SOUTHERN AFRICA REGION
Integrated Crop Management
These can be used to maximize food production in terms of calories, meet particular employment levels, optimise profit on either an area or a cash-crop basis, or provide for other perceived needs. From the estimates of calorie and protein production, it is possible to estimate potential population (human and animal) support capacity on the basis of agro-ecological units or administrative units, and thus orient population planning, agricultural development and related research. Food security measures can then be planned according to the indicated priorities.
Feeding future national, regional and global populations will require the allocation of the best land to agriculture: but the reality is that good agricultural land is often found near urban areas and is used for further urban expansion. The ability to identify the conflicts as well as the solutions to resolve them is essential. This study demonstrates that it is possible to identify land which is essential for future food security and which can also be considered suitable for bioenergy purposes. A separate study exercise will be necessary in order to determine the precise allocation and the mixture of crops.
2.4 LINKING INVESTMENTS TO LAND POTENTIALSIf estimates of crop and land potentials based on production systems and levels of inputs can be made, then key decisions on shorter- and longer-term investments for agricultural and rural development can be aligned with the estimates in order to meet production, economic, environmental and social objectives. Estimates can be carried out at the national as well as regional level, allowing strategic alliances to be forged between countries and groups of countries based on the potential of the land resources of each.
Such investments can include roads and transport networks, local and national food storage networks, investments for “low-carbon footprint” agriculture involving equipment and machinery for CA production systems (including crop-livestock systems), irrigation development, veterinary services, agriculture insurance and finance, agricultural education, research and extension, public-private partnerships, farmer organisations, investments in input supply chains, output value chains and markets, payments for environmental services, etc.
2.5 RESEARCH AND EXTENSIONThe agricultural paradigm is changing, and it requires a better definition of the natural resource base and crop and land potential, so that constraints and opportunities can be identified and geographically referenced. For example, in the case of CA, empirical evidence shows that while CA principles are universally applicable, the solutions must be adapted locally to suit prevailing socio-economic conditions, and local biophysical and other constraints, such as lack of sufficient biomass to meet all functional needs, or lack of appropriate equipment and machinery, must be taken into consideration.

11
THE FRAMEWORK FOR LAND RESOURCES APPRAISAL AND DEVELOPMENT PLANNING
Vol. 14–2012
The land resources inventory created in this report indicates the nature and distribution of agricultural land resources in Southern Africa region. Many of the steps in the crop and land suitability assessments need to be placed within a local context and adapted to those conditions. Information derived from research and extension in each country can be integrated in new assessments carried out by national teams as part of development planning for research and for extension.
Agro-ecological production systems tend to be management-intensive and require a participatory approach to learning in order to be effective; this means that farmers learn by doing. Extension agents therefore need to be able to set up benchmark “proof of concept” demonstration sites, both on-farm and on-station, to ensure that the locally derived solutions can be discovered and disseminated through participatory mechanisms. To establish relevant innovation systems involving farmers and all other stakeholders, information generated by the study can inform extension institutions and farmers’ organisations concerning the potentials of different crops and practices. This can strengthen extension and research planning at the same time that shorter- and longer-term research is being undertaken. A land-resources inventory of the region can provide an efficient way of deciding on the research and extension effort to reach maximum numbers of farmers.
2.6 CAPACITY DEVELOPMENTThe methodology presented in this publication is of a multidisciplinary nature, and for national development planning in any country, there needs to be an explicit effort made to establish local capability and capacity to engage in such crop and land suitability assessments. Crop suitability assessments can only be an entry point into developing capacity, which eventually must cover not only crops but also livestock, pastures, trees, perennial crops and various farming systems, among others. In a given country, a programme involving all the relevant institutions must be set up to undertake the creation and maintenance of the country’s land resources inventory at an appropriate scale so that reliable results can be obtained upon which to base technical and policy decisions.
The inventory created for this study is relatively simple; it can be made more sophisticated by analysing historical daily records of climatic parameters, as well as locally derived information on crop performance in different agro-ecological zones. Information on climate adaptability and the mitigation potential of conservation agriculture practices in different agro-ecological zones, on greenhouse gas emissions, and on carbon sequestration potentials would also be relevant. Information on input-output functions, as well as on insect pests, pathogens and diseases, and weeds could also greatly enhance the initial findings of this study. These are exercises that adapt well to being carried out by national and local stakeholders.
12
NATURAL RESOURCE ASSESSMENT FOR CROP AND LAND SUITABILITY: AN APPLICATION FOR SELECTED BIOENERGY CROPS IN SOUTHERN AFRICA REGION
Integrated Crop Management
The experience gained in this pilot regional study can be used to promote national-level capacity development and to establish and sustain planning and programme implementation based on crop and land potential assessments that take into account new agro-ecological production systems such as conservation agriculture. Such an approach will contribute largely to more sustainable agriculture intensification in developing regions and to better-informed decision-making in managing the balance between food security and bioenergy crops.

The productive ability of land is limited. Production limits are set by biophysical factors, namely climate, soil and landform conditions, combined with human-induced factors such as land use and management. Knowledge of the biophysical factors and their potential is thus essential for planning optimal land use and subsequent sustainable long-term agricultural and economic development. In this report the inventory of biophysical factors was carried out in 11 African countries, namely Angola, Botswana, Lesotho, Malawi, Mozambique, Namibia, South Africa, Swaziland, United Republic of Tanzania, Zambia and Zimbabwe. For simplicity, the term “study region” will be used for referring to this specific Southern Africa region.
The biophysical factors inventory consists mainly of two resources inventories, namely climatic resources and land resources. Furthermore, information on land use, law-constrained land (i.e. protected areas, concessions) and socio-economic indicators were collected to link the analyses to country reality. In the following sections, the main inventories as well as additional information are described in order to help the reader to become familiar with the study region. The sources of the maps are presented in Annex 2.
3.1 CLIMATIC RESOURCES INVENTORYThe climatic resources inventory was generated from information gathered at nearly 2000 meteorological stations across countries extracted from the FAO New_LocClim database.
As can be seen in Figure 3.1, the stations are not equally distributed within the study region. Botswana, Namibia and Angola, in particular, have only a very limited number of stations, which affects the accuracy of the interpolated surface with respect to the extent of their territory.
The main climatic data required to perform the land suitability assessment are temperature, radiation, precipitation and evapotranspiration. Temperature and moisture availability are key factors in determining the distribution of rainfed crops. In combination with solar radiation, these climatic factors condition photosynthesis and allow plants to accumulate biomass according to their eco-physiological rates and patterns. Depending on the location, further information is required to characterize in detail the climate zones, rainfall and growing period patterns.
Long-term monthly average data on temperature, radiation, precipitation and evapotranspiration (dating back to 1971) from these meteorological
CHAPTER 3
Land resources inventory
13Vol. 14–2012

14
NATURAL RESOURCE ASSESSMENT FOR CROP AND LAND SUITABILITY: AN APPLICATION FOR SELECTED BIOENERGY CROPS IN SOUTHERN AFRICA REGION
Integrated Crop Management
stations were used in combination with altitude and rainfall patterns to generate the three primary climate datasets: climate zones, thermal zones and length of growing period (LPG) zones.
3.1.1 Major climate zones Major climates are defined by the prevailing climatic conditions based on the average monthly temperature, and whether rain falls mainly in the summer or winter season (FAO, 1978–81). The major climate zones in Southern Africa region represent the major latitudinal belts, namely the tropics and subtropics with summer or winter rainfall.
The zones were identified following the classification reported in Table 3.1.
FIGURE 3.1Meteorological stations

15
LAND RESOURCES INVENTORY
Vol. 14–2012
TABLE 3.1Major climate classificationClimate zones Description
Tropics All months with monthly mean temperatures, corrected to sea level, above 18°C
Subtropics One or more months with monthly mean temperatures, corrected to sea level, below 18°C but above 5°C
Subtropics summer rainfall Northern hemisphere: rainfall in April–September ≥ rainfall in October–March
Southern hemisphere: rainfall in October–March ≥ rainfall in April–September
Subtropics winter rainfall Northern hemisphere: rainfall in October–March ≥ rainfall in April–September
Southern hemisphere: rainfall in April–September ≥ rainfall in October–March
TABLE 3.2Extent of major climate zones by country as percentage of total land area
CountryTropics Subtropics
(summer rainfall)Subtropics
(winter rainfall) Total Land
% % % ‘000 ha
Angola 98.7 1.3 - 124,945
Botswana 85.9 14.1 - 57,178
Lesotho - 100.0 - 2,968
Malawi 100.0 - - 9,483
Mozambique 100.0 - - 77,636
Namibia 73.3 23.9 2.8 82,083
South Africa 13.1 73.2 13.7 120,067
Swaziland 93.2 6.8 - 1,637
Tanzania 100.0 - - 88,107
Zambia 100.0 - - 73,638
Zimbabwe 100.0 - - 38,318
Total 79.4 17.8 2.8 676,060
In the study region the three climate zones are geographically distributed as shown in Figure 3.2. The tropics cover almost 80 percent of the area. The subtropics with summer rainfall (17.8 percent) can be found in the south and west of Namibia, in the south in Botswana, in all of Lesotho and in a large part of South Africa; the subtropics with winter rainfall (2.8 percent) is limited mainly to the west coast of South Africa. The extent of each climate zone by country is reported in Table 3.2.

16
NATURAL RESOURCE ASSESSMENT FOR CROP AND LAND SUITABILITY: AN APPLICATION FOR SELECTED BIOENERGY CROPS IN SOUTHERN AFRICA REGION
Integrated Crop Management
3.1.2 Thermal zones The thermal zones are defined by the amount of heat available for plant growth and development during the growing period, which is the time during which climate conditions, in particular rainfall, will permit adequate water supply for crop production. Temperature influences crop photosynthesis and growth rates as well as the developmental sequence of crop growth in relation to crop phenology. In some cases, temperature may determine whether a particular development process will begin and continue, or not. Less than optimal low temperatures can also delay flowering and fruit setting, or can lead to poor fruit setting and loss in yield and quality. In the same way, less than optimal high temperatures can cause heat and water stress and lead to poor quality and quantity of yield.
FIGURE 3.2Major climate zones

17
LAND RESOURCES INVENTORY
Vol. 14–2012
Figure 3.3 shows the map of reference temperature zones based on the following temperature groups (in degrees Celsius): >25.0, 25.0–22.5, 22.5–20.0, 20.0–17.5, 17.5–15.0, 15.0–12.5, <12.5 C. The extent of each thermal zone as percent of total country land area for each country is presented in Table 3.3. Temperatures above 25 °C in the growing period are found largely in Mozambique, in Tanzania’s coastal area and in a very limited coastal area in northwestern Angola. The lowest temperatures (below 15 °C) are in the southwest on the coast of Namibia and South Africa, and in Lesotho. At regional level, the predominant temperatures are in the range 20–22.5 °C, followed by 22.5–25 °C.
FIGURE 3.3Reference thermal zones: mean temperature during the rainfed growing period

18
NATURAL RESOURCE ASSESSMENT FOR CROP AND LAND SUITABILITY: AN APPLICATION FOR SELECTED BIOENERGY CROPS IN SOUTHERN AFRICA REGION
Integrated Crop Management
TABLE 3.4Extent of LGP classes by country as percentage of total land area
Country
0 1 –
29
30 -
59
60 -
89
90 -
- 11
9
120
- 14
9
150
- 17
9
180
- 20
9
210
- 23
9
240
- 26
9
> 2
70*
Total Land
% % % % % % % % % % % ‘000 ha
Angola - 1.1 1.1 2.4 6.3 15.3 17.4 23.7 24.5 8.2 - 124,945
Botswana 0.6 14.0 36.0 38.0 11.4 - - - - - - 57,178
Lesotho - - - - - 4.2 11.7 34.6 35.7 11.4 2.4 2,968
Malawi - - - - - 16.0 58.1 20.9 4.4 0.6 - 9,483
Mozambique - - 0.8 3.1 3.5 23.0 48.2 12.1 7.3 2 - 77,636
Namibia 31.6 18.7 13.4 19.5 16.6 0.2 - - - - - 82,083
South Africa 13.6 20.8 13.1 10.0 9.9 8.3 6.7 9.7 3.6 1.7 2.6 120,067
Swaziland - - - - 3.0 10.0 33.8 24.7 27.3 1.2 - 1,637
Tanzania - - - - 0.6 20.3 42.2 32.0 4.4 0.4 0.1 88,107
Zambia - - - - 2.7 41.3 43.0 13.0 - - - 73,638
Zimbabwe 0.5 2.1 2.3 4.1 26.7 53.4 10.0 0.7 0.2 - - 38,318
Total 6.3 7.5 7.4 8.4 8.2 17.5 21.5 13.6 6.9 2.2 0.5 676,060
* the last three classes were aggregated because of the small area covered.
TABLE 3.3Extent of thermal zones by country as percentage of total land area
Country> 25 25 -22.5 22.5 - 20 20 – 17.5 17.5 - 15 15 - 12.5 < 12.5 Total Land
% % % % % % ‘000 ha
Angola 5.1 33.5 56.7 4.7 - - 124,945
Botswana - 38.3 56.1 5.6 - - 57,178
Lesotho - - - - 69.9 30.1 2,968
Malawi 4.0 52.4 43.6 - - - 9,483
Mozambique 57.1 38.0 4.8 0.1 - - 77,636
Namibia - 23.7 39.0 21.0 16.3 - 82,083
South Africa 0.7 7.2 23.5 37.8 23.1 7.5 0.2 120,067
Swaziland - 51.3 25.6 23.1 - - 1,637
Tanzania 16.3 41.2 38.2 4.3 - - 88,107
Zambia - 25.6 71.0 3.4 - - 73,638
Zimbabwe 3.8 46.8 44.7 4.7 - - 38,318
Total 10.0 29.7 40.6 11.8 6.4 1.5 0.2 676,060
3.1.3 Length of rainfed growing period zones and patternAverage monthly rainfall (1971–2000) is the main information used to calculate the moisture availability used for crop development and growth. The moisture attributes are quantified using the growing period as the time reference; this is defined as the duration (in days) of the period during which the supply of available water in soil moisture, and from storage in the soil profile (set at a reference 100 mm), is greater than half of the potential evapotranspiration (ET). The calculation is based on a water balance model, comparing rainfall with ET. The length of the growing period (and the number of growing periods

19
LAND RESOURCES INVENTORY
Vol. 14–2012
and dry periods per year) from a climatic point of view, and independent of crop, soil and landform, is therefore quantified in a referenced manner (Kowal & Kassam, 1978; FAO, 1979).
As shown in Figure 3.4 and described in Table 3.4 in terms of proportion of total land area, the arid zone (LGP < 60 days) covers a large part of Namibia, South Africa and Botswana; the dry semi-arid zone (60 < LGP < 119 days) is dominant in the coastal area of Angola and in the northern parts of Namibia and Botswana; the moist semi-arid zone (120 < LGP < 179 days) covers the southern part of Angola, almost all Zambia, Zimbabwe, Mozambique, and the central plateau of Tanzania; the sub-humid zone (180 < LGP < 269 days) is prevalent in the eastern part of South Africa, in the northern part of Angola, in the Zambezi river valley in Mozambique and in the remaining part in Tanzania; and the humid zone (LGP > 270 days) is limited to the east coast of South Africa.
FIGURE 3.4Length of rainfed growing period zones

20
NATURAL RESOURCE ASSESSMENT FOR CROP AND LAND SUITABILITY: AN APPLICATION FOR SELECTED BIOENERGY CROPS IN SOUTHERN AFRICA REGION
Integrated Crop Management
Several types of growing periods have been identified; these are schematically shown in Figure 3.5: normal, intermediate, year-round humid and year-round dry.
A normal growing period is made up of three moisture periods: the first intermediate moisture period followed by the humid period and concluded by the second intermediate moisture period.
The distinction between “normal” (a) and “intermediate” (b) is significant. Intermediate means that it is unlikely that full water requirements can be met during the rainy season without moisture conservation or a supply from groundwater or irrigation. In fact the growing period is defined as intermediate when the average precipitation does not exceed the full rate of the average ET, but it does exceed half the ET. The beginning and the end of such an intermediate growing period are defined as the points at which the precipitation curve crosses the 0.5 ET curve and there is no humid period. Year-round growing periods are: (c) year-round humid with rainfall exceeding full ET throughout the year, and (d) year-round dry with rainfall not exceeding half the ET throughout the year.
B – Beginning of growing period; BH – Beginning of humid period; EH – End of humid period; ER – End of rainy season; E – End of growing period; P – Precipitation; ET – Potential evapotranspiration
FIGURE 3.5Types of growing periods

21
LAND RESOURCES INVENTORY
Vol. 14–2012
Furthermore, normal and intermediate growing periods could occur one or more times during the year, identifying the so-called LGP pattern. A theoretical representation is shown in Figure 3.6. The unimodal pattern is represented in (a): in a 12-months period only one normal growing period occurs. The bimodal LGP pattern arises when distinct growing periods occur and they are separated by a dry period, where the precipitation is less than half the ET. In Figure 3.6 a bimodal “normal” pattern is shown in (b), whereas in (c) a pattern composed by one normal growing period and one intermediate period can be found.
In the case of an LGP (b)-type pattern for the region, both growing periods are normal, and the second growing period is sufficiently long to ensure sufficient crop growth for a crop and land suitability assessment. In the case of an LGP (c)-type pattern, the second growing period is intermediate in nature and will not be long or reliable enough for crop production. Hence the
FIGURE 3.6Numbers of growing periods
L1 – First growing period; L2 – Second growing period;D1 – First dry period; D2 – Second dry period;B1 – Beginning of the first growing period; B2 – Beginning of the second growing period;E1 – End of the first growing period; E2 – End of the second growing period.

22
NATURAL RESOURCE ASSESSMENT FOR CROP AND LAND SUITABILITY: AN APPLICATION FOR SELECTED BIOENERGY CROPS IN SOUTHERN AFRICA REGION
Integrated Crop Management
second growing period will affect crop and land suitability at the regional level in only a minor way. However, it is suggested that the level of significance be examined more carefully when more detailed individual country studies can be undertaken.
In Figure 3.7, the LGP types and patterns in the study region are depicted; in Table 3.5 the percent area by country is reported. In the west a year-round dry area covers large parts of Namibia and South Africa. In the central part of the study region the intermediate growing period is dominant. In the remaining area a normal growing period occurs. The two types of bimodal LGP patterns occur in the bimodal rainfall zones in northern parts of Tanzania. Only the first of the two growing periods was inventoried.
FIGURE 3.7Length of growing period pattern

23
LAND RESOURCES INVENTORY
Vol. 14–2012
At the regional level, the dominant LGP type is normal, covering almost 60 percent of total land area, followed by intermediate (24.5 percent). The year-round dry type in Southern Africa is quite large (15 percent) with an area of more than 100 million ha.
For the purpose of matching crops to LGP, information for both LGPs is required in order to estimate any additional agronomic yield potential. As an example, the relationship between the first LGP and second LGP for the bimodal type (b) LGP pattern in northern Tanzania is provided in Table 3.6.
3.2 SOIL RESOURCES INVENTORYThe soil resources inventory consists mainly of two components: soil information with various data concerning type, texture, mapping and so on; and landform information, including slope data. The soil information was extracted from the Harmonized World Soil Database (HWSD) (FAO et al., 2008), which used as source for this specific area the Soil and Terrain (SOTER) digital database for Southern Africa (FAO/ISRIC, 2003).
TABLE 3.5Extent of LGP pattern by country as percentage of total land area
Country
Unimodal Bimodal No LGP All year-round humid Total Land
Normal Intermediate Normal-Normal Dry
% % % % % ‘000 ha
Angola 96.7 1.6 - 1.7 - 124,945
Botswana 1.0 86.0 - 13.0 - 57,178
Lesotho 17.0 83.0 - - - 2,968
Malawi 100.0 - - - - 9,483
Mozambique 89.9 10.1 - - - 77,636
Namibia 7.4 43.1 - 49.5 - 82,083
South Africa 15.3 42.0 - 41.2 1.5 120,067
Swaziland 37.5 62.5 - - - 1,637
Tanzania 85.5 7.7 6.8 - - 88,107
Zambia 100.0 - - - - 73,638
Zimbabwe 66.3 28.9 - 4.8 - 38,318
Total 59.3 24.5 0.9 15.0 0.3 676,060
TABLE 3.6 Relationship between the first LGP and the second LGP
First LGP (mapped)
Second LGP (not mapped)
Total LGP (First + Second)
90-119 50-74 140-193
120-149 75-98 195-247
150-179 99-122 249-299
180-209 123-146 303-355
210-215 147-150 357-365

24
NATURAL RESOURCE ASSESSMENT FOR CROP AND LAND SUITABILITY: AN APPLICATION FOR SELECTED BIOENERGY CROPS IN SOUTHERN AFRICA REGION
Integrated Crop Management
3.2.1 Soil informationThe HWSD provides information on standardized soil parameters for top- and subsoil for each soil unit composition (see details in Section 3.2.1.1). In particular the database contains information on dominant and associate soils (and their proportion); texture and phases; and physical and chemical characteristics of topsoil (0-30 cm) and subsoil (30-100 cm). For illustrative convenience the major soil group and the dominant texture in the study region is reported in Figure 3.8 and Figure 3.9. The information of the extent of the major soils is presented in Table 3.7.
FIGURE 3.8Major soil

25
LAND RESOURCES INVENTORY
Vol. 14–2012
The arenosol is the most frequent soil group in Angola, Botswana and Namibia; the leptsols is found dominantly in Lesotho, South Africa and Swaziland; the ferrosols in Malawi and Zambia; and the cambisols in Tanzania. In Mozambique the lixisols covers 24.4 percent of the country, and in Zimbabwe the dominant soil group, luvisols, covers 26.4 percent of the total land area. In the overall study region arenosol is the most frequent soil group with 28.5 percent of coverage, followed by leptsols (13.6), ferralsols (12.4) and cambisols (10.5).
Table 3.8 shows the extent of soil texture by country and in the region. In Angola, Botswana, Mozambique, Namibia and Zimbabwe, the predominant soil texture is coarse; in Lesotho, Malawi, South Africa, Swaziland, Tanzania and Zambia the main texture is medium. Fine texture does not predominate in
FIGURE 3.9Dominant texture

26
NATURAL RESOURCE ASSESSMENT FOR CROP AND LAND SUITABILITY: AN APPLICATION FOR SELECTED BIOENERGY CROPS IN SOUTHERN AFRICA REGION
Integrated Crop Management
TAB
LE 3
.7Ex
ten
t o
f m
ajo
r so
ils b
y co
un
try
as p
erce
nta
ge
of
tota
l lan
d a
rea
Co
un
try
Maj
or
soil
Angola
Botswana
Lesotho
Malawi
Mozambique
Namibia
South Africa
Swaziland
Tanzania
Zambia
Zimbabwe
Tota
l lan
d b
y m
ajo
r so
ilSh
are
on
to
tal
reg
ion
al la
nd
%%
%%
%%
%%
%%
%‘0
00 h
a%
Acr
iso
ls0.
4-
--
4.6
-5.
51.
66.
5-
1.7
17,0
722.
5
Alis
ols
2.0
--
--
--
--
--
2,51
70.
4
An
do
sols
--
--
--
--
2.4
--
2,15
90.
3
Are
no
sols
55.1
78.1
--
14.5
36.8
15.1
-2.
912
.919
.619
2,81
228
.5
Cal
ciso
ls2.
84.
2-
-0.
911
.02.
3-
--
0.3
18,4
482.
7
Cam
bis
ols
2.8
0.5
-1.
13.
56.
018
.3-
38.7
-8.
370
,809
10.5
Ch
ern
oze
ms
--
--
0.1
--
-0.
5-
-52
20.
1
Ferr
also
ls22
.6-
0.7
32.7
4.4
-1.
210
.110
.950
.71.
383
,736
12.4
Flu
viso
ls1.
10.
2-
11.7
5.2
0.6
0.2
-2.
90.
50.
510
,379
1.5
Gle
yso
ls-
--
-0.
2-
--
0.3
10.8
-8,
439
1.2
Gyp
siso
ls-
--
--
1.7
--
--
-1,
361
0.2
His
toso
ls-
1.1
-0.
4-
--
-0.
41.
7-
2,30
10.
3
Kas
tan
oze
ms
--
--
--
0.1
--
--
730.
0
Lep
toso
ls6.
13.
277
.721
.37.
927
.224
.325
.17.
08.
419
.591
,617
13.6
Lixi
sols
0.2
2.6
0.1
15.5
24.4
-4.
8-
3.6
0.1
11.9
35,7
695.
3
Luvi
sols
5.1
8.2
--
11.2
-12
.30.
18.
310
.126
.459
,391
8.8
Nit
iso
ls0.
1-
-8.
5-
-0.
82.
61.
70.
30.
73,
937
0.6
Phae
oze
ms
0.3
--
-5.
3-
0.8
-2.
5-
0.9
7,92
11.
2
Plan
oso
ls-
-21
.3-
2.1
-0.
720
.13.
2-
-6,
163
0.9
Plin
tho
sols
--
-4.
2-
-1.
2-
--
-1,
874
0.3
Pod
zols
--
--
--
--
-1.
7-
1,30
50.
2
Reg
oso
ls0.
31.
00.
10.
5-
8.1
8.1
29.3
0.1
0.1
0.3
18,1
192.
7
Solo
nch
aks
-0.
4-
--
-1.
1-
0.3
-1.
02,
128
0.3
Solo
net
z0.
6-
--
13.1
0.8
0.9
-2.
2-
4.3
16,2
452.
4
Ver
tiso
ls0.
50.
5-
1.3
1.9
0.8
2.3
11.0
5.3
2.3
3.1
13,7
812.
0
Wat
er B
od
ies
--
-2.
80.
5-
-0.
10.
30.
40.
21,
294
0.2
Un
clas
sifi
ed-
-0.
1-
0.2
7.0
--
--
-5,
888
0.9
Tota
l lan
d a
rea
124,
945
57,1
782,
968
9,48
377
,636
82,0
8312
0,06
71,
637
88,1
0773
,638
38,3
1867
6,06
0

27
LAND RESOURCES INVENTORY
Vol. 14–2012
TABLE 3.9Characteristics of the soil mapping unit 28327
Soil Unit Symbol (FAO 90)
Soil Unit Name (FAO 90)
Share in Soil Mapping Unit
(%)Topsoil Texture
CMc Calcaric Cambisols 66 Medium
LVk Calcic Luvisols 23 Medium
CLp Petric Calcisols 6 Medium
GLe Eutric Gleysols 5 Medium
TABLE 3.8Extent of soil texture classes by country as percentage of total land area
CountryCoarse Medium Fine Total Land
% % % ‘000 ha
Angola 62.8 22.6 14.6 124,945
Botswana 83.0 9.2 7.8 57,178
Lesotho 0.3 53.3 46.4 2,968
Malawi 8.7 53.7 37.6 9,483
Mozambique 53.0 32.7 14.3 77,636
Namibia 64.2 35.1 0.7 82,083
South Africa 17.9 66.8 15.3 120,067
Swaziland 9.4 52.2 38.4 1,637
Tanzania 7.4 48.7 43.9 88,107
Zambia 32.6 49.0 18.4 73,638
Zimbabwe 51.0 34.1 14.9 38,318
Total 43.2 39.5 17.2 676,060
any country but the largest shares are in Lesotho and Tanzania. Overall, in the region the texture that occurs most frequently is coarse, covering 43.2 percent of the total area.
3.2.2 Soil mapping unit compositionAt the exploratory level, a soil mapping unit only rarely comprises a single soil; usually it consists of one main soil with minor associates. When the various soils of a soil mapping unit occur in a recognisable geographical pattern in defined proportions, they constitute a soil association; if such a pattern is absent, they form a soil complex. Each soil mapping unit in the study region may contain a maximum of six soil types, with different proportions and characteristics. A detailed example of soil mapping unit composition is reported below. The soil mapping unit 28327 is in South Africa and the dominant soil group is Cambisols.
The unit contains four soil units, and detailed characteristics are reported in Table 3.9.

28
NATURAL RESOURCE ASSESSMENT FOR CROP AND LAND SUITABILITY: AN APPLICATION FOR SELECTED BIOENERGY CROPS IN SOUTHERN AFRICA REGION
Integrated Crop Management
The Harmonised World Soil Database provides a free viewer to interrogate the soil information. Figure 3.10 shows the viewer and all the information related to the soil mapping unit 28327.
The productivity potential of different soil units within a soil mapping unit may consequently vary widely. The suitability of soil association (soil complex) for a specific use cannot be assessed without taking account of each individual soil unit within the association. This is the main reason why the map of the crop and land assessment for a specific crop is as a suitability index (as already described in Section 2.1), i.e. a weighted average of the suitability of each soil association.
3.2.3 Landform informationAs indicated above, slope as a limiting factor for land workability, was used as proxy to define the landform of the terrain in the region. Slope information was derived from the Digital Elevation Model (DEM) database and is expressed in percentage. The DEM, at 90-meter resolution, is released by the Shuttle Radar Topography Mission (SRTM), a joint project between the National Geospatial-Intelligence Agency (NGA) and the National Aeronautics and Space Administration (NASA).
FIGURE 3.10HWSD viewer with soil mapping unit composition

29
LAND RESOURCES INVENTORY
Vol. 14–2012
In the study region, the terrain is predominantly flat with a slope below five percent (Table 3.10, Figure 3.11). In South Africa, Lesotho and Swaziland, areas with a higher slope (> 12 percent ) can be found. The Drakensberg, or so-called Dragon Mountains, is the highest mountain range in Southern Africa, rising to 3482 metres.
In Malawi and Tanzania there are also areas with considerable slope (8–16 percent), representing the Kipengere Range, also known as the Livingstone Mountains, which lie in southwest Tanzania at the northern end of Lake Malawi.
FIGURE 3.11Slope

30
NATURAL RESOURCE ASSESSMENT FOR CROP AND LAND SUITABILITY: AN APPLICATION FOR SELECTED BIOENERGY CROPS IN SOUTHERN AFRICA REGION
Integrated Crop Management
TABLE 3.10Extent of slope classes by country as percentage of total land area
Country 0 -
2
2 -
5
5 -
8
8 -
12
12 -
16
16 -
23
23 -
30
> 3
0* Total Land
% % % % % % % % ‘000 ha
Angola 70.1 24.1 3.3 1.4 0.6 0.4 0.1 0.0 124,945
Botswana 99.1 0.8 0.1 0.0 0.0 0.0 0.0 0.0 57,178
Lesotho 5.9 17.9 19.5 23.9 16.2 13.0 2.9 0.7 2,968
Malawi 55.8 24.8 9.4 5.2 2.3 1.8 0.5 0.2 9,483
Mozambique 81.8 12.9 2.7 1.5 0.6 0.4 0.1 0.0 77,636
Namibia 79.4 14.4 3.4 1.7 0.6 0.4 0.1 0.0 82,083
South Africa 60.4 22.1 8.0 4.9 2.3 1.6 0.5 0.2 120,067
Swaziland 29.6 33.7 17.6 11.9 4.7 2.3 0.2 0.0 1,637
Tanzania 64.8 22.7 6.0 3.3 1.5 1.1 0.4 0.2 88,107
Zambia 84.0 12.1 2.3 1.0 0.4 0.2 0.0 0.0 73,638
Zimbabwe 73.6 19.1 4.2 1.9 0.7 0.4 0.1 0.0 38,318
Total 73.7 17.6 4.3 2.3 1.1 0.7 0.2 0.1 676,060* the last three classes were aggregated because of the small area covered

31
CHAPTER 4
Assessing suitable land: The methodological framework and its implementation
Vol. 14–2012
The methodological framework for assessing suitable land is the Crop and Land Suitability Assessment (CLSA). CLSA is based on an agro-ecological zoning approach developed and used by FAO since 1978 (FAO, 1978; FAO, 1993). It is used to evaluate the suitability of a specific location for producing a particular crop under a defined agricultural production system based on the agro-climatic (i.e. thermal and moisture) conditions, and on the agro-edaphic (i.e. soil and landform) conditions.
A crop and land suitability assessment was conducted for the Southern Africa region for five bioenergy crops, namely cassava, sugarcane, sweet sorghum, sunflower and oil palm under rainfed production. The assessment was carried out for two production systems (tillage-based [TA] and conservation agriculture [CA]) and using two levels of inputs (low and high). The overall analysis was conducted for rainfed conditions, as this best describes the current agriculture management practice in the study region.
4.1 CROP AND LAND SUITABILITY ASSESSMENT The suitability of a given portion of land is expressed as a percentage of the maximum attainable yield for each crop. The CLSA then evaluates the potential production for such areas. There are several steps to this analysis once the Land Resources Inventory described in Chapter 3 has been set up:
define the Land Utilization Type (LUT), which is a combination of crop, production system and level of inputs;formulate the climatic and soil-related edaphic suitability assessment criteria for each LUT;apply LUT-specific agro-climatic criteria to derive crop agro-climatic suitability assuming no edaphic constraints; andapply LUT-specific agro-edaphic criteria to derive land suitability in terms of suitability classes and extent.
A detailed flowchart of the CLSA methodology can be found in Figure 4.1.

32
NATURAL RESOURCE ASSESSMENT FOR CROP AND LAND SUITABILITY: AN APPLICATION FOR SELECTED BIOENERGY CROPS IN SOUTHERN AFRICA REGION
Integrated Crop Management
The LUT definition is the crucial starting point of the analysis. The level of details to which the LUTs are defined is principally determined by the objectives of the study. More details in the LUT definition can provide information for estimating crop production costs.
The following factors are implied in the LUT definition:The description of an existing or anticipated agricultural production system in terms of crops, production techniques, and expected type and range of inputs.The identification of important factors that affect production potential, such as limits to mechanisation on sloping lands, or soil requirements for irrigation.The production scenarios to be modelled and the level at which production constraints are assumed to have been overcome in each scenario.
FIGURE 4.1Crop and Land Suitability Assessment flowchart

33
ASSESSING SUITABLE LAND: THE METHODOLOGICAL FRAMEWORK AND ITS IMPLEMENTATION
Vol. 14–2012
The quantification of human and financial capital (labour, materials, capital, etc.) associated with various production scenarios, defined mainly on market orientation.
The LUT definition makes it possible to estimate the anticipated output or maximum attainable yield, which corresponds to a certain level of input. The maximum attainable yield is based on crop models and agronomic expertise as well as field surveys at farmer level (more details in Section 4.2). Geo-referenced and tabular information on climate and soil attributes should be compiled within the LUT definition in order to run the suitability analysis.
The agro-climatic and agro-edaphic criteria are formulated by interpreting climate and soil-related information in terms of any yield-reducing limiting factors or constraints to achieve the maximum attainable yield for a specific LUT.
The extent (in hectares) of LUT-specific agro-climatic suitability and land suitability (agro-climatic and agro-edaphic suitability combined) is expressed as one of the six suitability classes listed in Table 4.1.
The extent of land suitability of an inventoried land unit is thus expressed in terms of a suitability index (SI), defined as the aggregate average land potential of a specific area location to achieve a certain percentage of the maximum attainable yield for a specific crop based on the combined agro-climatic and soil conditions. The SI is based on the same six suitability classes as above. An SI of “marginally suitable” (MS) for a particular inventoried thematic land unit does not mean that all the land in the unit is uniformly of the MS class, but rather that the average suitability of the different soil-climate units in the mapped land unit has an average class of MS.
The SI index reflects the suitability composition of a particular grid-cell of a soil mapping unit that has different shares of a number of soil types (more details in Section 3.2).
In this index, VS represents the portion of the grid-cell with attainable yields that are 80 percent or more of the maximum potential yield for the specified input scenario. Similarly, S, MS and mS represent portions
TABLE 4.1Agro-climatic, land suitability and suitability index classes
Code Suitability Class Percentage of potential constraint-free agronomically attainable yield
VS Very suitable 80 – 100
S Suitable 60 – 80
MS Moderately suitable 40 – 60
mS Marginally suitable 20 – 40
vmS Very marginally suitable > 0 – 20
NS Not suitable 0

34
NATURAL RESOURCE ASSESSMENT FOR CROP AND LAND SUITABILITY: AN APPLICATION FOR SELECTED BIOENERGY CROPS IN SOUTHERN AFRICA REGION
Integrated Crop Management
of the grid-cell with attainable yields 60–80 percent, 40–60 percent, and 20–40 percent of the maximum potential yield, respectively. SI is calculated using the following equation:
SI = VS*0.9 + S*0.7 + MS*0.5 + mS*0.3 + vmS*0.1where VS = very suitable, S = suitable, MS = moderately suitable, mS =
marginally suitable, and vmS = very marginally suitable.The methodology used is in its simplest form, in anticipation of the more
detailed work to be done at the country level in the follow-up phase during which detailed information on climate, soil and crops would be studied. For example, as explained in the previous chapter, the climatic resources inventory is based on long-term monthly average data, rather a statistical analysis of historical daily or decadal data. At country level, the inventories of climate and soil would be more detailed, which would allow for a more accurate matching of crop climatic and edaphic requirements to the prevailing climatic and edaphic conditions.
4.2 CROPS AND LAND UTILIZATION TYPESFive bioenergy crops were included in the assessment: cassava, sweet sorghum, sugarcane, sunflower and oil palm (Table 4.2).
A land utilization type (LUT) is defined as combinations of crop or crop types, production systems and input levels. An adequate description of any LUT information on the following items would ideally require:
Produce and production system;Market orientation, including whether towards subsistence or commercial production;Capital and labour intensity;Size and configuration of land holding, including whether consolidated or fragmented;Technology employed, technical knowledge and attitude of land users;Land tenure, the legal or customary manner in which rights to land are held, by individuals or groups.
Four categories of reference LUTs were identified; their characteristics are summarised in Table 4.3. These are based on two production systems, tillage-
TABLE 4.2Crops included in the assessmentCrop and crop type Scientific name Growth cycle (days)
Cassava Manihot esculenta 150 – 300
Sugar cane Saccharum officinarum 210 – 365
Sweet sorghum (lowland) Sorghum bicolor var. sweet 90 – 130
Sweet sorghum (highland) Sorghum bicolor var. Sweet 120 – 300
Oil palm (tall and compact) Elaeis guineensis 270 – 365
Sunflower Helianthus annuus 100 – 120

35
ASSESSING SUITABLE LAND: THE METHODOLOGICAL FRAMEWORK AND ITS IMPLEMENTATION
Vol. 14–2012
based and Conservation Agriculture, at both a low and a high level of inputs and proper management. A total of 28 LUTs were thus defined in this crop and land suitability assessment.
4.3 AGRO-CLIMATIC CROP SUITABILITYTo enable crops to be matched to climatic conditions, the climatic resources inventory of the study region was compiled to permit the interpretation of the climatic resources in terms of their suitability for production of crops (see Ch. 3). The appropriate climatic adaptability attributes of the crop
TABLE 4.3Attributes of Land Utilization Types
Tillage-based Agriculture Conservation Agriculture
Low
inp
ut
leve
l
Tillage-based system, low input (TA-L)
Subsistence-type production system with low capital input
Use of traditional or modern cultivars of crops
Tilling uses hand labour and traditional tools only
Tillage-based cultivation in rotation with bush, often referred to as ‘slash and burn’
Excludes the use of:
Synthetic mineral fertilizer or other agrochemicals
Large-scale conservation measures
Conservation Agriculture, low input (CA-L)
Subsistence-type production system with low capital input
Use of traditional or modern cultivars of crops
Hand labour only, traditional or improved tools for seeding or planting with minimum soil disturbance
Crops are planted in rotation with other crops (including legumes) to maintain pest control, soil fertility and productive capacity
Residues are retained as much as possible for “in situ” composting
Excludes the use of:
Synthetic mineral fertilizer or other agrochemicals
Large-scale conservation measures
Bush fallows in the rotations and ‘slash and burn’
Hig
h in
pu
t le
vel
Tillage-based system, high input (TA-H)
Capital-intensive management practices with high-level of input
Full use of the most productive and adapted modern cultivars of crops
Complete mechanization with plough-based intensive tillage
Application of high levels of agrochemicals
Full soil conservation measures
Excludes the use of:
Attention to protect or enhance ecosystem services such as increasing carbon sequestration and soil organic matter build-up, or improving water resource quantity and quality
Conservation Agriculture, high input (CA-H)
Capital-intensive management practices with high-level input
Full use of the most productive and adapted modern cultivars of crops
Complete mechanization with no tillage
Use of optimum levels of agro-chemicals
‘Permanent’ organic-matter soil cover from crop residues and cover crops
Cover crops with legumes in the rotations
Full attention to ecosystem services to keep production, environmental costs and product price competitively low and productivity and returns high.
Excludes the use of:
Tillage or mechanical soil disturbance

36
NATURAL RESOURCE ASSESSMENT FOR CROP AND LAND SUITABILITY: AN APPLICATION FOR SELECTED BIOENERGY CROPS IN SOUTHERN AFRICA REGION
Integrated Crop Management
determine which parameters must be taken into account in the compilation of the climatic inventory. The climatic adaptability attributes of crops form the basis of defining the crop climatic requirements, and are outlined in the following section. Collection of data on the climatic adaptability of crops was begun in 1977 for FAO agro-ecological zones project (Kassam et al., 1977; FAO, 1978-81). Since 1991, the data has been housed within the FAO ECOCROP database1.
4.3.1 Crop climatic adaptability and requirementsThe photosynthetic and phenological requirements of crops both affect yield. The rate of crop photosynthesis and growth are related to the assimilation pathway and its response to temperature and radiation. However, the phenological climatic requirements, which must be met, are not specific to a photosynthetic pathway.
As described in FAO agro-ecological zones methodology (Kassam et al., 1977; FAO, 1978-81), crops are classified into climatic adaptability groups according to their fairly distinct photosynthesis characteristics. Each group comprises crops of “similar ability” in relation to potential photosynthesis, and the differences between land within groups in the response of photosynthesis to temperature and radiation determine crop-specific biomass productivity when climatic phenological requirements are met.
Crop adaptability groups and their characteristic average photosynthesis response to temperature and radiation are presented in Table 4.4. Wheat, barley, oat, rapeseed and white potato have a C3 photosynthesis pathway, belong to group I and are adapted to grow under cool conditions (< 20 °C mean daily temperature). Sunflower, sweet potato, cassava, castor, jatropha, pongamia and oil palm have a C3 photosynthesis pathway, belong to group II and are adapted to grow under warm conditions (> 20 °C) with a potential rate of photosynthesis that is higher than in group I crops. Crops in group III (lowland sweet sorghum, lowland maize and sugarcane) have a C4 photosynthesis pathway and are adapted to grow under warm conditions (> 20 °C), but with a potential rate of photosynthesis that is higher than in group II crops. Crops in group IV (highland sweet sorghum and highland maize) have a C4 photosynthesis pathway and are adapted to grow under cool conditions (<20°C) with a potential rate of photosynthesis similar to that of group III crops.
1 ECOCROP contains information primarily about climate and soil requirements and uses of plant species, but it also provides a range of other information, such as brief description of the species, common names in different languages and possible yields. ECOCROP makes it possible to identify a suitable crop for a specified environment, identify a crop with a specific habit of growth or for a defined use, and look up the environmental requirements and uses of a given crop. Over 2100 species are now covered. ECOCROP is also a tool for recording, organising, comparing and using studies on crop response to environmental and management factors see http://ecocrop.fao.org/ecocrop/srv/en/home.

37
ASSESSING SUITABLE LAND: THE METHODOLOGICAL FRAMEWORK AND ITS IMPLEMENTATION
Vol. 14–2012
The time required to produce crop yield depends on the phenological constraints on the use of time available in the growing period, and the location of yield in the plant (e.g. seed, leaf, stem, and root) has an important influence. Temperature has a rate controlling/limiting effect on growth, and it may influence the growth of a specific plant part and accumulation of yield if located therein. For example, in wheat, barley and oat, cool night temperatures are required for tillering, but the optimal temperatures at the time of flowering and subsequent yield formation are higher. Similarly, optimal temperatures for growth in sugarcane are higher than 20 °C, but during the ripening period and because the yield is located in the stem, a lower temperature in the range 10-20 °C is required for concentration of the proper type of sugar within the cane. On the other hand, optimal temperatures for growth, development and yield formation in sunflower, sweet potato and cassava are higher than 20°C and most of the specific temperature requirements are also met when temperatures are optimal for photosynthesis and growth.
The attributes that are helpful in assessing the climatic adaptability of the selected crops in the matching exercise are given in Table 4.5. Similar information regarding the other crops has been made available by FAO (1978), Kassam (1980) and in the ECOCROP database.
TABLE 4.4Average photosynthesis response of individual leaves of four groups of possible bioenergy crops to radiation and temperatureCharacteristics Crop adaptability group
I II III IV
Photosynthesis pathway C3 C3 C4 C4
Rate of photosynthesis at light saturation at optimum temperature (mg CO2dm-2h-1)
20 – 30 40 – 50 > 70 > 70
Optimum temperature (°C) for maximum photosynthesis 15 – 20 25 – 30 30 – 35 20 – 30
Radiation intensity of maximum photosynthesis (cal cm-2min-1)
0.2 – 0.6 0.3 – 0.8 > 1.0 > 1.0
Main crops Wheat Barley Oat Rapeseed Sugar beet White potato
Sunflower Sweet potato Cassava Castor Jatropha Pongamia Oil palm
Lowland maize Lowland sweet sorghum Sugarcane
Highland maize Highland sweet sorghum

38
NATURAL RESOURCE ASSESSMENT FOR CROP AND LAND SUITABILITY: AN APPLICATION FOR SELECTED BIOENERGY CROPS IN SOUTHERN AFRICA REGION
Integrated Crop Management
To summarise from the table:Cassava (C3-species, group II) is an annual with botanically indeterminate
growth habits. The yield is located in the root, and the crop yield formation period is most or all of the growth cycle period. Climatic adaptability attributes qualify it to be considered for matching in tropical humid and seasonally arid lowland areas with altitudes under 1500m.
Sugarcane (C4-species, group III) is an annual/biennial with botanically determinate growth habits. The yield is located in the stem, and the crop yield formation period is most or all of the growth cycle period. Climatic
TABLE 4.5Climatic adaptability attributes of crops
Attributes Cassava SugarcaneSweet sorghum (High and lowland)
Oil palm (Tall and compact)
Sunflower
Species Manihot esculenta
Saccharum officinarum
Sorghum bicolor var. sweet
Elaeis guineensis
Helianthus annuus
Photosynthesis pathway
C3 C4 C4 C3 C3
Crop adaptability group
II III III II II
Days of maturity*
180 – 270 (EC)
270 – 365 (LC)
270 – 365 90 – 110 (EC)
120 – 130 (MEC)
140 – 240 (LC)
330 – 365 100 – 120 (UBC, EC)
130 – 160 (BRC, LC)
Harvested part Tuber Stem Seed Seed Seed
Main product Tuber, Starch Sugar Grain (Cereal) Oil, cake Oil
Growth habit Indeterminate Determinate Determinate Indeterminate Determinate
Life-span
Natural
Cultivated
Short-term perennial Annual
Perennial
Annual/Biennial
Annual
Annual
Perennial
Perennial
Annual
Annual
Yield
Location
Formation period
Root
Two thirds crop’s life
Stem
Two thirds crop’s life
Terminal inflorescence Last third period in crop’s life
Lateral inflorescence
Two thirds crop’s life
Terminal inflorescence
Last third period in crop’s life
Thermal zone Tropical lowland, humid and seasonally arid
Tropical lowland, humid;
Subtropical summer rainfall, T > 20°C
Tropical lowland, seasonally arid;
Subtropical summer rainfall, T > 20°C
Tropical lowland, humid
Tropical lowland, seasonally arid;
Subtropical summer rainfall, T > 20°C
* Days of maturity:
EC = Early cultivar MEC = Medium cultivar LC = Late cultivar
BRC = Branched cultivar UBC = Unbranched cultivar

39
ASSESSING SUITABLE LAND: THE METHODOLOGICAL FRAMEWORK AND ITS IMPLEMENTATION
Vol. 14–2012
adaptability attributes qualify it to be considered for matching in tropical humid lowland areas (with precipitation greater or equal to evapotranspiration for seven to twelve months) and subtropical areas with summer rainfall and warm growing period with mean temperature higher than 20°C.
Sweet sorghum (C4-species, group III), both highland and lowland species, is an annual with botanically determinate growth habits. The yield is located in terminal inflorescences, and the crop yield formation period is the last third of growth cycle. Climatic adaptability attributes qualify it to be considered for matching in tropical humid lowland areas (with precipitation greater or equal to evapotranspiration for 7–12 months) and subtropical areas with summer rainfall and warm growing period with mean temperature higher than 20 °C.
Oil palm (C3-species, group II), both tall and compact species, is a perennial with botanically indeterminate growth habits. The yield is located in lateral inflorescences, and the crop yield formation period covers two-thirds of the annual growth cycle. Climatic adaptability attributes qualify it to be considered for matching in tropical humid lowland areas with precipitation higher than or equal to evapotranspiration for 7–12 months.
Sunflower (C3-species, group II) is an annual with botanically determinate growth habits. The yield is located in terminal inflorescences, and the crop yield formation period is the last third of the growth cycle. Climatic adaptability attributes qualify it to be considered for matching in tropical lowland areas seasonally arid with precipitation higher than or equal to evapotranspiration for less than seven months.
4.3.2 Maximum agronomically attainable yieldThe maximum attainable (potential) yield of a specific crop (Ymp) is defined as the harvested yield of a high-producing variety which is well-adapted to the given growing environment, including the time available to reach maturity and under conditions where water, nutrients and pests and disease do not limit yield. Climatic factors which determine Ymp are temperature, solar radiation and the length of total growing season in addition to any specific temperature and day-length requirements for crop development. Temperature determines the rate of crop development and consequently affects the length of total growing period required for the crop to form yield. Crop growth and yield are affected by total radiation received during the growing period.
It is generally asserted that the maximum yield level of a crop is determined primarily by its genetic characteristics (G) combined with how well the crop is adapted to the prevailing environment (E). However, G and E factors and processes are numerous, and not only do they interact among and between themselves, but there are also other agro-ecosystem components including above- and below-ground agro-biodiversity, soil organic matter, organic mulch presence or absence, soil microorganisms and meso-fauna, soil biological processes, soil structure, porosity and aeration, etc. – all of

40
NATURAL RESOURCE ASSESSMENT FOR CROP AND LAND SUITABILITY: AN APPLICATION FOR SELECTED BIOENERGY CROPS IN SOUTHERN AFRICA REGION
Integrated Crop Management
which affect soil moisture, soil nutrients and pest dynamics. Thus, maximum “constraint-free” agronomically attainable yield level and the factor efficiencies with which it can be achieved (i.e. factor and total productivity) is the result of the production system paradigm (e.g. TA vs. CA approach) and the input and management level used to manipulate the various agronomic elements of the broader set of G x E interactions. So, while mineral fertiliser is an important input, its efficiency of utilization will also depend on soil health and biological parameters and how well they are managed in space and time under which type of production systems; the same holds for water input.
Thus, the maximum agronomically attainable yield under constraint-free conditions is different for crops produced under a TA “Green Revolution” system compared with same crops produced under a CA system, the latter being higher, depending on the yield level. For the purpose of this regional assessment, a CA approach at low-input level is assumed to provide extra potential yield advantages of 35, 30 and 25 percent in the semi-arid, sub-humid and humid zones respectively, and at high-input level of 25, 20 and 15 percent respectively.
Maximum attainable yields (and associated starch, sugar and oil content) considered for this analysis (subject to further refinement based on country-specific information) is shown in Table 4.6 for the five crops at the low- and high-input level under TA and CA-based systems. The low input level yields are assumed to be some 25 percent of the yield level at the respective high levels. The yield figures for crops produced under conventional systems were derived from the recent AEZ studies and yield databases. Those for CA were derived from empirical results, that are increasingly becoming available as a result of CA adoption in the region, and from expert knowledge.
4.3.3 Thermal zone crop suitabilityThermal zone suitability is determined according to the adequacy of prevailing temperatures during the growing period for crop growth, development and yield formation. Any eventual specific temperature requirement for crop development must also be taken into account. In the case of highland sweet sorghum, for example, the length of the crop growth cycle is longer at cooler temperatures, as described below.
The association between crop growth cycles and thermal zones in Southern Africa region for the selected crop types is presented in Table 4.7. In general, in the growth cycle length (number of days to maturity) for sorghum, there are generally about 20 more days required for maturation for each 100 m increase in altitude above 1500 m, or for each 0.5 °C decrease in mean temperature from 20 °C. The 20-day extension in maturity is composed of some 5–6 days delay in flowering (silking/anthesis) and some 14–15 days extension in the grain filling phase or time taken to reach black layer physiological maturity. For example, 110 and 130 days to maturity correspond respectively to 63 and 69 days to tasseling or heading, 73 and 79 days to silking or anthesis, and 110 and 130 days to physiological maturity.

41
ASSESSING SUITABLE LAND: THE METHODOLOGICAL FRAMEWORK AND ITS IMPLEMENTATION
Vol. 14–2012
For sorghum, mean temperatures below 15 °C were considered too low for normal production because of the very severe problems with seed set and maturation.
TABLE 4.7Crop growth cycle and thermal regime association
Crop and crop typeGrowth cycle Thermal regime
days range (°C)
Cassava 150 – 300 > 17.5
Sugar cane 210 – 365 > 17.5
Sweet sorghum (lowland) 90 – 130 > 20.0
Sweet sorghum (highland)120 – 200
200 – 300
17.5 – 20.0
15.0 – 17.5
Oil palm (tall) 270 – 365 > 22.5
Oil palm (compact) 270 – 365 > 20.0
Sunflower 100 – 120 > 20.0
TABLE 4.6Agronomically attainable reference potential yields, starch, sugar and oil content, comparison between Tillage-based Agriculture (TA) and Conservation Agriculture (CA) Production system
Crop
Tillage-based Agriculture
Low level of input
Tillage-based Agriculture
High level of input
Conservation Agriculture
Low level of input
Conservation Agriculture
High level of input
Cassava Ton/ha Ton/ha Ton/ha Ton/ha
Fresh root 12.5 50.0 15.6 57.5
Dry root 5.0 20.0 6.2 23.0
Starch 3.7 15.0 4.7 17.2
Sugar cane
Fresh cane 30.0 121.0 37.0 139.0
Sugar 3.0 12.1 3.7 13.9
Sweet sorghum (lowland)
Grain 1.5 6.0 2.0 7.5
Fresh cane 12.5 50.0 20.0 62.5
Juice 6.3 25.0 10.0 31.3
Sugar 0.9 3.8 1.5 4.7
Sweet sorghum (highland)
Grain 2.2 9.0 2.9 10.8
Fresh cane 20.0 80.0 26.0 100.0
Juice 10.0 40.0 13.0 50.0
Sugar 1.5 6.0 2.0 7.5
Oil palm (tall)
Fresh fruit 7.5 30.0 9.4 34.5
Oil 2.2 9.0 2.8 10.3
Oil palm (compact)
Fresh fruit 8.2 33.0 10.2 37.9
Oil 2.5 9.9 3.1 11.4
Sunflower
Seed 1.2 5.0 1.7 6.2
Oil 0.5 2.3 0.8 2.8

42
NATURAL RESOURCE ASSESSMENT FOR CROP AND LAND SUITABILITY: AN APPLICATION FOR SELECTED BIOENERGY CROPS IN SOUTHERN AFRICA REGION
Integrated Crop Management
The crop thermal zone suitability ratings for each crop type are presented in Table 4.8. Five thermal suitability classes are employed (i.e. SI, S2, S3, S4 and N), and the ratings apply to both production systems at two levels of inputs: where temperature requirements are fully met, the thermal zone is adjudged S1; where requirements are sub-optimal the zone is adjudged S2, S3 or S4; where requirements are not met, the zone is adjudged as N (not suitable).
A rating of S1 indicates that the temperature conditions for growth/yield physiology and phenological development are optimal and that it is possible to achieve the maximum attainable agronomic yield potential if there are no additional climatic and/or edaphic (including landform) limitations. Ratings of S2, S3 and S4 indicate that temperature conditions for growth and development are sub-optimal and that yield potentials will be lower than maximum, i.e. 75, 50 and 25 percent, respectively, for thermal zones with suitability rating class S2, S3 and S4. A rating class of N indicates that temperatures in the thermal zone are not considered suitable for production of the crop under consideration.
4.3.4 LGP zone crop suitabilityYield losses in a rainfed crop due to agro-climatic constraints can be considered to be governed mainly by the condition of how well the length of the normal growth cycle (from sowing to physiological maturity) of a specific crop fits into the available length of growing period. When the growing period is shorter than the growth cycle of the crop, there is a loss in yield. Yield losses can also occur when the length of growing period is much longer than the length of growth cycle. With some crops, using long-duration cultivars can reduce part of these losses.
The degree of water stress during the growing period can affect (a) crop growth or (b) yield formation and quality of produce. Effect b in some crops can be more severe than effect a, particularly in crops where the yield
TABLE 4.8Thermal zone suitability ratings
Thermal zones
CropsT1 T2 T3 T4 T5 T6 T7 T8-T11
>25.0 22.5-25.0 21.25-22.5 20.0-21.25 18.75-20.0 17.5-18.75 15.0-17.5 <15.0
Cassava S1 S1 S2 S3 S4 S4 N N
Sugarcane S1 S1 S2 S3 S4 S4 N N
Sweet sorghum (L) S1 S1 S1 S2 S3 N N N
Sweet sorghum (H) N N S2 S1 S1 S2 S4 N
Oil palm (T) S1 S2 S3 S4 N N N N
Oil palm (C) S1 S1 S2 S3 S4 N N N
Sunflower S1 S1 S1 S2 S3 S3 S4 N

43
ASSESSING SUITABLE LAND: THE METHODOLOGICAL FRAMEWORK AND ITS IMPLEMENTATION
Vol. 14–2012
is a reproductive part (e.g. in grain crops) and yield formation depends on the sensitivity of floral parts and fruit set to water stress (e.g. silk drying in maize).
The yield losses due to the length of growing period for the selected LUTs are expressed in percentage and reported in Table 4.9.
TABLE 4.9Percentage of maximum attainable yield by LGP classes*LGP
Crops 0-90
90-1
20
120-
150
150-
180
180-
210
210-
240
240-
270
270-
300
300-
330
330-
365
Cassava
TA 0% (NS)
5% (vmS)
11% (vmS)
26% (mS)
64% (S)
80% (S)
88% (VS)
92% (VS)
100% (VS)
54% (MS)
CA 0% (NS)
7% (vmS)
18% (vmS)
45% (MS)
72% (S)
84% (VS)
90% (VS)
100% (VS)
100% (VS)
54% (MS)
Sugarcane
TA 0% (NS)
0% (NS)
0% (NS)
0% (NS)
0% (NS)
38% (mS)
54% (MS)
70% (S)
85% (VS)
100% (VS)
CA 0% (NS)
0% (NS)
0% (NS)
0% (NS)
19% (vmS)
46% (MS)
77% (S)
85% (VS)
85% (VS)
100% (VS)
Sweet sorghum (lowland)
TA 0% (NS)
41% (MS)
75% (S)
100% (VS)
98% (VS)
53% (MS)
23% (mS)
18% (vmS)
12% (vmS)
12% (vmS)
CA 0% (NS)
58% (MS)
87% (VS)
100% (VS)
98% (S)
53% (MS)
23% (mS)
12% (vmS)
12% (vmS)
12% (vmS)
Sweet sorghum (highland)
TA 0% (NS)
2% (vmS)
7% (vmS)
33% (mS)
66% (S)
100% (VS)
75% (S)
38% (mS)
19% (vmS)
13% (vmS)
CA 0% (NS)
4% (vmS)
20% (vmS)
49% (MS)
83% (VS)
100% (VS)
75% (S)
38% (mS)
19% (vmS)
13% (vmS)
Oil palm (tall)
TA 0% (NS)
0% (NS)
0% (NS)
0% (NS)
0% NS)
6% (vmS)
18% (vmS)
44% (MS)
62% (S)
93% (VS)
CA 0% (NS)
0% (NS)
0% (NS)
0% (NS)
3% (vmS)
12% (vmS)
44% (MS)
62% (S)
62% (S)
93% (VS)
Oil palm (compact)
TA 0% (NS)
0% (NS)
0% (NS)
0% (NS)
0% (NS)
6% (vmS)
18% (vmS)
59% (MS)
82% (VS)
100% (VS)
CA 0% (NS)
0% (NS)
0% (NS)
0% (NS)
3% (vmS)
12% (vmS)
59% (MS)
82% (VS)
82% (VS)
100% (VS)
Sunflower
TA 0% (NS)
41% (MS)
75% (S)
100% (VS)
98% (VS)
53% (MS)
23% (mS)
18% (vmS)
12% (vmS)
12% (vmS)
CA 0% (NS)
75% (S)
87% (VS)
100% (VS)
98% (VS)
53% (MS)
23% (mS)
18% (vmS)
12% (vmS)
12% (vmS)
* See Chapter 4, Table 4.1 for full explanation of the agro-climatic, land suitability and suitability index classes.** VS = Very suitable; S = Suitable; MS = Moderately suitable; mS = Marginally suitable; vmS = Very
marginally suitable; NS = Not suitable

44
NATURAL RESOURCE ASSESSMENT FOR CROP AND LAND SUITABILITY: AN APPLICATION FOR SELECTED BIOENERGY CROPS IN SOUTHERN AFRICA REGION
Integrated Crop Management
The yield- and quality-reducing factors of pests, diseases and weeds comprise factors that operate indirectly through climatic conditions. To assess the agro-climatic constraints of the pest, disease and weed complex, it is convenient to separate the effects on yield that operate through loss in crop growth (e.g. pests and diseases affecting vegetative parts in grain crops) from the effects on yield that operate directly on yield formation and produce quality (e.g. grain mould in sorghum affecting both yield and grain quality).
Finally, the soil moisture can pose a further constraint to the farming operations that include land preparation, sowing cultivation and crop protection during crop growth and harvesting. These constraints are essentially workability constraints, e.g. operational problems of mechanical sowing and harvesting under wet conditions, problems of handling wet produce, problems of effectively applying biocides to crop under wet conditions. These constraints can cause direct losses of quality produce and/or reduce the suitability of a specific area for a given crop from the point of view of how effectively operations related to cultural practices and produce handling can be conducted at a given level of inputs.
The above-mentioned constraints are complex and dynamic and their interrelations make it extremely difficult to quantitatively assess their role and effect.
4.3.5 Crop LGP suitability adjustment due to LGP patternAs explained in Chapter 3, in the case of type (b) LGP pattern (see Figure 3.6 and Table 3.6), both growing periods are normal and greater than 75 days, and have crop growth potentials which should be taken into account in crop and land suitability assessments; Table 3.6 showed the lengths of the two LGPs in the bimodal zone with type (b) LGP.
Based on this information, yields were adjusted for crops which could take advantage of the second growing period; the adjusted yield potentials for cassava, sugarcane and oil palm as well as for the first and second LGPs for sweet sorghum and sunflower are presented in Table 4.10.

45
ASSESSING SUITABLE LAND: THE METHODOLOGICAL FRAMEWORK AND ITS IMPLEMENTATION
Vol. 14–2012
TABLE 4.10LGP pattern normal-normal with yields adjusted for second growing periodLGP
Crops
0-90
90-1
20
120-
150
150-
180
180-
210
> 2
10
Cassava
TA 0% (NS) 5% (vmS) 36% (mS) 45% (MS) 75% (S) 80% (S)
CA 0% (NS) 8% (vmS) 42% (MS) 72% (S) 75% (S) 80% (S)
Sugarcane
TA 0% (NS) 0% (NS) 8% (vmS) 31% (mS) 69% (S) 75% (S)
CA 0% (NS) 0% (NS) 30% (mS) 64% (S) 100% (VS) 100% (VS)
Sweet sorghum (lowland)
TA 0% (NS) 1 crop
41% (MS)
2 crops
1st (75%) (S)
2nd (41%) (MS)
2 crops
1st (100%) (S)
2nd (41%) (MS)
2 crops
1st (98%) (VS)
2nd (75%) (S)
2 crops
1st (53%) (MS)
2nd (75%) (S)
CA 0% (NS) 1 crop
73% (S)
2 crops
1st (80%) (S)
2nd (41%) (MS)
2 crops
1st (100%) (VS)
2nd (58%) (MS)
2 crops
1st (98%) (VS)
2nd (87%) (VS)
2 crops
1st (53%) (MS)
2nd (87%) (VS)
Sweet sorghum (highland)
TA 0% (NS) 1 crop
2% (vmS)
1 crop
7% (vmS)
2 crops
1st (33%) (mS)
2nd (2%) (vmS)
2 crops
1st (50%) (S)
2nd (7%) (vmS)
2 crops
1st (50%) (S)
2nd (7%) (vmS)
CA 0% (NS) 1 crop
4% (vmS)
2 crops
1st (20%) (vmS)
2nd (4%) (vmS)
2 crops
1st (49%) (MS)
2nd (12%) (vmS)
2 crops
1st (62%) (S)
2nd (20%) (vmS)
2 crops
1st (62%) (S)
2nd (20%) (vmS)
Oil palm (tall)
TA 0% (NS) 0% (NS) 0% (NS) 19% (vmS) 58% (MS) 70% (S)
CA 0% (NS) 0% (NS) 28% (MS) 62% (MS) 96% (VS) 100% (VS)
Oil palm (compact)
TA 0% (NS) 0% (NS) 0% (NS) 16% (vmS) 68% (S) 77% (S)
CA 0% (NS) 0% (NS) 35% (mS) 82% (VS) 100% (VS) 100% (VS)
Sunflower
TA 0% (NS) 41% (MS) 75% (S) 75% (S) 49% (MS) 27% (mS)
CA 0% (NS) 81% (VS) 2 crops
1st (87%) (VS)
2nd (41%) (MS)
2 crops
1st (100%) (VS)
2nd (75%) (S)
2 crops
1st (98%) (VS)
2nd (87%) (VS)
2 crops
1st (53%) (MS)
2nd (87%) (VS)*VS = Very suitable; S = Suitable; MS = Moderately suitable; mS = Marginally suitable; vmS = Very marginally suitable; NS = Not suitable
4.3.6 Crop LGP suitability adjustment in intermediate LGP zonesThe advantages of CA in terms of better moisture quantity for normal LGP were incorporated into the LGP rules for normal LGP zones as given in Table 4.9.
For intermediate LGP zones, an additional percentage reduction in the agronomic potential yields for the five crops under TA and CA systems with low and high inputs were made based on the following assumed rule:

46
NATURAL RESOURCE ASSESSMENT FOR CROP AND LAND SUITABILITY: AN APPLICATION FOR SELECTED BIOENERGY CROPS IN SOUTHERN AFRICA REGION
Integrated Crop Management
For TA, one-half (50 percent) of crop water requirement is assumed not to be met in intermediate LGP zones;For CA, one-third (33 percent) of crop water requirement is assumed not to be met in intermediate LGP zones.
The effect of the above short fall in water requirement was estimated in part using the yield response factor (ky) values from Doorenbos and Kassam (1979), and the percent reductions in yields shown in Table 4.11.
4.4 AGRO-EDAPHIC CROP SUITABILITYThe edaphic suitability assessment is input-specific and for this preliminary assessment was based on:
(i) matching the soil requirements of crop with the soil conditions of the soil units described in the soil inventory (soil unit evaluation; see Chapter 3); and
(ii) modification of the soil unit evaluation by limitation imposed by texture and slope.
As a medium in which roots grow and as a reservoir for water and nutrients on which plants continuously draw during their life cycle, the soil is a natural resource and a valuable economic asset requiring protection, conservation and improvement through good husbandry. The adequate agricultural exploitation of the climatic potential and sustained maintenance of productivity largely depends on soil fertility and management of soil on an ecologically sound basis. Soil fertility is the ability of the soil to supply nutrients and water to enable crops to maximize the climatic resources of a given location, and it is determined by the physical, chemical, hydrological and biological properties of a given soil, the understanding of which is essential to the effective utilization of climate and crop resources for optimal production.
In order to assess suitability of soils for crop production, soil requirements of crops must be known. Further, these requirements must be understood within the context of limitations imposed by landform and other features,
TABLE 4.11Yield reduction applied to intermediate LGP zones for tillage-based agriculture (TA) and conservation agriculture (CA)
Crop Seasonal kyTA-Low TA-High CA-Low CA-High
% % % %
Cassava 1.0* 50 50 34 34
Sugarcane 1.2 60 60 41 41
Sweet Sorghum 0.9 45 45 31 31
Oil palm 1.0* 50 50 34 34
Sunflower 0.95 48 48 32 32* Assumed ky (yield-response factor) values

47
ASSESSING SUITABLE LAND: THE METHODOLOGICAL FRAMEWORK AND ITS IMPLEMENTATION
Vol. 14–2012
which do not form a part of soil but may have a significant influence on the use that can be made of the soil. Crop requirements in relation to soil internal and external conditions have been explained by FAO (1978-81; 1991).
The crop production system employed (i.e. TA vs. CA) will significantly affect all soil properties and productive capacity. The effect of the production system on soil moisture or hydrological conditions was taken into account in the LGP suitability assessment (Table 4.9). The effect of production system on other aspects of soil, specifically soil health, and therefore its productive capacity, was taken into account by assuming that when the soil suitability class under TA production system was S2, under CA the suitability class was S1. Where soil suitability was rated as N under TA, it was also rated as N under CA. In reality, this may not hold everywhere, since soil quality parameters (e.g. soil structure and porosity, soil organic matter content, soil moisture content and moisture holding capacity, CEC and soil nutrient availability and nutrient holding capacity, drainage, soil infiltration, etc.), and therefore soil productive capacity and crop suitability, improve significantly under CA.
4.4.1 Soil unit evaluationThe soil unit evaluation is expressed in terms of suitability ratings based on how far the soil conditions of a soil unit meet the crop requirements under a specified level of inputs. The three basic suitability classes are: S1, very suitable or suitable; S2, moderately or marginally suitable; N, not suitable. A rating of S1 indicates that there are no or only minor limitations to production of the crop, provided climatic conditions are suitable. The rating of S2 indicates that soil limitations are such that they would markedly affect production of the crop, yet not to the extent of making the land completely unsuitable for that crop. The N rating means that the soil limitations appear to be so severe that crop production is not possible or is at best very limited. An example of soil unit ratings for sunflower for two production systems at two input levels each are presented in Annex 3.
4.4.2 Texture limitationsSoil unit ratings apply if there are no additional limitations imposed by texture. Modifications are required where limitations are imposed by texture.
Soil unit ratings remain unchanged for Arenosols (Q), Albic Arenosols (Qa), Cambic Arenosols (Qc), Ferralic Arenosols (Qf), Calcaro-cambic Arenosols (Qkc), Luvic Arenosols (Ql) and Vitric Andosols (Tv), since coarse texture limitations have been already applied in the soil unit ratings.
Soil unit ratings remain unchanged where textures are medium and fine: fine sandy loam (FSL), sandy loam (SL), loam (L), sandy clay loam (SCL), silt loam (SL), clay loam (CL), silty clay loam (SICL) and silt (SI); or fine: sandy clay (SC), silty clay (SIC), peaty clay (PC) and clay (C).

48
NATURAL RESOURCE ASSESSMENT FOR CROP AND LAND SUITABILITY: AN APPLICATION FOR SELECTED BIOENERGY CROPS IN SOUTHERN AFRICA REGION
Integrated Crop Management
In all other cases, i.e. soil units with coarse textures – i.e. sand (S), loamy coarse sand (LCS), fine sand (FS), loamy fine sand (LFS), and loamy sand (LS) – the soil unit rating is lower by 25 percent for all crops.
4.4.3 Slope limitationsSlope limitations for all crops are presented in Table 4.12. The production system is the main factor influencing landform suitability assessment. In fact it is possible to utilise land with steeper slopes under CA than under TA. The slope rating of S1 means that the soil unit ratings, described in Section 4.3.2, remain unchanged. All ratings of soils with S2 slope rating are decreased or downgraded by one class, i.e. S1 soil rating changes to S2 if the slope rating is S2; S2 soil rating changes to N if the slope rating is S2; and all soil ratings of soils with N slope rating are downgraded to N.
4.5 LAND SUITABILITY ASSESSMENTWhen the land suitability assessment (Part I) of the productivity model is applied to the land resources inventory, the assessment of potential crop performance and consequently crop options to be selected for further processing in Part II of the model (Figure 2.1), by agro-ecological cell, may be undertaken. Subsequently, land that is reserved for other uses, such as cash-crop zones, irrigation schemes, forest zones, or reservation and conservation areas, is taken into account as appropriate (Chapter 5).
All three assessments: climatic suitability, edaphic suitability and soil/slope erosion hazard, are required to determine the ecological land suitability for crop production of each climate-soil unit of the land resources inventory. In essence the land suitability assessment takes account of all the inventoried attributes of land and compares them with the requirements of the crops, so that a simple and understandable picture of the suitability of land for crop production emerges.
The results of the land suitability assessment are presented in terms of six basic suitability classes, each linked to attainable yields for the three levels of inputs considered. For each level of input, the land suitability classes are: very suitable (VS) – 80 percent or more of the maximum attainable yield; suitable (S) – 60 to less than 80 percent of the maximum attainable yield; moderately
TABLE 4.12Slope rating by production system
Percent slope
Production System 0
- 2
2 -
5
5 -
8
8 -
12
12 -
16
16 -
23
23 -
30
30 -
45
45 -
60
> 6
0
TA S1 S1 S2 S2 N N N N N N
CA S1 S1 S1 S1 S1 S2 S2 S2 S2 N

49
ASSESSING SUITABLE LAND: THE METHODOLOGICAL FRAMEWORK AND ITS IMPLEMENTATION
Vol. 14–2012
suitable (MS) – 40 to less than 60 percent of the maximum attainable yields; marginally suitable (mS) – 20 to less than 40 percent; very marginally suitable (vmS) – one to less than 20 percent and not suitable (NS) – 0 percent.
In the first step, the crop temperature requirements with regard to photosynthesis and phenology are compared with the prevailing temperature conditions of each thermal zone. If they do not match, all the growing period zones in that thermal zone are classified as not suitable. If the temperature conditions of a thermal zone partially or fully match the crop thermal requirements, all growing period zones in that thermal zone are considered for further suitability assessment according to the thermal zone rating. This further assessment comprises application of length of growing period suitability to the computed areas of the various growing period zones by LGP-Pattern zone. Thus if the thermal zone rating of a particular growing period zone is S1, then potential yield biomass value for the growing period zone is not modified. If the thermal zone rating of the growing period zone is S3, then the potential yield biomass value for the computed extents of the period zone is decreased by 50 percent. The thermal and moisture suitability assessments are described in Sections 4.3.3 and 4.3.4.
The length of growing period suitability is applied according to the LGP-Pattern make-up. All annual crops are matched to the individual component length of growing period, i.e. LGP1 and LGP2. The LGP-Pattern evaluation for each crop is achieved by taking into account the constituent component lengths of each LGP. Also where the LGP is intermediate, then an appropriate reduction is applied for TA and for CA.
The next step is an appraisal of the soil units present in each growing-period zone. The rating of soil units for the crops and level of inputs under consideration are applied to the computed area of the growing period zone occupied by each soil unit. The appraisal, undertaken on the basis of the soil ratings as described in Section 4.4.1, leads to appropriate modifications of the climatic suitability assessment and the attainable yield. Subsequently, the ratings for the different soil textures are applied.
Finally, limitations imposed by slope are taken into account to arrive at the final land suitability appraisal for the crops, for the level of inputs under consideration.
The six classes of land suitability are related to attainable yields as percentages of the maximum attainable under the optimal climatic, edaphic and landform conditions for each LUT or for each crop under TA and under CA. Consequently the results provide, for each land unit, an assessment of crop production potentials, which can be aggregated for any given area.
The crop and land suitability assessment was performed using the Land Suitability Assessment software developed mainly under the BEFS project for country-specific analysis. Subsequent software improvements were required in order to perform the analysis at regional level. Technical details on the software may be found in Annex 4.


51
CHAPTER 5
Crop and land suitability assessments within a socio-economic context
Vol. 14–2012
In this chapter socio-economic information is presented in the form of possible layers that might be superimposed over crop and land suitability assessments in order to better target the results in terms of specific policy issues.
In the context of bioenergy sector development, two main issues have frequently been raised worldwide over the past few years:
What is the potential trade-off that will occur in terms of land for food and energy crop production, with consequently potential negative impacts on food security?What are the opportunities and challenges that the bioenergy sector could generate in terms of employment, energy independence and rural development?
With these questions in mind, the assessment of land availability and the identification of areas where competition is very high were carried out. Furthermore, so as to link the analysis to real country situations, a set of socio-economic data were collected and geo-referenced.
5.1 ASSESSING THE AVAILABILITY OF LANDIn order to use the land assessment as the instrument to provide information for agricultural planning and development, an accurate evaluation of land use/cover environmental constraints and potential legal restrictions is necessary. The assessment in this report was carried out under rainfed conditions; information on areas equipped for irrigation should be taken into account as appropriate. This chapter presents the main information and the land available for the Southern Africa region.
5.1.1 Land coverFirst of all, information about the status quo of the land can help to identify areas where crops cannot be produced because of the existing environment (see Figure 5.1).
The European Space Agency (ESA) has created highly detailed portraits of the Earth’s land surface. They are the first ones to have been produced as part of the ESA-initiated GlobCover project, carried out under ESA’s Earth Observation Data User Element (DUE). An international network of partners is working with ESA on the

52
NATURAL RESOURCE ASSESSMENT FOR CROP AND LAND SUITABILITY: AN APPLICATION FOR SELECTED BIOENERGY CROPS IN SOUTHERN AFRICA REGION
Integrated Crop Management
project, including the United Nations Environment Programme (UNEP), FAO, the European Commission’s Joint Research Centre (JRC), the European Environmental Agency (EEA), the International Geosphere-Biosphere Programme (IGBP) and the Global Observations of Forest Cover and Global Observations of Land Dynamics (GOFC-GOLD) Implementation Team Project Office.
The products are based on Envisat’s Medium Resolution Imaging Spectrometer (MERIS) instrument working in full resolution mode to acquire images in polar orbit at an altitude of 800 km with a spatial resolution of 300 m. They refer to bimonthly global composites for May to June 2005 and March to April 2006.
The global land cover map was derived through an automatic and regionally adjusted classification of the MERIS global composites. The 22 land-cover classes
FIGURE 5.1Land cover

53
CONTEXTUALIZING THE CROP AND LAND SUITABILITY ASSESSMENT
Vol. 14–2012
are defined according to the UN Land Cover Classification System (LCCS), a comprehensive, standardized a priori classification system. The main objective of the initiative for definition of a reference classification was to respond to the need for standardization and to develop a common integrated approach to all aspects of land cover. This implies a methodology that is applicable at any scale, and which is comprehensive in the sense that any land cover identified anywhere in the world can be readily accommodated (FAO, 2000).
5.1.2 Protected areasThe World Database on Protected Areas (WDPA) was used to identify protected areas. A protected area is defined as a “clearly defined geographical space, recognised, dedicated and managed, through legal or other effective means, to achieve the long-term conservation of nature with associated ecosystem services and cultural values” (Dudley, 2008).
The International Union for Conservation of Nature (IUCN) has developed seven Protected Area Management Categories that define protected areas according to their management objectives and are internationally recognised by various national governments and the United Nations. The categories provide international standards for comparing the protected areas in different countries and encourage the planning of protected areas under management aims. The categories are: Ia, Strict Nature Reserve; Ib, Wilderness Area; II, National Park; III, Natural Monument of Feature; IV, Habitat/Species Management Area; V, Protected Landscape/Seascape and; VI, Protected area with sustainable use of natural resources. Figure 5.2 shows the geographic distribution of protected areas in the study region by management categories in the year 2005.
In Southern Africa region, protected areas represent almost 20 percent of the overall territory; they are fairly homogeneously distributed. Zambia, Botswana and Tanzania have the largest extent of protected areas, ranging from 30–36 percent, as shown in Table 5.1.
TABLE 5.1Extent of protected areas by country as percentage of total land area
CountryProtected areas Total Land
% ‘000 ha
Angola 12.1 124,945
Botswana 30.5 57,178
Lesotho 0.7 2,968
Malawi 16.0 9,483
Mozambique 16.1 77,636
Namibia 13.4 82,083
South Africa 6.9 120,067
Swaziland 2.8 1,637
Tanzania 28.5 88,107
Zambia 35.9 73,638
Zimbabwe 27.7 38,318
Total 19.0 676,060

54
NATURAL RESOURCE ASSESSMENT FOR CROP AND LAND SUITABILITY: AN APPLICATION FOR SELECTED BIOENERGY CROPS IN SOUTHERN AFRICA REGION
Integrated Crop Management
5.1.3 Irrigation areasFrom the previous chapters, it has been seen that the crop and land suitability assessment in this study was carried out assuming rainfed production. It should be kept in mind that areas under irrigation are not affected by limited
FIGURE 5.2Protected areas

55
CONTEXTUALIZING THE CROP AND LAND SUITABILITY ASSESSMENT
Vol. 14–2012
TABLE 5.2Extent of irrigation area by country as percentage of total land area
CountryIrrigation areas Total Land
% ‘000 ha
Angola 0.045 124,945
Botswana 0.002 57,178
Lesotho 0.056 2,968
Malawi 0.414 9,483
Mozambique 0.106 77,636
Namibia 0.007 82,083
South Africa 0.864 120,067
Swaziland 2.104 1,637
Tanzania 0.146 88,107
Zambia 0.147 73,638
Zimbabwe 0.315 38,318
Total 0.239 676,060
precipitation, and could thus produce higher crop yields than in rainfed areas as long as care is taken that water is always available in the most crucial phase of crop production. The information on irrigated areas was produced globally by FAO combining sub-national irrigation statistics from national census surveys and reports with geospatial information on the position and extent of irrigation schemes (Siebert et al., 2007). For most of the countries, these statistics refer to the area equipped for irrigation. For a variety of reasons, the area actually irrigated may be significantly lower than the area equipped for irrigation. However, some countries report only the area that is actually irrigated in the year of the census (cf. Australia and India).
In order to gather information on how irrigated area is distributed within the sub-national units, geospatial information on position and extent of irrigated areas was derived by digitising hundreds of irrigation maps available in reports from irrigation associations, national ministries of agriculture, FAO or the World Bank. Additionally, information from several atlases or inventories, based on remote sensing available in digital format, was utilised. For most of the countries, more than one data source was used.
Figure 5.3 shows the distribution of the amount of area equipped for irrigation in percentage of the total area of the pixel.
The extent of irrigation area by country is reported in Table 5.2. Swaziland and South Africa have the largest extent of irrigation infrastructure; in Malawi, even if irrigated area covers only 0.4 percent of the total land, it is widely distributed throughout the country. Overall, in Southern Africa region, irrigated areas represent only 0.2 percent of total land area.

56
NATURAL RESOURCE ASSESSMENT FOR CROP AND LAND SUITABILITY: AN APPLICATION FOR SELECTED BIOENERGY CROPS IN SOUTHERN AFRICA REGION
Integrated Crop Management
5.1.4 Land availability and conflicting usagesThe information presented above was selected as appropriate from global information in order to produce two new maps. First the exclusion areas were identified selecting the following items from the different databases:
GlobCover database;
FIGURE 5.3Irrigation areas
57
CONTEXTUALIZING THE CROP AND LAND SUITABILITY ASSESSMENT
Vol. 14–2012
FIGURE 5.4Excluded areas
Figure 5.4 shows the geographical location and extent of the excluded areas, the largest of which are protected areas. The yellow area is the land available for bioenergy crop production.
Closed forests and protected areas were excluded as potential areas for bioenergy crop production for their valuable interest in terms of environment and ecosystem.
Artificial areas were excluded for conflicting usage: in most cases the actual urbanized areas are very productive land where in the past farmers used to concentrate for the cultivation of cash crops to resell quickly in the market.

58
NATURAL RESOURCE ASSESSMENT FOR CROP AND LAND SUITABILITY: AN APPLICATION FOR SELECTED BIOENERGY CROPS IN SOUTHERN AFRICA REGION
Integrated Crop Management
In most recent period the agricultural markets stimulated the development of other sectors and the consequent urbanization of productive areas was the main result of the modern conversion.
Bare land, permanent snow and ice, even if very limited in the extent, were excluded for the constraints they represent for agricultural production.
Finally the irrigation areas were excluded only because the analysis is carried out under the assumption of rainfed agriculture.
Once the areas listed as “excluded” were subtracted from total land under consideration, then the rest of the land could be assessed for suitability for bioenergy crop. Different methods for attaining maximum yield might occur in areas where agriculture is already being practiced, or areas not designed for bioenergy crop production.
A further screening of these areas would be required, guided mainly by policy objectives set by each country. Some countries may be interested in maintaining areas already under cultivation for food in order to ensure food security. In this particular context policymakers might be interested to learn more about opportunities for agricultural expansion and reclassify currently utilised agricultural land as an area with conflicting usage. Bioenergy crop cultivation expansion could then move onto land classified as shrub or grassland. Countries with very limited available land might decide to develop the bioenergy sector through an intensification of the actual land dedicated to crop production.
Figure 5.5 depicts the areas for agricultural expansion and intensification regardless of the degree of suitability for a specific land utilization type (LUT). The information on total land and total available land for expansion or intensification is summarised in Table 5.3.
TABLE 5.3Total land and total available land by country
CountryTotal land Land excluding
conflicting usages
Land for agriculture expansion
Land for agriculture
intensification
‘000 ha ‘000 ha ‘000 ha ‘000 ha
Angola 124,945 88,407 79,333 9,074
Botswana 57,178 45,949 36,581 9,368
Lesotho 2,968 2,950 2,300 650
Malawi 9,483 7,359 5,217 2,142
Mozambique 77,636 50,223 37,814 12,409
Namibia 82,083 65,121 61,560 3,561
South Africa 120,067 105,405 83,549 21,856
Swaziland 1,637 1,250 939 311
Tanzania 88,107 56,876 38,264 18,612
Zambia 73,638 45,745 40,313 5,432
Zimbabwe 38,318 32,487 21,787 10,700
Total 676,060 501,773 407,657 94,116

59
CONTEXTUALIZING THE CROP AND LAND SUITABILITY ASSESSMENT
Vol. 14–2012
5.2 SOCIO-ECONOMIC CONTEXTData on infrastructure, population and malnutrition could help to design more solid policy recommendations on crop promotion and land use planning with an orientation towards rural development and poverty reduction.
5.2.1 InfrastructureLack of infrastructure is one of the main limiting factors for the expansion of industry. Most of agricultural areas in Africa continue to be hampered by lack of access to competitive markets as a result of high transport and transaction costs.
The source of the infrastructure database is Vector Map (VMap) Level 0. This is an updated and improved version of the National Imagery and Mapping
FIGURE 5.5Agricultural expansion and intensification areas

60
NATURAL RESOURCE ASSESSMENT FOR CROP AND LAND SUITABILITY: AN APPLICATION FOR SELECTED BIOENERGY CROPS IN SOUTHERN AFRICA REGION
Integrated Crop Management
Agency’s (NIMA) Digital Chart of the World (DCW). The VMap Level 0 database provides worldwide coverage of vector-based geospatial data that can be viewed at 1:1,000,000 scale.
Figure 5.6 shows differences in the infrastructure distribution amongst and within countries.
5.2.2 PopulationThe crop and land suitability assessment described in this report is a method for evaluating productivity potential of the land area for rainfed agriculture.
FIGURE 5.6Infrastructure
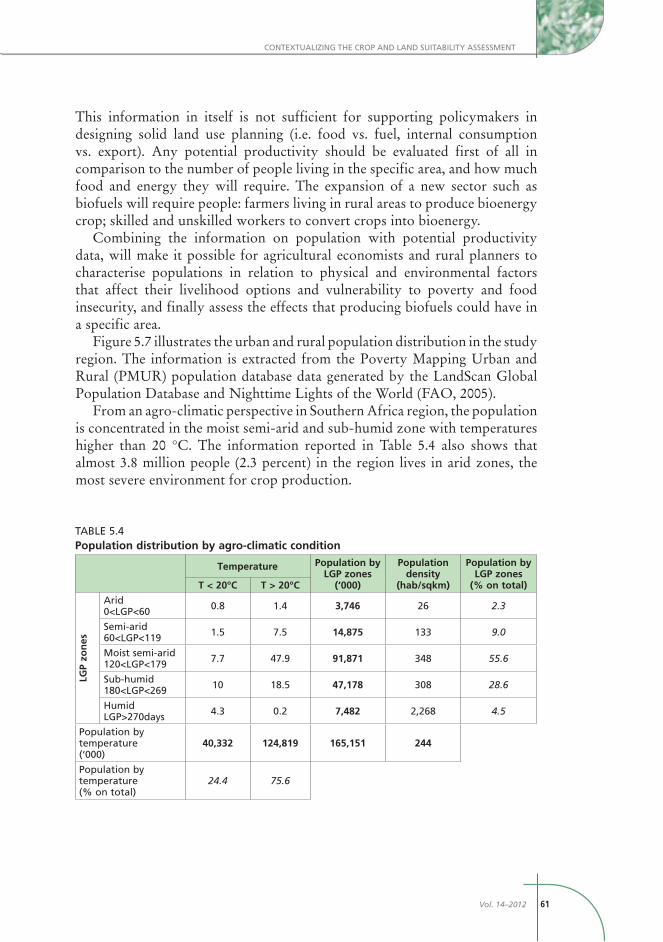
61
CONTEXTUALIZING THE CROP AND LAND SUITABILITY ASSESSMENT
Vol. 14–2012
This information in itself is not sufficient for supporting policymakers in designing solid land use planning (i.e. food vs. fuel, internal consumption vs. export). Any potential productivity should be evaluated first of all in comparison to the number of people living in the specific area, and how much food and energy they will require. The expansion of a new sector such as biofuels will require people: farmers living in rural areas to produce bioenergy crop; skilled and unskilled workers to convert crops into bioenergy.
Combining the information on population with potential productivity data, will make it possible for agricultural economists and rural planners to characterise populations in relation to physical and environmental factors that affect their livelihood options and vulnerability to poverty and food insecurity, and finally assess the effects that producing biofuels could have in a specific area.
Figure 5.7 illustrates the urban and rural population distribution in the study region. The information is extracted from the Poverty Mapping Urban and Rural (PMUR) population database data generated by the LandScan Global Population Database and Nighttime Lights of the World (FAO, 2005).
From an agro-climatic perspective in Southern Africa region, the population is concentrated in the moist semi-arid and sub-humid zone with temperatures higher than 20 °C. The information reported in Table 5.4 also shows that almost 3.8 million people (2.3 percent) in the region lives in arid zones, the most severe environment for crop production.
TABLE 5.4Population distribution by agro-climatic condition
Temperature Population by LGP zones
(‘000)
Population density
(hab/sqkm)
Population by LGP zones
(% on total)T < 20°C T > 20°C
LGP
zon
es
Arid 0<LGP<60 0.8 1.4 3,746 26 2.3
Semi-arid 60<LGP<119 1.5 7.5 14,875 133 9.0
Moist semi-arid 120<LGP<179 7.7 47.9 91,871 348 55.6
Sub-humid 180<LGP<269 10 18.5 47,178 308 28.6
Humid LGP>270days 4.3 0.2 7,482 2,268 4.5
Population by temperature (‘000)
40,332 124,819 165,151 244
Population by temperature (% on total)
24.4 75.6

62
NATURAL RESOURCE ASSESSMENT FOR CROP AND LAND SUITABILITY: AN APPLICATION FOR SELECTED BIOENERGY CROPS IN SOUTHERN AFRICA REGION
Integrated Crop Management
5.2.3 Poverty and malnutritionStunting is reduced growth rate in human development, usually as a result of malnutrition in early childhood. The resulting diminutive stature (up to 20 cm shorter than expected in moderate stunting of a five-year old child) results in diminished cognition, disease resistance and labour capacity for the individual. This in turn has a significant effect on household and community productivity, which will further exacerbate regional food security problems in the future. A stunting indicator thus reflects long-term cumulative effects of inadequate food intake and poor health conditions as a result of lack of hygiene and
FIGURE 5.7Urban and rural population density

63
CONTEXTUALIZING THE CROP AND LAND SUITABILITY ASSESSMENT
Vol. 14–2012
FIGURE 5.8Chronic undernutrition among children
recurrent illness in poor and unhealthy environments. The prevalence of chronic undernutrition is a relevant and valid measure of endemic poverty, and is a better indicator than estimates of per capita income.
The main sources of nutritional information are: Demographic and Health Surveys (under the project MEASURE DHS), UNICEF (through the international household survey initiative called the Multiple Indicator Cluster Surveys) and World Health Organization (Global Database on Child Growth and Malnutrition). The surveys in the countries were carried out in the decade 2000–2010.
As shown in Figurer 5.8, the major food insecurity “hotspot” areas are to be found in the southern parts of Tanzania and Angola and the eastern part of Zambia.

65Vol. 14–2012
CHAPTER 6
Application: Land available for bioenergy crops
The results of the crop and land suitability assessment are presented in this chapter. The results are divided by crop with results presented in map and table format with a discussion for each crop and type. It should be noted that crops for ethanol (cassava, sugarcane and sweet sorghum) were grouped together and examined before the crops used for biodiesel production (oil palm and sunflower). The following points are covered in the discussion for each crop:
Crop agro-climatic suitability, presented in map format for each Land Utilization Type (LUT) and in tabular format showing agro-climatic suitable area data as the percentage of total land by country and LUT;Land suitability in tabular format, presented as the percentage of suitable area on total land area by country and LUT;Suitability index in map format;Available suitable land in map format showing the geographic location of potential land for the expansion of crop production by suitability classes, and in tabular format presenting the percentage of suitable land and potential production in the suitable area in case of crop intensification and expansion.
All maps and tables are presented so that the reader can easily perceive (a) the differences between production systems and input levels; (b) the geographical distribution of crop and land suitability; and (c) the suitability index and available suitable land area for expansion and intensification.
In the context of this study, suitable land area is the area classified as moderately suitable, suitable and very suitable. This corresponds to the area where more than 40 percent of the maximum agronomically attainable yield can be achieved.
The tables show data for the eleven countries in Southern Africa region, namely Angola, Botswana, Lesotho, Malawi, Mozambique, Namibia, South Africa, Swaziland, the United Republic of Tanzania, Zambia and Zimbabwe.
The land area is considered as potentially available for crop production once all the land areas with environmental purposes and other usages are subtracted from the evaluation due to non-availability as described in detail in Section 5.1.4.

66
NATURAL RESOURCE ASSESSMENT FOR CROP AND LAND SUITABILITY: AN APPLICATION FOR SELECTED BIOENERGY CROPS IN SOUTHERN AFRICA REGION
Integrated Crop Management
Furthermore, particular attention was given to land area already under agricultural use. As described in Section 5.1.4, agricultural land area is treated in two ways. In the first instance, it is foreseen as an area to be reserved for maintaining food production and future expansion of agricultural land is considered. This could be a decision made in large-sized countries with food insecurity issues that must be resolved, or which have high-technology potential accompanied by a large demand for alternative energy. In the second instance production intensification on current agricultural land could be the only solution for the development of the biofuel sector. It is the case of small-size countries with relatively low crop yields and food insecurity concerns. If managed sustainably and properly, such development could generate opportunities for the improvement of the agricultural sector and consequently help to alleviate food insecurity concerns. The CD enclosed contains the full results of the assessment. A description of the CD is in Annex 5.
6.1 CROPS FOR ETHANOL PRODUCTIONThe first three crops presented here can be considered for ethanol production, namely cassava, sugarcane and sweet sorghum (lowland and highland). In this report the feasibility of bioenergy crops has been studied only in terms of the biophysical or the agro-ecological potential production of the crop. In order to provide support and information for policy-making decisions, further analysis is required in order to assess the feasibility and the competitiveness of the transformation of feedstocks into biofuel, based on the technical capacities of each of the specific country.
6.1.1 CassavaThe geographical distribution of the agro-climatic suitability of cassava at low- and high-input level is shown for tillage-based agriculture (TA) in Figure 6.1, and for Conservation Agriculture (CA) in Figure 6.2. Under TA, 11.13 percent of the total regional land area (676 million ha) is agro-climatically suitable for cassava production, whereas under CA, 24.26 percent of the total regional land area is suitable (Table 6.1). Four countries, Mozambique, Tanzania, Malawi, and Angola, account for the bulk of the agro-climatically suitable land area in the region for cassava.
When soil and terrain (slope) constraints are applied to the agro-climatic suitability assessment, regional land suitability for cassava drops to 4.38 percent under low inputs and 5.37 percent under high inputs for TA (Table 6.2). For CA, regional land suitability drops to 10.87 percent under low inputs and to 11.64 percent under high inputs. Thus over 50 percent of the agro-climatic potential is downgraded due to soil and terrain constraints. However, there is more than double the amount of suitable land area under CA compared with what is available under TA.

67
APPLICATION: LAND AVAILABLE FOR BIOFUEL FEEDSTOCKS
Vol. 14–2012
FIG
UR
E 6.
1A
gro
-clim
atic
su
itab
ility
fo
r ca
ssav
a u
nd
er t
illag
e-b
ased
p
rod
uct
ion
at
hig
h a
nd
low
leve
l of
inp
uts
FIG
UR
E 6.
2A
gro
-clim
atic
su
itab
ility
fo
r ca
ssav
a u
nd
er C
on
serv
atio
n
Ag
ricu
ltu
re a
t h
igh
an
d lo
w le
vel o
f in
pu
ts

68
NATURAL RESOURCE ASSESSMENT FOR CROP AND LAND SUITABILITY: AN APPLICATION FOR SELECTED BIOENERGY CROPS IN SOUTHERN AFRICA REGION
Integrated Crop Management
TABLE 6.1Percentage of agro-climatic suitable1 land for cassava
Country
Tillage-based production
Conservation Agriculture
Total Land Area
With low and high input
With low and high input ‘000 ha
Angola 34.66 44.40 124,945
Botswana - - 57,178
Lesotho - - 2,968
Malawi 21.41 55.20 9,483
Mozambique 17.42 64.97 77,636
Namibia - - 82,083
South Africa 0.53 1.05 120,067
Swaziland 9.26 19.32 1,637
Tanzania 22.59 54.00 88,107
Zambia 2.99 5.05 73,638
Zimbabwe 0.01 0.03 38,318
Total 11.13 24.26 676,0601 includes moderately to very suitable land
TABLE 6.2Percentage of suitable1 land for cassava
Country
Tillage-based production
Conservation Agriculture
Tillage-based production
Conservation Agriculture
Total Land Area
With low input With high input ‘000 ha
Angola 9.69 24.95 13.07 24.99 124,945
Botswana - - - - 57,178
Lesotho - - - - 2,968
Malawi 20.03 51.71 20.06 51.77 9,483
Mozambique 8.34 23.86 8.83 25.15 77,636
Namibia - - - - 82,083
South Africa 0.29 0.50 0.37 0.52 120,067
Swaziland 1.00 9.23 2.83 9.26 1,637
Tanzania 7.90 16.70 10.10 21.40 88,107
Zambia 2.51 4.66 2.51 4.66 73,638
Zimbabwe - - - - 38,318
Total 4.38 10.87 5.37 11.64 676,0601 includes moderately to very suitable land

69
APPLICATION: LAND AVAILABLE FOR BIOFUEL FEEDSTOCKS
Vol. 14–2012
Regional distribution of the Land Suitability Index for cassava at low-input levels is shown in Figures 6.3 and 6.4 for TA and CA, respectively, and at high-input levels in Figures 6.5 and 6.6. These thematic maps show, within the zones of agro-climatic suitability, the location of the suitable land for cassava within each country of the region.
Estimates of suitable land available for cassava expansion and its potential production are presented in Tables 6.3 and 6.5 and for cassava intensification in Tables 6.4 and 6.6. Figures 6.7 and 6.8 show the distribution of potentially suitable land area for expansion with high-input levels under TA and CA, respectively. At low-input levels, there are almost 100,000 ha of suitable land for expansion under TA (corresponding to 29.6 million tonnes fresh weight) and around 315,000 ha under CA (corresponding to 81.2 million tonnes). Suitable land for expansion at high-input levels increases to 500 202 ha (more than five-fold difference) under TA (corresponding to 140 million tonnes) and around 1.2 million ha under CA (some four-fold difference) (corresponding to 337.6 million tonnes). Given the possibility of greater potential land availability and yield for cassava under CA, area expansion of cassava to meet biofuel demand would have a relatively lower effect on cassava-based food security component than under TA.
Given the information on cassava adaptability to climate and soil, the procedure for estimating land suitability for expansion and intensification, it becomes possible to consider and decide where and with what production system a certain development target for biofuel could be met sustainably and with minimum negative impact on food security. This forms a basis for scenario-type estimates that can be generated through the methodology laid out in this report. While constructing the scenario, the possibility of alternative bioenergy crops, along with possible effects on the component (commodity-specific) and overall food security of any planning decision to expand and intensify production of a particular bioenergy crop or a set of bioenergy crops can consequently be taken into account.

70
NATURAL RESOURCE ASSESSMENT FOR CROP AND LAND SUITABILITY: AN APPLICATION FOR SELECTED BIOENERGY CROPS IN SOUTHERN AFRICA REGION
Integrated Crop Management
FIG
UR
E 6.
3 L
and
su
itab
ility
ind
ex f
or
cass
ava
un
der
till
age-
bas
ed
pro
du
ctio
n a
t lo
w le
vel o
f in
pu
ts
FIG
UR
E 6.
4La
nd
su
itab
ility
ind
ex f
or
cass
ava
un
der
Co
nse
rvat
ion
A
gri
cult
ure
at
low
leve
l of
inp
uts

71
APPLICATION: LAND AVAILABLE FOR BIOFUEL FEEDSTOCKS
Vol. 14–2012
FIG
UR
E 6.
5La
nd
su
itab
ility
ind
ex f
or
cass
ava
un
der
till
age-
bas
ed
pro
du
ctio
n a
t h
igh
leve
l of
inp
uts
FIG
UR
E 6.
6La
nd
su
itab
ility
ind
ex f
or
cass
ava
un
der
Co
nse
rvat
ion
A
gri
cult
ure
at
hig
h le
vel o
f in
pu
ts

72
NATURAL RESOURCE ASSESSMENT FOR CROP AND LAND SUITABILITY: AN APPLICATION FOR SELECTED BIOENERGY CROPS IN SOUTHERN AFRICA REGION
Integrated Crop Management
TABLE 6.4Percentage of suitable1 land for cassava intensification
Country
Tillage-based production
Conservation Agriculture
Tillage-based production
Conservation Agriculture
Total Land Area
With low input With high input ‘000 ha
Angola 9.24 19.75 11.52 19.86 9,074
Botswana - - - - 9,368
Lesotho - - - - 650
Malawi 22.45 50.62 22.47 50.66 2,142
Mozambique 13.03 26.87 13.58 28.93 12,409
Namibia - - - - 3,561
South Africa 0.45 0.67 0.53 0.69 21,856
Swaziland 1.70 16.64 6.24 16.68 311
Tanzania 5.25 12.82 7.21 17.83 18,612
Zambia 2.26 6.63 2.26 6.63 5,432
Zimbabwe - - - - 10,700
Total 4.40 9.73 5.11 11.01 94,1161 includes moderately to very suitable land
TABLE 6.3Percentage of suitable1 land for cassava expansion
Country
Tillage-based production
Conservation Agriculture
Tillage-based production
Conservation Agriculture
Total Land Area
With low input With high input ‘000 ha
Angola 9.70 24.80 13.00 24.82 79,333
Botswana - - - - 36,581
Lesotho - - - - 2,300
Malawi 16.63 49.28 16.67 49.35 5,217
Mozambique 6.05 19.92 6.53 20.99 37,814
Namibia - - - - 61,560
South Africa 0.19 0.32 0.24 0.32 83,549
Swaziland 0.71 7.51 1.93 7.56 939
Tanzania 5.87 13.24 8.12 18.07 38,264
Zambia 2.01 3.98 2.01 3.98 40,313
Zimbabwe - - - - 21,787
Total 3.45 9.02 4.36 9.58 407,6571 includes moderately to very suitable land

73
APPLICATION: LAND AVAILABLE FOR BIOFUEL FEEDSTOCKS
Vol. 14–2012
TABLE 6.5Cassava production (‘000 tons) in suitable1 land available for expansion
Country
Tillage-based production
Conservation Agriculture
Tillage-based production
Conservation Agriculture
With low input With high input
Angola 53,145 172,037 287,083 634,910
Botswana - - - -
Lesotho - - - -
Malawi 6,774 21,805 27,164 80,520
Mozambique 17,193 62,055 75,557 241,938
Namibia - - - -
South Africa 1,086 2,190 5,252 8,224
Swaziland 37 513 401 1,903
Tanzania 15,087 44,185 84,573 220,504
Zambia 5,042 12,745 20,171 46,996
Zimbabwe - 2 2 6
Total 98,365 315,533 500,202 1,235,0011 includes moderately to very suitable land
TABLE 6.6Cassava production (‘000 tons) in suitable1 land available for intensification
Country
Tillage-based production
Conservation Agriculture
Tillage-based production
Conservation Agriculture
With low input With high input
Angola 6,093 16,371 30,151 60,658
Botswana - - - -
Lesotho - - - -
Malawi 3,648 9,542 14,599 35,199
Mozambique 11,367 29,729 48,801 117,492
Namibia - - - -
South Africa 640 1,220 3,045 4,654
Swaziland 30 383 440 1,418
Tanzania 7,100 21,168 39,958 107,960
Zambia 757 2,761 3,028 10,179
Zimbabwe - 1 1 4
Total 29,635 81,175 140,023 337,5641 includes moderately to very suitable land

74
NATURAL RESOURCE ASSESSMENT FOR CROP AND LAND SUITABILITY: AN APPLICATION FOR SELECTED BIOENERGY CROPS IN SOUTHERN AFRICA REGION
Integrated Crop Management
FIG
UR
E 6.
7Po
ten
tial
lan
d f
or
cass
ava
exp
ansi
on
un
der
till
age-
bas
ed
pro
du
ctio
n a
t h
igh
leve
l of
inp
uts
by
suit
abili
ty in
dex
FIG
UR
E 6.
8Po
ten
tial
lan
d f
or
cass
ava
exp
ansi
on
un
der
Co
nse
rvat
ion
A
gri
cult
ure
at
hig
h le
vel o
f in
pu
ts b
y su
itab
ility
ind
ex

75
APPLICATION: LAND AVAILABLE FOR BIOFUEL FEEDSTOCKS
Vol. 14–2012
6.1.2 SugarcaneIn the case of sugarcane, the geographical distribution of the agro-climatic suitability at low- and high-input level is shown for TA in Figure 6.9, and for CA in Figure 6.10. Under TA, 2.06 percent of the total regional land area (676 million ha) is agro-climatically suitable for sugarcane production, whereas under CA, 4.31 percent of the total regional land area is suitable (Table 6.7). Angola, Mozambique, Tanzania and – mainly under CA – Malawi account for the bulk of the agro-climatically suitable land area in the region for sugarcane.
Regional land suitability for sugarcane drops to the range 0.38–0.54 percent, respectively, under low and high inputs for TA (Table 6.8). For CA, regional land suitability drops to 1.53 percent under low inputs and to 1.66 percent under high inputs.
Thus over 60 percent of the agro-climatic potential must be downgraded because of soil and terrain constraints. However, the amount of suitable land area under CA is five times larger than that under TA.
Geographical distribution of the Land Suitability Index for sugarcane at low-input level is shown in Figures 6.11 and 6.12 for TA and CA, respectively, and at high-input level in Figures 6.13 and 6.14. The suitable area is concentrated mainly in northern Angola, the north coast of Tanzania and in the Zambezi River basin in Mozambique.
Estimates of suitable land available for sugarcane expansion and its potential production are presented in Tables 6.9 and 6.11 and for sugarcane intensification in Tables 6.10 and 6.12. Figures 6.15 and 6.16 show the distribution of potentially suitable land area for expansion with high-input levels under TA and CA, respectively. At low-input levels, there are slightly more than 1 million ha of suitable land under TA (corresponding to 6.5 million tonnes of sugar) and around 4.6 million ha under CA (corresponding to almost 33 million tonnes of sugar). Suitable land for expansion at high-input levels increases to 1.6 million ha under TA (corresponding to 9.5 million tonnes) and 4.7 million ha under CA (corresponding to 34 million tonnes of sugar).
The potential area for intensification is very limited in both agricultural production systems.
It is very important to remember that this analysis was carried out under rainfed condition. More suitable land is feasible under irrigation, as moisture is the major limiting factor with respect to this crop. An appropriate analysis of water availability for sugarcane production must be carried out beforehand in order to identify the locations where there is no evidence of competition for scarce water resources.

76
NATURAL RESOURCE ASSESSMENT FOR CROP AND LAND SUITABILITY: AN APPLICATION FOR SELECTED BIOENERGY CROPS IN SOUTHERN AFRICA REGION
Integrated Crop Management
FIG
UR
E 6.
9A
gro
-clim
atic
su
itab
ility
fo
r su
gar
can
e u
nd
er t
illag
e-b
ased
p
rod
uct
ion
at
hig
h a
nd
low
leve
l of
inp
uts
FIG
UR
E 6.
10A
gro
-clim
atic
su
itab
ility
fo
r su
gar
can
e u
nd
er
Co
nse
rvat
ion
A
gri
cult
ure
at
hig
h a
nd
low
leve
l of
inp
uts

77
APPLICATION: LAND AVAILABLE FOR BIOFUEL FEEDSTOCKS
Vol. 14–2012
TABLE 6.7Percentage of agro-climatic suitable1 land for sugarcane
Country
Tillage-based production
Conservation Agriculture
Total Land Area
With low and high input
With low and high input ‘000 ha
Angola 8.20 13.11 124,945
Botswana - - 57,178
Lesotho - - 2,968
Malawi 0.58 3.54 9,483
Mozambique 2.05 8.63 77,636
Namibia - - 82,083
South Africa 0.23 0.30 120,067
Swaziland - - 1,637
Tanzania 1.97 6.10 88,107
Zambia - - 73,638
Zimbabwe - - 38,318
Total 2.06 4.31 676,0601 includes moderately to very suitable land
TABLE 6.8Percentage of suitable1 land for sugarcane
Country
Tillage-based production
Conservation Agriculture
Tillage-based production
Conservation Agriculture
Total Land Area
With low input With high input ‘000 ha
Angola 0.75 4.25 1.36 4.40 124,945
Botswana - - - - 57,178
Lesotho - - - - 2,968
Malawi 0.41 2.97 0.41 2.97 9,483
Mozambique 0.93 2.27 0.99 2.27 77,636
Namibia - - - - 82,083
South Africa 0.06 0.13 0.07 0.13 120,067
Swaziland - - - - 1,637
Tanzania 0.88 3.22 1.19 3.97 88,107
Zambia - - - - 73,638
Zimbabwe - - - - 38,318
Total 0.38 1.53 0.54 1.66 676,0601 includes moderately to very suitable land

78
NATURAL RESOURCE ASSESSMENT FOR CROP AND LAND SUITABILITY: AN APPLICATION FOR SELECTED BIOENERGY CROPS IN SOUTHERN AFRICA REGION
Integrated Crop Management
FIG
UR
E 6.
11La
nd
su
itab
ility
ind
ex f
or
sug
arca
ne
un
der
till
age-
bas
ed
pro
du
ctio
n a
t lo
w le
vel o
f in
pu
ts
FIG
UR
E 6.
12La
nd
su
itab
ility
ind
ex f
or
sug
arca
ne
un
der
Co
nse
rvat
ion
A
gri
cult
ure
at
low
leve
l of
inp
uts
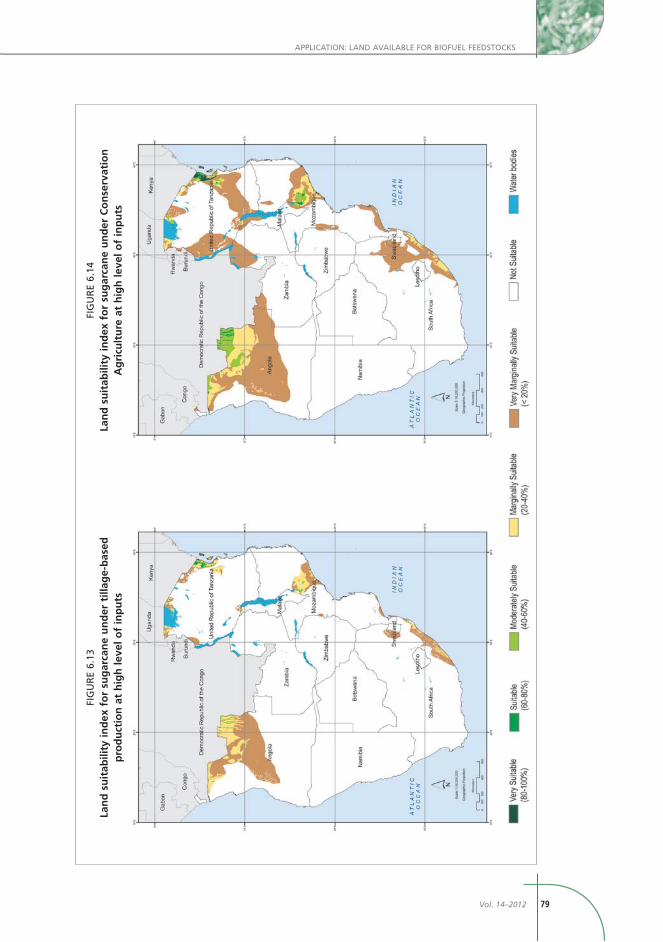
79
APPLICATION: LAND AVAILABLE FOR BIOFUEL FEEDSTOCKS
Vol. 14–2012
FIG
UR
E 6.
13La
nd
su
itab
ility
ind
ex f
or
sug
arca
ne
un
der
till
age-
bas
ed
pro
du
ctio
n a
t h
igh
leve
l of
inp
uts
FIG
UR
E 6.
14La
nd
su
itab
ility
ind
ex f
or
sug
arca
ne
un
der
Co
nse
rvat
ion
A
gri
cult
ure
at
hig
h le
vel o
f in
pu
ts

80
NATURAL RESOURCE ASSESSMENT FOR CROP AND LAND SUITABILITY: AN APPLICATION FOR SELECTED BIOENERGY CROPS IN SOUTHERN AFRICA REGION
Integrated Crop Management
TABLE 6.9Percentage of suitable1 land for sugarcane expansion
Country
Tillage-based production
Conservation Agriculture
Tillage-based production
Conservation Agriculture
Total Land Area
With low input With high input ‘000 ha
Angola 0.80 3.96 1.35 4.07 79,333
Botswana - - - - 36,581
Lesotho - - - - 2,300
Malawi 0.26 3.40 0.26 3.4 5,217
Mozambique 0.92 2.03 0.97 2.03 37,814
Namibia - - - - 61,560
South Africa 0.03 0.06 0.04 0.06 83,549
Swaziland - - - - 939
Tanzania 0.32 1.18 0.33 1.42 38,264
Zambia - - - - 40,313
Zimbabwe - - - - 21,787
Total 0.28 1.13 0.40 1.17 407,6571 includes moderately to very suitable land
TABLE 6.10Percentage of suitable1 land for sugarcane intensification
Country
Tillage-based production
Conservation Agriculture
Tillage-based production
Conservation Agriculture
Total Land Area
With low input With high input ‘000 ha
Angola 0.18 2.54 0.13 3.21 9,074
Botswana - - - - 9,368
Lesotho - - - - 650
Malawi 0.69 3.30 0.69 3.3 2,142
Mozambique 0.64 1.84 0.59 1.84 12,409
Namibia - - - - 3,561
South Africa 0.18 0.33 0.13 0.33 21,856
Swaziland - - - - 311
Tanzania 2.1 6.82 2.74 8.25 18,612
Zambia - - - - 5,432
Zimbabwe - - - - 10,700
Total 0.58 1.99 0.68 2.34 94,1161 includes moderately to very suitable land

81
APPLICATION: LAND AVAILABLE FOR BIOFUEL FEEDSTOCKS
Vol. 14–2012
TABLE 6.11Sugarcane production (‘000 tons) in suitable1 land available for expansion
Country
Tillage-based production
Conservation Agriculture
Tillage-based production
Conservation Agriculture
With low input With high input
Angola 3,406 22,409 6,227 22,944
Botswana - - - -
Lesotho - - - -
Malawi 90 1,083 90 1,083
Mozambique 1,981 5,586 2,169 5,586
Namibia - - - -
South Africa 142 347 168 347
Swaziland - - - -
Tanzania 875 3,435 971 4,129
Zambia - - - -
Zimbabwe - - - -
Total 6,494 32,860 9,625 34,0891 includes moderately to very suitable land
TABLE 6.12Sugarcane production (‘000 tons) in suitable1 land available for intensification
Country
Tillage-based production
Conservation Agriculture
Tillage-based production
Conservation Agriculture
With low input With high input
Angola 96 1,450 105 1,811
Botswana - - - -
Lesotho - - - -
Malawi 95 467 95 467
Mozambique 489 1,607 489 1,607
Namibia - - - -
South Africa 212 433 212 433
Swaziland - - - -
Tanzania 3,339 10,438 4,170 12,938
Zambia - - - -
Zimbabwe - - - -
Total 4,231 14,395 5,071 17,2561 includes moderately to very suitable land

82
NATURAL RESOURCE ASSESSMENT FOR CROP AND LAND SUITABILITY: AN APPLICATION FOR SELECTED BIOENERGY CROPS IN SOUTHERN AFRICA REGION
Integrated Crop Management
FIG
UR
E 6.
15Po
ten
tial
lan
d f
or
sug
arca
ne
exp
ansi
on
un
der
till
age-
bas
ed
pro
du
ctio
n a
t h
igh
leve
l of
inp
uts
by
suit
abili
ty in
dex
FIG
UR
E 6.
16Po
ten
tial
lan
d f
or
sug
arca
ne
exp
ansi
on
un
der
Co
nse
rvat
ion
A
gri
cult
ure
at
hig
h le
vel o
f in
pu
ts b
y su
itab
ility
ind
ex

83
APPLICATION: LAND AVAILABLE FOR BIOFUEL FEEDSTOCKS
Vol. 14–2012
6.1.3 Sweet sorghumIn the case of the sweet sorghum, the analysis was carried out for two different varieties: the lowland and the highland types.
The geographical distribution of the agro-climatic suitability of the sweet sorghum lowland at high- and low-input levels is shown for TA in Figure 6.17, and for CA in Figure 6.18. Distribution for sweet sorghum highland at high- and low-input levels is shown for TA in Figure 6.19, and for CA in Figure 6.20. As shown in Table 6.13, for sweet sorghum lowland production under TA, 55.74 percent of the total regional land area (676 million ha) is agro-climatically suitable, whereas under CA 60.04 percent of the total regional land area is suitable. In the case of sweet sorghum highland, agro-climatically suitable land is 13.55 percent under TA and 19.24 percent under CA (Table 6.15). The bulk of the agro-climatically suitable land for sweet sorghum lowland is located in the northern part of the study region in Tanzania, Angola, Zambia, Malawi, Mozambique and Zimbabwe. The highland variety is agro-climatically suitable mostly in Angola, Swaziland, Tanzania and Zambia (this last one under CA).
Regional suitable land for sweet sorghum lowland decreases by almost 30 percent under each configuration due to the soil and landform constraints (Table 6.14). In the case of highland sweet sorghum, regional suitable land drops to 7 percent on average between low- and high- input levels under TA, with more than 40 percent reduction, whereas under CA the suitable land drops around 13 percent at both input levels, with 30 percent reduction (Table 6.16).
Geographical distribution of the Land Suitability Index for sweet sorghum lowland at low-input level is shown in Figures 6.21 and 6.22 for TA and CA, respectively, and at high-input levels in Figures 6.23 and 6.24. For sweet sorghum highland at low-input levels, the Land Suitability Index is shown in Figures 6.25 and 6.26 for TA and CA, respectively, and at the high-input levels in Figures 6.27 and 6.28.
Once environmental constraints and other land use types have been subtracted, estimates of suitable land available for lowland sweet sorghum expansion and its potential production are presented in Tables 6.17 and 6.19. Tables 6.18 and 6.20 show suitable land and production assuming a policy of intensification. Figures 6.29 and 6.30 show the distribution of potential suitable land area for expansion with high-input levels under TA and CA, respectively. Data for highland sweet sorghum are presented in Tables 6.21 and 6.23 (expansion) and Tables 6.22 and 6.24 (intensification), and in Figures 6.31 and 6.32.
At low-input levels, there are almost 130 million ha of suitable land for expansion of lowland sweet sorghum under TA (corresponding to 543 million tonnes of juice), and slightly more than 155 million ha under CA (corresponding to almost 965 million tonnes of juice). Suitable land for expansion at high-

84
NATURAL RESOURCE ASSESSMENT FOR CROP AND LAND SUITABILITY: AN APPLICATION FOR SELECTED BIOENERGY CROPS IN SOUTHERN AFRICA REGION
Integrated Crop Management
input levels increases to 136 million ha under TA (corresponding to 2.4 billion tonnes) and around 161 million ha under CA (corresponding to 3.7 billion tonnes).
Suitable land for intensification of lowland sweet sorghum with low-level input is around 32 million ha under TA (corresponding to 138 million tonnes of juice) and 42 million ha under CA (corresponding to almost 650 million tonnes); with high-input levels there are 36 million ha under TA (corresponding to 262 million tonnes of juice) and almost 45 million ha under CA (corresponding to almost one billion tonnes).
Suitable land available for expansion of highland sweet sorghum under TA at low-input level is almost 27 million ha (corresponding to 162 million tonnes of juice) and slightly more than 50 million ha under CA at low-input levels (corresponding to more than 800 million tonnes of juice). Suitable land for expansion at high level of inputs increases to 31 million ha under TA (corresponding to 430 million tonnes) and around 51 million ha under CA (corresponding to 1.7 billion tonnes). Suitable land for intensification of highland sweet sorghum with low level of inputs is around 4 million ha under TA (corresponding to almost 25 million tonnes of juice) and 5 million ha under CA (corresponding to almost 120 million tonnes); with high level of inputs there are 8 million ha under TA (corresponding to 67 million tonnes of juice) and almost 8.8 million ha under CA (corresponding to almost 280 million tonnes of juice).
For both varieties of sweet sorghum, the amount of suitable land available for expansion is quite large: in the case of the highland it is almost double under CA.
Given the large amount of suitable and available land and consequently high potential juice production, especially under CA, sweet sorghum has great potential to meet any biofuel demand with relatively low impact on country food security. An analysis of technical feasibility and economic competitiveness for converting this feedstock into biofuel would be required before planning targets.

85
APPLICATION: LAND AVAILABLE FOR BIOFUEL FEEDSTOCKS
Vol. 14–2012
FIG
UR
E 6.
17A
gro
-clim
atic
su
itab
ility
fo
r sw
eet
sorg
hu
m (
low
lan
d)
un
der
till
age-
bas
ed p
rod
uct
ion
at
hig
h a
nd
low
leve
l
FIG
UR
E 6.
18A
gro
-clim
atic
su
itab
ility
fo
r sw
eet
sorg
hu
m (
low
lan
d)
un
der
Co
nse
rvat
ion
Ag
ricu
ltu
re a
t h
igh
an
d lo
w le
vel

86
NATURAL RESOURCE ASSESSMENT FOR CROP AND LAND SUITABILITY: AN APPLICATION FOR SELECTED BIOENERGY CROPS IN SOUTHERN AFRICA REGION
Integrated Crop Management
TABLE 6.13Percentage of agro-climatic suitable1 land for sweet sorghum (lowland)
Country
Tillage-based production
Conservation Agriculture
Total Land Area
With low and high input
With low and high input ‘000 ha
Angola 74.68 75.01 124,945
Botswana 1.03 11.36 57,178
Lesotho - - 2,968
Malawi 99.40 99.40 9,483
Mozambique 91.45 93.33 77,636
Namibia 6.71 16.26 82,083
South Africa 7.44 12.63 120,067
Swaziland 69.46 72.48 1,637
Tanzania 97.20 97.34 88,107
Zambia 100.00 100.00 73,638
Zimbabwe 72.27 90.52 38,318
Total 55.74 60.04 676,0601 includes moderately to very suitable land
TABLE 6.14Percentage of suitable1 land for sweet sorghum (lowland)
Country
Tillage-based production
Conservation Agriculture
Tillage-based production
Conservation Agriculture
Total Land Area
With low input With high input ‘000 ha
Angola 36.98 49.65 39.41 50.28 124,945
Botswana 0.08 1.80 0.23 2.18 57,178
Lesotho - - - - 2,968
Malawi 94.44 99.29 94.47 99.30 9,483
Mozambique 51.64 59.51 55.78 63.24 77,636
Namibia 0.03 4.24 0.08 4.34 82,083
South Africa 3.52 7.65 4.03 8.34 120,067
Swaziland 17.82 26.96 26.16 39.05 1,637
Tanzania 59.17 70.91 67.44 75.05 88,107
Zambia 98.28 99.95 98.28 99.95 73,638
Zimbabwe 30.46 45.73 36.62 50.67 38,318
Total 34.91 42.21 37.39 43.77 676,060
1 includes moderately to very suitable land

87
APPLICATION: LAND AVAILABLE FOR BIOFUEL FEEDSTOCKS
Vol. 14–2012
FIG
UR
E 6.
19A
gro
-clim
atic
su
itab
ility
fo
r sw
eet
sorg
hu
m (
hig
hla
nd
) u
nd
er
tilla
ge-
bas
ed p
rod
uct
ion
at
hig
h a
nd
low
leve
l of
inp
uts
FIG
UR
E 6.
20A
gro
-clim
atic
su
itab
ility
fo
r sw
eet
sorg
hu
m (
hig
hla
nd
) u
nd
er
Co
nse
rvat
ion
Ag
ricu
ltu
re a
t h
igh
an
d lo
w le
vel o
f in
pu
ts

88
NATURAL RESOURCE ASSESSMENT FOR CROP AND LAND SUITABILITY: AN APPLICATION FOR SELECTED BIOENERGY CROPS IN SOUTHERN AFRICA REGION
Integrated Crop Management
TABLE 6.15Percentage of agro-climatic suitable1 land for sweet sorghum (highland)
Country
Tillage-based production
Conservation Agriculture
Total Land Area
With low and High input
With low and high input ‘000 ha
Angola 44.86 46.61 124,945
Botswana - - 57,178
Lesotho - - 2,968
Malawi 8.03 8.03 9,483
Mozambique 2.07 2.14 77,636
Namibia - - 82,083
South Africa 8.79 11.96 120,067
Swaziland 38.15 43.73 1,637
Tanzania 14.32 21.72 88,107
Zambia 12.27 42.43 73,638
Zimbabwe 0.88 10.33 38,318
Total 13.55 19.24 676,0601 includes moderately to very suitable land
TABLE 6.16Percentage of suitable1 land for sweet sorghum (highland)
Country
Tillage-based production
Conservation Agriculture
Tillage-based production
Conservation Agriculture
Total Land Area
With low input With high input ‘000 ha
Angola 20.85 32.16 24.16 32.22 124,945
Botswana - - - - 57,178
Lesotho - - - - 2,968
Malawi 5.17 7.97 5.19 7.97 9,483
Mozambique 0.60 1.36 0.69 1.36 77,636
Namibia - - - - 82,083
South Africa 4.20 7.49 4.79 8.11 120,067
Swaziland 22.14 30.45 23.12 30.56 1,637
Tanzania 5.87 13.58 8.19 14.73 88,107
Zambia 11.21 33.56 11.21 33.56 73,638
Zimbabwe 0.36 3.27 0.36 3.35 38,318
Total 6.80 13.23 7.83 13.50 676,0601 includes moderately to very suitable land

89
APPLICATION: LAND AVAILABLE FOR BIOFUEL FEEDSTOCKS
Vol. 14–2012
FIG
UR
E 6.
21La
nd
su
itab
ility
ind
ex f
or
swee
t so
rgh
um
(lo
wla
nd
) u
nd
er t
illag
e-b
ased
pro
du
ctio
n a
t lo
w le
vel o
f in
pu
ts
FIG
UR
E 6.
22La
nd
su
itab
ility
ind
ex f
or
swee
t so
rgh
um
(lo
wla
nd
) u
nd
er
Co
nse
rvat
ion
Ag
ricu
ltu
re a
t lo
w le
vel o
f in
pu
ts

90
NATURAL RESOURCE ASSESSMENT FOR CROP AND LAND SUITABILITY: AN APPLICATION FOR SELECTED BIOENERGY CROPS IN SOUTHERN AFRICA REGION
Integrated Crop Management
FIG
UR
E 6.
23La
nd
su
itab
ility
ind
ex f
or
swee
t so
rgh
um
(lo
wla
nd
) u
nd
er t
illag
e-b
ased
pro
du
ctio
n a
t h
igh
leve
l of
inp
uts
FIG
UR
E 6.
24La
nd
su
itab
ility
ind
ex f
or
swee
t so
rgh
um
(lo
wla
nd
) u
nd
er
Co
nse
rvat
ion
Ag
ricu
ltu
re a
t h
igh
leve
l of
inp
uts

91
APPLICATION: LAND AVAILABLE FOR BIOFUEL FEEDSTOCKS
Vol. 14–2012
FIG
UR
E 6.
25La
nd
su
itab
ility
ind
ex f
or
swee
t so
rgh
um
(h
igh
lan
d)
un
der
till
age-
bas
ed p
rod
uct
ion
at
low
leve
l of
inp
uts
FIG
UR
E 6.
26La
nd
su
itab
ility
ind
ex f
or
swee
t so
rgh
um
(h
igh
lan
d)
un
der
C
on
serv
atio
n A
gri
cult
ure
at
low
leve
l of
inp
uts

92
NATURAL RESOURCE ASSESSMENT FOR CROP AND LAND SUITABILITY: AN APPLICATION FOR SELECTED BIOENERGY CROPS IN SOUTHERN AFRICA REGION
Integrated Crop Management
FIG
UR
E 6.
27La
nd
su
itab
ility
ind
ex f
or
swee
t so
rgh
um
(h
igh
lan
d)
un
der
till
age-
bas
ed p
rod
uct
ion
at
hig
h le
vel o
f in
pu
ts
FIG
UR
E 6.
28La
nd
su
itab
ility
ind
ex f
or
swee
t so
rgh
um
(h
igh
lan
d)
un
der
C
on
serv
atio
n A
gri
cult
ure
at
hig
h le
vel o
f in
pu
ts

93
APPLICATION: LAND AVAILABLE FOR BIOFUEL FEEDSTOCKS
Vol. 14–2012
TABLE 6.17Percentage of suitable1 land for sweet sorghum (lowland) expansion
Country
Tillage-based production
Conservation Agriculture
Tillage-based production
Conservation Agriculture
Total Land Area
With low input With high input ‘000 ha
Angola 38.96 52.83 41.64 53.30 79,333
Botswana 0.04 1.15 0.19 1.54 36,581
Lesotho - - - - 2,300
Malawi 96.61 99.53 96.65 99.55 5,217
Mozambique 53.19 60.58 57.17 64.16 37,814
Namibia 0.03 4.12 0.10 4.22 61,560
South Africa 2.80 6.13 3.23 6.74 83,549
Swaziland 17.34 26.12 25.03 39.42 939
Tanzania 57.06 69.43 66.08 74.19 38,264
Zambia 98.91 99.94 98.91 99.94 40,313
Zimbabwe 32.71 48.04 39.44 53.43 21,787
Total 31.26 38.18 33.49 39.55 407,6571 includes moderately to very suitable land
TABLE 6.18Percentage of suitable1 land for sweet sorghum (lowland) intensification
Country
Tillage-based production
Conservation Agriculture
Tillage-based production
Conservation Agriculture
Total Land Area
With low input With high input ‘000 ha
Angola 50.96 67.37 54.61 68.29 9,074
Botswana 0.11 3.56 0.25 4.03 9,368
Lesotho - - - - 650
Malawi 95.29 99.05 95.30 99.06 2,142
Mozambique 50.00 58.84 55.61 62.84 12,409
Namibia 0.05 21.69 0.06 21.71 3,561
South Africa 4.99 11.61 5.63 12.59 21,856
Swaziland 22.89 32.60 31.57 41.76 311
Tanzania 53.33 66.43 63.96 72.89 18,612
Zambia 96.74 99.97 96.74 99.97 5,432
Zimbabwe 32.88 48.15 38.65 52.35 10,700
Total 34.79 44.87 38.83 47.55 94,1161 includes moderately to very suitable land

94
NATURAL RESOURCE ASSESSMENT FOR CROP AND LAND SUITABILITY: AN APPLICATION FOR SELECTED BIOENERGY CROPS IN SOUTHERN AFRICA REGION
Integrated Crop Management
TABLE 6.19Sweet sorghum (lowland) production (‘000 tons) in suitable1 land available for expansion
Country
Tillage-based production
Conservation Agriculture
Tillage-based production
Conservation Agriculture
With low input With high input
Angola 117,684 244,840 548,813 921,252
Botswana 37 1,494 703 7,623
Lesotho - - - -
Malawi 28,471 41,296 113,096 152,144
Mozambique 93,777 154,424 407,009 604,521
Namibia 51 9,660 610 36,502
South Africa 7,005 23,179 32,494 93,481
Swaziland 513 1,389 3,124 7,246
Tanzania 93,943 176,821 492,098 736,301
Zambia 176,330 256,621 700,150 945,476
Zimbabwe 24,793 55,091 119,802 226,288
Total 542,604 964,815 2,417,899 3,730,8341 includes moderately to very suitable land
TABLE 6.20Sweet sorghum (lowland) production (‘000 tons) in suitable1 land available for intensification
Country
Tillage-based production
Conservation Agriculture
Tillage-based production
Conservation Agriculture
With low input With high input
Angola 17,938 82,254 36,787 139,005
Botswana 27 241 1,189 5,001
Lesotho - - - -
Malawi 11,466 45,533 16,746 61,683
Mozambique 28,111 126,309 48,158 193,147
Namibia 5 23 3,013 11,113
South Africa 3,123 14,160 11,189 44,628
Swaziland 234 1,392 596 2,689
Tanzania 41,603 223,960 80,296 344,300
Zambia 23,372 92,817 36,530 134,592
Zimbabwe 12,267 58,116 27,656 111,348
Total 138,146 644,805 262,160 1,047,506
1 includes moderately to very suitable land

95
APPLICATION: LAND AVAILABLE FOR BIOFUEL FEEDSTOCKS
Vol. 14–2012
FIG
UR
E 6.
29Po
ten
tial
lan
d f
or
swee
t so
rgh
um
(lo
wla
nd
) ex
pan
sio
n u
nd
er
tilla
ge-
bas
ed p
rod
uct
ion
at
hig
h le
vel o
f in
pu
ts b
y su
itab
ility
ind
ex
FIG
UR
E 6.
30Po
ten
tial
lan
d f
or
swee
t so
rgh
um
(lo
wla
nd
) ex
pan
sio
n u
nd
er
Co
nse
rvat
ion
Ag
ricu
ltu
re a
t h
igh
leve
l of
inp
uts
by
suit
abili
ty in
dex

96
NATURAL RESOURCE ASSESSMENT FOR CROP AND LAND SUITABILITY: AN APPLICATION FOR SELECTED BIOENERGY CROPS IN SOUTHERN AFRICA REGION
Integrated Crop Management
TABLE 6.21Percentage of suitable1 land for sweet sorghum (highland) expansion
Country
Tillage-based production
Conservation Agriculture
Tillage-based production
Conservation Agriculture
Total Land Area
‘000 haWith low input With high input
Angola 20.60 29.62 23.79 29.70 79,333
Botswana - - - - 36,581
Lesotho - - - - 2,300
Malawi 4.17 6.01 4.17 6.01 5,217
Mozambique 0.42 1.04 0.51 1.04 37,814
Namibia - - - - 61,560
South Africa 2.95 5.26 3.28 5.54 83,549
Swaziland 21.28 27.85 21.91 27.97 939
Tanzania 6.48 15.08 8.72 16.21 38,264
Zambia 13.23 36.90 13.23 36.90 40,313
Zimbabwe 0.19 3.56 0.19 3.65 21,787
Total 6.68 12.33 7.59 12.52 407,6571 includes moderately to very suitable land
TABLE 6.22Percentage of suitable1 land for sweet sorghum (highland) intensification
Country
Tillage-based production
Conservation Agriculture
Tillage-based production
Conservation Agriculture
Total Land Area
‘000 haWith low input With high input
Angola 12.45 18.04 14.47 18.16 9,074
Botswana - - - - 9,368
Lesotho - - - - 650
Malawi 5.68 7.58 5.69 7.58 2,142
Mozambique 0.30 0.63 0.33 0.63 12,409
Namibia - - - - 3,561
South Africa 7.14 13.22 8.38 15.72 21,856
Swaziland 26.83 41.45 29.40 41.62 311
Tanzania 4.34 10.93 5.51 12.21 18,612
Zambia 9.12 14.88 9.12 14.88 5,432
Zimbabwe 0.22 2.39 0.22 2.44 10,700
Total 4.53 8.49 5.25 9.34 94,1161 includes moderately to very suitable land

97
APPLICATION: LAND AVAILABLE FOR BIOFUEL FEEDSTOCKS
Vol. 14–2012
TABLE 6.23Sweet sorghum (highland) production (‘000 tons) in suitable1 land available for expansion
Country
Tillage-based production
Conservation Agriculture
Tillage-based production
Conservation Agriculture
With low input With high input
Angola 97,827 507,312 216,587 835,556
Botswana - - - -
Lesotho - - - -
Malawi 1,218 4,877 2,693 10,357
Mozambique 778 4,006 3,032 11,667
Namibia - - - -
South Africa 14,135 65,404 36,825 148,547
Swaziland 1,254 6,270 2,878 11,106
Tanzania 14,473 82,625 48,749 201,006
Zambia 32,330 129,329 114,008 438,510
Zimbabwe 238 1,055 5,199 20,508
Total 162,253 800,878 429,971 1,677,2571 includes moderately to very suitable land
TABLE 6.24Sweet sorghum (highland) production (‘000 tons) in suitable1 land available for intensification
Country
Tillage-based production
Conservation Agriculture
Tillage-based production
Conservation Agriculture
With low input With high input
Angola 7,071 36,955 15,923 61,672
Botswana - - - -
Lesotho - - - -
Malawi 691 2,768 1,389 5,343
Mozambique 180 862 615 2,366
Namibia - - - -
South Africa 8,559 41,158 22,463 101,104
Swaziland 532 2,755 1,319 5,088
Tanzania 4,287 23,999 16,220 70,098
Zambia 2,941 11,766 6,899 26,538
Zimbabwe 157 664 1,768 6,921
Total 24,418 120,927 66,596 279,1301 includes moderately to very suitable land

98
NATURAL RESOURCE ASSESSMENT FOR CROP AND LAND SUITABILITY: AN APPLICATION FOR SELECTED BIOENERGY CROPS IN SOUTHERN AFRICA REGION
Integrated Crop Management
FIG
UR
E 6.
31Po
ten
tial
lan
d f
or
swee
t so
rgh
um
(h
igh
lan
d)
exp
ansi
on
un
der
ti
llag
e-b
ased
pro
du
ctio
n a
t h
igh
leve
l of
inp
uts
by
suit
abili
ty in
dex
FIG
UR
E 6.
32Po
ten
tial
lan
d f
or
swee
t so
rgh
um
(h
igh
lan
d)
exp
ansi
on
un
der
C
on
serv
atio
n A
gri
cult
ure
at
hig
h le
vel o
f in
pu
ts b
y su
itab
ility
ind
ex

99
APPLICATION: LAND AVAILABLE FOR BIOFUEL FEEDSTOCKS
Vol. 14–2012
6.2 CROPS FOR BIODIESEL PRODUCTIONThe crops presented in this section, namely oil palm (tall and compact) and sunflower among others, may be considered for biodiesel production.
6.2.1 Oil PalmAnalysis was carried out for two different varieties of oil palm: tall and compact.
The geographical distribution of the agro-climatic suitability of oil palm tall at high- and low-input levels is shown for TA in Figure 6.33, and for CA in Figure 6.34. Distribution of oil palm compact at high- and low-input levels is shown for TA in Figure 6.35, and for CA in Figure 6.36. As can be seen in Table 6.25, for oil palm tall production under TA, 0.21 percent of the total regional land area (676 million ha) is agro-climatically suitable, whereas under CA, 0.38 percent of the total regional land area is suitable. In the case of oil palm compact, agro-climatically suitable land is 0.28 percent under TA and 2.49 percent under CA (Table 6.27). The area in every LUT is very small, mostly as the result of limited moisture availability.
At low-input levels, regional suitable land for oil palm tall drops to 0.10 percent under TA and 0.20 percent under CA Table 6.26; for oil palm compact the figures drop to 0.14 and 1.07, respectively Table 6.28. The data are very similar at high-input levels as well, except for palm oil compact under CA, where it is 1.88 percent.
Geographical distribution of the Land Suitability Index for oil palm tall at high- and low-input levels (the differences are minimal) is shown in Figures 6.37 and 6.38 for TA and CA, respectively. For oil palm compact at high- and low-input levels, the Land Suitability Index is shown in Figures 6.39 and 6.40 for TA and CA, respectively.
After the environmental constraints and other land use are considered and that land has been subtracted, estimates of suitable land available and its potential production for oil palm tall expansion are presented in Tables 6.29 and 6.31. Tables 6.30 and 6.32 show the suitable land and its potential production assuming a policy of intensification. Figures 6.41 and 6.42 show the distribution of potential suitable land area for expansion with high-input levels under TA and CA, respectively. Oil palm compact data are provided in: Tables 6.33 and 6.35 (expansion); Tables 6.34 and 6.36 (intensification); Figures 6.43 and 6.44.
At high- and low-input levels, there is very limited suitable land in the region for expansion of oil palm tall: 80,000 ha under TA (corresponding to 238,000 tonnes of oil with low inputs and almost 1.3 million tonnes with high inputs) and ranging from 160,000–200,000 ha under CA (corresponding to 700,000 tonnes of oil with low inputs and almost 4.3 million tonnes with high inputs).

100
NATURAL RESOURCE ASSESSMENT FOR CROP AND LAND SUITABILITY: AN APPLICATION FOR SELECTED BIOENERGY CROPS IN SOUTHERN AFRICA REGION
Integrated Crop Management
More suitable land is available for oil palm tall intensification, ranging from 330,000 to almost 700,000 ha with low-input levels under TA and CA, respectively. The corresponding production ranges from 1.2–3.8 million tonnes of oil. At high-input levels, the range increases slightly to 400,000– 800,000 ha, with a considerable increase in production: 6.5 million tonnes under TA and 19.6 million tonnes under CA.
In the case of the oil palm compact, opportunity for land expansion is envisaged under CA with three million ha of suitable land available at low-input levels and 5.7 million ha at high-input levels. Under TA the extension are ranging from 80,000 to 120,000 ha. In the case of intensification the potential suitable land under CA is three times higher than the one under TA: 1.5 million ha vs. 500,000 ha under low-input levels and 1.7 million ha vs. 555,000 ha under high-input levels.
As in the case of sugarcane, oil palm does not represent a feedstock that could be used to cover biodiesel country-specific policy targets. Furthermore, according to the trade figures in FAOSTAT, the countries in the study region are net importers for palm oil, which means that current production is not sufficient to satisfy internal demand.

101
APPLICATION: LAND AVAILABLE FOR BIOFUEL FEEDSTOCKS
Vol. 14–2012
FIG
UR
E 6.
33A
gro
-clim
atic
su
itab
ility
fo
r o
il p
alm
(ta
ll) u
nd
er t
illag
e-b
ased
p
rod
uct
ion
at
hig
h a
nd
low
leve
l of
inp
uts
FIG
UR
E 6.
34A
gro
-clim
atic
su
itab
ility
fo
r o
il p
alm
(ta
ll) u
nd
er C
on
serv
atio
n
Ag
ricu
ltu
re a
t h
igh
an
d lo
w le
vel o
f in
pu
ts

102
NATURAL RESOURCE ASSESSMENT FOR CROP AND LAND SUITABILITY: AN APPLICATION FOR SELECTED BIOENERGY CROPS IN SOUTHERN AFRICA REGION
Integrated Crop Management
FIG
UR
E 6.
35A
gro
-clim
atic
su
itab
ility
fo
r o
il p
alm
(co
mp
act)
un
der
till
age-
bas
ed
pro
du
ctio
n a
t h
igh
an
d lo
w le
vel o
f in
pu
ts
FIG
UR
E 6.
36A
gro
-clim
atic
su
itab
ility
fo
r o
il p
alm
(co
mp
act)
un
der
Co
nse
rvat
ion
A
gri
cult
ure
at
hig
h a
nd
low
leve
l of
inp
uts

103
APPLICATION: LAND AVAILABLE FOR BIOFUEL FEEDSTOCKS
Vol. 14–2012
TABLE 6.25Percentage of agro-climatic suitable1 land for oil palm (tall)
Country
Tillage-based production
Conservation Agriculture Total Land
Area
‘000 haWith low and high input
With low and high input
Angola - - 124,945
Botswana - - 57,178
Lesotho - - 2,968
Malawi - - 9,483
Mozambique - 0.16 77,636
Namibia - - 82,083
South Africa - 0.01 120,067
Swaziland - - 1,637
Tanzania 1.60 2.80 88,107
Zambia - - 73,638
Zimbabwe - - 38,318
Total 0.21 0.38 676,0601 includes moderately to very suitable land
TABLE 6.26Percentage of suitable1 land for oil palm (tall)
Country
Tillage-based production
Conservation Agriculture
Tillage-based production
Conservation Agriculture
Total Land Area
‘000 haWith low input With high input
Angola - - - - 124,945
Botswana - - - - 57,178
Lesotho - - - - 2,968
Malawi - - - - 9,483
Mozambique - 0.02 - 0.02 77,636
Namibia - - - - 82,083
South Africa - - - - 120,067
Swaziland - - - - 1,637
Tanzania 0.75 1.55 0.94 1.84 88,107
Zambia - - - - 73,638
Zimbabwe - - - - 38,318
Total 0.10 0.20 0.12 0.24 676,0601 includes moderately to very suitable land

104
NATURAL RESOURCE ASSESSMENT FOR CROP AND LAND SUITABILITY: AN APPLICATION FOR SELECTED BIOENERGY CROPS IN SOUTHERN AFRICA REGION
Integrated Crop Management
TABLE 6.27Percentage of agro-climatic suitable1 land for oil palm (compact)
Country
Tillage-based production
Conservation Agriculture Total Land
Area
‘000 haWith low and high input
With low and high input
Angola - 8.20 124,945
Botswana - - 57,178
Lesotho - - 2,968
Malawi - 0.58 9,483
Mozambique 0.04 2.05 77,636
Namibia - - 82,083
South Africa 0.13 0.28 120,067
Swaziland - - 1,637
Tanzania 1.93 5.22 88,107
Zambia - - 73,638
Zimbabwe - - 38,318
Total 0.28 2.49 676,0601 includes moderately to very suitable land
TABLE 6.28Percentage of suitable1 land for oil palm (compact)
Country
Tillage-based production
Conservation Agriculture
Tillage-based production
Conservation Agriculture
Total Land Area
‘000 haWith low input With high input
Angola - 2.90 - 6.97 124,945
Botswana - - - - 57,178
Lesotho - - - - 2,968
Malawi - 0.57 - 0.57 9,483
Mozambique 0.01 1.17 0.01 1.26 77,636
Namibia - - - - 82,083
South Africa 0.01 0.11 0.02 0.11 120,067
Swaziland - - - - 1,637
Tanzania 1.04 2.88 1.22 3.21 88,107
Zambia - - - - 73,638
Zimbabwe - - - - 38,318
Total 0.14 1.07 0.16 1.88 676,0601 includes moderately to very suitable land

105
APPLICATION: LAND AVAILABLE FOR BIOFUEL FEEDSTOCKS
Vol. 14–2012
FIG
UR
E 6.
37La
nd
su
itab
ility
ind
ex f
or
oil
pal
m (
tall)
un
der
till
age-
bas
ed
pro
du
ctio
n a
t h
igh
an
d lo
w le
vel o
f in
pu
ts
FIG
UR
E 6.
38La
nd
su
itab
ility
ind
ex f
or
oil
pal
m (
tall)
un
der
Co
nse
rvat
ion
A
gri
cult
ure
at
hig
h a
nd
low
leve
l of
inp
uts

106
NATURAL RESOURCE ASSESSMENT FOR CROP AND LAND SUITABILITY: AN APPLICATION FOR SELECTED BIOENERGY CROPS IN SOUTHERN AFRICA REGION
Integrated Crop Management
FIG
UR
E 6.
39La
nd
su
itab
ility
ind
ex f
or
oil
pal
m (
com
pac
t) u
nd
er t
illag
e-b
ased
p
rod
uct
ion
at
hig
h a
nd
low
leve
l of
inp
uts
FIG
UR
E 6.
40La
nd
su
itab
ility
ind
ex f
or
oil
pal
m (
com
pac
t) u
nd
er C
on
serv
atio
n
Ag
ricu
ltu
re a
t h
igh
an
d lo
w le
vel o
f in
pu
ts

107
APPLICATION: LAND AVAILABLE FOR BIOFUEL FEEDSTOCKS
Vol. 14–2012
TABLE 6.29Percentage of suitable1 land for oil palm (tall) expansion
Country
Tillage-based production
Conservation Agriculture
Tillage-based production
Conservation Agriculture
Total Land Area
With low input With high input ‘000 ha
Angola - - - - 79,333
Botswana - - - - 36,581
Lesotho - - - - 2,300
Malawi - - - - 5,217
Mozambique - 0.02 - 0.02 37,814
Namibia - - - - 61,560
South Africa - - - - 83,549
Swaziland - - - - 939
Tanzania 0.16 0.36 0.21 0.46 38,264
Zambia - - - - 40,313
Zimbabwe - - - - 21,787
Total 0.02 0.04 0.02 0.05 407,6571 includes moderately to very suitable land
TABLE 6.30Percentage of suitable1 land for oil palm (tall) intensification
Country
Tillage-based production
Conservation Agriculture
Tillage-based production
Conservation Agriculture
Total Land Area
With low input With high input ‘000 ha
Angola - - - - 9,074
Botswana - - - - 9,368
Lesotho - - - - 650
Malawi - - - - 2,142
Mozambique - - - - 12,409
Namibia - - - - 3,561
South Africa - - - - 21,856
Swaziland - - - - 311
Tanzania 1.84 3.70 2.26 4.17 18,612
Zambia - - - - 5,432
Zimbabwe - - - - 10,700
Total 0.36 0.73 0.45 0.83 94,1161 includes moderately to very suitable land

108
NATURAL RESOURCE ASSESSMENT FOR CROP AND LAND SUITABILITY: AN APPLICATION FOR SELECTED BIOENERGY CROPS IN SOUTHERN AFRICA REGION
Integrated Crop Management
TABLE 6.31Oil palm (tall) production (‘000 tons) in suitable1 land available for expansion
Country
Tillage-based production
Conservation Agriculture
Tillage-based production
Conservation Agriculture
With low input With high input
Angola - - - -
Botswana - - - -
Lesotho - - - -
Malawi - - - -
Mozambique - 21 - 99
Namibia - - - -
South Africa - - - -
Swaziland - - - -
Tanzania 238 687 1,273 4,134
Zambia - - - -
Zimbabwe - - - -
Total 238 708 1,273 4,2331 includes moderately to very suitable land
TABLE 6.32Oil palm (tall) production (‘000 tons) in suitable1 land available for intensification
Country
Tillage-based production
Conservation Agriculture
Tillage-based production
Conservation Agriculture
With low input With high input
Angola - - - -
Botswana - - - -
Lesotho - - - -
Malawi - - - -
Mozambique - 1 - 4
Namibia - - - -
South Africa - - - -
Swaziland - - - -
Tanzania 1,255 3,753 6,573 19,656
Zambia - - - -
Zimbabwe - - - -
Total 1,255 3,754 6,573 19,6601 includes moderately to very suitable land

109
APPLICATION: LAND AVAILABLE FOR BIOFUEL FEEDSTOCKS
Vol. 14–2012
FIG
UR
E 6.
41Po
ten
tial
lan
d f
or
oil
pal
m (
tall)
exp
ansi
on
un
der
till
age-
bas
ed
pro
du
ctio
n a
t h
igh
leve
l of
inp
uts
by
suit
abili
ty in
dex
FIG
UR
E 6.
42Po
ten
tial
lan
d f
or
oil
pal
m (
tall)
exp
ansi
on
un
der
Co
nse
rvat
ion
A
gri
cult
ure
at
hig
h le
vel o
f in
pu
ts b
y su
itab
ility
ind
ex

110
NATURAL RESOURCE ASSESSMENT FOR CROP AND LAND SUITABILITY: AN APPLICATION FOR SELECTED BIOENERGY CROPS IN SOUTHERN AFRICA REGION
Integrated Crop Management
TABLE 6.33Percentage of suitable1 land for oil palm (compact) expansion
Country
Tillage-based production
Conservation Agriculture
Tillage-based production
Conservation Agriculture
Total Land Area
‘000 haWith low input With high input
Angola - 2.65 - 5.81 79,333
Botswana - - - - 36,581
Lesotho - - - - 2,300
Malawi - 0.34 - 0.34 5,217
Mozambique 0.01 1.11 0.01 1.25 37,814
Namibia - - - - 61,560
South Africa - 0.05 - 0.05 83,549
Swaziland - - - - 939
Tanzania 0.24 1.30 0.31 1.43 38,264
Zambia - - - - 40,313
Zimbabwe - - - - 21,787
Total 0.02 0.76 0.03 1.40 407,6571 includes moderately to very suitable land
TABLE 6.34Percentage of suitable1 land for oil palm (compact) intensification
Country
Tillage-based production
Conservation Agriculture
Tillage-based production
Conservation Agriculture
Total Land Area
‘000 haWith low input With high input
Angola - 0.75 - 2.00 9,074
Botswana - - - - 9,368
Lesotho - - - - 650
Malawi - 0.78 - 0.78 2,142
Mozambique - 0.69 - 0.70 12,409
Namibia - - - - 3,561
South Africa 0.05 0.29 0.09 0.29 21,856
Swaziland - - - - 311
Tanzania 2.59 6.47 2.89 7.07 18,612
Zambia - - - - 5,432
Zimbabwe - - - - 10,700
Total 0.52 1.53 0.59 1.77 94,1161 includes moderately to very suitable land

111
APPLICATION: LAND AVAILABLE FOR BIOFUEL FEEDSTOCKS
Vol. 14–2012
TABLE 6.35Oil palm (compact) production (‘000 tons) in suitable1 land available for expansion
Country
Tillage-based production
Conservation Agriculture
Tillage-based production
Conservation Agriculture
With low input With high input
Angola 10,698 91,370
Botswana -
Lesotho -
Malawi 102 381
Mozambique 11 2,243 79 9,509
Namibia -
South Africa 5 202 40 753
Swaziland -
Tanzania 465 3,008 2,642 12,676
Zambia -
Zimbabwe -
Total 481 16,253 2,581 114,6891 includes moderately to very suitable land
TABLE 6.36Oil palm (compact) production (‘000 tons) in suitable1 land available for intensification
Country
Tillage-based production
Conservation Agriculture
Tillage-based production
Conservation Agriculture
With low input With high input
Angola 352 3,769
Botswana - -
Lesotho - -
Malawi 98 365
Mozambique 474 3 1,780
Namibia - -
South Africa 38 276 259 1,029
Swaziland - -
Tanzania 2,395 9,249 11,599 37,942
Zambia - -
Zimbabwe - -
Total 2,433 10,449 11,861 44,8851 includes moderately to very suitable land

112
NATURAL RESOURCE ASSESSMENT FOR CROP AND LAND SUITABILITY: AN APPLICATION FOR SELECTED BIOENERGY CROPS IN SOUTHERN AFRICA REGION
Integrated Crop Management
FIG
UR
E 6.
43Po
ten
tial
lan
d f
or
oil
pal
m (
com
pac
t) e
xpan
sio
n u
nd
er t
illag
e-b
ased
p
rod
uct
ion
at
hig
h le
vel o
f in
pu
ts b
y su
itab
ility
ind
ex
FIG
UR
E 6.
44 P
ote
nti
al la
nd
fo
r o
il p
alm
(co
mp
act)
exp
ansi
on
un
der
C
on
serv
atio
n A
gri
cult
ure
at
hig
h le
vel o
f in
pu
ts b
y su
itab
ility
ind
ex

113
APPLICATION: LAND AVAILABLE FOR BIOFUEL FEEDSTOCKS
Vol. 14–2012
6.2.2 SunflowerThe geographical distribution of the agro-climatic suitability of sunflower at low- and high-input level is shown for TA in Figure 6.45, and for CA in Figure 6.46. Under TA, 54.35 percent of the total regional land area is agro-climatically suitable for sunflower production, whereas under CA, 60.83 percent of the total regional land area is suitable (Table 6.37). As in the case of sweet sorghum, the bulk of agro-climatically suitable land is located in the northern part of the study region: Tanzania, Angola, Zambia, Malawi, Mozambique and Zimbabwe.
When soil and terrain (slope) constraints are applied to the agro-climatic suitability assessment, regional land suitability for sunflower drops to 32.45 percent under low inputs, and 36.69 percent under high inputs for TA (Table 6.38). For CA, regional land suitability drops to 43.13 percent under low inputs and to 45.6 percent under high inputs.
Regional distribution of the Land Suitability Index for sunflower at high- and low-input levels is shown in Figures 6.47 and 6.48 for TA and CA, respectively. These maps show the location of suitable land for sunflower cultivation within agro-climatically suitable zones for each country in the region.
Estimates of suitable land available for sunflower expansion are presented in Tables 6.39 and 6.41, and for sunflower intensification in Table 6.40 and 6.42. Figures 6.49 and 6.50 show the distribution of potentially suitable land area for expansion with high-input levels under TA and CA, respectively. At low-input levels, there are almost 120 million ha of suitable land for expansion under TA (corresponding to one billion tonnes of sunflower seeds) and around 160 million ha under CA (corresponding to 1.2 billion tonnes of sunflower seeds). Suitable land for expansion at high-input levels increases to 130 million ha under TA (corresponding to 1.4 billion tonnes) and around 170 million ha under CA (corresponding to 1.5 billion tonnes).
Also in case of intensification there are opportunities to improve sunflower production, even if they represent a quarter in terms of land and production.
Under the various LUTs, it can therefore be demonstrated that sunflower production is potentially very feasible in terms of availability of suitable land and yield. Expansion of sunflower could help to meet any biofuel demands, mostly in the countries indicated above, with low impact on food security.

114
NATURAL RESOURCE ASSESSMENT FOR CROP AND LAND SUITABILITY: AN APPLICATION FOR SELECTED BIOENERGY CROPS IN SOUTHERN AFRICA REGION
Integrated Crop Management
FIG
UR
E 6.
45A
gro
-clim
atic
su
itab
ility
fo
r su
nfl
ow
er u
nd
er t
illag
e-b
ased
p
rod
uct
ion
at
hig
h a
nd
low
leve
l of
inp
uts
FIG
UR
E 6.
46A
gro
-clim
atic
su
itab
ility
fo
r su
nfl
ow
er u
nd
er
Co
nse
rvat
ion
Ag
ricu
ltu
re a
t h
igh
an
d lo
w le
vel o
f in
pu
ts

115
APPLICATION: LAND AVAILABLE FOR BIOFUEL FEEDSTOCKS
Vol. 14–2012
TABLE 6.37Percentage of agro-climatic suitable1 land for sunflower
Country
Tillage-based production
Conservation Agriculture Total Land
Area
‘000 haWith low and high input
With low and high input
Angola 74.57 75.01 124,945
Botswana 1.03 11.36 57,178
Lesotho - - 2,968
Malawi 99.40 99.40 9,483
Mozambique 89.91 93.33 77,636
Namibia 6.48 16.26 82,083
South Africa 8.60 18.14 120,067
Swaziland 58.93 72.48 1,637
Tanzania 89.58 95.81 88,107
Zambia 100.00 100.00 73,638
Zimbabwe 65.89 90.74 38,318
Total 54.35 60.83 676,0601 includes moderately to very suitable land
TABLE 6.38Percentage of suitable1 land for sunflower
Country
Tillage-based production
Conservation Agriculture
Tillage-based production
Conservation Agriculture
Total Land Area
‘000 haWith low input With high input
Angola 36.66 49.61 38.71 50.34 124,945
Botswana 0.06 7.76 0.23 8.31 57,178
Lesotho - - - - 2,968
Malawi 94.44 99.29 94.47 99.30 9,483
Mozambique 52.07 63.24 55.26 64.05 77,636
Namibia 0.03 6.17 0.06 6.27 82,083
South Africa 2.34 9.99 4.39 12.34 120,067
Swaziland 5.43 34.53 22.65 39.10 1,637
Tanzania 45.16 65.30 64.26 73.70 88,107
Zambia 98.28 99.94 98.28 99.95 73,638
Zimbabwe 23.76 46.63 34.00 58.30 38,318
Total 32.45 43.13 36.69 45.60 676,0601 includes moderately to very suitable land

116
NATURAL RESOURCE ASSESSMENT FOR CROP AND LAND SUITABILITY: AN APPLICATION FOR SELECTED BIOENERGY CROPS IN SOUTHERN AFRICA REGION
Integrated Crop Management
FIG
UR
E 6.
47La
nd
su
itab
ility
ind
ex f
or
sun
flo
wer
un
der
till
age-
bas
ed
pro
du
ctio
n a
t h
igh
an
d lo
w le
vel o
f in
pu
ts
FIG
UR
E 6.
48La
nd
su
itab
ility
ind
ex f
or
sun
flo
wer
un
der
Co
nse
rvat
ion
A
gri
cult
ure
at
hig
h a
nd
low
leve
l of
inp
uts
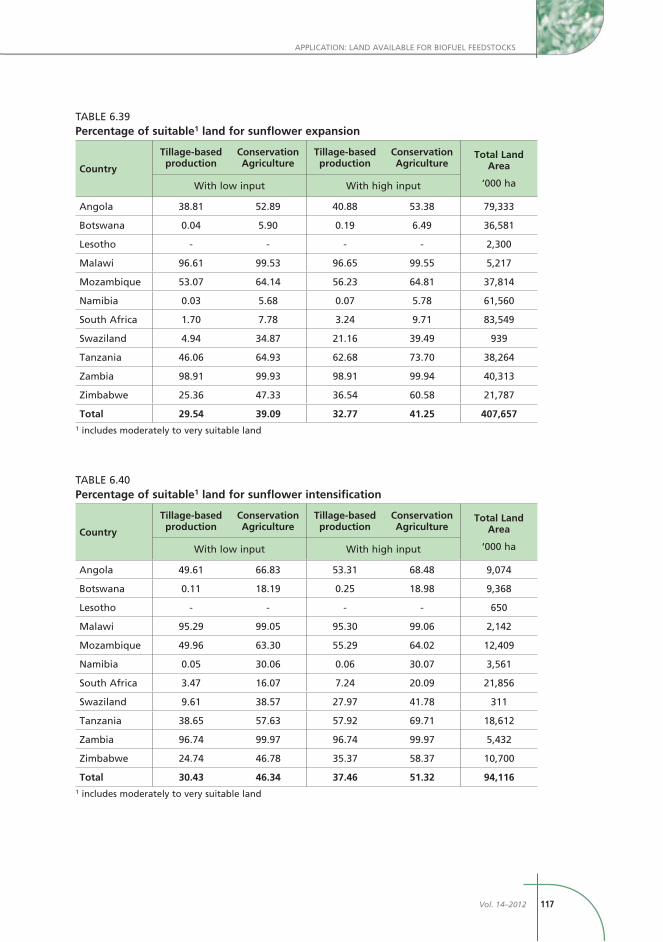
117
APPLICATION: LAND AVAILABLE FOR BIOFUEL FEEDSTOCKS
Vol. 14–2012
TABLE 6.39Percentage of suitable1 land for sunflower expansion
Country
Tillage-based production
Conservation Agriculture
Tillage-based production
Conservation Agriculture
Total Land Area
‘000 haWith low input With high input
Angola 38.81 52.89 40.88 53.38 79,333
Botswana 0.04 5.90 0.19 6.49 36,581
Lesotho - - - - 2,300
Malawi 96.61 99.53 96.65 99.55 5,217
Mozambique 53.07 64.14 56.23 64.81 37,814
Namibia 0.03 5.68 0.07 5.78 61,560
South Africa 1.70 7.78 3.24 9.71 83,549
Swaziland 4.94 34.87 21.16 39.49 939
Tanzania 46.06 64.93 62.68 73.70 38,264
Zambia 98.91 99.93 98.91 99.94 40,313
Zimbabwe 25.36 47.33 36.54 60.58 21,787
Total 29.54 39.09 32.77 41.25 407,6571 includes moderately to very suitable land
TABLE 6.40Percentage of suitable1 land for sunflower intensification
Country
Tillage-based production
Conservation Agriculture
Tillage-based production
Conservation Agriculture
Total Land Area
‘000 haWith low input With high input
Angola 49.61 66.83 53.31 68.48 9,074
Botswana 0.11 18.19 0.25 18.98 9,368
Lesotho - - - - 650
Malawi 95.29 99.05 95.30 99.06 2,142
Mozambique 49.96 63.30 55.29 64.02 12,409
Namibia 0.05 30.06 0.06 30.07 3,561
South Africa 3.47 16.07 7.24 20.09 21,856
Swaziland 9.61 38.57 27.97 41.78 311
Tanzania 38.65 57.63 57.92 69.71 18,612
Zambia 96.74 99.97 96.74 99.97 5,432
Zimbabwe 24.74 46.78 35.37 58.37 10,700
Total 30.43 46.34 37.46 51.32 94,1161 includes moderately to very suitable land

118
NATURAL RESOURCE ASSESSMENT FOR CROP AND LAND SUITABILITY: AN APPLICATION FOR SELECTED BIOENERGY CROPS IN SOUTHERN AFRICA REGION
Integrated Crop Management
TABLE 6.41Sunflower production (‘000 tons) in suitable1 land available for expansion
Country
Tillage-based production
Conservation Agriculture
Tillage-based production
Conservation Agriculture
With low input With high input
Angola 237,047 254,404 361,039 371,718
Botswana 72 351 11,671 13,119
Lesotho - - - -
Malawi 56,507 56,542 60,732 60,757
Mozambique 185,899 200,117 234,910 243,832
Namibia 93 206 22,938 23,383
South Africa 8,889 17,013 43,495 54,280
Swaziland 360 1,306 2,572 2,890
Tanzania 138,142 232,012 209,593 290,572
Zambia 349,951 349,970 379,187 379,205
Zimbabwe 39,803 56,043 77,241 100,051
Total 1,016,763 1,167,964 1,403,378 1,539,8071 includes moderately to very suitable land
TABLE 6.42Sunflower production (‘000 tons) in suitable1 land available for intensification
Country
Tillage-based production
Conservation Agriculture
Tillage-based production
Conservation Agriculture
With low input With high input
Angola 35,076 38,459 54,162 57,072
Botswana 53 121 9,222 9,701
Lesotho - - - -
Malawi 22,757 22,764 24,627 24,633
Mozambique 55,526 62,594 74,122 78,104
Namibia 9 11 7,208 7,212
South Africa 4,679 9,634 22,758 28,584
Swaziland 239 610 995 1,067
Tanzania 53,994 100,021 86,210 129,033
Zambia 46,390 46,391 54,525 54,526
Zimbabwe 19,182 26,822 38,569 48,768
Total 237,905 307,427 372,398 438,7001 includes moderately to very suitable land

119
APPLICATION: LAND AVAILABLE FOR BIOFUEL FEEDSTOCKS
Vol. 14–2012
FIG
UR
E 6.
49Po
ten
tial
lan
d f
or
sun
flo
wer
exp
ansi
on
un
der
till
age-
bas
ed
pro
du
ctio
n a
t h
igh
leve
l of
inp
uts
by
suit
abili
ty in
dex
FIG
UR
E 6.
50Po
ten
tial
lan
d f
or
sun
flo
wer
exp
ansi
on
un
der
Co
nse
rvat
ion
A
gri
cult
ure
at
hig
h le
vel o
f in
pu
ts b
y su
itab
ility
ind
ex

120
NATURAL RESOURCE ASSESSMENT FOR CROP AND LAND SUITABILITY: AN APPLICATION FOR SELECTED BIOENERGY CROPS IN SOUTHERN AFRICA REGION
Integrated Crop Management
6.3 CONCLUDING REMARKSAccess to energy is a prerequisite for sustainable development, in particular in the less-developed countries. Over the past few years, energy security has become a critical issue worldwide. There are basically two key dimensions of energy security:
quantity, which is related to physical supply shortfalls that can occur between production and consumption of energy as a result of infrastructural inadequacy or failure; price, which is related to distortions caused by high prices and fluctuations in the price of energy products and services.
In Africa, affordability takes on a particular meaning. In many cases renewable energy could be a viable option for on/off grid rural electrification, industrial applications and energy security. The purpose of the analysis carried out in the Southern Africa region and presented in this publication was to assess potential land resources available for the production of bioenergy crops, by assessing crop and land suitability and, based on the results, estimating how much potential suitable land is available.
The results published here provide an assessment of the potential for each crop being considered as a bioenergy crop, and where it could best be produced under rainfed conditions. Moreover, the analysis shows how the land suitability for a specific crop in a specific area, and consequently the production of bioenergy crops, can be improved with a change in the agriculture management system (tillage-based vs. Conservation Agriculture) and through the application of inputs (low or high).
Most of the countries in the study region are both aware of and concerned about the potential trade-off between food, environment and feedstock production. Bioenergy developments must not compete with lands already being used, or which have been set aside, for food production and with specific environmental restrictions.
Overall, the assessment provides a technical indication that sweet sorghum for bioethanol production, and sunflower for biodiesel production, show relatively high potential at the regional level.
Lowland sweet sorghum is suitable in most of the countries of Southern Africa region, in particular in the northern areas, ranging from 160 to 205 million ha in all, depending on the suitable land for expansion and intensification under the different sweet sorghum LUTs. In Zambia, Malawi, Tanzania, Mozambique and Angola, potential suitable land for sweet sorghum is more than 50 percent of the total land available in each country for expansion and intensification.
The level of production inputs does not result in a noteworthy increase in the extent of the suitable land, but does result in a four-fold increase in potential production capacity. To mobilise such additional potential, cost analysis and

121
APPLICATION: LAND AVAILABLE FOR BIOFUEL FEEDSTOCKS
Vol. 14–2012
affordability studies would need to be carried out, including research on accessibility to agricultural inputs which is one of the most limiting factors in agriculture for many African countries.
The production management system influences both the extent and yield of potential suitable land for lowland sweet sorghum because of both better agro-climatic and agro-edaphic suitability under CA. Thus, CA limits the decrease of suitable land to about 28 percent as opposed to 35 percent under TA, once the soil and landform constraints have been applied.
Highland sweet sorghum has a smaller suitable land area (from 45 to 90 million ha) compared to lowland sorghum, and is mostly concentrated in the highlands of Angola, Zambia, Tanzania and South Africa. Under CA, suitable land would be doubled compared to TA, principally because of the workability at high slopes.
Very similar conclusions of the ones related to sweet sorghum lowland can be drawn for sunflower in terms of location, extent and comparison between the two agriculture management and level of inputs.
Cassava, which is considered to be a staple food crop after maize in most of the countries in the Southern Africa region, has good potential as bioethanol feedstock in Angola, Tanzania and Mozambique, ranging from almost 20 million to 50 million ha under expansion (80 percent) and intensification (20 percent). If cassava were to be produced under a CA system rather than TA systems, more than twice the area of suitable land would become available. The input level would increase total production by five under TA and by four under CA. However, the absolute production levels would be two to three times greater under CA.
Sugarcane for bioethanol production and oil palm for biodiesel production have very limited potential under rainfed conditions for biofuel development at the regional level for both production systems and levels of inputs. For sugarcane, suitable land for potential expansion is concentrated in Northern Angola and in the Zambezi river basin in Mozambique, while in Tanzania suitable land is located in the coastal region in an area already under agricultural use. It may be possible to increase suitable land area by changing from a tillage-based agriculture system to a conservation agriculture management system, but the potential production levels would still be very low, which means that consideration in a strategic regional plan on bioenergy development would need further study. For oil palm, suitable land is very limited and mainly concentrated in the coastal region in Tanzania. Very localised opportunities could exist under irrigated conditions for both crops, but an assessment of water availability and requirements would need to be carried for various irrigated LUTs.
It is hoped that the methodology and the assessment described in this report will form a basis for further work at both regional and national level for planning and capacity development.


123Vol. 14–2012
References
Brammer, H., Antoine, J., Kassam, A.H. & van Velthuizen H.T. 1988. Land resources appraisal of Bangladesh for agricultural development. Technical Reports Nos. 1-7, FAO/UNDP Project BGD/81/035, Agriculture Development Advisor, Dhaka, Bangladesh.
Dudley, N. 2008. Guidelines for Applying Protected Area Management Categories. Gland, Switzerland: IUCN. x + 86pp.
FAO/IIASA/ISRIC/ISS-CAS/JRC. 2009. Harmonized World Soil Database (version 1.1). FAO, Rome, Italy and IIASA, Laxenburg, Austria.
FAO/IIASA. 2002. Global agro-ecological assessment for agriculture in the 21st Century: methodology and results, by G. Fischer, H. van Velthuizen, M. Shah, & F.O. Nachtergaele. Rome and Laxenburg, Austria.
FAO/IIASA. 1991. Agro-ecological land resources assessment for agricultural development planning: A case study of Kenya: Resources database and land productivity. Main Report and 8 Technical Annexes. Rome, AGL-FAO. 9 vols. 1150p.
FAO/ISRIC. 2003. Soil and Terrain Database for Southern Africa. Land and Water Division, Digital Media Series No. 26. FAO, Rome.
FAO. 2010. Bioenergy and Food Security – The BEFS Analytical Framework. Environment and Natural Resources Management Series No. 16. FAO, Rome.
FAO. 2005. New LocClim – Local Climate Estimator. Environment and Natural Resource Working Paper No. 20. FAO, Rome.
FAO. 2003. World agriculture: towards 2015/2030 – An FAO perspective. FAO and Earthscan.
FAO. 2001. Lecture Notes on the Major Soils of the World. Land and Water Division, World Soil Resources Report No. 94. FAO, Rome.
FAO. 2000. Land Cover Classification System (LCCS): Classification Concepts and User Manual, by Di Gregorio, A. and Jansen, L.J.M. Environment and Natural Resources Service, GCP/RAF/287/ITA Africover - East Africa Project and Soil Resources, Management and Conservation Service.
FAO. 1998. Crop evapotranspiration - Guidelines for computing crop water requirements, by Allen, R.G., Pereira, L.S. , Raes, D. and Smith, M. Irrigation and Drainage Paper No. 56. FAO, Rome.
FAO. 1997. Land quality indicators and their use in sustainable agriculture and rural development, by Tschirley, J.B. and Benites, J.R. Land and Water bulletin No. 5. FAO, Rome.
124
NATURAL RESOURCE ASSESSMENT FOR CROP AND LAND SUITABILITY: AN APPLICATION FOR SELECTED BIOENERGY CROPS IN SOUTHERN AFRICA REGION
Integrated Crop Management
FAO. 1996. Agro-Ecological Zoning: Guidelines. Land and Water Division, Soils Bulletin No. 73. FAO, Rome.
FAO. 1984. Land, Food and People. Economic and Social Development Series No. 30. FAO, Rome.
FAO. 1980. Report on the Second FAO/UNFPA Expert Consultation on Land Resources for Populations of the Future. FAO, Rome.
FAO. 1979. Yield response to water, by Doorenbos J. and Kassam A.H. Irrigation and Drainage Paper No. 33. FAO, Rome.
FAO. 1978–81. Report on the Agro-ecological Zones Project. Vol. 1 - Methodology and results for Africa; Vol. 2 - Results for Southwest Asia; Vol. 3 - Methodology and results for South and Central America; Vol. 4 - Results for Southeast Asia. World Soil Resources Report, No. 48/1-4, FAO, Rome.
Gommes, R., Grieser, J. & Bernardi, M. 2004. FAO agro-climatic databases and mapping tools. European Society for Agronomy 26.
Higgins, G.M., Kassam, A.H., Naiken, L., Fischer, G. & Shah, M.M. 1982. Potential population supporting capacities of lands in the developing world. FAO/IIASA/UNFPA, Rome. 139pp.
Kassam, A.H., Friedrich, T., Shaxson, T.F. & Pretty, J.N. 2009. The spread of Conservation Agriculture: Justification, sustainability and uptake. International Journal of Agriculture Sustainability 7: 292-320.
Kassam, A.H., van Velthuizen, H.T., Fisher, G.W. & Shah, M.M. 1993. Agro-Ecological Land Resources Assessment for Agricultural Development Planning: A case study of Kenya – Main Report. World Soil Resources Reports No. 71. FAO, Rome.
Kassam, A.H., van Velthuizen, H.T., Higgins, G.M., Christoforides, A., Voortman, R.L. & Spiers, B. 1982. Assessment of land resources for rainfed crop production in Mozambique. Field Documents Nos. 32-37, FAO/UNDP Project MOZ/75/011. Land and Water Use Planning, Maputo, Mozambique.
Kassam, A.H. 1980. Multiple cropping and rainfed crop productivity in Africa, pp. 123-195, In: FAO 1980, q.v.
Kassam, A.H., Kowal, J.M. & Sarraf, S. 1977. Climatic adaptability of crops. Consultants’ Report. Agroecological Zones project. FAO-AGL, Rome
Kowal, J.M., & Kassam, A.H. 1978. Agricultural Ecology of Savanna. Oxford: Clarendon Press.
Millennium Ecosystem Assessment. 2005. Ecosystems and Human Well-Being: Synthesis. Island Press, Washington, DC.
Siebert, S., Döll, P., Feick, S., Hoogeveen, J. & Frenken, K. 2007. Global Map of Irrigation Areas version 4.0.1. Johann Wolfgang Goethe University, Frankfurt am Main, Germany / Food and Agriculture Organization of the United Nations, Rome, Italy

125Vol. 14–2012
Annex 1
Applications of the agro-ecological zones approach
Agro-ecological zones (AEZ) project began in FAO in 1976 to assess production potential of land resources in the developing world, and to provide the physical database necessary for planning future agriculture development (FAO, 1978-81). The FAO study developed the concept and methodology to characterize tracts of land by quantified information on climate, soil and other physical factors which are used to predict the agronomic suitability and potential yield of various crops according to their specific environmental, inputs and management needs. Climate, soil and terrain data were combined into a 1:5 million scale land resources database of several thousand unique agro-ecological cells. For each of these, crop requirements and crop growth models were applied to estimate agronomically attainable potential yields and outputs of rainfed crops for a range of input and management levels.
This made it possible for FAO to undertake, with support from the United Nations Population Fund (UNFPA), assessments of the potential population supporting capacities of developing nations (FAO, 1980). Subsequently, in collaboration with UNFPA and IIASA, FAO assessed the supporting capacities of 117 developing nations, grouped into five regions – Africa, Southwest Asia, Southeast Asia, Central America and South America (Higgins et al., 1982). The methodology and the findings were discussed at the 1983 FAO Conference (FAO, 1984) which, recognising the importance of such work for development, recommended that future activities be concentrated at the national level. To do this, more refined methods had to be developed for use at the larger scales (less than 1:1 million scale) required for national and sub-national levels.
Since then, the AEZ methodology has been applied in national development planning activities in several countries including Mozambique (Kassam et al, 1982), Bangladesh (Brammer et al, 1988), and Kenya (Kassam et al, 1993). The AEZ methodology has also been promoted by national authorities in several countries in Asia including ASEAN member countries and China, and in Africa including SADC member countries, Ethiopia, Nigeria and Sierra Leone. More recently, AEZ approach is being applied in the BEFS project in Tanzania, Thailand and Peru (FAO, 2010).
The original AEZ database for the developing regions was expanded by FAO in collaboration with IIASA to include developed regions under the

126
NATURAL RESOURCE ASSESSMENT FOR CROP AND LAND SUITABILITY: AN APPLICATION FOR SELECTED BIOENERGY CROPS IN SOUTHERN AFRICA REGION
Integrated Crop Management
Global AEZ (GAEZ) study (FAO/IIASA, 2002) at 1:5 million scale. The original AEZ database and the GAEZ database have been deployed in several global perspective studies such as Agriculture Towards 2000 series (e.g. FAO, 2003) to address regional and global issues such as food security, land and water resources availability, ecosystem degradation, climate change impact, and international research priorities.
The Southern Africa regional assessment presented in this report is the first attempt at 30 arc-second resolution (equivalent to almost one kilometre at the equator) and it is based on soil information at 1:2 million scale. In terms of implementation, the major difference compared with past AEZ studies is this assessment analyses and compares two types of production systems, the tillage-based system and Conservation Agriculture systems as defined by FAO (www.fao.org/ag/ca).

127Vol. 14–2012
Annex 2
Sources of the land resources inventory
Figure Source of the map
Figure 3.1 FAO, 2006. New LocClim – the Local Climate Estimator.
Figure 3.2FAO, 2006. New LocClim – the Local Climate Estimator, elaborated for the report FAO, 2012. Natural Resource Assessment for Crop and Land Suitability: An application for selected bioenergy crops in Southern Africa region.
Figure 3.3FAO, 2006. New LocClim – the Local Climate Estimator, elaborated for the report FAO, 2012. Natural Resource Assessment for Crop and Land Suitability: An application for selected bioenergy crops in Southern Africa region.
Figure 3.4FAO, 2006. New LocClim – the Local Climate Estimator, elaborated for the report FAO, 2012. Natural Resource Assessment for Crop and Land Suitability: An application for selected bioenergy crops in Southern Africa region.
Figure 3.7FAO, 2006. New LocClim – the Local Climate Estimator, elaborated for the report FAO, 2012. Natural Resource Assessment for Crop and Land Suitability: An application for selected bioenergy crops in Southern Africa region.
Figure 3.8 FAO, 2008. Harmonized World Soil Database (HWSD).
Figure 3.9 FAO, 2008. Harmonized World Soil Database (HWSD).
Figure 3.11National Geospatial-Intelligence Agency (NGA) and the National Aeronautics and Space Administration (NASA). Shuttle Radar Topography Mission – Digital Elevation Model at 90-meter.
Figure 5.1 ESA, 2005-06. Globcover project, based on Envisat’s Medium Resolution Imaging Spectrometer (MERIS) instrument.
Figure 5.2 UNEP-WCMC, 2009. World Database on Protected Areas.
Figure 5.3 University of Frankfurt and FAO, 2007. Global map of irrigation areas (version 4.0.1).
Figure 5.4 FAO, 2012. Natural Resource Assessment for Crop and Land Suitability: An application for selected bioenergy crops in Southern Africa region.
Figure 5.5 FAO, 2012. Natural Resource Assessment for Crop and Land Suitability: An application for selected bioenergy crops in Southern Africa region.
Figure 5.6 U.S. National Geospatial-Intelligence Agency. Vector Map Level 0 (VMap0).
Figure 5.7 FAO, 2008. Poverty Mapping Urban and Rural Population for the year 2005.
Figure 5.8
Demographic Health Survey, 2000-2010. Nutritional status survey. United Nation Children’s Fund., 2000-2010. Multiple Indicator Cluster Surveys. World Health Organization, 2000-2010. Global Database on Child Growth and Malnutrition.
From Figure 6.1 to Figure 6.50
FAO, 2012. Natural Resource Assessment for Crop and Land Suitability: An application for selected bioenergy crops in Southern Africa region.

129Vol. 14–2012
Annex 3
An example of soil suitability ratings for sunflower
SYM90 Description TA-L TA-H CA-L CA-H
ACf Ferric Acrisols S2 50%S1; 50%S2 S1 S1
ACg Gleyic Acrisols N N N N
Ach Haplic Acrisols S2 50%S1; 50%S2 S1 S1
ACp Plinthic Acrisols 50%S2; 50%N 50%S2; 50%N 50%S1; 50%N 50%S1; 50%N
ACu Humic Acrisols S2 50%S1; 50%S2 S1 S1
Alf Ferric Alisols S2 S1 S1 S1
ALg Gleyic Alisols 50%S2; 50%N 50%S2; 50%N 50%S1; 50%N 50%S1; 50%N
ALh Haplic Alisols S2 S1 S1 S1
ALu Humic Alisols S2 S1 S1 S1
ANh Haplic Andosols S1 S1 S1 S1
ANm Mollic Andosols S1 S1 S1 S1
ANu Umbric Andosols S1 S1 S1 S1
ANz Vitric Andosols N N N N
ARa Albic Arenosols N N N N
ARb Cambic Arenosols S2 S2 S1 S1
ARc Calcaric Arenosols S2 S2 S1 S1
ARg Gleyic Arenosols 50%S2; 50%N 50%S2; 50%N 50%S1; 50%N 50%S1; 50%N
ARh Haplic Arenosols S2 S2 S1 S1
ARl Luvic Arenosols S2 S2 S1 S1
ARo Ferralic Arenosols 50%S2; 50%N 50%S2; 50%N 50%S1; 50%N 50%S1; 50%N
ATa Aric Anthrosols N N N N
CHk Calcic Chernozems S2 S2 S1 S1
CHl Luvic Chernozems S2 S2 S1 S1
CLh Haplic Calcisols S2 S2 S1 S1
CLl Luvic Calcisols S2 S2 S1 S1
CLp Petric Calcisols S2 S2 S1 S1
CMc Calcaric Cambisols S1 S1 S1 S1
CMd Dystric Cambisols S2 50%S1; 50%S2 S1 S1
CMe Eutric Cambisols S1 S1 S1 S1
CMg Gleyic Cambisols S1 S1 S1 S1
CMi Gelic Cambisols N N N N
CMo Ferralic Cambisols 50%S2; 50%N 50%S1; 50%S2 50%S1; 50%N S1
CMu Humic Cambisols S1 S1 S1 S1
CMv Vertic Cambisols 50%S1; 50%S2 S1 S1 S1
CMx Chromic Cambisols S1 S1 S1 S1
FLc Calcaric Fluvisols 20%S1; 80%N 20%S1; 80%N 20%S1; 80%N 20%S1; 80%N
FLd Dystric Fluvisols 20%S1; 80%N 20%S1; 80%N 20%S1; 80%N 20%S1; 80%N
FLe Eutric Fluvisols 20%S1; 80%N 20%S1; 80%N 20%S1; 80%N 20%S1; 80%N
FLm Mollic Fluvisols 20%S1; 80%N 20%S1; 80%N 20%S1; 80%N 20%S1; 80%N

130
NATURAL RESOURCE ASSESSMENT FOR CROP AND LAND SUITABILITY: AN APPLICATION FOR SELECTED BIOENERGY CROPS IN SOUTHERN AFRICA REGION
Integrated Crop Management
SYM90 Description TA-L TA-H CA-L CA-H
FLs Salic Fluviosls 20%S1; 80%N 20%S1; 80%N 20%S1; 80%N 20%S1; 80%N
FLt Thionic Fluvisols 20%S1; 80%N 20%S1; 80%N 20%S1; 80%N 20%S1; 80%N
FLu Umbric Fluvisols 20%S1; 80%N 20%S1; 80%N 20%S1; 80%N 20%S1; 80%N
FRg Geric Ferralsols S2 S2 S1 S1
FRh Haplic Ferralsols 50%S1; 50%S2 50%S1; 50%S2 S1 S1
FRp Plinthic Ferralsols 50%S2; 50%N 50%S2; 50%N 50%S1; 50%N 50%S1; 50%N
FRr Rhodic Ferralsols S1 S1 S1 S1
FRu Humic Ferralsols S2 50%S1; 50%S2 S1 50%S1; 50%N
FRx Xanthic Ferralsols S2 S2 S1 S1
GLd Dystric Gleysols N N N N
GLe Eutric Gleysols N N N N
GLi Gelic Gleysols N N N N
GLk Calcic Gleysols N N N N
GLm Mollic Gleysols N N N N
GLu Umbric Gleysols N N N N
GRh Haplic Greyzems S1 S1 S1 S1
GYh Haplic Gypsisols S1 S1 S1 S1
GYk Calcic Gypsisols S1 S1 S1 S1
GYl Luvic Gypsisols S1 S1 S1 S1
GYp Petric Gypsisols 50%S2; 50%N 50%S2; 50%N 50%S1; 50%N 50%S1; 50%N
HSf Fibric Histosols N N N N
HSs Terric Histosols N N N N
KSh Haplic Kastanozems S2 S2 S1 S1
KSk Calcic Kastanozems S2 S2 S1 S1
KSl Luvic Kastanozems 50%S1; 50%S2 50%S1; 50%S2 S1 S1
LPd Dystric Leptosols N N N N
LPe Eutric Leptosols N N N N
LPi Gelic Leptosols N N N N
LPk Rendzic Leptosols N N N N
LPm Mollic Leptosols N N N N
LPq Lithic Leptosols N N N N
LPu Umbric Leptosols N N N N
LVa Albic Luvsiols N N N N
LVf Ferric Luvisols 50%S2; 50%N 50%S1; 50%S2 50%S1; 50%N S1
LVg Gleyic Luvisols 50%S2; 50%N 50%S2; 50%N 50%S1; 50%N 50%S1; 50%N
LVh Haplic Luvisols S1 S1 S1 S1
LVj Stagnic Luvisols N N N N
LVk Calcic Luvisols S2 S1 S1 S1
LVv Vertic Luvisols S2 50%S1; 50%S2 S1 S1
LVx Chromic Luvisols S1 S1 S1 S1
LXf Ferric Lixisols 50%S2; 50%N 50%S2; 50%N 50%S1; 50%N 50%S1; 50%N
LXg Gleyic Lixisols 50%S2; 50%N 50%S2; 50%N 50%S1; 50%N 50%S1; 50%N
LXh Haplic Lixisols S1 S1 S1 S1
LXp Plinthic Lixisols 50%S2; 50%N 50%S2; 50%N 50%S1; 50%N 50%S1; 50%N
NI Nonsoil N N N N
NI Nonsoil N N N N
NTh Haplic Nitisols S1 S1 S1 S1
NTr Rhodic Nitisols S1 S1 S1 S1

131
ANNEX 3 – AN EXAMPLE OF SOIL SUITABILITY RATINGS
Vol. 14–2012
SYM90 Description TA-L TA-H CA-L CA-H
NTu Humic Nitisols S1 S1 S1 S1
PHc Calcaric Phaeozems S2 S2 S1 S1
PHg Gleyic Phaeozems 50%S2; 50%N 50%S2; 50%N 50%S1; 50%N 50%S1; 50%N
PHh Haplic Phaeozems S1 S1 S1 S1
PHj Stagnic Phaeozems N N N N
PHl Luvic Phaeozems S1 S1 S1 S1
PLd Dystric Planosols 50%S2; 50%N 50%S2; 50%N 50%S1; 50%N 50%S1; 50%N
PLe Eutric Planosols S2 S2 S1 S1
PLu Umbric Planosols S2 S2 S1 S1
PTa Albic Plinthosols N N N N
PTe Eutric Plinthosols N N N N
PZc Carbic Podzols N N N N
PZg Gleyic Podzols N N N N
PZh Haplic Podzols N N N N
RGc Calcaric Regosols S2 S2 S1 S1
RGd Dystric Regosols S2 S1 S1 S1
RGe Eutric Regosols S1 S1 S1 S1
RGu Umbric Regosols S1 S1 S1 S1
RK Rock outcrops N N N N
SCg Gleyic Solonchaks N N N N
SCh Haplic Solonchaks N N N N
SCk Calcic Solonchaks N N N N
SCn Sodic Solonchaks N N N N
SNg Gleyic Solonetz N N N N
SNh Haplic Solonetz N N N N
SNj Stagnic Solonetz N N N N
SNk Calcic Solonetz N N N N
SNm Mollic Solonetz N N N N
VRe Eutric Vertisols 50%S2; 50%N S1 50%S1; 50%N S1
VRk Calcic Vertisols 50%S2; 50%N S1 50%S1; 50%N S1
VRy Gypsic Vertisols 50%S2; 50%N 50%S2; 50%N 50%S1; 50%N 50%S1; 50%N
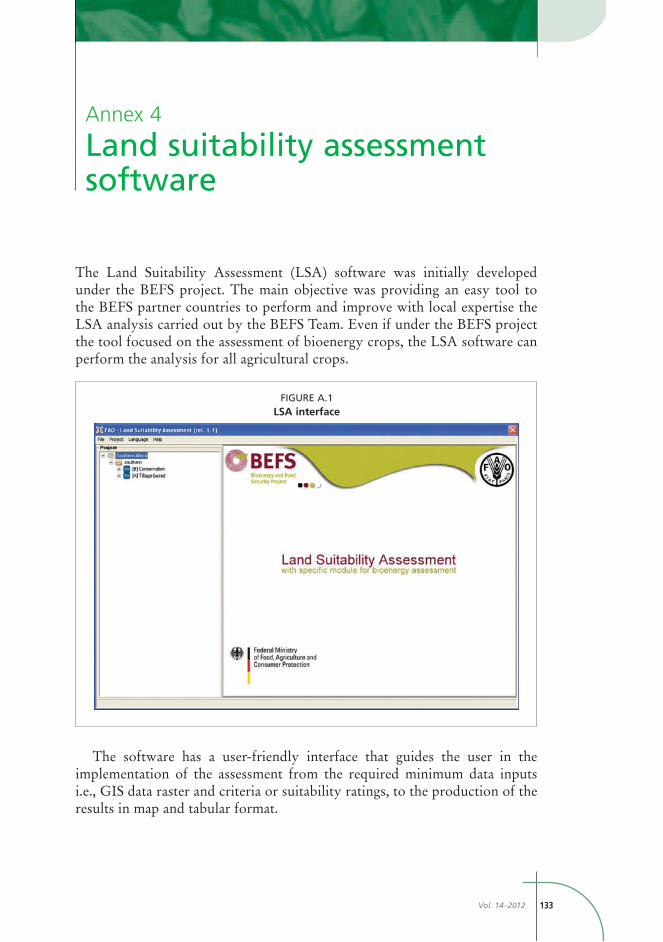
133Vol. 14–2012
Annex 4
Land suitability assessment software
The Land Suitability Assessment (LSA) software was initially developed under the BEFS project. The main objective was providing an easy tool to the BEFS partner countries to perform and improve with local expertise the LSA analysis carried out by the BEFS Team. Even if under the BEFS project the tool focused on the assessment of bioenergy crops, the LSA software can perform the analysis for all agricultural crops.
The software has a user-friendly interface that guides the user in the implementation of the assessment from the required minimum data inputs i.e., GIS data raster and criteria or suitability ratings, to the production of the results in map and tabular format.
FIGURE A.1LSA interface

134
NATURAL RESOURCE ASSESSMENT FOR CROP AND LAND SUITABILITY: AN APPLICATION FOR SELECTED BIOENERGY CROPS IN SOUTHERN AFRICA REGION
Integrated Crop Management
LSA can perform the analysis at different levels (sub-national, country, region and continent) and three different raster resolutions (3 arc-second, 30 arc-second and 5 arc-minute). It does not generate the GIS input data that should be done in Grid-ESRI format: the data are imported in few and rapid steps.
By default the software uses two basic FAO databases: the Global Administrative Unit Level (GAUL) for the first and second administrative boundaries level and the Harmonized World Soil Database (HWSD) for the soil information. It is also possible to import more detailed data related to country boundaries and soil information using the function “Custom”.
The suitability criteria could be quickly imported and exported from specific Excel form (LSA criteria form) or inserted/modified directly into specific masks, as shown in Figure A.2.
For each study area (country, region, etc.) the assessment is organized in Project, which contains the settings decided by the user e.g., administrative level of the tabular results and resolution of GIS analysis. In each project the user can include a different number of LUTs – namely combinations of crop, production system and input level – according to the research needs. Figure A.3 shows the structure of the Southern Africa project, including seven crops (and crop varieties), two production systems and two input levels.
FIGURE A.2Criteria manager mask

135
ANNEX 4 – LAND SUITABILITY ASSESSMENT SOFTWARE
Vol. 14–2012
LSA produces information on agro-climatic and land suitable area and potential production for each LUT by administrative level - according to the project settings - in tabular format. In raster format the results are the following:
level;
The software’s interface and commands are available in four languages: English, Spanish, French and Italian.
The installation is completely guided by setup wizard. The minimum system requirements are provided in Table A.1.
TABLE A.1Minimum system requirements
Hardware Software
Processor: Pentium 800 Mhz minimum
Operating system: Microsoft Window 2000/XP/Vista
RAM: 256 MByte minimum
Disk Space: 1 GByte
ArcGIS ESRI Desktop 9.2
ArcGIS ESRI Workstation 9.2
ArcGIS ESRI Spatial Analyst Extension
Microsoft Excel
Microsoft Access (optional)
Acrobat Reader
FIGURE A.3Southern Africa project

137Vol. 14–2012
Annex 5
CD Results
This report includes a CD that contains a description of the land resources inventory and the results of the crop and land suitability assessment for Southern Africa region. The data are accessible through a user-friendly interface that drives the reader in the three main components of the analysis: the Land Resources Appraisal, the Context of the Analysis and the Crop and Land Suitability Results.
The Land Resources Appraisal section contains the Land Resources Inventory (Climatic and Soil Resources Inventory) and a description of the methodology of the Crop and Land Suitability Assessment (CLSA).
FIGURE A.4Introduction page

138
NATURAL RESOURCE ASSESSMENT FOR CROP AND LAND SUITABILITY: AN APPLICATION FOR SELECTED BIOENERGY CROPS IN SOUTHERN AFRICA REGION
Integrated Crop Management
The Context of the Analysis section includes information on environmental constraints, other land use and socio-economic factors that should be taken into account in designing policy advice for bioenergy development.
FIGURE A.5Land Resources Inventory page
FIGURE A.6Methodology page

139
ANNEX 5 – CD RESULTS
Vol. 14–2012
The CLSA Results section helps the reader to navigate and visualise the considerable amount of results of the assessment. By selecting the crop of interest, the reader accesses the results in map format: for each combination of production system and level of input, the agro-climatic suitability map and the land suitability index map can be found. These maps can be visualised without any exclusion areas or over-imposing environmental constraints or environmental constraints plus agricultural areas, looking at areas with potential expansion for agriculture.
FIGURE A.7The context of the analysis page

140
NATURAL RESOURCE ASSESSMENT FOR CROP AND LAND SUITABILITY: AN APPLICATION FOR SELECTED BIOENERGY CROPS IN SOUTHERN AFRICA REGION
Integrated Crop Management
By clicking on the button at the bottom-right corner, the reader gets into the tabular results. The tables present all suitable and available area and potential production at country level and at first administrative level.
FIGURE A.8Map results
FIGURE A.9Tabular results

Natural Resource Assessment for Crop and Land Suitability:An application for selected bioenergy crops in Southern Africa region
The pilot regional assessment carried out for Southern Africa and described in this publication was designed to help evaluate the crop and land suitability of bioenergy crops which are also food crops, namely: cassava, sugarcane, sweet sorghum, sunflower and oil palm under rainfed production conditions. By providing critical bioenergy crop adaptability and land resources information, along with extensive maps, to policy-planners and decision-makers for socioeconomic development, it is expected that national policy and development capacity will also be strengthened.
The crop and land suitability assessments provide an up-to-date GIS database for climate, soil, terrain and vegetation information, and includes critical data sets, methodological and analytical support and the integration of FAO’s AEZ methodology, including an inventory of land resources and specific ecological and agronomic adaptability requirements for selected bioenergy crops under the tillage-based production systems and under Conservation Agriculture.
The assessment also enhances and expands the current ECOCROP database and its applications by adding more detailed information on bioenergy crops and using a mapping function to enable countries to better plan and decide on their agricultural strategy with respect to food and bioenergy crops.
This publication seeks to assist government and institutional policy-planners and decision-makers in identifying places where energy crops could be grown and in understanding the geographic (agro-ecological and economic) context of bioenergy supplies, at country and regional levels. It will not only increase awareness about the environmental challenges related to the production systems of bioenergy crops, but will also contribute to the development of new production practices and technologies for sustainable agricultural intensification and diversification in the context of the new FAO “Save and Grow” paradigm.
I2713E/1/04.12
ISBN 978-92-5-107218-9 ISSN 1020-4555
9 7 8 9 2 5 1 0 7 2 1 8 9