Embed Size (px)
Citation preview
Natural Rubber Industry Situationer
Anthony P. BravoProvincial DirectorDTI Cotabato Province
Agri-Center - Provincial CapitolBrgy Amas, Kidapawan City
13 May 2014
Natural Rubber Industry Situationer
- World Market Situation
- Domestic Market Situation
- Pricing Analysis
- Market Outlook
- DTI’s Initiatives
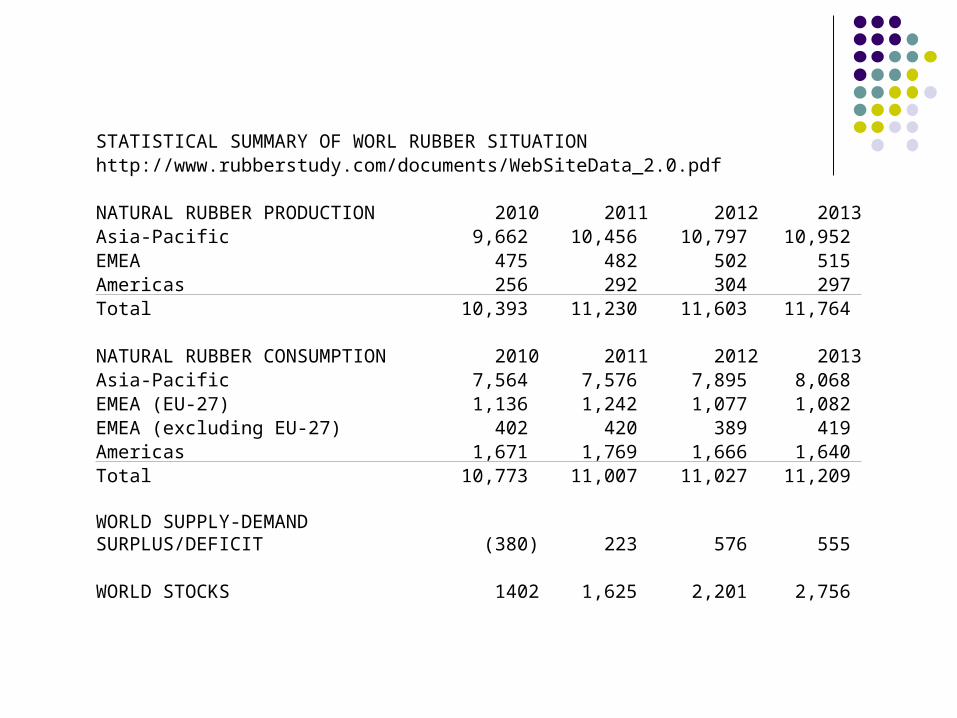
STATISTICAL SUMMARY OF WORL RUBBER SITUATIONhttp://www.rubberstudy.com/documents/WebSiteData_2.0.pdf
NATURAL RUBBER PRODUCTION 2010 2011 2012 2013Asia-Pacific 9,662 10,456 10,797 10,952 EMEA 475 482 502 515 Americas 256 292 304 297 Total 10,393 11,230 11,603 11,764
NATURAL RUBBER CONSUMPTION 2010 2011 2012 2013Asia-Pacific 7,564 7,576 7,895 8,068 EMEA (EU-27) 1,136 1,242 1,077 1,082 EMEA (excluding EU-27) 402 420 389 419 Americas 1,671 1,769 1,666 1,640 Total 10,773 11,007 11,027 11,209
WORLD SUPPLY-DEMAND SURPLUS/DEFICIT (380) 223 576 555
WORLD STOCKS 1402 1,625 2,201 2,756
0
2,000
4,000
6,000
8,000
10,000
12,000
14,000
2010 2011 2012 2013
In "
000
MT
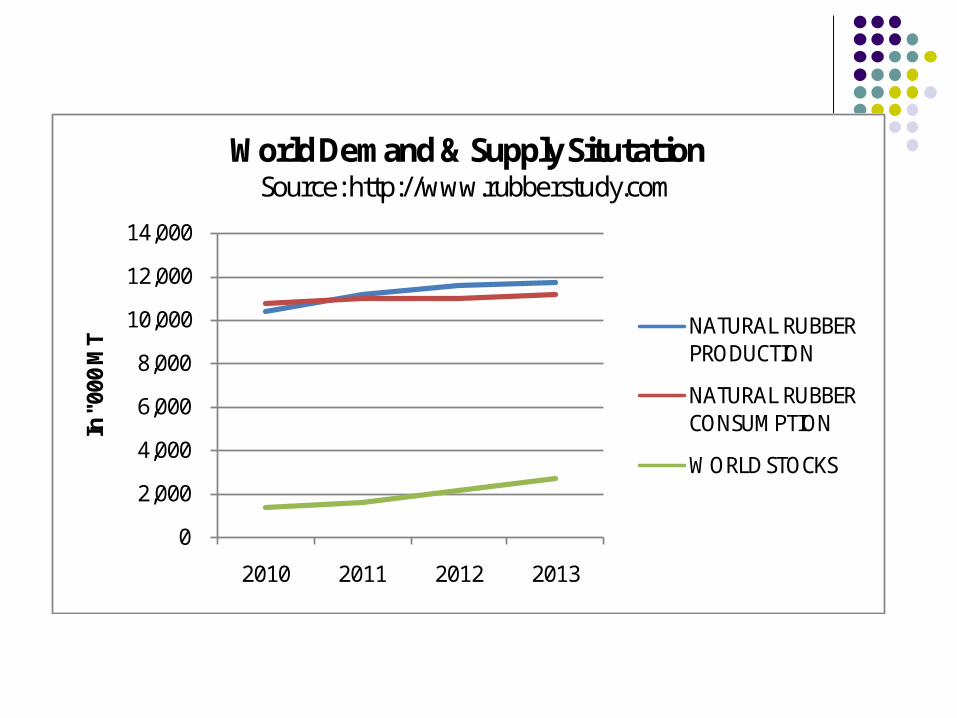
World Demand & Supply SitutationSource: http://www.rubberstudy.com
NATURAL RUBBER PRODUCTION
NATURAL RUBBER CONSUMPTION
WORLD STOCKS
23/8/2012 Ist Reg Rub Con Philippines 5
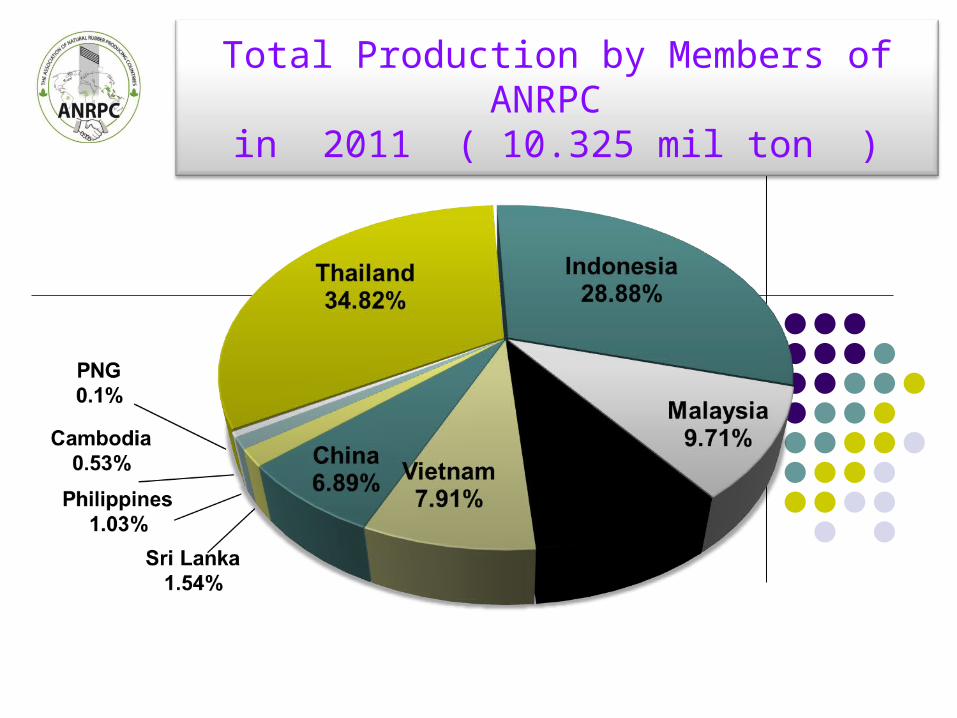
Total Production by Members of ANRPC in 2011 ( 10.325 mil ton )
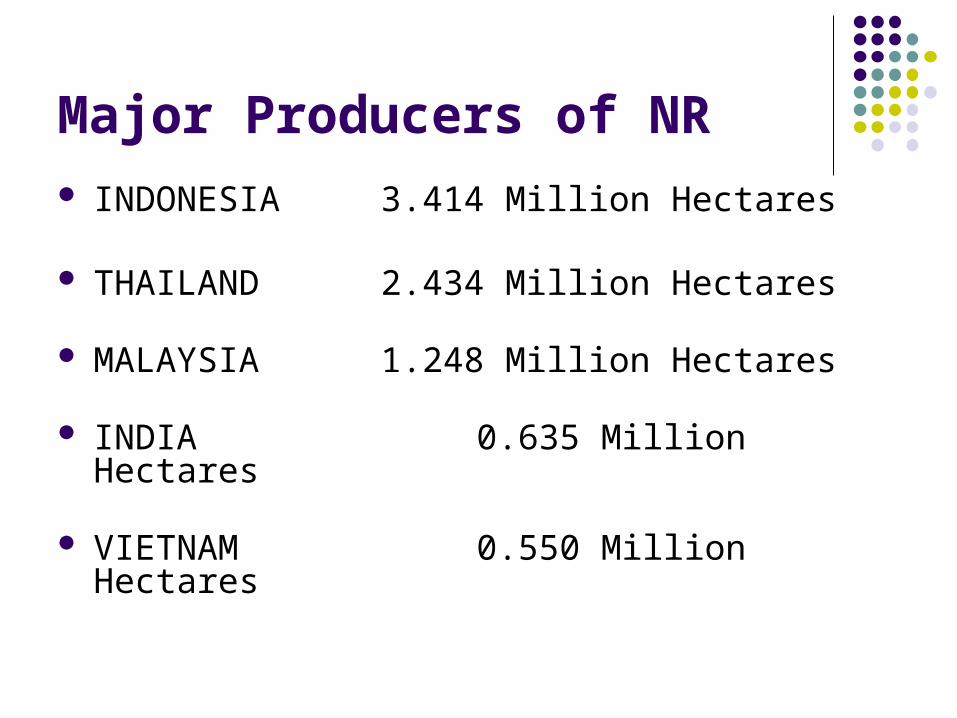
Major Producers of NR INDONESIA 3.414 Million Hectares
THAILAND 2.434 Million Hectares
MALAYSIA 1.248 Million Hectares
INDIA 0.635 Million Hectares
VIETNAM 0.550 Million Hectares
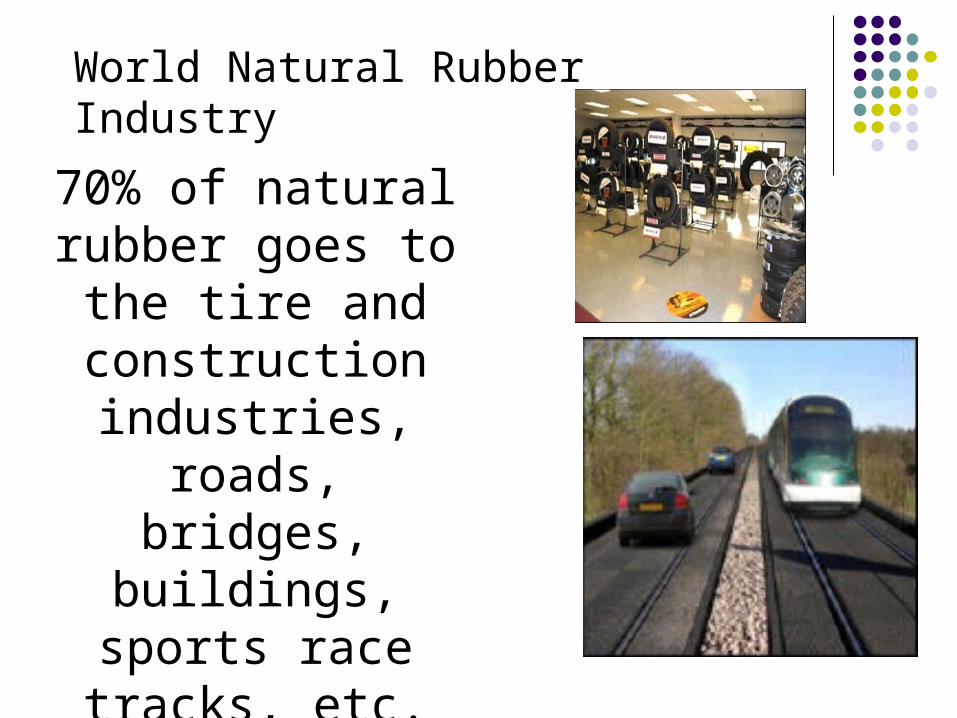
70% of natural rubber goes to the
tire and construction
industries, roads, bridges, buildings, sports race tracks,
etc.
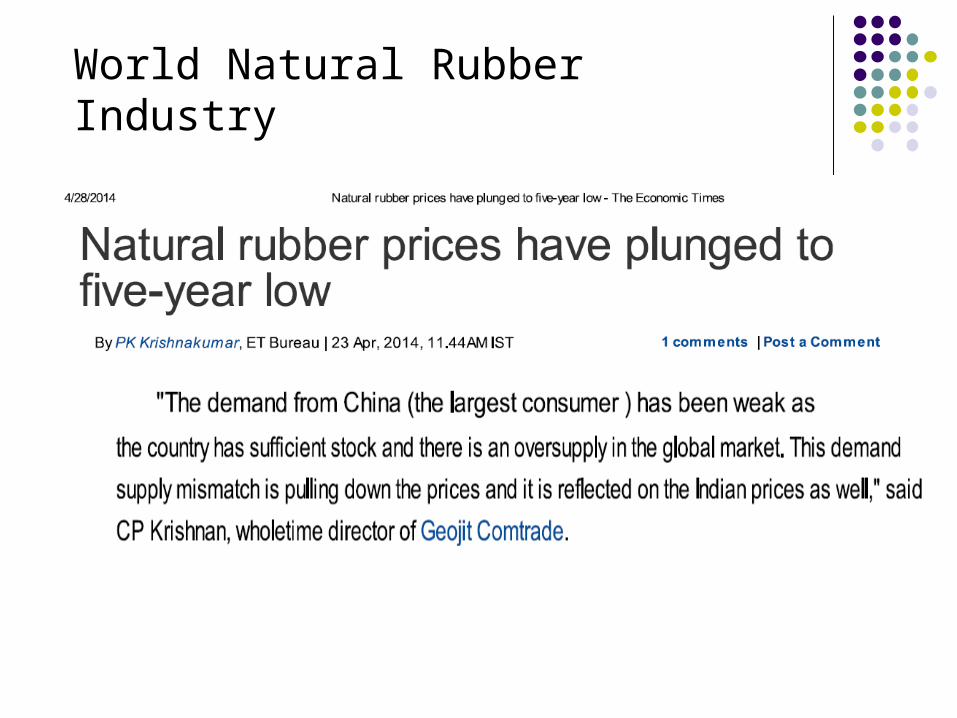
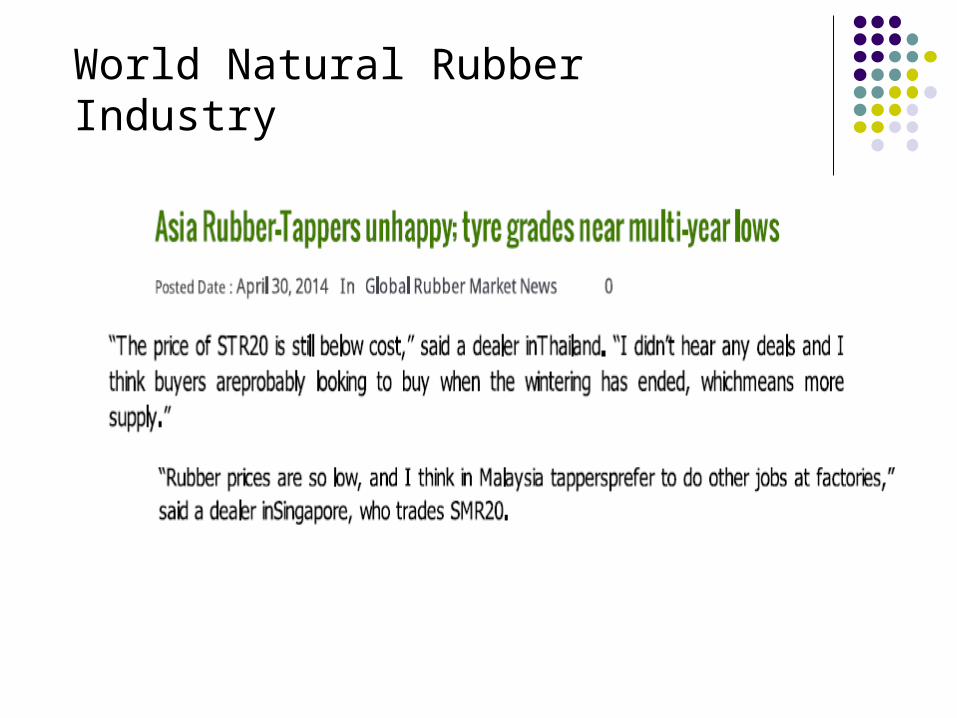
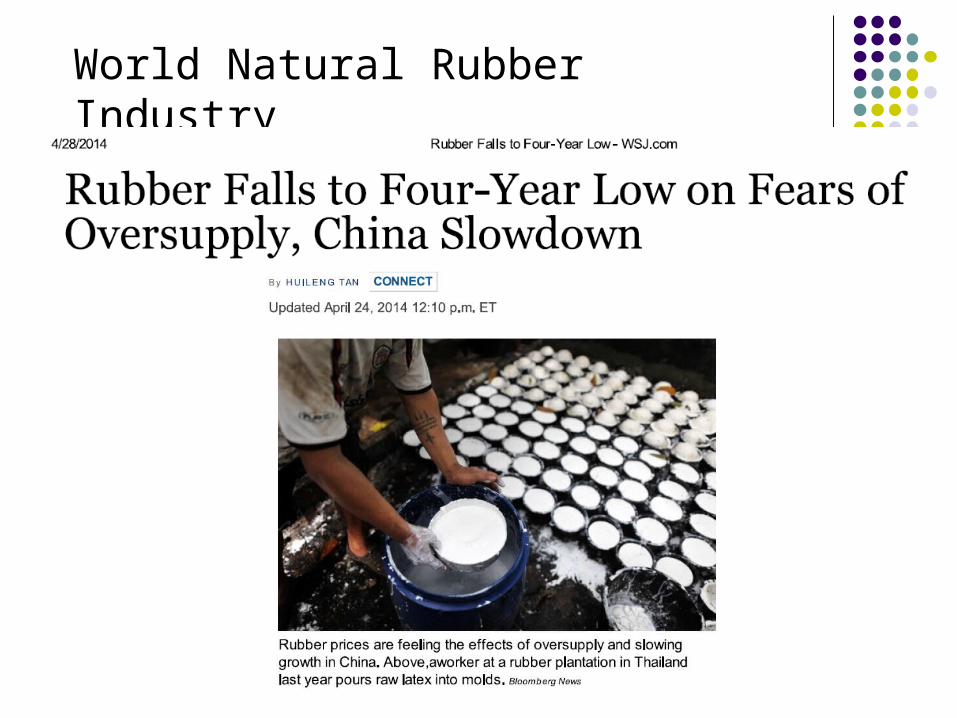
World Natural Rubber Industry
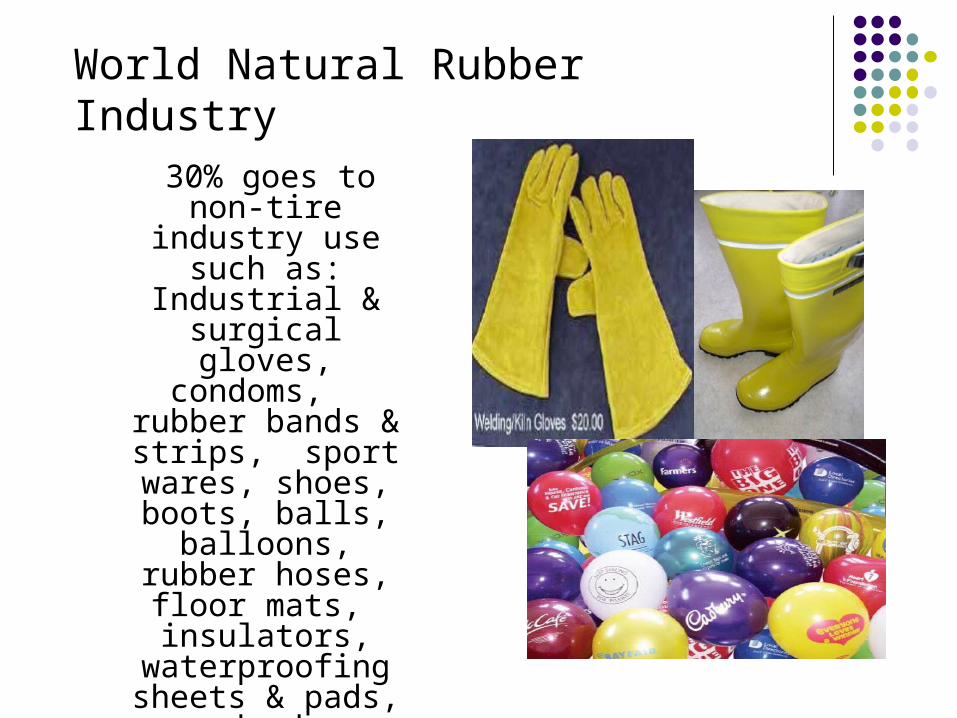
30% goes to non-
tire industry use such as: Industrial & surgical gloves, condoms, rubber
bands & strips, sport wares, shoes,
boots, balls, balloons, rubber
hoses, floor mats, insulators,
waterproofing sheets & pads,
shock absorbers etc……
World Natural Rubber Industry
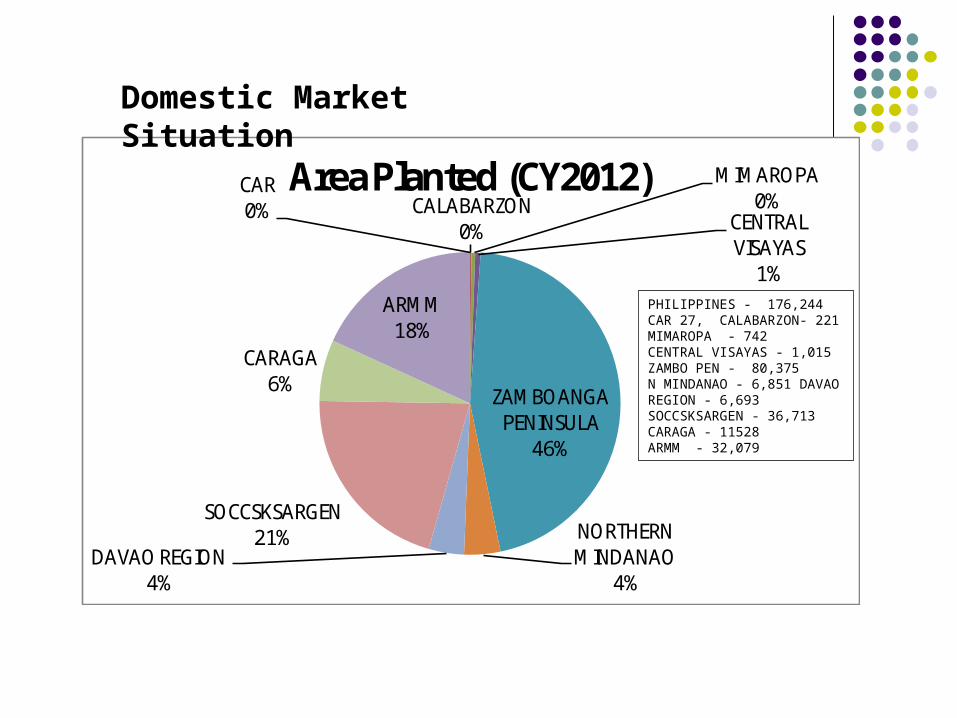
CAR0% CALABARZON
0%
MIMAROPA0%
CENTRAL VISAYAS
1%
ZAMBOANGA PENINSULA
46%
NORTHERN MINDANAO
4%DAVAO REGION
4%
SOCCSKSARGEN21%
CARAGA6%
ARMM18%
Area Planted (CY2012)
PHILIPPINES - 176,244 CAR 27, CALABARZON- 221 MIMAROPA - 742 CENTRAL VISAYAS - 1,015 ZAMBO PEN - 80,375 N MINDANAO - 6,851 DAVAO REGION - 6,693 SOCCSKSARGEN - 36,713 CARAGA - 11528 ARMM - 32,079
Domestic Market Situation
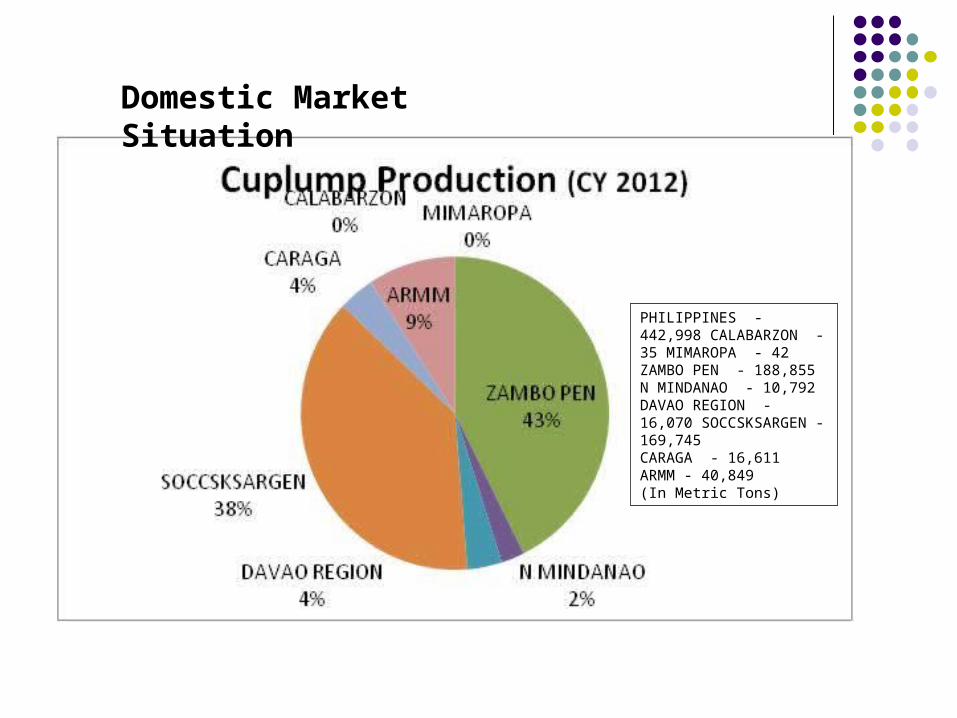
PHILIPPINES - 442,998 CALABARZON - 35 MIMAROPA - 42 ZAMBO PEN - 188,855 N MINDANAO - 10,792 DAVAO REGION - 16,070 SOCCSKSARGEN -169,745 CARAGA - 16,611 ARMM - 40,849 (In Metric Tons)
Domestic Market Situation
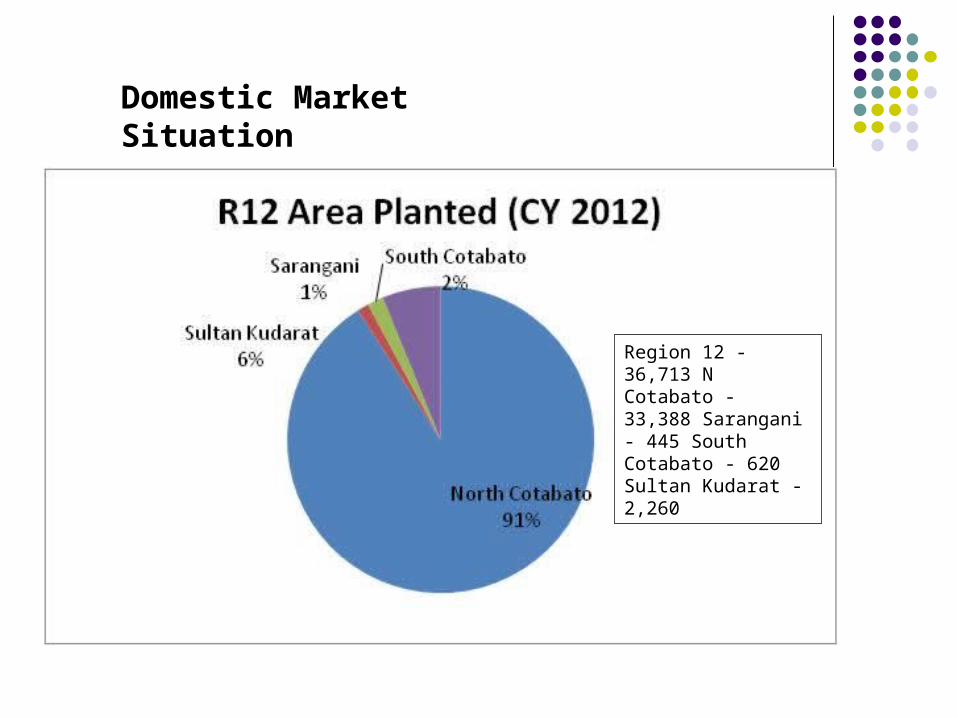
Region 12 - 36,713 N Cotabato - 33,388 Sarangani - 445 South Cotabato - 620 Sultan Kudarat - 2,260
Domestic Market Situation
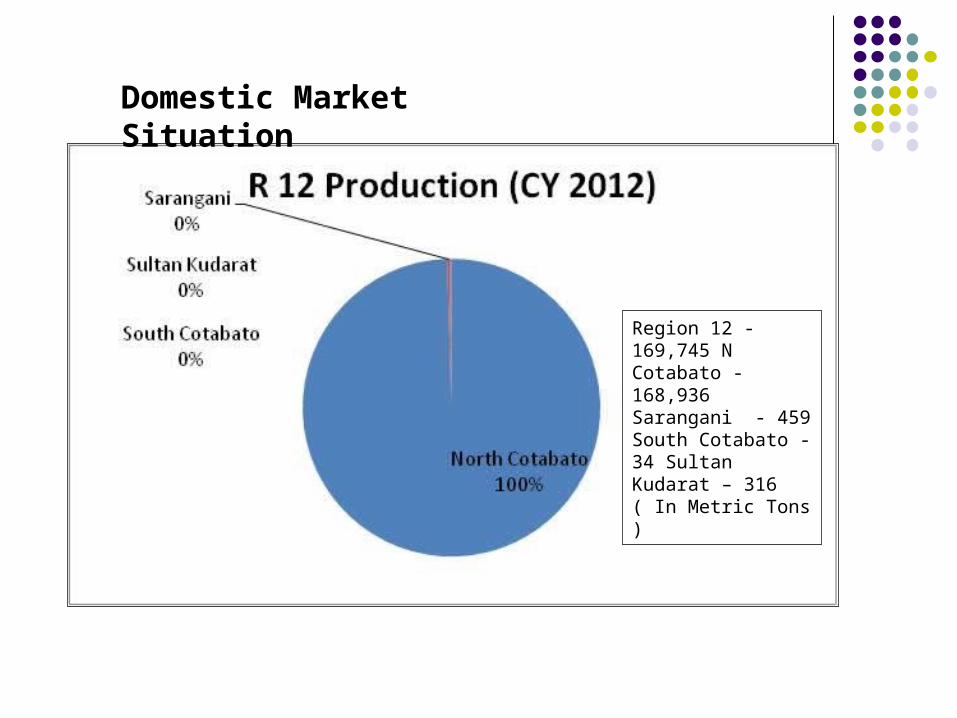
Region 12 - 169,745 N Cotabato - 168,936 Sarangani - 459 South Cotabato - 34 Sultan Kudarat – 316( In Metric Tons )
Domestic Market Situation
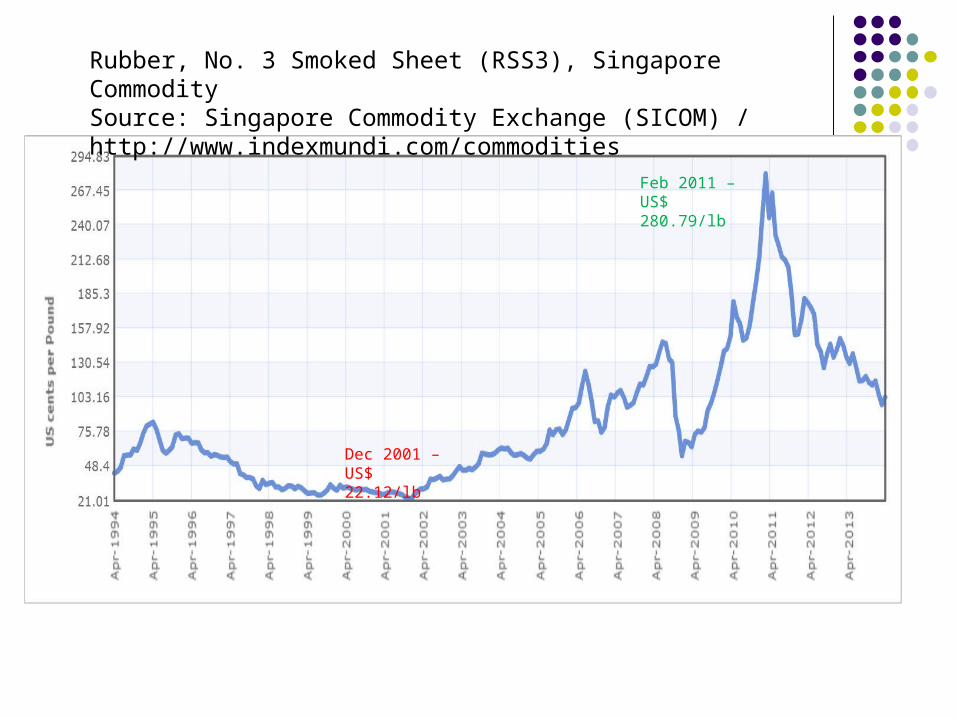
Rubber, No. 3 Smoked Sheet (RSS3), Singapore Commodity Source: Singapore Commodity Exchange (SICOM) / http://www.indexmundi.com/commodities
Feb 2011 – US$ 280.79/lb
Dec 2001 – US$ 22.12/lb
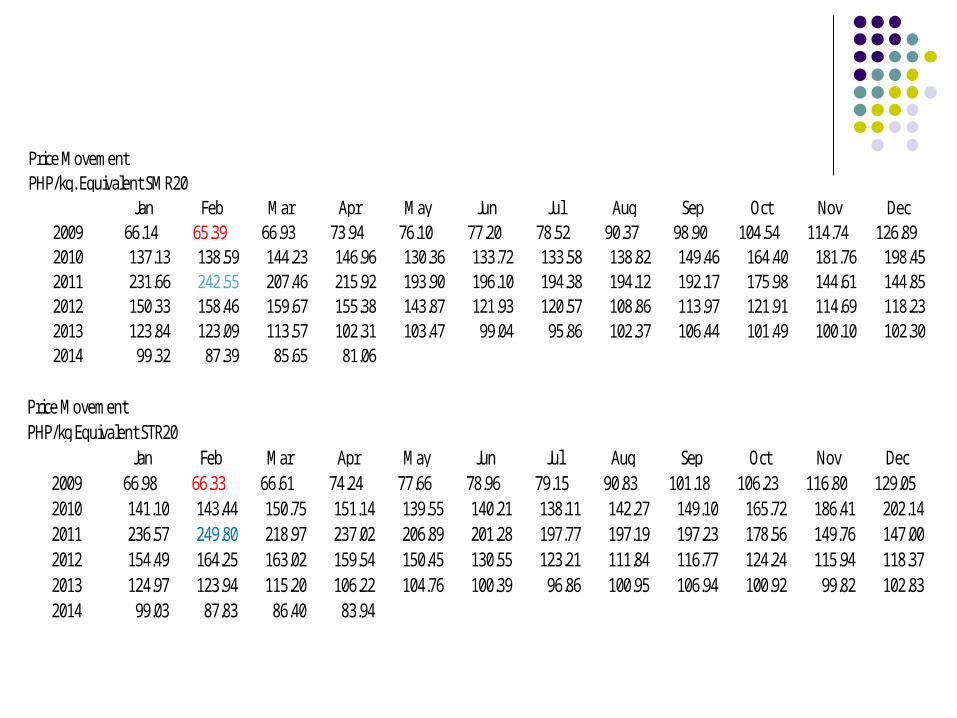
Price Movement PHP/kg. Equivalent SMR20
Jan Feb Mar Apr May Jun Jul Aug Sep Oct Nov Dec2009 66.14 65.39 66.93 73.94 76.10 77.20 78.52 90.37 98.90 104.54 114.74 126.892010 137.13 138.59 144.23 146.96 130.36 133.72 133.58 138.82 149.46 164.40 181.76 198.452011 231.66 242.55 207.46 215.92 193.90 196.10 194.38 194.12 192.17 175.98 144.61 144.852012 150.33 158.46 159.67 155.38 143.87 121.93 120.57 108.86 113.97 121.91 114.69 118.232013 123.84 123.09 113.57 102.31 103.47 99.04 95.86 102.37 106.44 101.49 100.10 102.302014 99.32 87.39 85.65 81.06
Price Movement PHP/kg Equivalent STR20
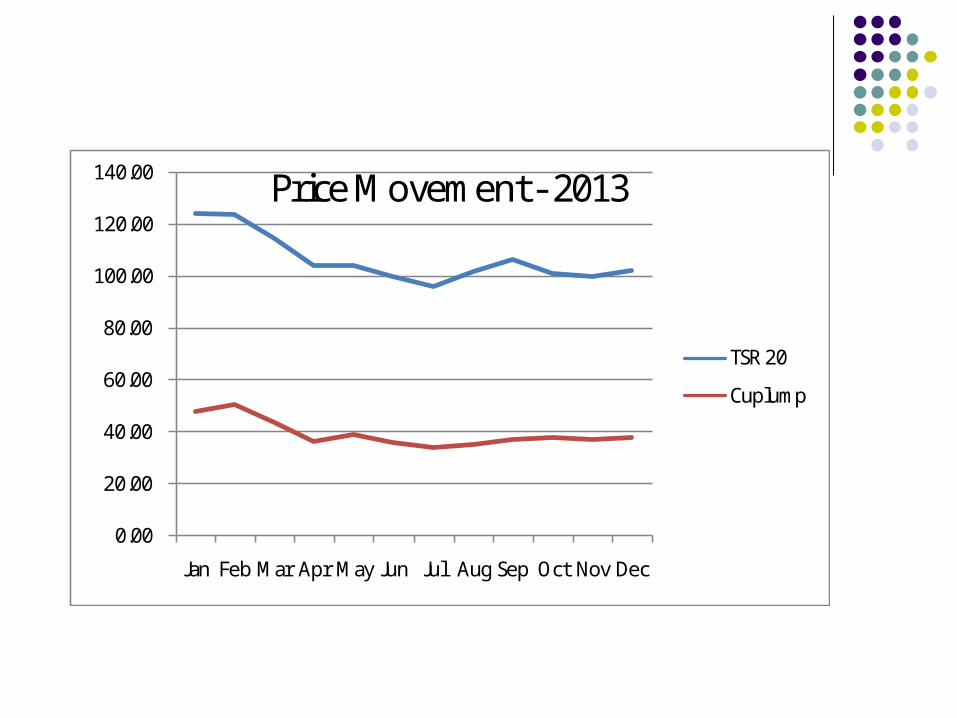
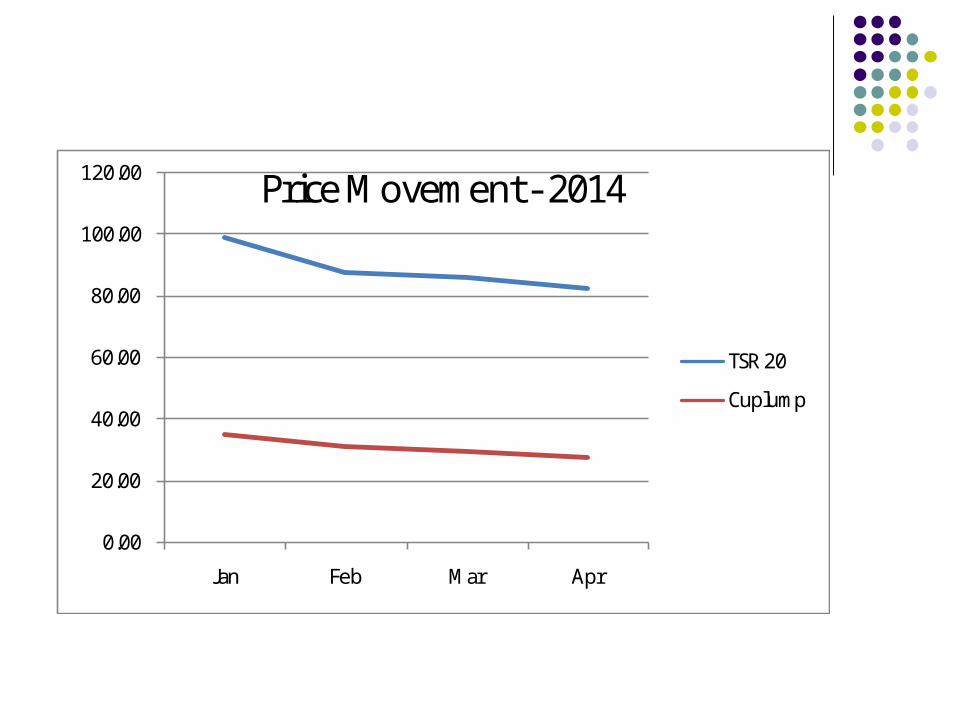
Jan Feb Mar Apr May Jun Jul Aug Sep Oct Nov Dec2009 66.98 66.33 66.61 74.24 77.66 78.96 79.15 90.83 101.18 106.23 116.80 129.052010 141.10 143.44 150.75 151.14 139.55 140.21 138.11 142.27 149.10 165.72 186.41 202.142011 236.57 249.80 218.97 237.02 206.89 201.28 197.77 197.19 197.23 178.56 149.76 147.002012 154.49 164.25 163.02 159.54 150.45 130.55 123.21 111.84 116.77 124.24 115.94 118.372013 124.97 123.94 115.20 106.22 104.76 100.39 96.86 100.95 106.94 100.92 99.82 102.832014 99.03 87.83 86.40 83.94
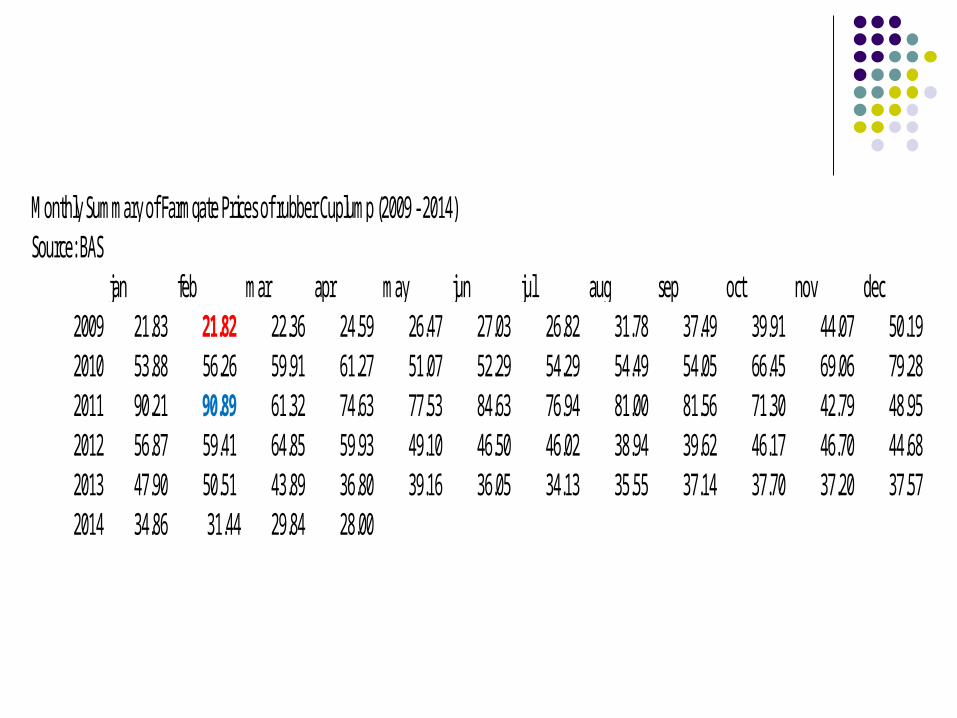
Monthly Summary of Farmgate Prices of rubber Cuplump (2009 - 2014)Source: BAS
jan feb mar apr may jun jul aug sep oct nov dec2009 21.83 21.82 22.36 24.59 26.47 27.03 26.82 31.78 37.49 39.91 44.07 50.192010 53.88 56.26 59.91 61.27 51.07 52.29 54.29 54.49 54.05 66.45 69.06 79.282011 90.21 90.89 61.32 74.63 77.53 84.63 76.94 81.00 81.56 71.30 42.79 48.952012 56.87 59.41 64.85 59.93 49.10 46.50 46.02 38.94 39.62 46.17 46.70 44.682013 47.90 50.51 43.89 36.80 39.16 36.05 34.13 35.55 37.14 37.70 37.20 37.572014 34.86 31.44 29.84 28.00
0.00
50.00
100.00
150.00
200.00
250.00
300.00 Ja
n Jul
Jan Jul
Jan Jul
Jan Jul
Jan Jul
Jan Jul2009 2010 2011 2012 2013 2014
PhP/
kg
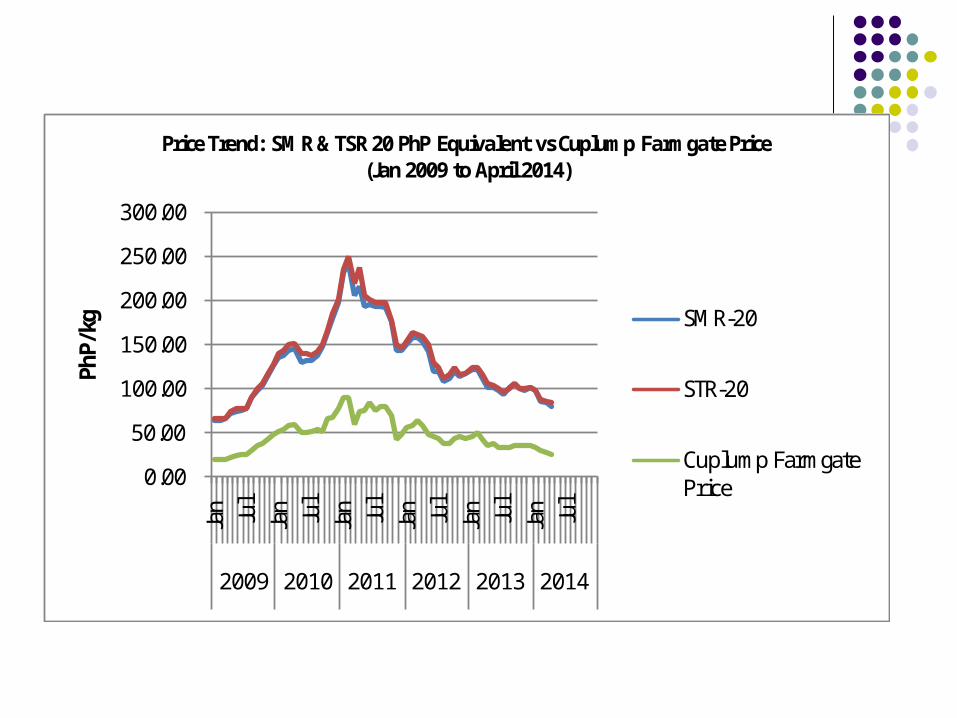
Price Trend: SMR & TSR 20 PhP Equivalent vs Cuplump Farmgate Price(Jan 2009 to April 2014)
SMR-20
STR-20
Cuplump Farmgate Price
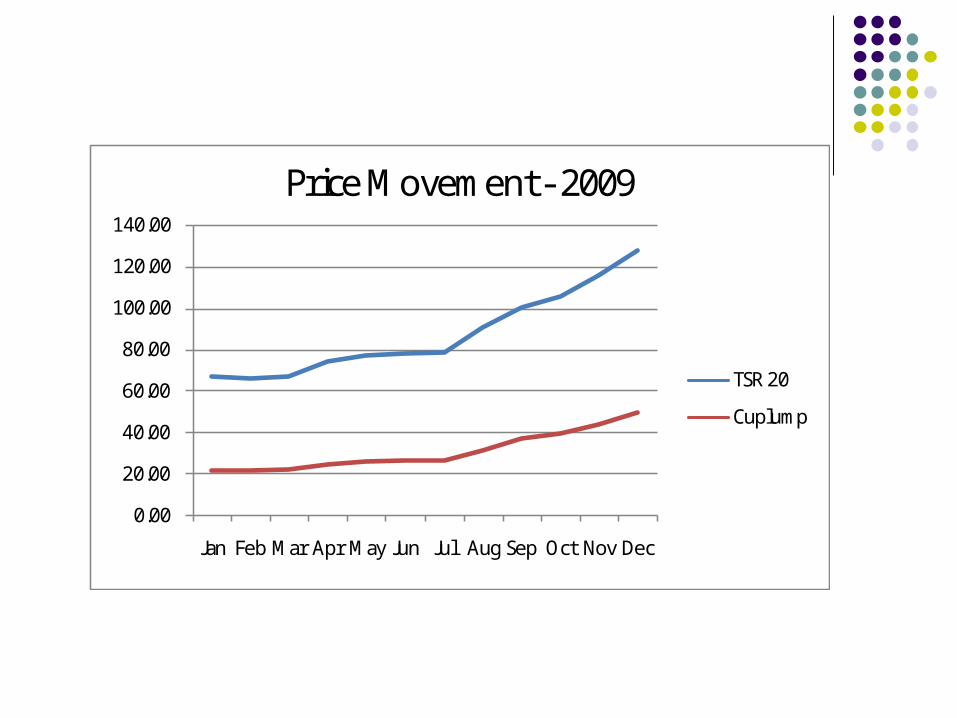
0.00
20.00
40.00
60.00
80.00
100.00
120.00
140.00
Jan Feb Mar Apr May Jun Jul Aug Sep Oct Nov Dec
Price Movement - 2009
TSR 20
Cuplump
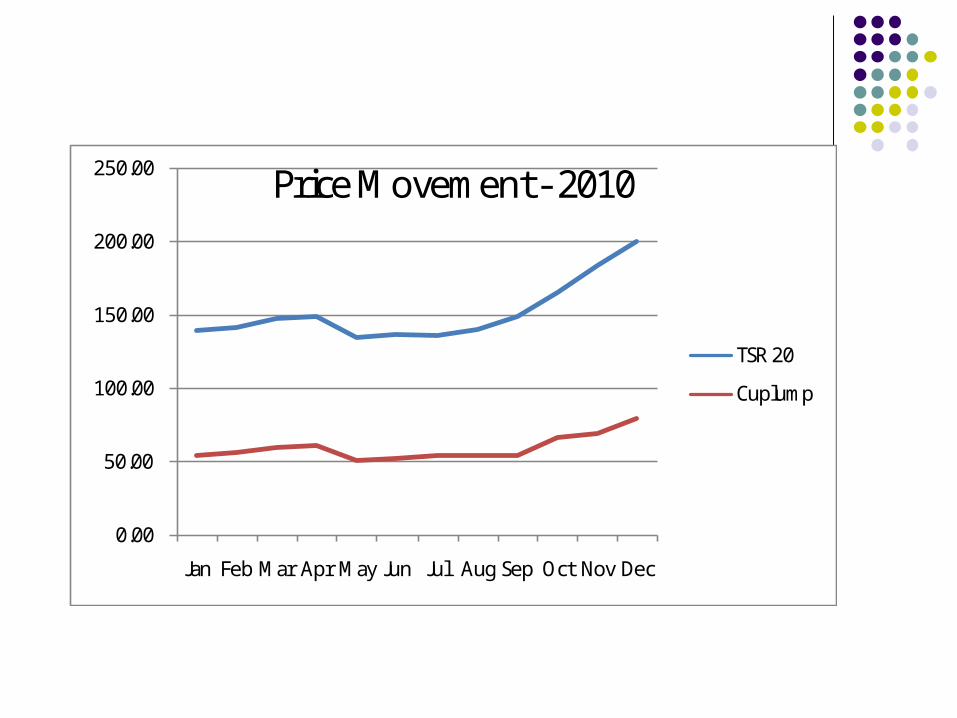
0.00
50.00
100.00
150.00
200.00
250.00
Jan Feb Mar Apr May Jun Jul Aug Sep Oct Nov Dec
Price Movement - 2010
TSR 20
Cuplump
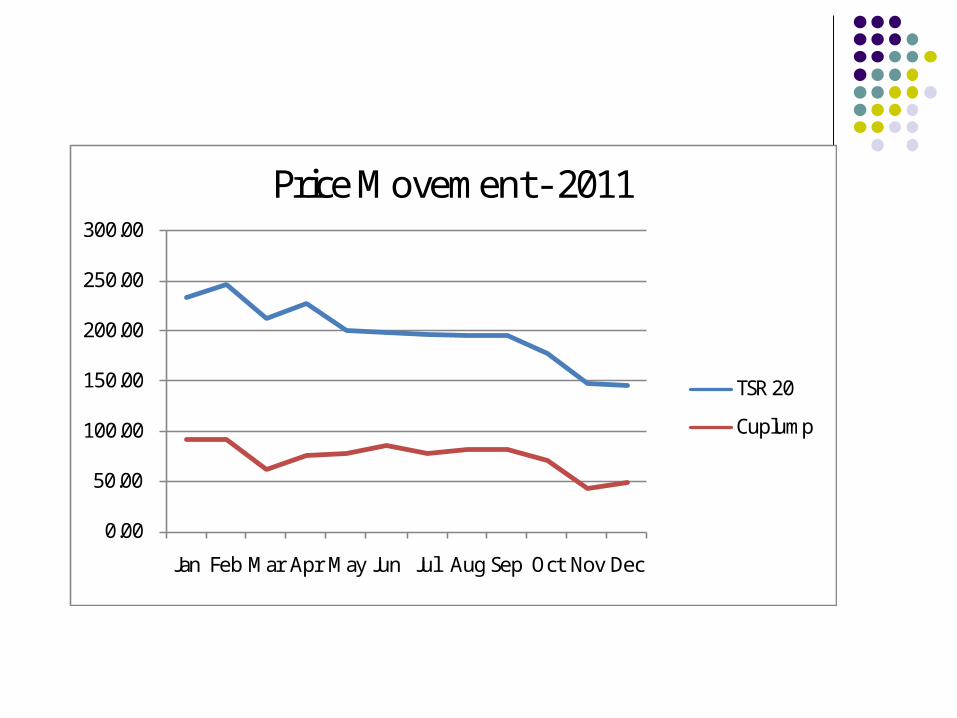
0.00
50.00
100.00
150.00
200.00
250.00
300.00
Jan Feb Mar Apr May Jun Jul Aug Sep Oct Nov Dec
Price Movement - 2011
TSR 20
Cuplump
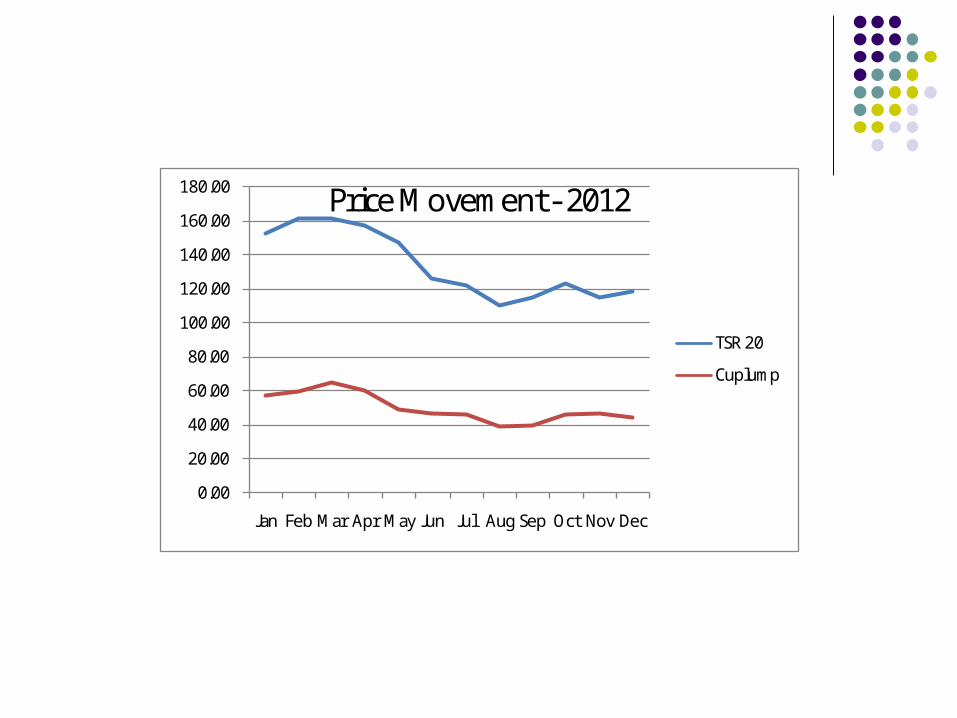
0.00
20.00
40.00
60.00
80.00
100.00
120.00
140.00
160.00
180.00
Jan Feb Mar Apr May Jun Jul Aug Sep Oct Nov Dec
Price Movement - 2012
TSR 20
Cuplump
0.00
20.00
40.00
60.00
80.00
100.00
120.00
140.00
Jan Feb Mar Apr May Jun Jul Aug Sep Oct Nov Dec
Price Movement - 2013
TSR 20
Cuplump
0.00
20.00
40.00
60.00
80.00
100.00
120.00
Jan Feb Mar Apr
Price Movement - 2014
TSR 20
Cuplump
World Natural Rubber Industry
World Natural Rubber Industry
World Natural Rubber Industry
World Natural Rubber Industry
World Natural Rubber Industry
DTI INITIATIVES DTI regional and provincial offices in nine
(9) regions implemented its Rubber Industry Cluster Initiatives (2013-2016) in coordination with partner agencies and institutions Rubber Quality Improvement Advocacy Productivity improvement for rubber producers,
processors and rubber coops through the SSF Program
Initiated the organization of National Rubber Inter-Agency Technical Working Group (NRIAT) and was renamed as the Philippine Rubber Technical Working Group or PHLRUBBER
DTI INITIATIVES
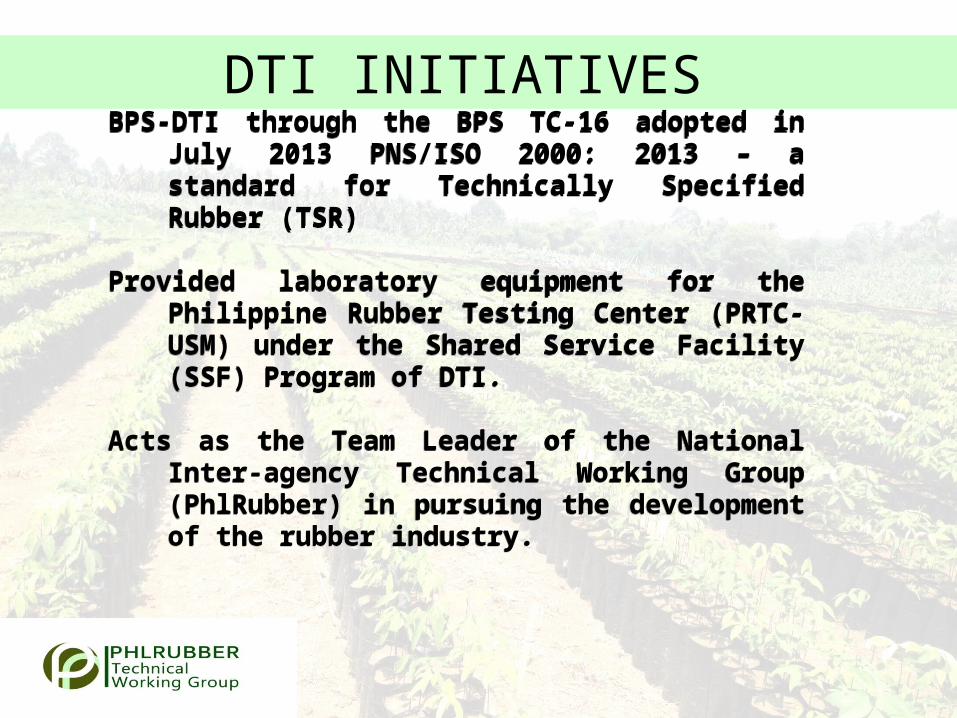
BPS-DTI through the BPS TC-16 adopted in July 2013 PNS/ISO 2000: 2013 – a standard for Technically Specified Rubber (TSR)
Provided laboratory equipment for the Philippine Rubber Testing Center (PRTC-USM) under the Shared Service Facility (SSF) Program of DTI.
Acts as the Team Leader of the National Inter-agency Technical Working Group (PhlRubber) in pursuing the development of the rubber industry.
Thank You!!Thank You!!Thank You!!Thank You!!