Embed Size (px)
Citation preview
1 | T e a c h e r ’ s G u i d e – R e n e w a b l e E n e r g y
NATURE WORKS – TO MAKE CLEAN ENERGY Subject Area: Science - Energy Grades: 6th – 8th Time: This lesson is designed to be completed in three 45-minute sessions. Essential Questions:
• Why are renewable energy sources being explored? • What are the possible benefits and drawbacks of using renewable energy? • How does location influence renewable energy options?
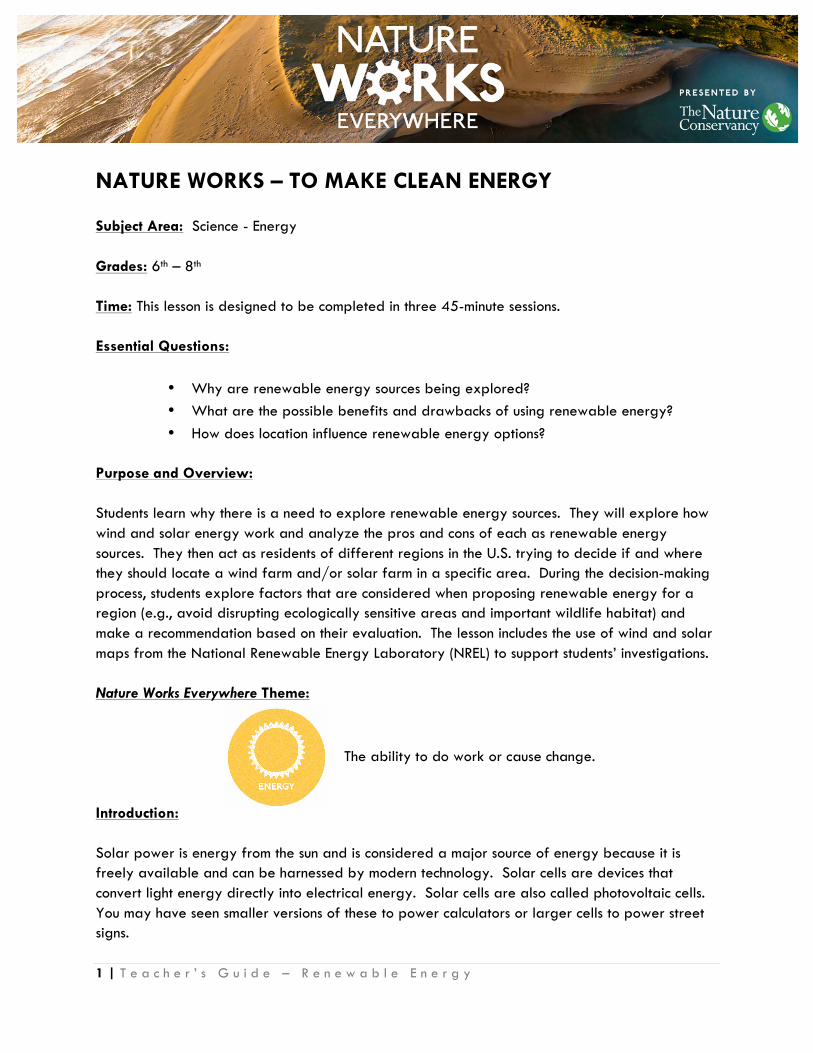
Purpose and Overview: Students learn why there is a need to explore renewable energy sources. They will explore how wind and solar energy work and analyze the pros and cons of each as renewable energy sources. They then act as residents of different regions in the U.S. trying to decide if and where they should locate a wind farm and/or solar farm in a specific area. During the decision-making process, students explore factors that are considered when proposing renewable energy for a region (e.g., avoid disrupting ecologically sensitive areas and important wildlife habitat) and make a recommendation based on their evaluation. The lesson includes the use of wind and solar maps from the National Renewable Energy Laboratory (NREL) to support students’ investigations. Nature Works Everywhere Theme: Introduction: Solar power is energy from the sun and is considered a major source of energy because it is freely available and can be harnessed by modern technology. Solar cells are devices that convert light energy directly into electrical energy. Solar cells are also called photovoltaic cells. You may have seen smaller versions of these to power calculators or larger cells to power street signs.
The ability to do work or cause change.
2 | T e a c h e r ’ s G u i d e – R e n e w a b l e E n e r g y
Wind is caused by convection currents in Earth's atmosphere. These currents are driven by heat energy from the Sun. Wind has huge amounts of kinetic energy that can be transferred into electrical energy using wind turbines. The wind turns the blades, which spin a shaft, which connects to a generator and makes electricity. Solar and wind power are considered renewable energy sources. They both can quickly replenish themselves and are usually available in a never-ending supply. Currently, the main energy source used by humans is nonrenewable and cannot be replenished in a short period of time, such as fossil fuels, coal and natural gas. Land requirements for different energy sources vary. Several factors need to be considered when recommending a renewable energy facility for a region. Wildlife and habitat conservation, transmission line length and placement, land use and access to the site for maintenance in addition to available natural resources. Objectives:
• Determine how they use different energy sources like the sun and wind. • Define and distinguish between renewable and nonrenewable energy sources. • Identify the benefits and drawbacks to solar and wind energy. • Determine the best location to site a solar energy facility. • Determine the best location to site a wind energy facility. • Use evidence from NREL maps to justify their choice in locating their facilities. • Construct a written summary of the role of wind and solar energy as renewable resources,
the costs and benefits of these resources, and the factors that should be considered when selecting locations for these facilities.
Standards: Next Generation Science Standards Disciplinary Core Ideas • ESS3.C Human Impacts on Earth Systems • ETS1.A Defining and Delimiting Engineering Problems • ETS1.B Developing Possible Solutions Crosscutting Concepts • Energy • Systems • Scale Science and Engineering Practices • Asking questions/defining problems • Arguing from evidence • Analyzing data
3 | T e a c h e r ’ s G u i d e – R e n e w a b l e E n e r g y
• Constructing explanations/designing solutions • Communicating information Performance Expectation Middle School • MS-ES3-3 Apply scientific principles to design a method for monitoring and minimizing a human
impact on the environment. • MS-ETS1-1 Define the criteria and constraints of a design problem with sufficient precision to
ensure a successful solution, taking into account relevant scientific principles and potential impacts on people and the natural environment that may limit possible solutions.
• MS-ETS1-2 Evaluate competing design solutions using a systematic process to determine how well they meet the criteria and constraints of the problem.
Common Core English and Language Arts Standards for Science and Technical Subjects and Writing Grades 6-8 • CCSS.ELA-LITERACY.RST.6-8.4 Determine the meaning of symbols, key terms, and other domain-
specific words and phrases as they are used in a specific scientific or technical context relevant to grades 6-8 texts and topics.
• CCSS.ELA-LITERACY.RST.6-8.7 Integrate quantitative or technical information expressed in words in a text with a version of that information expressed visually (e.g., in a flowchart, diagram, model, graph, or table).
• CCSS.ELA-LITERACY.WHST.6-8.1 Write arguments focused on discipline-specific content. • CCSS.ELA-LITERACY.WHST.6-8.1.B Support claim(s) with logical reasoning and relevant, accurate
data and evidence that demonstrate an understanding of the topic or text, using credible sources. • CCSS.ELA-LITERACY.WHST.6-8.6 Use technology, including the Internet, to produce and publish
writing and present the relationships between information and ideas clearly and efficiently. Vocabulary:
Nonrenewable energy: Energy generated from natural resources. These sources are considered nonrenewable because they cannot be replenished (made again) in a short period of time
Renewable energy: Energy generated from natural resources. These sources are considered
renewable because they quickly replenish themselves and are usually available in a never-ending supply
Solar power: The conversion of sunlight into electricity. Wind power: The conversion of wind energy into electrical power. Whirring: Makes a low, continuous, regular sound.
4 | T e a c h e r ’ s G u i d e – R e n e w a b l e E n e r g y
Materials:
Nature Works Everywhere videos that support this lesson plan: • Nature Works - To Make Clean Energy introductory video https://vimeo.com/77792708 • Meet the Scientist: Sophie Parker https://vimeo.com/77788834 • Scientist Interview Questions
o Energy #1: Renewable Resources - “Why are renewable resources being explored?” https://vimeo.com/78369158
o Energy #2: Benefits and Drawbacks - “What are the possible benefits and drawbacks of using renewable energy?” https://vimeo.com/78369159
o Energy #3: Location - “How does a location influence renewable energy options?” https://vimeo.com/78369160
o Energy #4: Factors - “What factors need to be considered when recommending a renewable energy facility for a region?” https://vimeo.com/78369161
Other videos in this lesson plan: • Energy 101: Solar PV http://energy.gov/energysaver/articles/small-solar-electric-
systems • Energy 101: Wind Turbines http://energy.gov/energysaver/articles/small-wind-electric-
systems For each student (handouts located at the end of this lesson plan): • Notebook paper/journal • 2 copies of Frayer Model • 1 copy of the Compare and Contrast Chart • 1 copy of the Agree/Disagree Chart For each student OR for groups of students (handouts located at the end of this lesson plan): • 1 copy of the Solar Map http://www.nrel.gov/gis/solar.html • 1 copy of the Wind Map http://www.nrel.gov/gis/wind.html • 1 copy of each of the following location guide:
o Ridgecrest, CA o Joshua Tree National Park o Las Vegas, NV o Amarillo, TX
Classroom Activities: Part 1: Engage
1. Ask students, “What are ways that you use the energy of the sun and wind?” Some anticipated responses may include flying kites, drying clothes, sailing a boat, and growing food. Share the Nature Works – To Make Clean Energy introductory video.
5 | T e a c h e r ’ s G u i d e – R e n e w a b l e E n e r g y
2. Provide students with images of the following: coal, oil, natural gas, wind, sun, and water.
Ask students to sort them into two categories and write down the criteria of how they made their two categories. You can also share the images on slide 5 and give students the same directions.
3. Provide students with the definition for renewable energy.
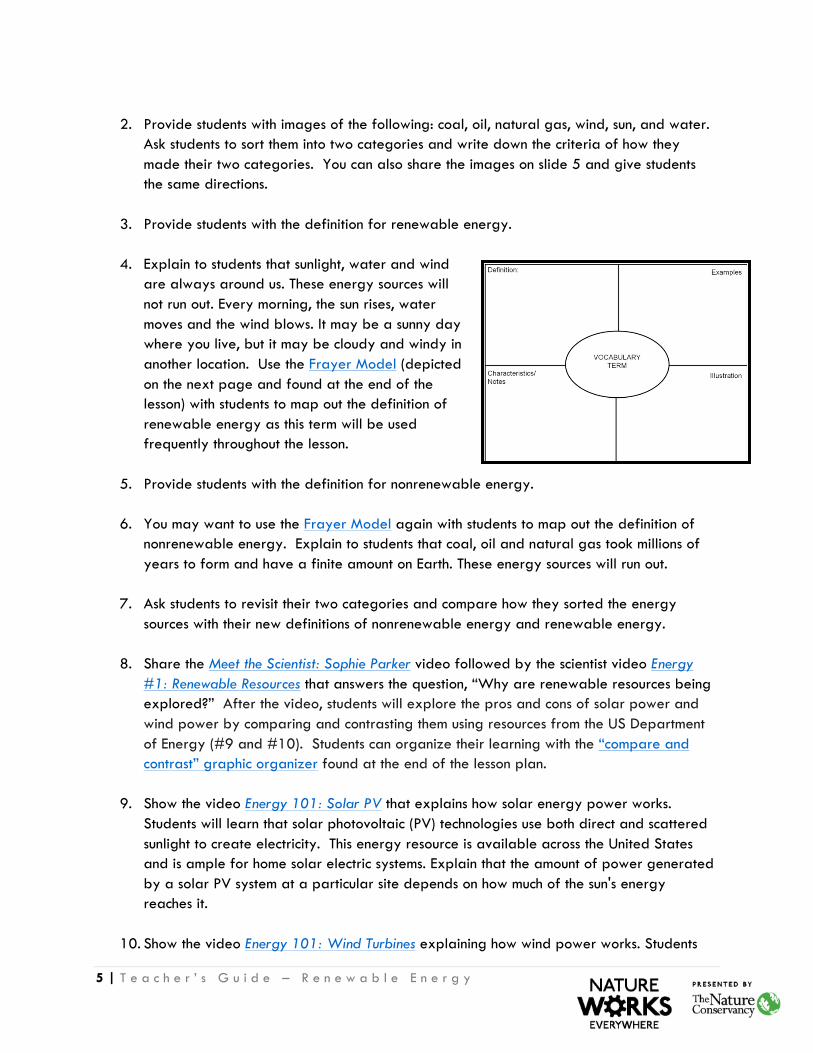
4. Explain to students that sunlight, water and wind
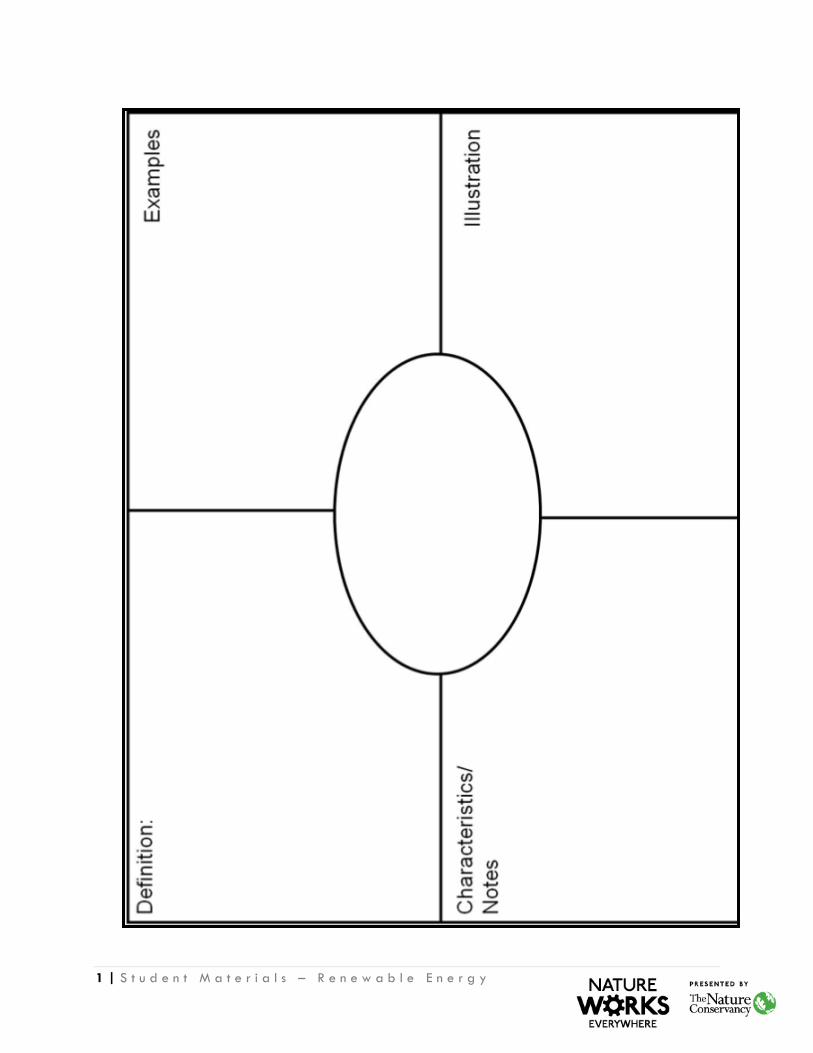
are always around us. These energy sources will not run out. Every morning, the sun rises, water moves and the wind blows. It may be a sunny day where you live, but it may be cloudy and windy in another location. Use the Frayer Model (depicted on the next page and found at the end of the lesson) with students to map out the definition of renewable energy as this term will be used frequently throughout the lesson.
5. Provide students with the definition for nonrenewable energy.
6. You may want to use the Frayer Model again with students to map out the definition of
nonrenewable energy. Explain to students that coal, oil and natural gas took millions of years to form and have a finite amount on Earth. These energy sources will run out.
7. Ask students to revisit their two categories and compare how they sorted the energy
sources with their new definitions of nonrenewable energy and renewable energy.
8. Share the Meet the Scientist: Sophie Parker video followed by the scientist video Energy #1: Renewable Resources that answers the question, “Why are renewable resources being explored?” After the video, students will explore the pros and cons of solar power and wind power by comparing and contrasting them using resources from the US Department of Energy (#9 and #10). Students can organize their learning with the “compare and contrast” graphic organizer found at the end of the lesson plan.
9. Show the video Energy 101: Solar PV that explains how solar energy power works.
Students will learn that solar photovoltaic (PV) technologies use both direct and scattered sunlight to create electricity. This energy resource is available across the United States and is ample for home solar electric systems. Explain that the amount of power generated by a solar PV system at a particular site depends on how much of the sun's energy reaches it.
10. Show the video Energy 101: Wind Turbines explaining how wind power works. Students
6 | T e a c h e r ’ s G u i d e – R e n e w a b l e E n e r g y
will learn that if there are enough wind resources in an area and the situation is right, small wind electric systems are one of the most cost-effective home-based renewable energy systems -- with zero emissions and pollution.
11. One Minute Buzz - Make the following suggestion to students: ‘For one minute, discuss with
your partner the subject of today’s lesson and your key learning’. Ask students to be prepared to share this with the class.
12. Optional: Small-scale models can be purchased or constructed to model each energy type. Recommendations for build examples can be found below.
a. Wind power: § http://www.kidwind.org/ § http://www.pbs.org/now/classroom/wind.html
b. Solar power: § http://www.nrel.gov/education/pdfs/educational_resources/high_school/s
olar_projects_hs.pdf § http://designcoalition.org/kids/energyhouse/pdfs/experiments.pdf § http://www.energyquest.ca.gov/projects/solardogs.html
Part 2: Explore
1. Explain to students that there are benefits and drawbacks to each type of power source. Review each by sharing the definition for Solar Power and Wind Power.
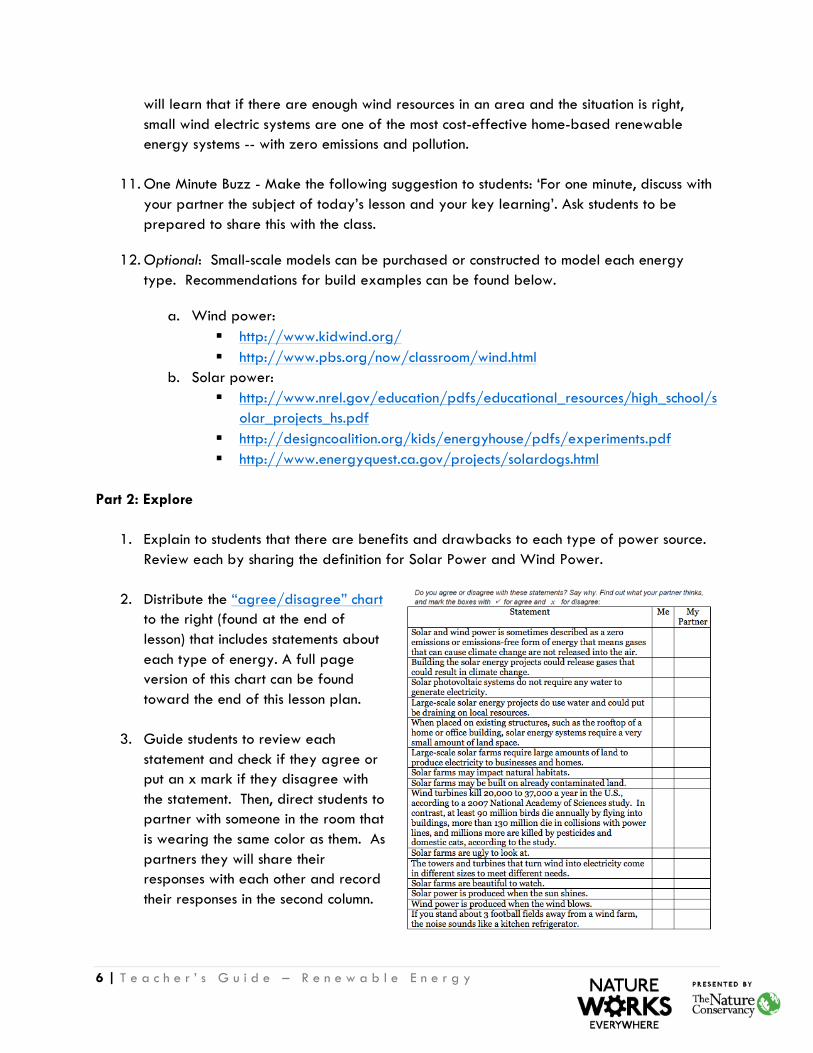
2. Distribute the “agree/disagree” chart to the right (found at the end of lesson) that includes statements about each type of energy. A full page version of this chart can be found toward the end of this lesson plan.
3. Guide students to review each
statement and check if they agree or put an x mark if they disagree with the statement. Then, direct students to partner with someone in the room that is wearing the same color as them. As partners they will share their responses with each other and record their responses in the second column.
7 | T e a c h e r ’ s G u i d e – R e n e w a b l e E n e r g y
4. Share the scientist video Energy #2: Benefits and Drawbacks that answers the question, “What are the possible benefits and drawbacks of using renewable energy?”
5. Summarize with students by asking them to review the statements and reflect on any they
changed their opinion on after discussing with their partner or viewing the scientist video. Part 3: Explain
1. Display the wind and solar maps and ask students to consider if location would influence the location of solar and wind farms.
2. Share the scientist video Energy #3: Location that answers the question, “How does a location influence renewable energy options?”
3. You can group students or have them work independently for this part of the lesson.
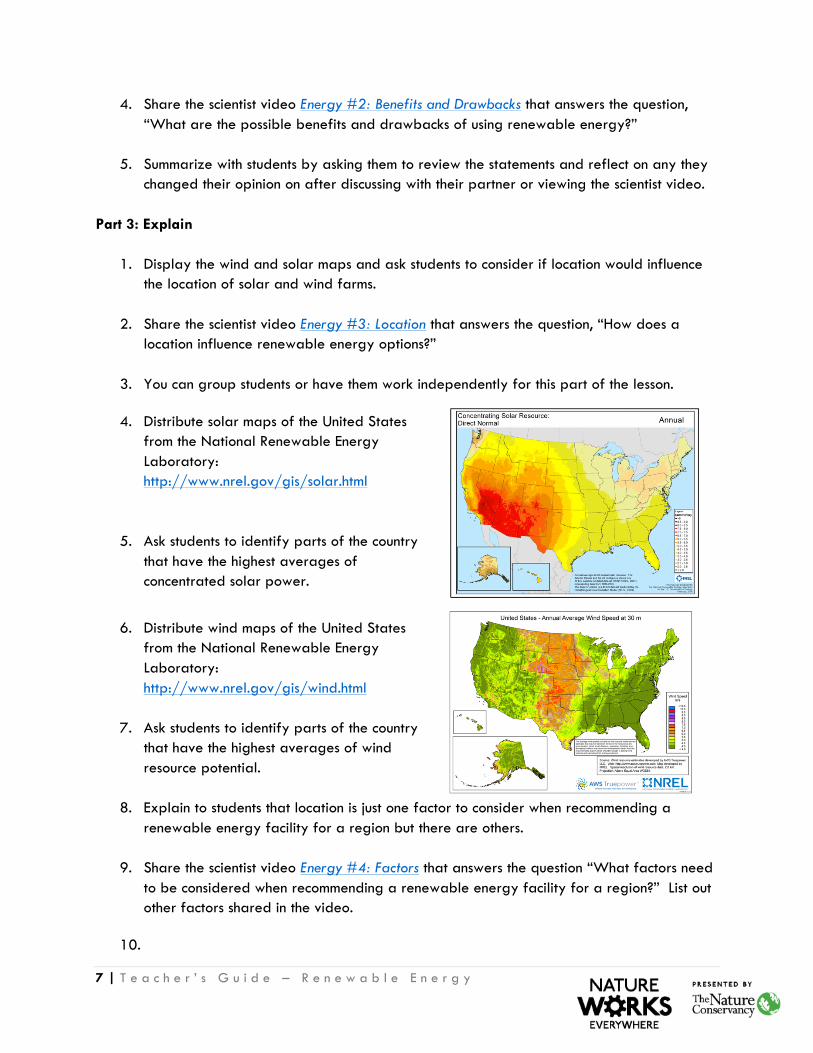
4. Distribute solar maps of the United States
from the National Renewable Energy Laboratory: http://www.nrel.gov/gis/solar.html
5. Ask students to identify parts of the country
that have the highest averages of concentrated solar power.
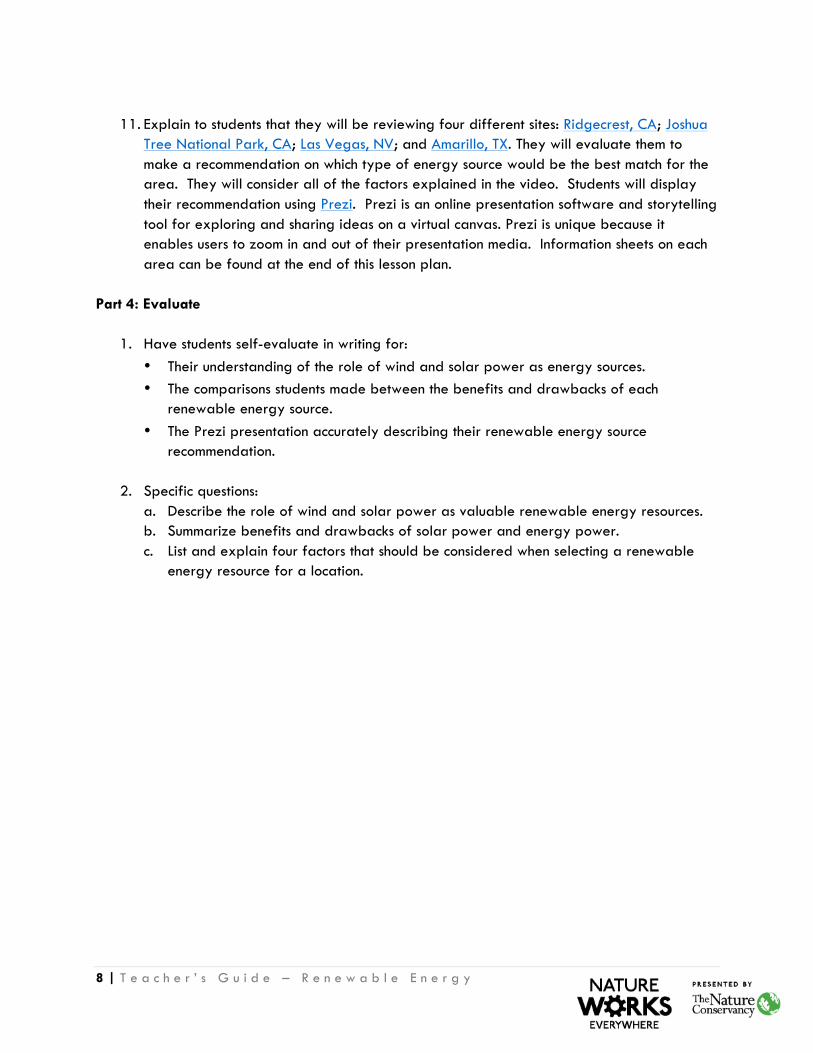
6. Distribute wind maps of the United States
from the National Renewable Energy Laboratory: http://www.nrel.gov/gis/wind.html
7. Ask students to identify parts of the country
that have the highest averages of wind resource potential.
8. Explain to students that location is just one factor to consider when recommending a renewable energy facility for a region but there are others.
9. Share the scientist video Energy #4: Factors that answers the question “What factors need
to be considered when recommending a renewable energy facility for a region?” List out other factors shared in the video.
10.
8 | T e a c h e r ’ s G u i d e – R e n e w a b l e E n e r g y
11. Explain to students that they will be reviewing four different sites: Ridgecrest, CA; Joshua
Tree National Park, CA; Las Vegas, NV; and Amarillo, TX. They will evaluate them to make a recommendation on which type of energy source would be the best match for the area. They will consider all of the factors explained in the video. Students will display their recommendation using Prezi. Prezi is an online presentation software and storytelling tool for exploring and sharing ideas on a virtual canvas. Prezi is unique because it enables users to zoom in and out of their presentation media. Information sheets on each area can be found at the end of this lesson plan.
Part 4: Evaluate
1. Have students self-evaluate in writing for: • Their understanding of the role of wind and solar power as energy sources. • The comparisons students made between the benefits and drawbacks of each
renewable energy source. • The Prezi presentation accurately describing their renewable energy source
recommendation.
2. Specific questions: a. Describe the role of wind and solar power as valuable renewable energy resources. b. Summarize benefits and drawbacks of solar power and energy power. c. List and explain four factors that should be considered when selecting a renewable
energy resource for a location.
9 | T e a c h e r ’ s G u i d e – R e n e w a b l e E n e r g y
Additional Resources and Further Reading: • There’s Room for Both Wind and Wildlife
http://blog.nature.org/conservancy/2012/07/26/wind-energy-wildlife-joe-fargione/ Blog post that discusses balancing wildlife habit conservation and wind energy.
• A Win-Win for Wind and Wildlife
http://www.nature.org/ourinitiatives/urgentissues/conservationlands/conservation-lands-win-win-for-wind-and-wildlife.xml The graphic reveals the wind energy capabilities of various U.S. states (Indiana, Wyoming, Colorado, Texas, etc.) as well as information on how to avoid harming wildlife (like the peregrine falcon in Indiana, the sage grouse in Colorado or the trumpeter swan of Minnesota) when siting wind farms.
• Solar Energy
http://www.epa.gov/region1/eco/energy/re_solar.html Includes additional graphics to explain solar energy as a natural resource.
• Prezi
http://prezi.com/ Prezi is a presentation tool that helps you organize and share your ideas.
1 | S t u d e n t M a t e r i a l s – R e n e w a b l e E n e r g y
2 | S t u d e n t M a t e r i a l s – R e n e w a b l e E n e r g y
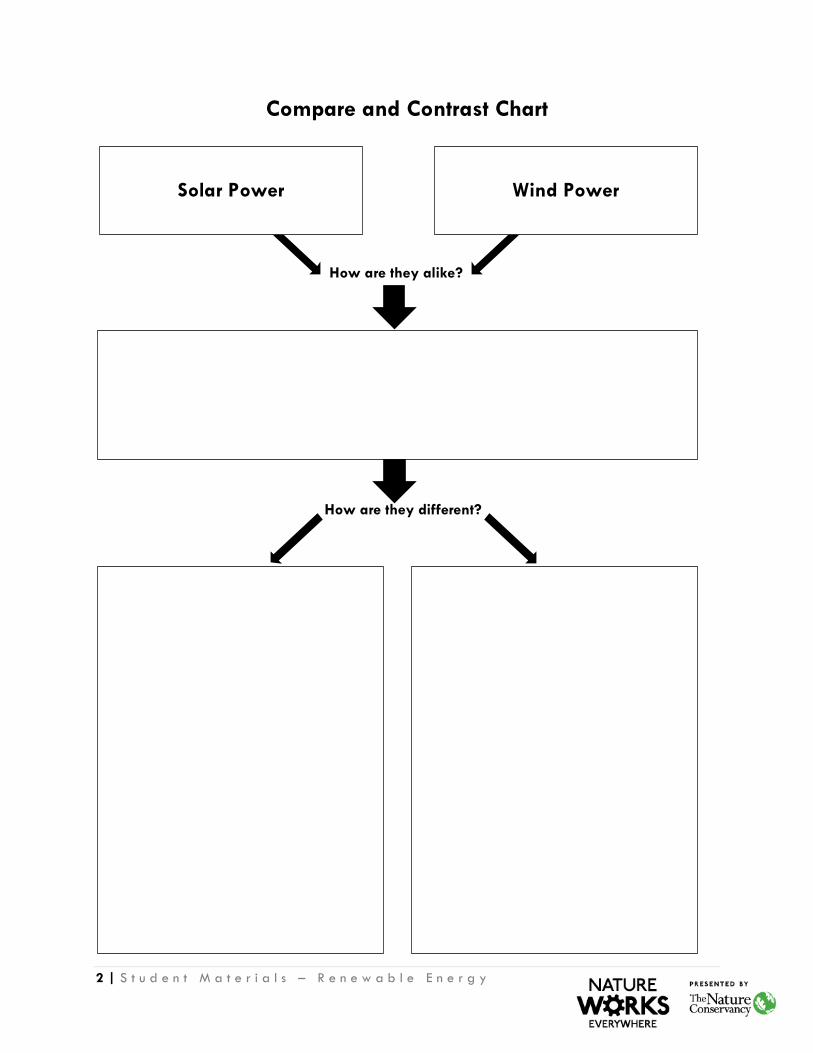
Compare and Contrast Chart
How are they alike?
How are they different?
Solar Power Wind Power
3 | S t u d e n t M a t e r i a l s – R e n e w a b l e E n e r g y
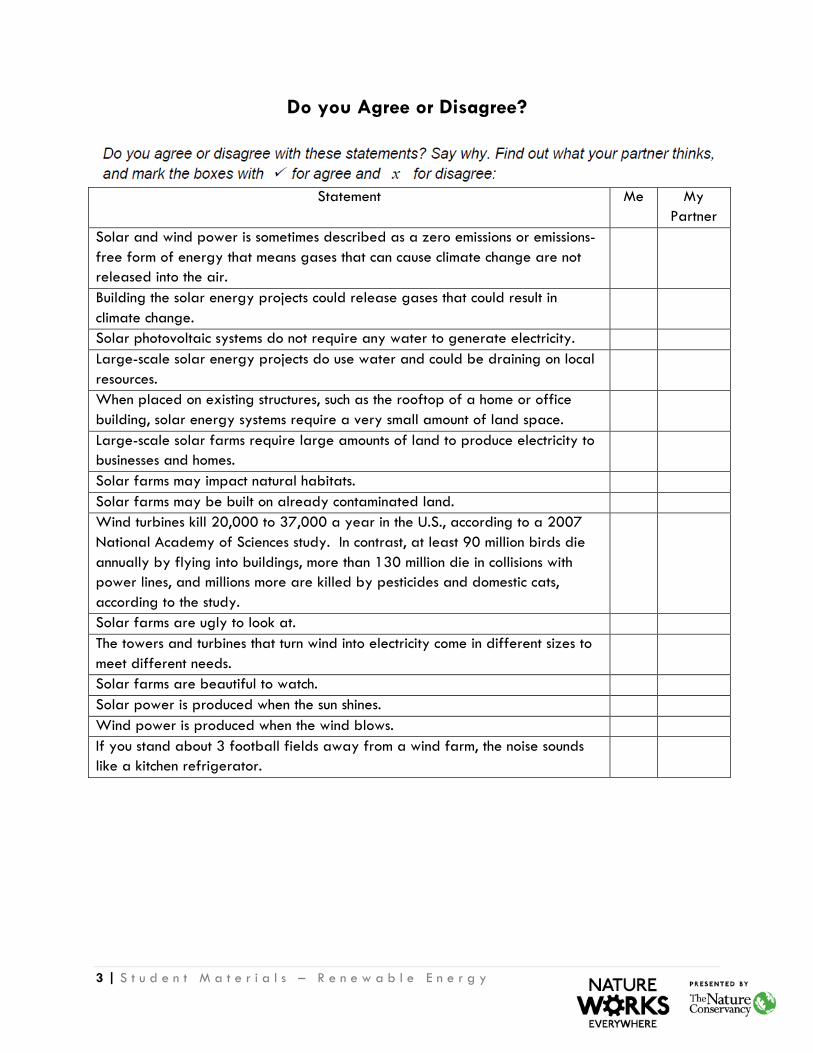
Do you Agree or Disagree?
Statement Me My
Partner Solar and wind power is sometimes described as a zero emissions or emissions-free form of energy that means gases that can cause climate change are not released into the air.
Building the solar energy projects could release gases that could result in climate change.
Solar photovoltaic systems do not require any water to generate electricity. Large-scale solar energy projects do use water and could be draining on local resources.
When placed on existing structures, such as the rooftop of a home or office building, solar energy systems require a very small amount of land space.
Large-scale solar farms require large amounts of land to produce electricity to businesses and homes.
Solar farms may impact natural habitats. Solar farms may be built on already contaminated land. Wind turbines kill 20,000 to 37,000 a year in the U.S., according to a 2007 National Academy of Sciences study. In contrast, at least 90 million birds die annually by flying into buildings, more than 130 million die in collisions with power lines, and millions more are killed by pesticides and domestic cats, according to the study.
Solar farms are ugly to look at. The towers and turbines that turn wind into electricity come in different sizes to meet different needs.
Solar farms are beautiful to watch. Solar power is produced when the sun shines. Wind power is produced when the wind blows. If you stand about 3 football fields away from a wind farm, the noise sounds like a kitchen refrigerator.
1 | S t u d e n t M a t e r i a l s : L o c a t i o n s – R e n e w a b l e E n e r g y
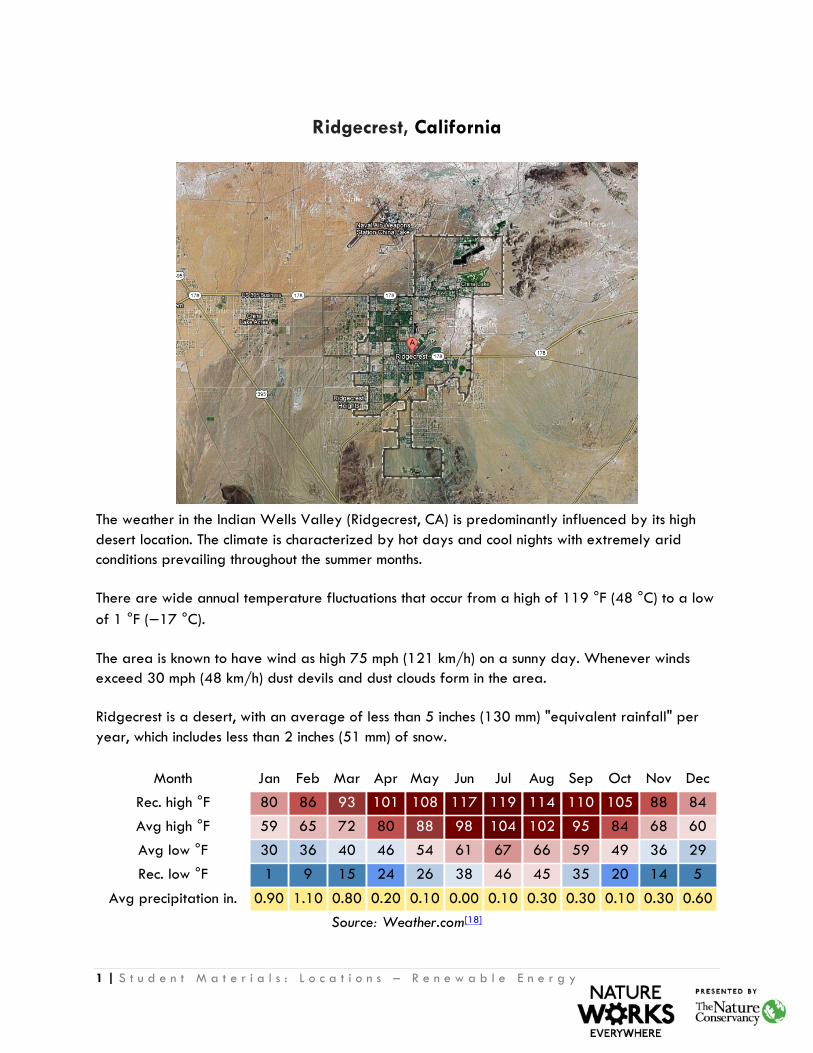
Ridgecrest, California
The weather in the Indian Wells Valley (Ridgecrest, CA) is predominantly influenced by its high desert location. The climate is characterized by hot days and cool nights with extremely arid conditions prevailing throughout the summer months.
There are wide annual temperature fluctuations that occur from a high of 119 °F (48 °C) to a low of 1 °F (−17 °C).
The area is known to have wind as high 75 mph (121 km/h) on a sunny day. Whenever winds exceed 30 mph (48 km/h) dust devils and dust clouds form in the area.
Ridgecrest is a desert, with an average of less than 5 inches (130 mm) "equivalent rainfall" per year, which includes less than 2 inches (51 mm) of snow.
Month Jan Feb Mar Apr May Jun Jul Aug Sep Oct Nov Dec
Rec. high °F 80 86 93 101 108 117 119 114 110 105 88 84
Avg high °F 59 65 72 80 88 98 104 102 95 84 68 60
Avg low °F 30 36 40 46 54 61 67 66 59 49 36 29
Rec. low °F 1 9 15 24 26 38 46 45 35 20 14 5
Avg precipitation in. 0.90 1.10 0.80 0.20 0.10 0.00 0.10 0.30 0.30 0.10 0.30 0.60
Source: Weather.com[18]
2 | S t u d e n t M a t e r i a l s : L o c a t i o n s – R e n e w a b l e E n e r g y
The nearby Death Valley's great range of elevations and habitats support a variety of wildlife species, including 51 species of native mammals, 307 species of birds, 36 species of reptiles, three species of amphibians, and five species and one subspecies of native fishes. Small mammals are more numerous than large mammals, such as desert bighorn, coyote, bobcat, mountain lion, and mule deer. Mule deer are present in the pinyon/juniper associations of the Grapevine, Cottonwood, and Panamint Mountains. More information: http://www.nps.gov/deva/naturescience/animals.htm
3 | S t u d e n t M a t e r i a l s : L o c a t i o n s – R e n e w a b l e E n e r g y
Joshua Tree National Park
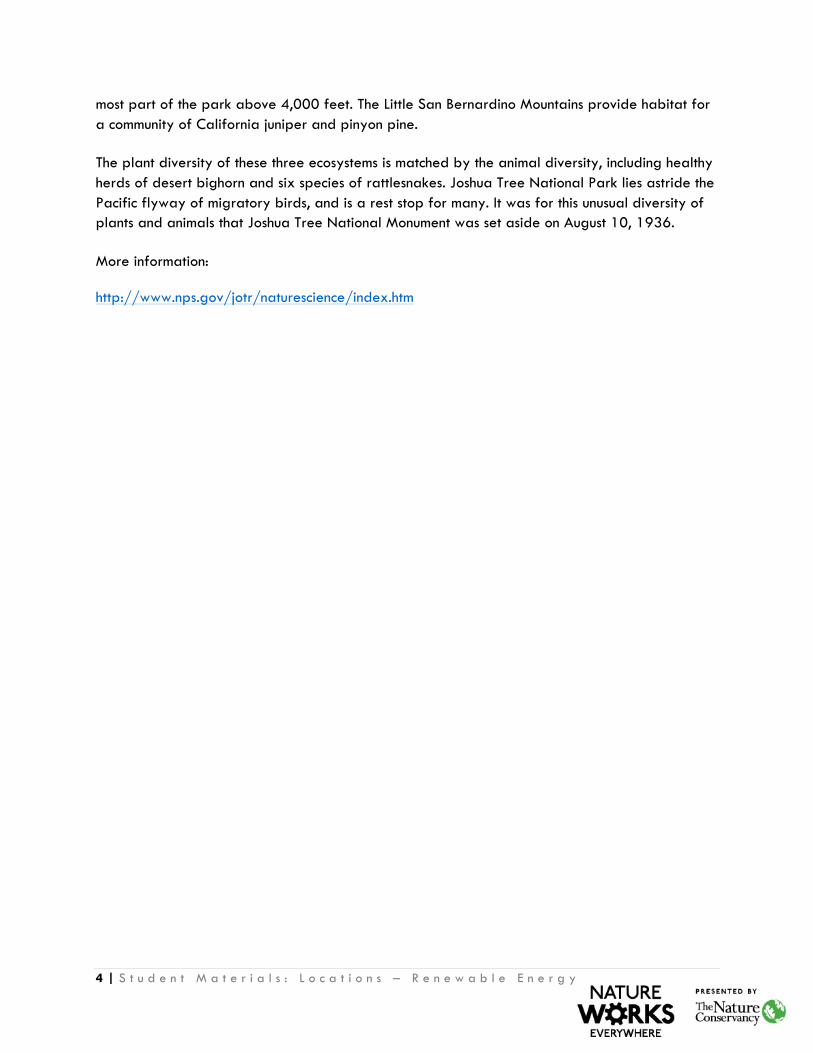
Located in the Mojave Desert of Southern California, the city has experienced some high temperatures. On July 17, 2005, the temperature reached a record 119 °F (48 °C). The record low temperature was 9 °F (−13 °C), established on December 23, 1990. The city is in a desert and mountain area. It has an average elevation of 1,991 feet (607 m).
The southern boundary of the Mojave Desert reaches across the northern part of the park. It is the habitat of the park’s namesake: the Joshua tree. Extensive stands of this peculiar looking plant are found in the western half of the park. Joshua Tree’s third ecosystem is located in the western
4 | S t u d e n t M a t e r i a l s : L o c a t i o n s – R e n e w a b l e E n e r g y
most part of the park above 4,000 feet. The Little San Bernardino Mountains provide habitat for a community of California juniper and pinyon pine.
The plant diversity of these three ecosystems is matched by the animal diversity, including healthy herds of desert bighorn and six species of rattlesnakes. Joshua Tree National Park lies astride the Pacific flyway of migratory birds, and is a rest stop for many. It was for this unusual diversity of plants and animals that Joshua Tree National Monument was set aside on August 10, 1936.
More information:
http://www.nps.gov/jotr/naturescience/index.htm
5 | S t u d e n t M a t e r i a l s : L o c a t i o n s – R e n e w a b l e E n e r g y
Las Vegas, Nevada
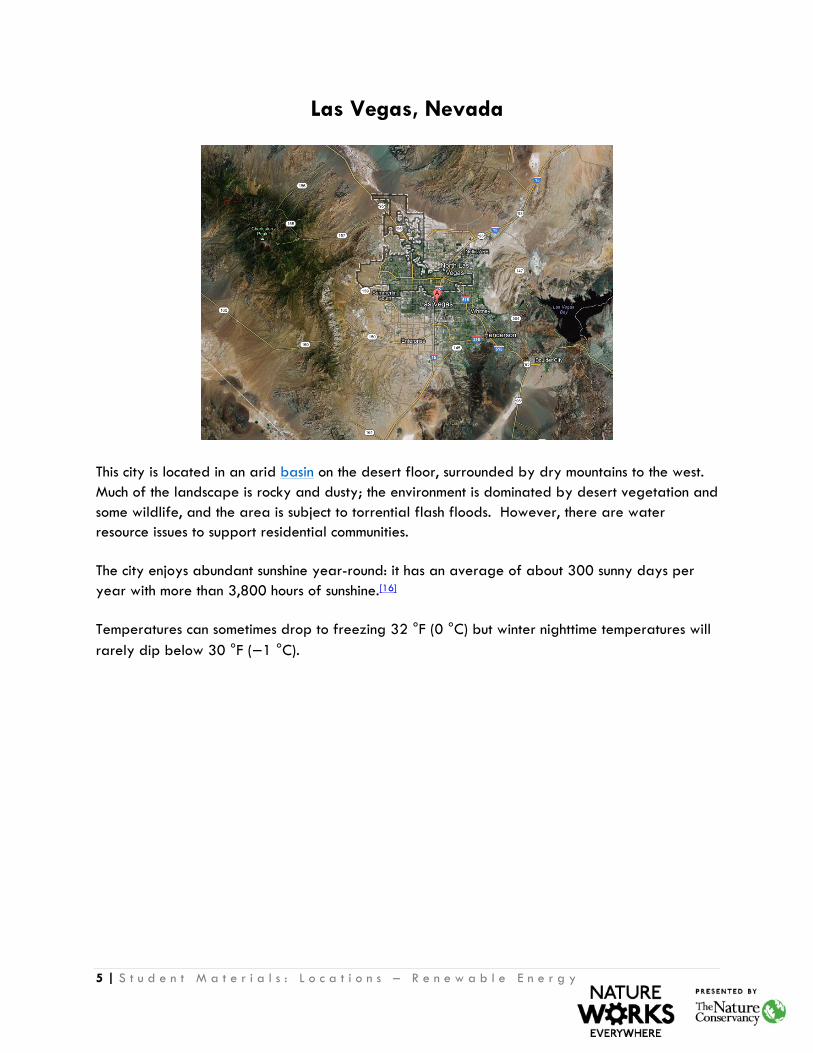
This city is located in an arid basin on the desert floor, surrounded by dry mountains to the west. Much of the landscape is rocky and dusty; the environment is dominated by desert vegetation and some wildlife, and the area is subject to torrential flash floods. However, there are water resource issues to support residential communities.
The city enjoys abundant sunshine year-round: it has an average of about 300 sunny days per year with more than 3,800 hours of sunshine.[16]
Temperatures can sometimes drop to freezing 32 °F (0 °C) but winter nighttime temperatures will rarely dip below 30 °F (−1 °C).
6 | S t u d e n t M a t e r i a l s : L o c a t i o n s – R e n e w a b l e E n e r g y
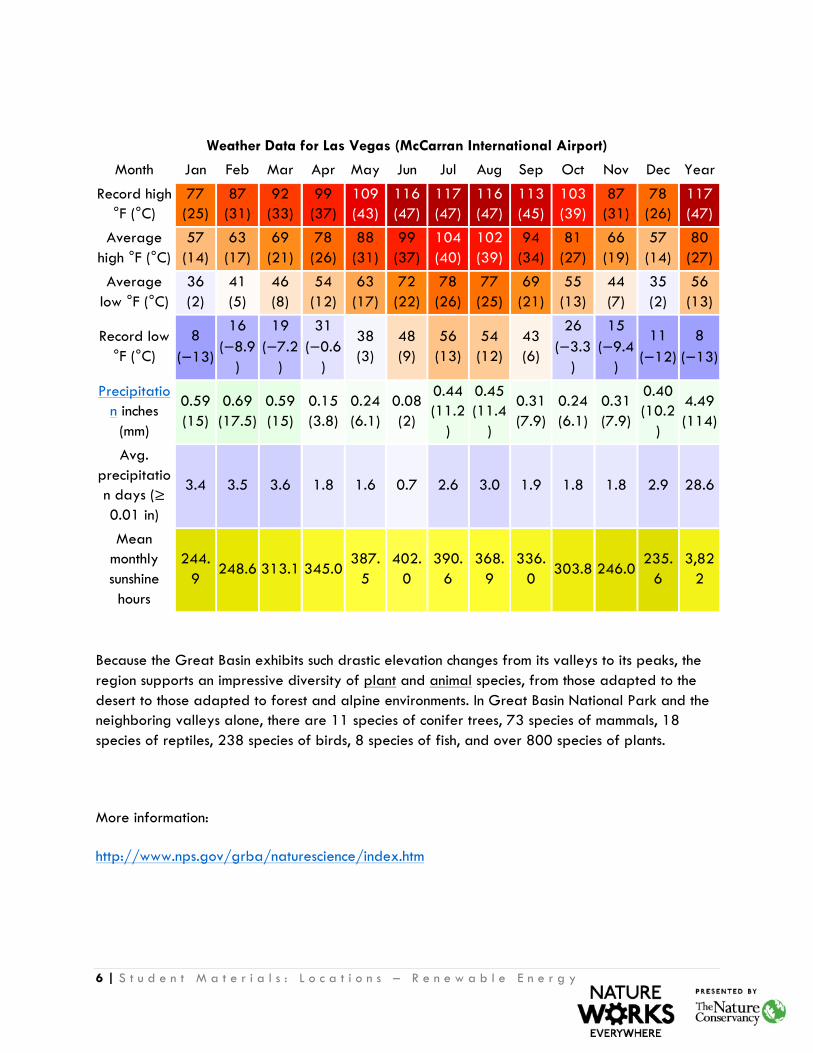
Weather Data for Las Vegas (McCarran International Airport)
Month Jan Feb Mar Apr May Jun Jul Aug Sep Oct Nov Dec Year
Record high °F (°C)
77 (25)
87 (31)
92 (33)
99 (37)
109 (43)
116 (47)
117 (47)
116 (47)
113 (45)
103 (39)
87 (31)
78 (26)
117 (47)
Average high °F (°C)
57 (14)
63 (17)
69 (21)
78 (26)
88 (31)
99 (37)
104 (40)
102 (39)
94 (34)
81 (27)
66 (19)
57 (14)
80 (27)
Average low °F (°C)
36 (2)
41 (5)
46 (8)
54 (12)
63 (17)
72 (22)
78 (26)
77 (25)
69 (21)
55 (13)
44 (7)
35 (2)
56 (13)
Record low °F (°C)
8 (−13)
16 (−8.9
)
19 (−7.2
)
31 (−0.6
)
38 (3)
48 (9)
56 (13)
54 (12)
43 (6)
26 (−3.3
)
15 (−9.4
)
11 (−12)
8 (−13)
Precipitation inches
(mm)
0.59 (15)
0.69 (17.5)
0.59 (15)
0.15 (3.8)
0.24 (6.1)
0.08 (2)
0.44 (11.2
)
0.45 (11.4
)
0.31 (7.9)
0.24 (6.1)
0.31 (7.9)
0.40 (10.2
)
4.49 (114)
Avg. precipitation days (≥ 0.01 in)
3.4 3.5 3.6 1.8 1.6 0.7 2.6 3.0 1.9 1.8 1.8 2.9 28.6
Mean monthly sunshine hours
244.9
248.6 313.1 345.0 387.
5 402.
0 390.
6 368.
9 336.
0 303.8 246.0
235.6
3,822
Because the Great Basin exhibits such drastic elevation changes from its valleys to its peaks, the region supports an impressive diversity of plant and animal species, from those adapted to the desert to those adapted to forest and alpine environments. In Great Basin National Park and the neighboring valleys alone, there are 11 species of conifer trees, 73 species of mammals, 18 species of reptiles, 238 species of birds, 8 species of fish, and over 800 species of plants.
More information:
http://www.nps.gov/grba/naturescience/index.htm
7 | S t u d e n t M a t e r i a l s : L o c a t i o n s – R e n e w a b l e E n e r g y
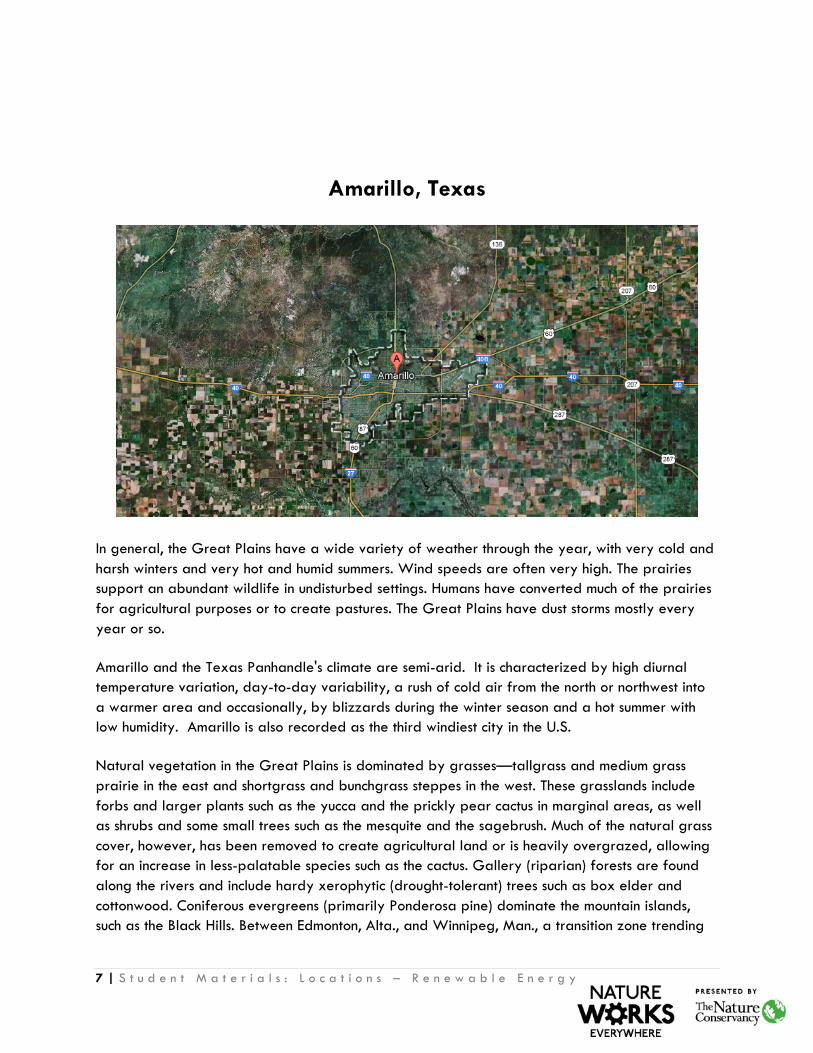
Amarillo, Texas
In general, the Great Plains have a wide variety of weather through the year, with very cold and harsh winters and very hot and humid summers. Wind speeds are often very high. The prairies support an abundant wildlife in undisturbed settings. Humans have converted much of the prairies for agricultural purposes or to create pastures. The Great Plains have dust storms mostly every year or so.
Amarillo and the Texas Panhandle's climate are semi-arid. It is characterized by high diurnal temperature variation, day-to-day variability, a rush of cold air from the north or northwest into a warmer area and occasionally, by blizzards during the winter season and a hot summer with low humidity. Amarillo is also recorded as the third windiest city in the U.S.
Natural vegetation in the Great Plains is dominated by grasses—tallgrass and medium grass prairie in the east and shortgrass and bunchgrass steppes in the west. These grasslands include forbs and larger plants such as the yucca and the prickly pear cactus in marginal areas, as well as shrubs and some small trees such as the mesquite and the sagebrush. Much of the natural grass cover, however, has been removed to create agricultural land or is heavily overgrazed, allowing for an increase in less-palatable species such as the cactus. Gallery (riparian) forests are found along the rivers and include hardy xerophytic (drought-tolerant) trees such as box elder and cottonwood. Coniferous evergreens (primarily Ponderosa pine) dominate the mountain islands, such as the Black Hills. Between Edmonton, Alta., and Winnipeg, Man., a transition zone trending
8 | S t u d e n t M a t e r i a l s : L o c a t i o n s – R e n e w a b l e E n e r g y
northwest-southeast and known as the “Parklands” is found, where the grasslands gradually give way to forest; and north of 54° N latitude coniferous forests dominate the vegetation.
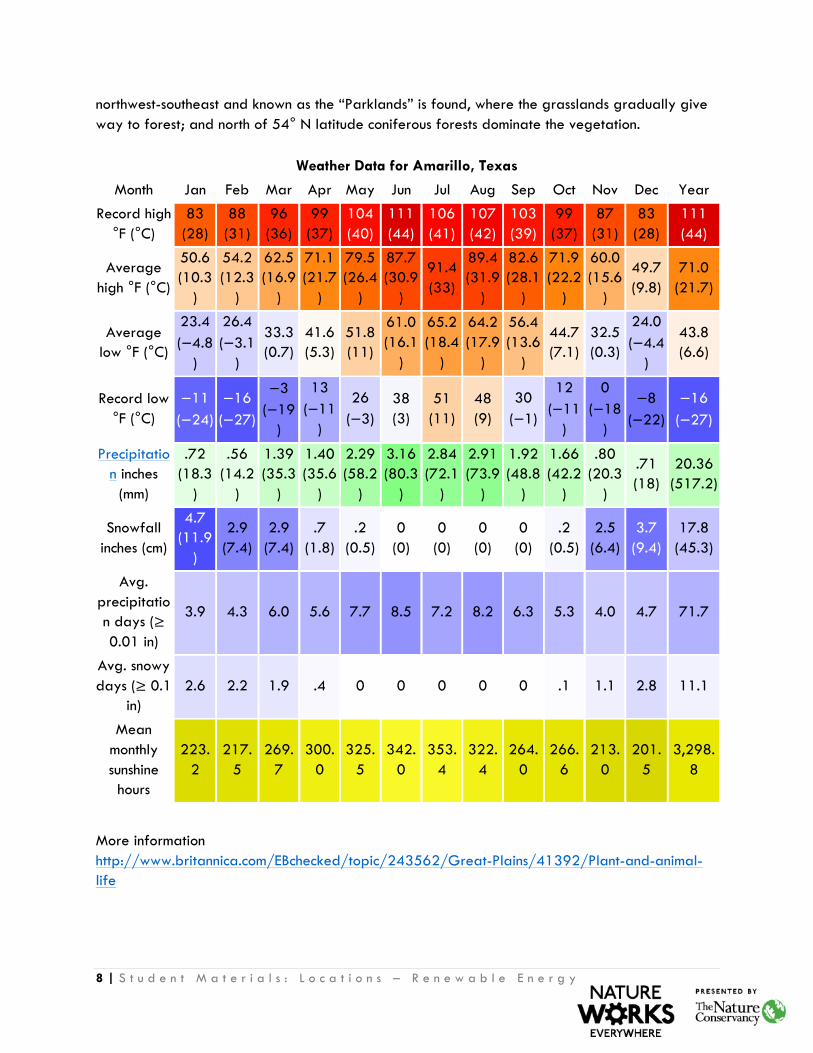
Weather Data for Amarillo, Texas
Month Jan Feb Mar Apr May Jun Jul Aug Sep Oct Nov Dec Year
Record high °F (°C)
83 (28)
88 (31)
96 (36)
99 (37)
104 (40)
111 (44)
106 (41)
107 (42)
103 (39)
99 (37)
87 (31)
83 (28)
111 (44)
Average high °F (°C)
50.6 (10.3
)
54.2 (12.3
)
62.5 (16.9
)
71.1 (21.7
)
79.5 (26.4
)
87.7 (30.9
)
91.4 (33)
89.4 (31.9
)
82.6 (28.1
)
71.9 (22.2
)
60.0 (15.6
)
49.7 (9.8)
71.0 (21.7)
Average low °F (°C)
23.4 (−4.8
)
26.4 (−3.1
)
33.3 (0.7)
41.6 (5.3)
51.8 (11)
61.0 (16.1
)
65.2 (18.4
)
64.2 (17.9
)
56.4 (13.6
)
44.7 (7.1)
32.5 (0.3)
24.0 (−4.4
)
43.8 (6.6)
Record low °F (°C)
−11 (−24)
−16 (−27)
−3 (−19
)
13 (−11
)
26 (−3)
38 (3)
51 (11)
48 (9)
30 (−1)
12 (−11
)
0 (−18
)
−8 (−22)
−16 (−27)
Precipitation inches
(mm)
.72 (18.3
)
.56 (14.2
)
1.39 (35.3
)
1.40 (35.6
)
2.29 (58.2
)
3.16 (80.3
)
2.84 (72.1
)
2.91 (73.9
)
1.92 (48.8
)
1.66 (42.2
)
.80 (20.3
)
.71 (18)
20.36 (517.2)
Snowfall inches (cm)
4.7 (11.9
)
2.9 (7.4)
2.9 (7.4)
.7 (1.8)
.2 (0.5)
0 (0)
0 (0)
0 (0)
0 (0)
.2 (0.5)
2.5 (6.4)
3.7 (9.4)
17.8 (45.3)
Avg. precipitation days (≥ 0.01 in)
3.9 4.3 6.0 5.6 7.7 8.5 7.2 8.2 6.3 5.3 4.0 4.7 71.7
Avg. snowy days (≥ 0.1
in) 2.6 2.2 1.9 .4 0 0 0 0 0 .1 1.1 2.8 11.1
Mean monthly sunshine hours
223.2
217.5
269.7
300.0
325.5
342.0
353.4
322.4
264.0
266.6
213.0
201.5
3,298.8
More information http://www.britannica.com/EBchecked/topic/243562/Great-Plains/41392/Plant-and-animal-life