Embed Size (px)
Citation preview
NAVAL
POSTGRADUATE
SCHOOL
MONTEREY, CALIFORNIA
THESIS
Approved for public release, distribution is unlimited.
CORRELATION OF READY FOR TASKING TO FULL MISSION CAPABLE METRICS FOR F/A-18E/F
by
Bradley A. Brooks
March 2013
Thesis Advisor: Lyn R. Whitaker Second Reader: Walt DeGrange

THIS PAGE INTENTIONALLY LEFT BLANK
i
REPORT DOCUMENTATION PAGE Form Approved OMB No. 0704-0188 Public reporting burden for this collection of information is estimated to average 1 hour per response, including the time for reviewing instruction, searching existing data sources, gathering and maintaining the data needed, and completing and reviewing the collection of information. Send comments regarding this burden estimate or any other aspect of this collection of information, including suggestions for reducing this burden, to Washington headquarters Services, Directorate for Information Operations and Reports, 1215 Jefferson Davis Highway, Suite 1204, Arlington, VA 22202-4302, and to the Office of Management and Budget, Paperwork Reduction Project (0704-0188) Washington DC 20503. 1. AGENCY USE ONLY (Leave blank)
2. REPORT DATE March 2013
3. REPORT TYPE AND DATES COVERED Master’s Thesis
4. TITLE AND SUBTITLE CORRELATION OF READY FOR TASKING TO FULL MISSION CAPABLE METRICS FOR F/A-18E/F
5. FUNDING NUMBERS
6. AUTHOR(S) Bradley A. Brooks 7. PERFORMING ORGANIZATION NAME(S) AND ADDRESS(ES)
Naval Postgraduate School Monterey, CA 93943-5000
8. PERFORMING ORGANIZATION REPORT NUMBER
9. SPONSORING /MONITORING AGENCY NAME(S) AND ADDRESS(ES) Naval Supply Systems Command Headquarters 5450 Carlisle Pike Mechanicsburg, PA 17055-0791
10. SPONSORING/MONITORING AGENCY REPORT NUMBER
11. SUPPLEMENTARY NOTES The views expressed in this thesis are those of the author and do not reflect the official policy or position of the Department of Defense or the U.S. Government.
12a. DISTRIBUTION / AVAILABILITY STATEMENT Approved for public release, distribution is unlimited.
12b. DISTRIBUTION CODE
Historically, the U.S. Navy has utilized Full Mission Capable (FMC) as the standard metric in assessing aviation readiness, but an alternative to FMC has been introduced by air wing commanders: Ready for Tasking (RFT). RFT is a less demanding standard for readiness that provides a better representation of mission success than FMC. Since FMC is used as an input to aviation repairable sparing models, before RFT can replace FMC in funding models it is necessary to analyze the linkage between RFT and FMC.
This thesis explores the relationship between RFT and FMC based on five years of data from the East Coast Carrier Air Wings flying F/A-18E/F Super Hornets. Linear and logistic regression models are developed to analyze the impacts 11 common variables have on RFT. It also examines readiness trends throughout the Fleet Response Training Plan.
14. SUBJECT TERMS RFT, Ready for Tasking, FMC, Full Mission Capable, F/A-18E/F, Super Hornet, naval aviation, data analysis, regression, logistic regression, multiple regression, readiness, exploratory analysis, FRTP, Fleet Response Training Plan
15. NUMBER OF PAGES
93 16. PRICE CODE
17. SECURITY CLASSIFICATION OF REPORT
Unclassified
18. SECURITY CLASSIFICATION OF THIS PAGE
Unclassified
19. SECURITY CLASSIFICATION OF ABSTRACT
Unclassified
20. LIMITATION OF ABSTRACT
UU NSN 7540-01-280-5500 Standard Form 298 (Rev. 2-89) Prescribed by ANSI Std. 239-18

ii
THIS PAGE INTENTIONALLY LEFT BLANK
iii
Approved for public release, distribution is unlimited.
CORRELATION OF READY FOR TASKING TO FULL MISSION CAPABLE METRICS FOR F/A-18E/F
Bradley A. Brooks Lieutenant Commander, Supply Corps, United States Navy
B.A., North Carolina State University, 2000
Submitted in partial fulfillment of the requirements for the degree of
MASTER OF SCIENCE IN OPERATIONS RESEARCH
from the
NAVAL POSTGRADUATE SCHOOL March 2013
Author: Bradley A. Brooks
Approved by: Lyn R. Whitaker Thesis Advisor
Walt DeGrange Second Reader
Robert Dell Chairman, Department of Operations Research

iv
THIS PAGE INTENTIONALLY LEFT BLANK
v
ABSTRACT
Historically, the U.S. Navy has utilized Full Mission Capable (FMC) as the standard
metric in assessing aviation readiness, but an alternative to FMC has been introduced by
air wing commanders: Ready for Tasking (RFT). RFT is a less demanding standard for
readiness that provides a better representation of mission success than FMC. Since FMC
is used as an input to aviation repairable sparing models, before RFT can replace FMC in
funding models it is necessary to analyze the linkage between RFT and FMC.
This thesis explores the relationship between RFT and FMC based on five years
of data from the East Coast Carrier Air Wings flying F/A-18E/F Super Hornets. Linear
and logistic regression models are developed to analyze the impacts 11 common variables
have on RFT. It also examines readiness trends throughout the Fleet Response Training
Plan.

vi
THIS PAGE INTENTIONALLY LEFT BLANK
vii
TABLE OF CONTENTS
I. INTRODUCTION........................................................................................................1 A. BACKGROUND ..............................................................................................2
1. The Distinction between FMC and RFT ............................................2 2. Readiness Impact of APN-6 Funding Levels .....................................3 3. Assessing the Use of Full Mission Capability Goals in Aviation
Repairable Allowancing ......................................................................5 B. FOCUS AND ORGANIZATION OF THE THESIS ....................................6
II. DATA COLLECTION ................................................................................................7 A. METHODOLOGY ..........................................................................................7 B. DEFINITIONS OF VARIABLES ..................................................................8
III. COMPARING RFT AND FMC ...............................................................................11 A. INTRODUCTION..........................................................................................11 B. ANALYSIS OF RFT VERSUS FMC FOR EACH WING ........................16 C. COMBINED RFT AND FMC PERFORMANCE RATES .......................28 D. SUMMARY ....................................................................................................30
1. Correlation between RFT and FMC is Small but Inconclusive ....30 2. RFT and FMC were not Systematically Affected by Wing or
Phase....................................................................................................30 3. FMC Presents a Clearer Readiness Trend than RFT ....................31
IV. TYPICAL TRENDS WITHIN THE INTER-DEPLOYMENT CYCLE .............33 A. INTRODUCTION..........................................................................................33 B. PHASES WITHIN THE FRTP ....................................................................33 C. RFT AND RFT ACTUAL .............................................................................34 D. FMC AND RBA .............................................................................................36 E. RFT ACTUAL AND RFT ENTITLED .......................................................39 F. RFT ENTITLED AND TFHR ENTITLED ................................................41 G. TFHR ENTITLED, FHRS ENTITLED, AND FHA ..................................42 H. FHRS ENTITLED AND FLA ENTITLED .................................................44 I. FLA ENTITLED AND RBA .........................................................................45 J. RBA AND FLA ..............................................................................................46 K. FLA, FLA ENTITLED, AND ASSIGNED A/C ..........................................46 L. ASSIGNED A/C AND FHA ..........................................................................48
V. MODELING ANALYSIS ..........................................................................................51 A. OBJECTIVE ..................................................................................................51 B. LOGISTIC REGRESSION MODEL ..........................................................51 C. MODEL EXCLUDING PERFECT READY FOR TASKINGS ...............55 D. DISCUSSION .................................................................................................58
VI. CONCLUSIONS AND RECOMMENDATIONS ...................................................59 A. CONCLUSIONS ............................................................................................59
1. of RFT to FMC is Small but Inconclusive ......................................59
viii
2. RFT and FMC were not Systematically Affected by Wing or Phase....................................................................................................59
3. FMC Presents a Clearer Readiness Trend than RFT ....................59 4. “Lies, Damned Lies, and Statistics” .................................................60 5. FMC’s Negative Trend over Time ....................................................60 6. Impacts of Phase and FMC on Accomplishment of RFT ...............61
B. RECOMMENDATIONS ...............................................................................62 1. Retain FMC and RFT Metrics..........................................................62 2. Increase Validity of Data Inputs .......................................................62
C. OPPORTUNITIES FOR FURTHER STUDY ............................................62 1. Repairable Allowancing ....................................................................62 2. Supply Material Availability .............................................................63 3. West Coast Squadrons and Alternative T/M/S ...............................63 4. RFT Achievement by Mission ...........................................................63
APPENDIX A. THE LOGISTIC REGRESSION COEFFICIENTS AND STANDARD ERRORS ..............................................................................................65
APPENDIX B. THE MULTIPLE REGRESSION COEFFICIENTS AND STANDARD ERRORS ..............................................................................................67
LIST OF REFERENCES ......................................................................................................69
INITIAL DISTRIBUTION LIST .........................................................................................71
ix
LIST OF FIGURES
Figure 1. RFT vs. FMC for all 293 Observations including a Loess Smoother with Bandwidth = 0.7 ...............................................................................................12
Figure 2. Histogram of the FMC Values for 293 Wing/Months .....................................13 Figure 3. FMC over Time for CVW-17, with the Deployed FMC Standard 0.63
(purple line) and the Non-deployed Standard 0.53 (green line) ......................17 Figure 4. RFT over Time for CVW-17 ...........................................................................17 Figure 5. FMC over Time for CVW-7, with the Deployed FMC Standard 0.63
(purple line) and the Non-deployed Standard 0.53 (green line) ......................20 Figure 6. RFT over Time for CVW-7 .............................................................................20 Figure 7. FMC over Time for CVW-8, with the Deployed FMC Standard 0.63
(purple line) and the Non-deployed Standard 0.53 (green line) ......................22 Figure 8. RFT over Time for CVW-8 .............................................................................22 Figure 9. FMC over Time for CVW-3, with the Deployed FMC Standard 0.63
(purple line) and the Non-deployed Standard 0.53 (green line) ......................24 Figure 10. RFT over Time for CVW-3 .............................................................................24 Figure 11. FMC over Time for CVW-1, with the Deployed FMC Standard 0.63
(purple line) and the Non-deployed Standard 0.53 (green line) ......................26 Figure 12. RFT over Time for CVW-1 .............................................................................26 Figure 13. Line Chart for % of Months Meeting FMC Standards for Each Wing by
Phase ................................................................................................................28 Figure 14. Line Chart for % of Months Meeting RFT Goals for Each Wing by Phase ....29 Figure 15. RFT and RFT Actual for CVW-3 (Correlation Coefficient = 0.31) ................35 Figure 16. FMC Rates for All Wings ................................................................................38 Figure 17. FMC and RBA for CVW-7 (Correlation Coefficient = 0.53 for FMC and
RBA) ................................................................................................................39 Figure 18. RFT Actual and RFT Entitled for CVW-8 (Correlation Coefficient = 0.96) ..40 Figure 19. RFT Entitled and TFHR Entitled for CVW-3 (Correlation Coefficient =
0.99) .................................................................................................................42 Figure 20. FHA, FHRS Entitled, and TFHR Entitled for CVW-8 ....................................43 Figure 21. FHRS Entitled and FLA Entitled for CVW-8 (Correlation Coefficient =
0.82) .................................................................................................................44 Figure 22. FLA Entitled and RBA for CVW-3 (Correlation Coefficient = 0.92) .............45 Figure 23. RBA and FLA for CVW-3 (Correlation Coefficient = 0.94) ..........................46 Figure 24. FLA, FLA Entitled, and Assigned A/C for CVW-1 ........................................48 Figure 25. Assigned A/C and FHA for CVW-8 (Correlation Coefficient = 0.23) ............49 Figure 26. Plot of Residuals vs. Predicted Fitted Values for Model without
Transformation .................................................................................................56 Figure 27. Plot of Residuals vs. Predicted Values for Model with Square Root (1-
RFT) Transformation .......................................................................................57

x
THIS PAGE INTENTIONALLY LEFT BLANK
xi
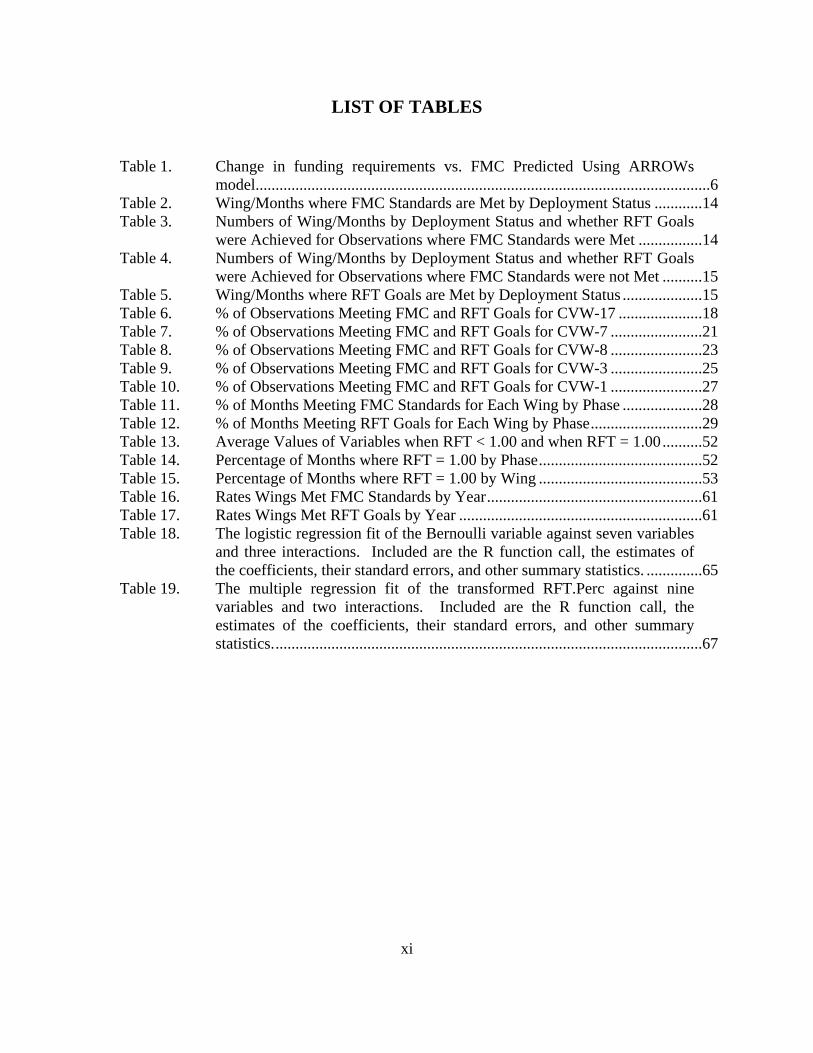
LIST OF TABLES
Table 1. Change in funding requirements vs. FMC Predicted Using ARROWs model..................................................................................................................6
Table 2. Wing/Months where FMC Standards are Met by Deployment Status ............14 Table 3. Numbers of Wing/Months by Deployment Status and whether RFT Goals
were Achieved for Observations where FMC Standards were Met ................14 Table 4. Numbers of Wing/Months by Deployment Status and whether RFT Goals
were Achieved for Observations where FMC Standards were not Met ..........15 Table 5. Wing/Months where RFT Goals are Met by Deployment Status ....................15 Table 6. % of Observations Meeting FMC and RFT Goals for CVW-17 .....................18 Table 7. % of Observations Meeting FMC and RFT Goals for CVW-7 .......................21 Table 8. % of Observations Meeting FMC and RFT Goals for CVW-8 .......................23 Table 9. % of Observations Meeting FMC and RFT Goals for CVW-3 .......................25 Table 10. % of Observations Meeting FMC and RFT Goals for CVW-1 .......................27 Table 11. % of Months Meeting FMC Standards for Each Wing by Phase ....................28 Table 12. % of Months Meeting RFT Goals for Each Wing by Phase ............................29 Table 13. Average Values of Variables when RFT < 1.00 and when RFT = 1.00 ..........52 Table 14. Percentage of Months where RFT = 1.00 by Phase .........................................52 Table 15. Percentage of Months where RFT = 1.00 by Wing .........................................53 Table 16. Rates Wings Met FMC Standards by Year ......................................................61 Table 17. Rates Wings Met RFT Goals by Year .............................................................61 Table 18. The logistic regression fit of the Bernoulli variable against seven variables
and three interactions. Included are the R function call, the estimates of the coefficients, their standard errors, and other summary statistics. ..............65
Table 19. The multiple regression fit of the transformed RFT.Perc against nine variables and two interactions. Included are the R function call, the estimates of the coefficients, their standard errors, and other summary statistics. ...........................................................................................................67

xii
THIS PAGE INTENTIONALLY LEFT BLANK
xiii
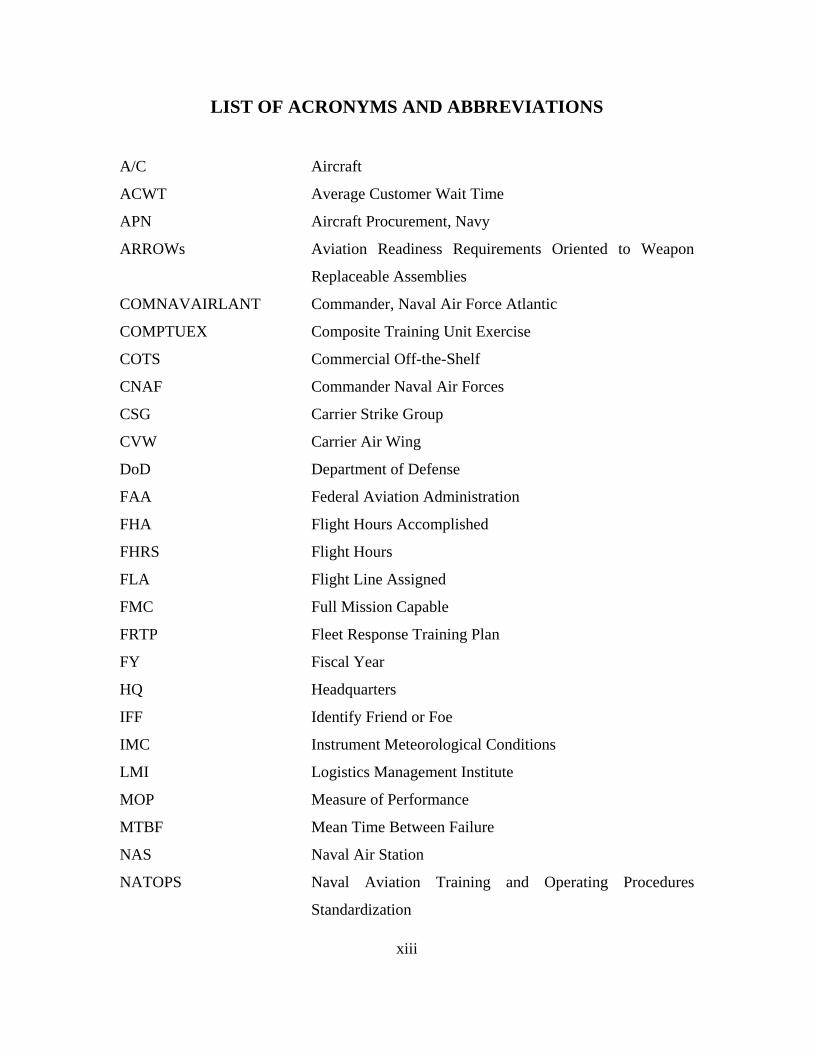
LIST OF ACRONYMS AND ABBREVIATIONS
A/C Aircraft
ACWT Average Customer Wait Time
APN Aircraft Procurement, Navy
ARROWs Aviation Readiness Requirements Oriented to Weapon
Replaceable Assemblies
COMNAVAIRLANT Commander, Naval Air Force Atlantic
COMPTUEX Composite Training Unit Exercise
COTS Commercial Off-the-Shelf
CNAF Commander Naval Air Forces
CSG Carrier Strike Group
CVW Carrier Air Wing
DoD Department of Defense
FAA Federal Aviation Administration
FHA Flight Hours Accomplished
FHRS Flight Hours
FLA Flight Line Assigned
FMC Full Mission Capable
FRTP Fleet Response Training Plan
FY Fiscal Year
HQ Headquarters
IFF Identify Friend or Foe
IMC Instrument Meteorological Conditions
LMI Logistics Management Institute
MOP Measure of Performance
MTBF Mean Time Between Failure
NAS Naval Air Station
NATOPS Naval Aviation Training and Operating Procedures
Standardization
xiv
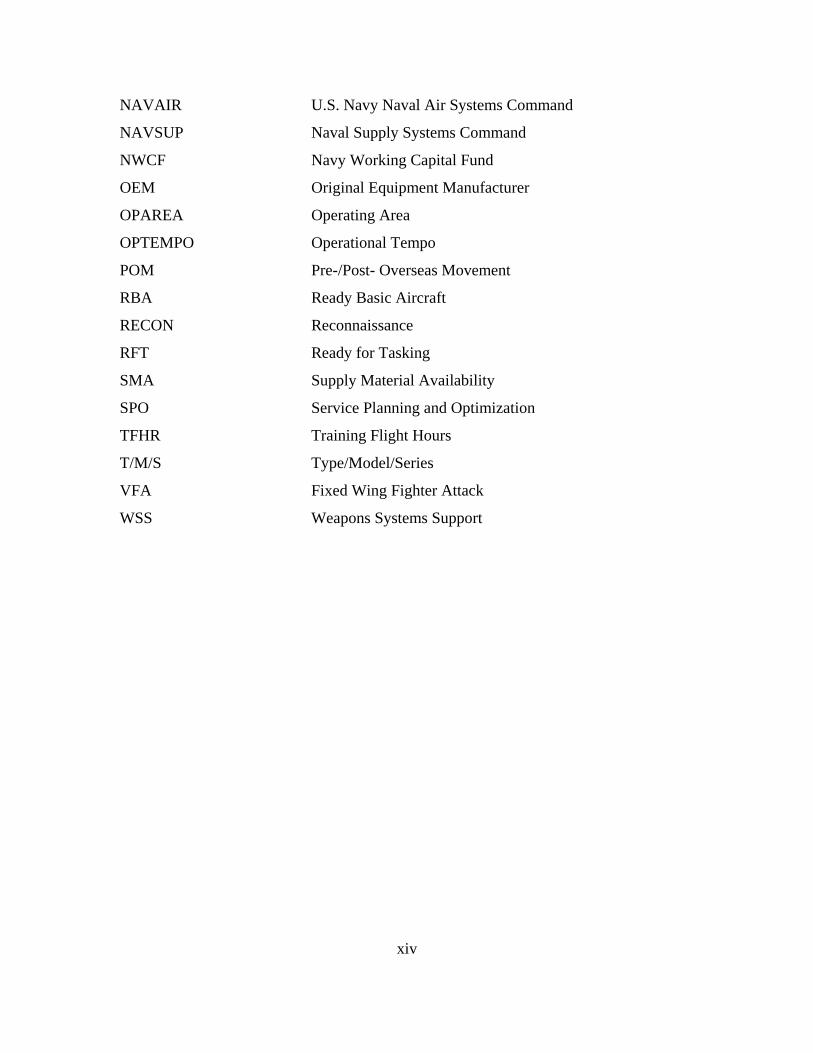
NAVAIR U.S. Navy Naval Air Systems Command
NAVSUP Naval Supply Systems Command
NWCF Navy Working Capital Fund
OEM Original Equipment Manufacturer
OPAREA Operating Area
OPTEMPO Operational Tempo
POM Pre-/Post- Overseas Movement
RBA Ready Basic Aircraft
RECON Reconnaissance
RFT Ready for Tasking
SMA Supply Material Availability
SPO Service Planning and Optimization
TFHR Training Flight Hours
T/M/S Type/Model/Series
VFA Fixed Wing Fighter Attack
WSS Weapons Systems Support
xv
EXECUTIVE SUMMARY
Historically, the U.S. Navy has utilized Full Mission Capable (FMC) as the
standard metric in assessing aviation readiness. Appendix A of the Naval Aviation
Maintenance Program defines FMC as the “material condition of an aircraft that can
perform all of its missions” (CNAF 4790.2B Appendix A 2012). FMC has trended
downward since the mid-2000s while air wing commanders and other stakeholders have
endorsed Ready for Tasking (RFT) as an alternative to FMC. RFT is a less demanding
standard for readiness that provides a better representation of mission success than FMC.
For an aircraft (A/C) to be designated FMC, it must be able to perform all of its missions
including those the commander does not require during a given sortie. In contrast, RFT
only involves the fraction of A/C that can perform required missions; hence if an A/C has
a deficiency in a configured mission that is not currently needed, the A/C is rated as RFT
but not FMC. The commander’s main focus only regards those missions required for a
given sortie, thus commanders prefer RFT over FMC as a gauge for readiness.
FMC is used as an input to aviation repairable sparing models including Aviation
Readiness Requirements Oriented to Weapon Replaceable Assemblies (ARROWs) and
Service Planning and Optimization (SPO), thus it is necessary to analyze the linkage
between RFT and FMC before FMC can be discarded as a readiness metric in favor of
RFT. Utilizing data covering March 2007 through June 2012 from F/A-18E/F Super
Hornet squadrons home-ported at Naval Air Station (NAS) Oceana in Virginia Beach,
VA, the relationship between RFT and FMC is examined in addition to other variables
common in naval aviation. These variables include RFT Entitled, Ready Basic A/C
(RBA), Flight Hours Accomplished (FHA), Flight Hours Entitled (FHRS Entitled),
Training Flight Hours Entitled (TFHR Entitled), Assigned A/C, Flight Line Assigned
(FLA), FLA Entitled, Wing, and Phase. It is important to note that RFT Entitled for a
wing is based on the number of A/C within the wing in addition to the month/phase
within the Fleet Response Training Plan (FRTP), thus it is a moving target. When more
missions are required, RFT Entitled is higher. A logistic regression model is generated to
predict when a wing fails to achieve a perfect RFT during a month. Then employing only
xvi
observations where a wing achieved less than a perfect RFT (1.00) during a month, a
multiple regression model is fit to determine the effects variables have on RFT.
Of 293 wing/month combinations, 212 (72.4%) achieved the goal of a perfect
RFT although the average FMC of 0.52 fell below the overall standard for the Super
Hornet (Buckley et al. 2011). Of 74 deployed observations, 28 achieved the FMC
standard of 0.63 (37.8%), while 97 of 219 non-deployed observations attained the non-
deployed FMC standard of 0.53 (44.3%). The respective RFT achievements for deployed
and non-deployed were 60 (81.1%) and 152 (69.4%), thus wings are doing a much better
job meeting RFT goals compared with FMC as it is significantly easier to attain RFT than
FMC. When viewing readiness through the RFT lens the Fleet is performing relatively
well, but assessing readiness with an FMC perspective leads to a different conclusion.
The correlation between RFT and FMC was 0.17, which represents an
undetermined relationship. There was a negative correlation in two of the five wings
analyzed: as FMC went down, RFT went up. This is counterintuitive (both RFT and
FMC measure readiness) since if readiness goes up, then readiness indicators should rise
as well. One explanation for the lack of a stronger linear positive relationship is due to
excess readiness available in RFT that is not available for FMC. When RFT and FMC
are utilized as fractions, all A/C rated FMC contribute towards the FMC fraction while
only those A/C rated RFT capped off at RFT Entitled count towards the RFT ratio. The
following illustrates the very weak connection between RFT and FMC: of 14
observations where FMC dropped below 0.20, eight (57.1%) achieved a perfect RFT
including the lowest value of FMC observed (0.07). Clearly the relationship between
RFT and FMC is very weak: other factors are involved that create complex relationships.
A 2011 Logistics Management Institute (LMI) study found a negative trend in
FMC values for overall Type/Model/Series (T/M/S) A/C since 2006 (Buckley et al.
2011). The correlation coefficient between month/year and FMC for the 293
observations was -0.60, and at a significance level of 5% FMC for East Coast Super
Hornets have trended down from March 2007 to June 2012. The correlation between
month/year and RFT was only -0.01 which represents an inconclusive linear relationship.
All five wings analyzed had statistically significant differences in FMC accomplishment
xvii
by year. RFT differences by year overall are not significant as only three of the five
wings’ success rates were affected by the year.
The selection of an official readiness metric can make a difference when
comparing wings to one another. If achieving an RFT of 1.00 during deployment is the
ultimate goal, CVW-17 had the highest readiness of the five East Coast air wings during
this five year period. However, if meeting an FMC standard of 0.63 during deployment
is the measuring stick, CVW-17 had the worst readiness. Thus it is critical to select an
appropriate readiness metric and while the commander may simply desire to accomplish
the mission, one can better detect trends and patterns with FMC than via RFT.
A logistic regression model was generated to predict when a wing fails to achieve
a perfect RFT during a month. The naïve Bayes rule predicts a perfect RFT for each
observation since the majority (72.4%) of observations attained an RFT of 1.00.
Compared with the naïve Bayes rule’s misclassification of 81 observations (predicting a
perfect RFT when the observation achieved an RFT < 1.00 and vice versa), this logistic
regression model misclassified 48 which represents a 40.7% reduction in errors. This
model also reduced misclassifications within each wing compared with Bayes. FMC was
retained in the model in addition to its interactions with Wing and FHRS Entitled, while
the phase had no impact on achieving a perfect RFT. Since the phase helps determine the
entitlements, the presence of entitlements within the model allows for phase to be left out.
FLA, FHA, and RFT Entitled were also unnecessary, while the only other interaction
required was between Assigned A/C & Wing.
Employing only observations where a wing achieved less than a perfect RFT
(1.00) during a month, a multiple regression model was fit to determine the impacts
variables have on RFT. RFT was transformed four different ways in an attempt to
achieve homoscedasticity and FMC was unnecessary in the presence of the other
variables in all models. The best model’s adjusted R-Squared statistic was 0.6293, thus
this model explained 62.93% of the variation. FHA also fell out of the best model while
the only interactions required were between Assigned A/C & Wing and between FHRS &
Phase.
xviii
There appears to be value in retaining both RFT and FMC as readiness metrics: if
the primary concern is accomplishing missions when required then RFT has a purpose,
while FMC is useful to portray readiness trends and as a funding input. Employing RFT
as an input for aviation spares funding models could have significant fiscal effects if a
perfect RFT goal is utilized since this thesis found 72.4% of observations meeting the
goal.
Finally, only Super Hornets supported via Naval Air Station Oceana during
March 2007 through June 2012 were considered for this analysis. Alternative T/M/S,
support locations, or time frames may produce contradicting conclusions. In addition, the
relationship between RFT and Supply Material Availability could be explored in follow-
on studies.

xix
ACKNOWLEDGMENTS
First and foremost, I need to thank my lovely, tolerant, and industrious wife,
formerly MaryAnn E. Fisher of the beautiful Charleston, SC. Her ability to work long
hours within the Comptroller’s shop ensured that I did not feel guilty about staying late.
We both thoroughly enjoyed spending quality time with my bright cousin, Robin Young,
including Thanksgivings, Christmases, and birthdays. We greatly appreciate the
friendships developed with Pete, My, Linh, Ly, Nick, Crazy George, Stretch and the
remainder of the staff and regulars of the Trident Room.
Commander Walt DeGrange not only agreed to be my Second Reader, but he also
encouraged me to take on a Supply Corps topic of high visibility. Furthermore, he placed
me in contact with Captain David Meyers, Commander Xavier Lugo, and Lieutenant
Commander Bruce Reilly, who provided support and recommended this topic. As a
result, I know so much more about naval aviation supply than I did just one year ago.
Commander DeGrange also recommended I view the online technical writing videos for
Coursera (https://www.coursera.org), which has made me a much better writer while
providing long-lasting professional benefits. Commander Jeffrey Hyink provided
guidance and clarification regarding Super Hornet missions and the FRTP. I need to
thank the following people for their critical contributions in data acquisition:
Commander Julie Treanor, Lieutenant Commander Andres Diaz, Lieutenant Commander
Andre Sadowski, Jeff Gardner, Jan Burrows, and Aneesah Thompson (NAVSUP WSS);
Commander Shane Brown (NAVSUP HQ); Bob Ramsey, Mike Fleetwood, and
Lieutenant Commander Quintin Tan (COMNAVAIRLANT); as well as Dan Van Buskirk
and Wally Moore (NAVAIR).
Finally, I need to thank Dr. Lyn Whitaker for being my Thesis Advisor and for
greatly improving my knowledge and confidence with data analysis. We made for an
efficient team, and for her efforts, she will be rewarded with a continuous bombardment
of requests whenever I run into issues in the Fleet, which promises to be quite often.

xx
THIS PAGE INTENTIONALLY LEFT BLANK
1
I. INTRODUCTION
Historically, the U.S. Navy has utilized Full Mission Capable (FMC) as the
standard metric in assessing aviation readiness. Appendix A of the Naval Aviation
Maintenance Program defines FMC as the “material condition of an aircraft that can
perform all of its missions” (CNAF 4790.2B Appendix A 2012). Beginning in 2009, all
naval aircraft (A/C) considered in the aggregate were no longer achieving the FMC
standards, while the Super Hornet has not achieved its FMC standard since 2000
(Buckley et al. 2011). As aviation units fail to meet a standard Measure of Performance
(MOP), the Fleet has introduced an alternate MOP - Ready for Tasking (RFT). RFT is a
less demanding standard for readiness that provides a better representation of mission
success than FMC. For an A/C to be designated FMC, it must be able to perform all of
its missions including those the commander does not require during a given sortie. In
contrast, RFT only involves the fraction of A/C that can perform required missions;
hence if an A/C has a deficiency in a configured mission that is not currently needed, the
A/C is rated as RFT but not FMC. The minimum RFT requirement is driven by the
number of A/C within the wing and the month/phase within the Fleet Response Training
Plan (FRTP), thus it is a moving target (CNAF INSTRUCTION 3510 series 2006). The
commander’s main focus only regards those missions required for a given sortie, thus
RFT provides a better gauge for operational readiness than FMC. The transition towards
RFT has evolved to the point where the Navy has not established FMC standards for the
next generation Joint Strike Fighter (Buckley et al. 2010).
FMC is used as an input to aviation repairable sparing models including Aviation
Readiness Requirements Oriented to Weapon Replaceable Assemblies (ARROWs) and
Service Planning and Optimization (SPO), thus it is necessary to analyze the linkage
between RFT and FMC before FMC can be discarded as a readiness metric in favor of
RFT. Utilizing data covering March 2007 through June 2012 from F/A-18E/F Super
Hornet squadrons home-ported at Naval Air Station (NAS) Oceana in Virginia Beach,
VA, the relationship between RFT and FMC is analyzed. The relationships of RFT and
FMC to other variables common in naval aviation are also examined. These variables
2
include RFT Entitled, Ready Basic A/C (RBA), Flight Hours Accomplished (FHA),
Flight Hours Entitled (FHRS Entitled), Training Flight Hours Entitled (TFHR Entitled),
Assigned A/C, Flight Line Assigned (FLA), FLA Entitled, Wing, and Phase. A mixture
model is fit to explore the relationship between these variables and RFT. This mixture
model has two components. The first component is a logistic regression model generated
to predict when a wing fails to achieve a perfect RFT during a month. The second
component is a multiple regression model that is fit to only those observations where a
wing achieved less than a perfect RFT (1.00) during a month. Finally, RFT and FMC
trends over FRTP phases are analyzed and presented graphically.
The Super Hornet is the focus of this study for two reasons. The first reason is the
Super Hornet is the most modern naval A/C in operation where ample data exists, and it
replaces several legacy platforms. The second reason is its wide array of missions
including fighter escort, close air support, armed reconnaissance, aerial refueling, and
precision strike among others. The Super Hornet can fail to meet its aerial refueling
mission but still be considered RFT if the mission of the day is precision strike. Hence,
RFT for a Super Hornet is not necessarily the same as FMC and the differences between
these metrics can be analyzed.
The R statistical computing software is used for this thesis. R is a free software
program produced by the R Foundation for Statistical Computing located in Vienna,
Austria. It is a collaborative programming language with many contributors, and further
information can be located at http://www.R-Project.org/ (R Core Team 2012).
A. BACKGROUND
1. The Distinction between FMC and RFT
An A/C is designated FMC when it can complete all missions it is designed to
perform. An A/C is designated RFT when it can perform the particular mission it is assigned
during a sortie. The Fleet considers RFT a better reflection of operational readiness than
FMC since squadron commanders’ main concerns rest in completing specific missions. If
the mission requires one A/C for an armed reconnaissance (RECON) sortie when only one of
10 A/C possesses this capability, commanders can report RFT at 100% instead of a 10%
3
FMC assuming they deploy that A/C for the RECON mission. If the squadrons do not fly
RECON missions throughout a deployment, then the commanders are not penalized when
utilizing RFT when zero A/C on-hand can perform this capability. However, for this
scenario the FMC is 0.00. This simplistic example illustrates how RFT can be a lower
threshold for readiness in most cases, as the vast majority of situations will experience an
RFT higher than the respective FMC.
A key distinction between the calculations of RFT and FMC involves the
timeframes utilized. FMC is determined every reporting day regardless of whether any
missions are scheduled to be flown that particular day, while RFT is only calculated
when missions are required. Thus it is possible for FMC to exceed RFT during a month
though this is unlikely (Buckley et al. 2010). Another simple example will clarify this
point. Imagine that 10 A/C are in reporting status each day of a 30-day month. The first
24 days all 10 A/C are FMC, but the last six days each of the 10 suffer a RECON failure.
Hence, there are 240 A/C-days of FMC and 60 A/C-days that are not FMC and the FMC
fraction is 240/300 = 0.80. Unfortunately for the squadron, the first 24 days required no
RECON missions while each of the last six days the RECON requirement was five. The
RFT fraction for the month is calculated as 0/30 = 0.00 which is lower than the FMC for
the month.
2. Readiness Impact of APN-6 Funding Levels
The Logistics Management Institute (LMI) conducted two relevant studies: the
first treats FMC goals in aviation repairable allowancing (Buckley et al. 2010), and the
second (summarized in this section), studies the readiness impacts of funding levels
(Buckley et al. 2011).
As funding for Department of Defense (DoD) appropriations has received more
visibility, APN-6 (spares for Aircraft Procurement, Navy) obligations have trended
downward in relation to recommended levels even as mission requirements have
increased. The annual APN-6 requirement (for all naval Type/Model/Series - T/M/S)
increased from an average of $949M in the five years preceding the 9/11 terrorist attacks
to $1.38B in the 10 years since. However, actual APN-6 funding averaged 88% of the
4
stated requirement prior to 9/11 and 84% since, thus appropriated funding regularly falls
short of requirements. Since 9/11 annual aviation spares funding averaged $1.16B and
the F/A-18E/F Super Hornet accounts for 20% of this total. An available supply of
aviation spares is necessary to provide a buffer for part failures on A/C; the supply
system in conjunction with the maintainers and the Mean Time Between Failures
(MTBFs) determine the readiness of A/C. As the Average Customer Wait Time (ACWT)
decreases due to having more spares on-hand, readiness should improve. Thus adequate
spares funded should increase FMC and related readiness measures. Traditionally the
Navy has utilized the ARROWs model to project APN-6 requirements; however, the
Navy is transitioning towards SPO, a Commercial Off-the-Shelf (COTS) tool that
provides a solution satisfying standards at a projected savings of 3%.
LMI found that since 2006 the overall T/M/S FMC rates have been declining. If
the APN-6 account is funded at 75% of its requirements, the overall FMC standard of
0.56 (for all T/M/S) will likely be met. When all T/M/S are aggregated, it appears that as
funding increases FMC increases until requirements are funded at the 84% level. FMC
then is unaffected by increases in funding percentage until APN-6 is funded at 95% of
requirements. Therefore additional funding beyond 84% does not generate an adequate
return on investment. However, LMI addresses several issues which limit the
applicability of its results. Non-deployed sites will likely exceed their FMC standards
while deployed squadrons will fall short due to flight hour demands and shipping times.
In addition, actual APN-6 funding execution is not broken down by individual T/M/S
(unlike the requirements process); therefore it is unlikely each T/M/S will achieve its
standard even though the aggregate standard is met.
LMI presents a solid description of the funding process regarding the Navy
Working Capital Fund (NWCF) and APN-6. Due to extended lead times, requirements
for aviation spares are determined three years prior to the date they are needed. The
NWCF places orders 18 to 36 months in advance from the Original Equipment
Manufacturer (OEM) and the spares are received at the wholesale level and paid for with
NWCF dollars. When these parts are delivered to the squadrons, APN-6 funding
reimburses the NWCF. Since NWCF expenditures in anticipation of FY15’s
5
requirements are limited to the APN-6 level authorized for FY15 while NWCF
requisitions parts up to three years prior to FY15, any increase in actual FY15
commitments may result in shortfalls. Similarly Congressional delays in APN-6 funding
projections lead to greater spares availability uncertainty since the spares are ordered via
the NWCF years in advance. Of note, spares purchased by a squadron in FY15 may be
required to replace a failed part years later. Hence a reduction in the APN-6 account for
FY15 may not impact readiness for FY15: the effects could be felt in following years.
3. Assessing the Use of Full Mission Capability Goals in Aviation Repairable Allowancing
The second LMI study of note is summarized below (Buckley et al. 2010). This
LMI report revealed a very small correlation between RFT and FMC for the Super
Hornet during deployment. There were more significant correlations for the E-2C
Hawkeye, F/A-18C Hornet, and MH-60R Seahawk but these correlations could not be
considered strong.
The LMI study also analyzed the impacts FMC standards had on aviation spares
funding as determined using the ARROWs model. With this model, funding for all
T/M/S A/C embarked on an aircraft carrier is more sensitive to an increase in the FMC
requirement than a decrease, thus the model predicts if one desired to implement higher
FMC standards the costs would increase significantly. For the Super Hornet single seat
(F/A-18E) and tandem seat (F/A-18F) versions, the impacts are moderate compared with
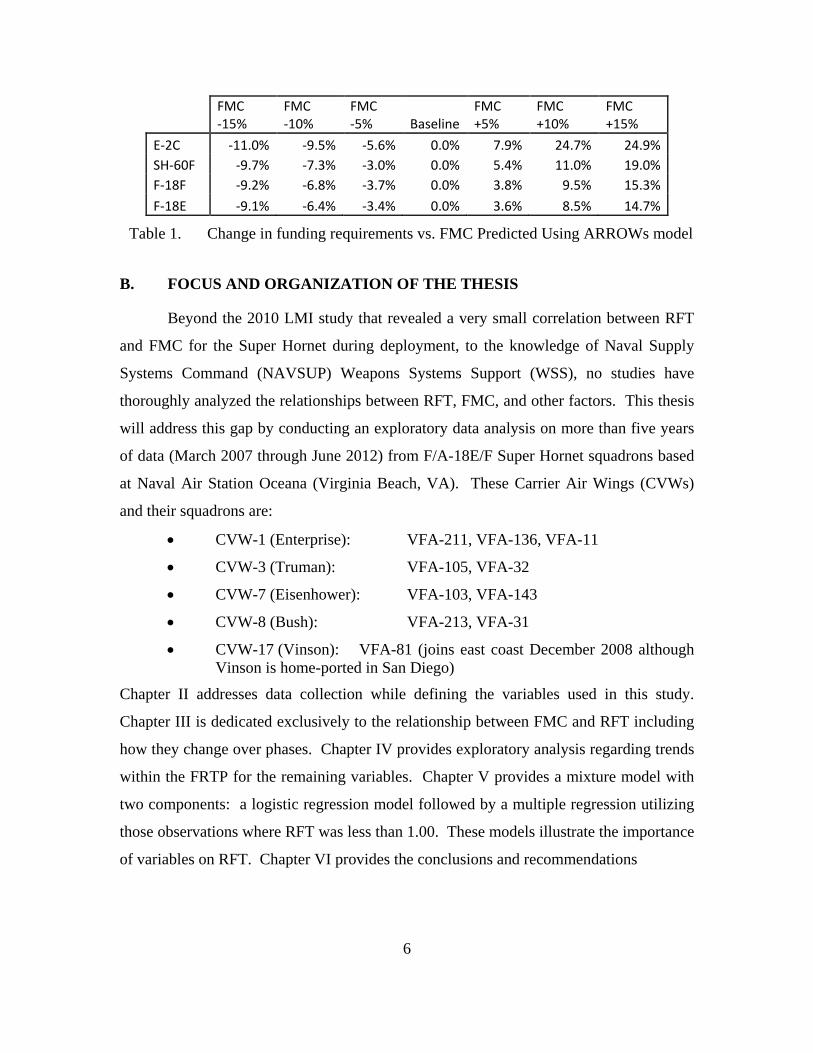
the Hawkeye and the SH-60F Seahawk (Table 1). As an example, an increase from the
current Super Hornet overall standard of an FMC of 0.63 to 0.68 would raise spares costs
by 3.8% for the F version while an increase to 0.78 results in a 15.3% cost increase.
Deployed Marine units displayed the largest sensitivity to an FMC standard increase
while shore sites were less sensitive than deployed Navy CVWs. Instead of increasing
the APN-6 funding, LMI suggests FMC increases may be better accomplished through
quicker turnaround times for repairs as LMI found a higher correlation between FMC and
downed systems due to maintenance than supply. However, LMI concludes increases in
APN-6 funding positively affect the FMC of deployed units.
6
FMC -15%
FMC -10%
FMC -5% Baseline
FMC +5%
FMC +10%
FMC +15%
E-2C -11.0% -9.5% -5.6% 0.0% 7.9% 24.7% 24.9% SH-60F -9.7% -7.3% -3.0% 0.0% 5.4% 11.0% 19.0% F-18F -9.2% -6.8% -3.7% 0.0% 3.8% 9.5% 15.3% F-18E -9.1% -6.4% -3.4% 0.0% 3.6% 8.5% 14.7%
Table 1. Change in funding requirements vs. FMC Predicted Using ARROWs model
B. FOCUS AND ORGANIZATION OF THE THESIS
Beyond the 2010 LMI study that revealed a very small correlation between RFT
and FMC for the Super Hornet during deployment, to the knowledge of Naval Supply
Systems Command (NAVSUP) Weapons Systems Support (WSS), no studies have
thoroughly analyzed the relationships between RFT, FMC, and other factors. This thesis
will address this gap by conducting an exploratory data analysis on more than five years
of data (March 2007 through June 2012) from F/A-18E/F Super Hornet squadrons based
at Naval Air Station Oceana (Virginia Beach, VA). These Carrier Air Wings (CVWs)
and their squadrons are:
• CVW-1 (Enterprise): VFA-211, VFA-136, VFA-11
• CVW-3 (Truman): VFA-105, VFA-32
• CVW-7 (Eisenhower): VFA-103, VFA-143
• CVW-8 (Bush): VFA-213, VFA-31
• CVW-17 (Vinson): VFA-81 (joins east coast December 2008 although Vinson is home-ported in San Diego)
Chapter II addresses data collection while defining the variables used in this study.
Chapter III is dedicated exclusively to the relationship between FMC and RFT including
how they change over phases. Chapter IV provides exploratory analysis regarding trends
within the FRTP for the remaining variables. Chapter V provides a mixture model with
two components: a logistic regression model followed by a multiple regression utilizing
those observations where RFT was less than 1.00. These models illustrate the importance
of variables on RFT. Chapter VI provides the conclusions and recommendations
7
II. DATA COLLECTION
A. METHODOLOGY
This thesis analyzes more than five years of data (March 2007 through June 2012)
from F/A-18E/F Super Hornet squadrons based at NAS Oceana in Virginia Beach, VA.
Squadrons were followed through all phases of the workup training cycle including
deployment. VFA-106 is not included in this analysis since VFA-106 is utilized to train
pilots in preparation for joining the Fleet. NAS Oceana supported CVWs 1, 3, 7, and 8
during all 64 months in the timeline; while CVW-17 arrived December 2008 for a total of
43 months receiving support from Oceana. Thus, there are 299 potential wing/month
combinations within this dataset and each wing/month combination is treated as an
observation. Hence, RFT and FMC metrics are aggregated for each wing and for each
month as defined explicitly in the next section. While the background in Chapter I
presented a theoretical example where RFT is less than FMC, this dataset contained six
observations where RFT was below FMC without a reasonable explanation beyond errors
in the respective values reported. As a result, these six anomalies were removed from the
dataset and 293 observations remained for the empirical analysis. The removed
observations include CVW-1 May 2008, CVW-3 March 2007, and CVW-17 October
2009 through January 2010. However, all 299 observations are displayed in plots
depicting trends for the benefit of visual continuity.
Finally, correlation strengths are reported consistent with the definitions used in
the 2011 LMI study regarding the readiness impacts of aviation spares funding levels
(Buckley et al. 2011) where:
0.20 - 0.40 low correlation; definite but small relationship,
0.40 - 0.70 moderate correlation; substantial relationship,
0.70 - 0.90 high correlation; marked relationship,
> 0.90 very high correlation; very dependable relationship.
8
Different organizations assign their own ranges and descriptions regarding the relative
strengths of correlations, thus the correlation coefficients are included throughout this
thesis and one can make their own conclusions regarding the relationships between the
variables.
B. DEFINITIONS OF VARIABLES
We analyzed 11 variables and their relationships with RFT. These variables are
defined in this section. The non-fractional variables in theory have unlimited ranges,
however, we list the maximum values attained in the dataset (for example, it is fiscally
and physically impossible to have infinity A/C within a deployed wing). Finally, the
entitlements are located within the CNAF INSTRUCTION 3510 series, and they are
driven by the number of A/C within the wing and the month/phase within the FRTP
(CNAF INSTRUCTION 3510 series 2006).
• FMC – Material condition of an aircraft that can perform all of its missions (CNAF 4790.2B Appendix A 2012). An FMC percentage is reported daily as the number of FMC A/C divided by the number of A/C in reporting status. This thesis uses FMC as the monthly average of daily FMC rates. Range: 0.00 - 1.00.
• RFT Entitled - The average number of A/C required to perform assigned missions during the month. Range: 0 - 26.
• RFT Actual - The average number of A/C able to perform required missions during the month. Range: 0 - 26 with the stipulation RFT Actual cannot exceed RFT Entitled. This is to ensure a day where RFT < 1.00 is not offset by another day where RFT > 1.00. A month with a perfect RFT of 1.00 implies there are no days where RFT < 1.00, thus the wing was able to accomplish all required missions during a month. Otherwise a wing could achieve a 1.00 (or greater) RFT for a month yet fail to conduct a required mission. This thesis only incorporates RFT Actual indirectly within the calculation of RFT as a fraction: given RFT as a fraction and RFT Entitled, RFT Actual can be determined.
• RFT – The fraction of RFT Actual divided by RFT Entitled during a month. Range: 0.00 – 1.00. An A/C cannot be FMC without being RFT.
• Ready Basic A/C (RBA) - The minimum configuration required to conduct day or night Instrument Meteorological Conditions (IMC) flight operations with necessary communications, Identify Friend or Foe (IFF), navigation, flight and safety systems required by applicable Naval Air Training and Operating Procedures Standardization (NATOPS) and
9
Federal Aviation Administration (FAA) regulations (Current Readiness Handbook 2011). If an A/C can fly safely it is rated as RBA; otherwise it is not. An A/C cannot be FMC or RFT without being RBA. RBA is averaged over the month. Range: 0 – 32.
• Wing - All wings within the dataset employed one to three squadrons, and CVW-1 in particular carried one squadron (VFA-211) until July 2007 when VFA-136 was temporarily assigned for one month. In July 2008 CVW-1 permanently gained VFA-136 while gaining VFA-11 from CVW-3. The following is a list of squadrons supported by Oceana including the CVW each is assigned to as of June 2012.
• CVW-1 (Enterprise): VFA-211, VFA-136, VFA-11
• CVW-3 (Truman): VFA-105, VFA-32
• CVW-7 (Eisenhower): VFA-103, VFA-143
• CVW-8 (Bush): VFA-213, VFA-31
• CVW-17 (Vinson): VFA-81 (joins east coast December 2008 although Vinson is home-ported in San Diego)
• Phase - The phase within the FRTP the wing predominantly operated in during a month. There are five phases: Maintenance, Basic, Intermediate, Sustainment, and Deployment.
• Maintenance – Extensive maintenance conducted on A/C.
• Basic – Training conducted at the unit level.
• Intermediate – Integration with the aircraft carrier and the Carrier Strike Group (CSG); includes the Composite Training Unit Exercise (COMPTUEX) which is the major pre-deployment exercise for the battle group lasting three to four weeks.
• Sustainment – Ready to deploy at short notice. This is the period immediately preceding and following the Deployment Phase, and the A/C must be maintained in condition to deploy if called upon.
• Deployment – Extended underway with the CSG, usually of a period lasting at least six months. Readiness ideally reaches its apex and this is when the A/C provides a return on the taxpayers’ dollars.
• Flight Hours Accomplished (FHA) - The number of flight hours flown during the month. Range: 0 - 3608.
• Flight Line Assigned (FLA) - The average number of A/C on the flight line in reporting status during the month. Range: 0 - 36.
10
• FLA Entitled (or Standard) - The minimum number of A/C required on the flight line in reporting status to support training/operations requirements (averaged over the month). Range: 0 - 36.
• Assigned A/C - The average number of A/C assigned to a wing during a month. Range: 0 - 37. FLA should always be no larger than Assigned A/C as not all Assigned A/C will be in reporting status due to extensive maintenance requirements.
• Flight Hours (FHRS) Entitled (or Standard) – The total flight hours required to accomplish the mission during the month. Range: 0 - 1469.
• Training Flight Hours (TFHR) Entitled - The flight hours required for training each month. Range: 0 - 1103. This is a subset of Flight Hours Entitled and represents the majority of the overall Flight Hours Entitled.
11
III. COMPARING RFT AND FMC
A. INTRODUCTION
For this thesis RFT and FMC are considered fractions (or percentages) where both
variables range from 0.00 to 1.00. A day when requirements are exceeded cannot offset a
day when RFT or FMC fell short of the mark. For example, if on one day nine of 10
required A/C can perform a specific mission while the following day 11 A/C can perform
a specific mission when only 10 are required, the combined RFT for the two days is 0.95
rather than 1.00. Since RFT and FMC are measures of readiness, one could possibly
assume a significant positive correlation between the two variables: as FMC increases,
RFT should increase and vice versa.
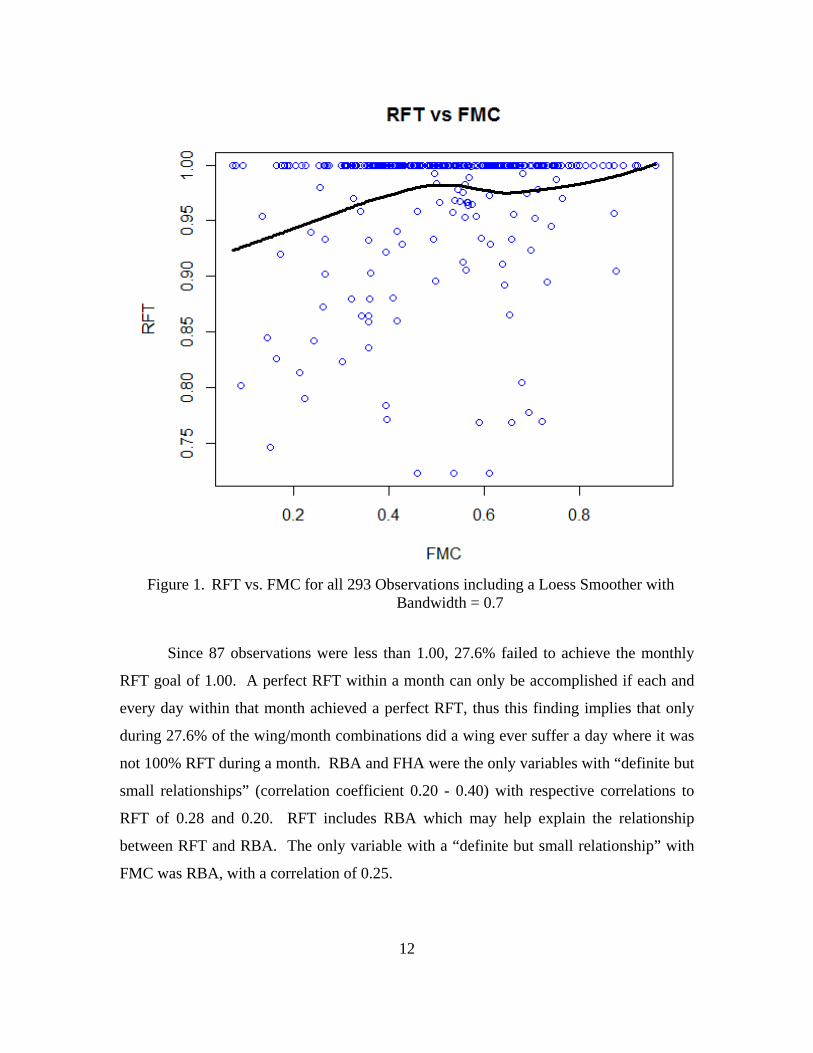
Figure 1 displays a plot of RFT versus FMC including a loess smoother for the
293 wing/month observations (Cleveland, Grosse, and Shyu 1992). The minimum RFT
was 0.72 thus the y-axis begins at 0.70 to present a clearer picture of the spread of RFT.
Immediately one can observe a majority of RFT values are 1.00 (212 of 293 to be more
precise) and RFT appears to increase with FMC with a leveling off in the interval from
FMC = 0.5 to FMC = 0.65. This interval includes the FMC standards for the Super
Hornet: 0.63 for deployed, 0.53 for non-deployed, and 0.58 overall. The trend within
this interval combined with the finding that two of the five wings had a negative
correlation between RFT and FMC (as FMC increased RFT decreased and vice versa)
contribute to a correlation between FMC and RFT of 0.17. This demonstrates a small but
indefinite positive linear relationship.
12
Figure 1. RFT vs. FMC for all 293 Observations including a Loess Smoother with
Bandwidth = 0.7
Since 87 observations were less than 1.00, 27.6% failed to achieve the monthly
RFT goal of 1.00. A perfect RFT within a month can only be accomplished if each and
every day within that month achieved a perfect RFT, thus this finding implies that only
during 27.6% of the wing/month combinations did a wing ever suffer a day where it was
not 100% RFT during a month. RBA and FHA were the only variables with “definite but
small relationships” (correlation coefficient 0.20 - 0.40) with respective correlations to
RFT of 0.28 and 0.20. RFT includes RBA which may help explain the relationship
between RFT and RBA. The only variable with a “definite but small relationship” with
FMC was RBA, with a correlation of 0.25.
13
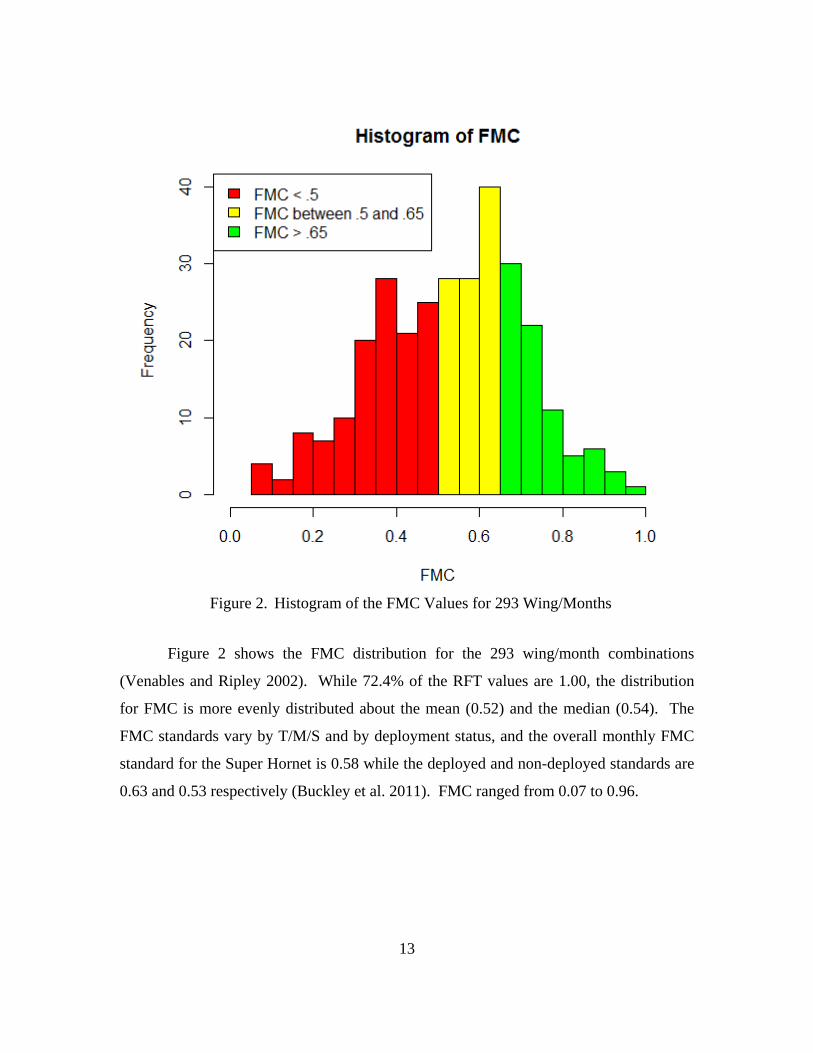
Figure 2. Histogram of the FMC Values for 293 Wing/Months
Figure 2 shows the FMC distribution for the 293 wing/month combinations
(Venables and Ripley 2002). While 72.4% of the RFT values are 1.00, the distribution
for FMC is more evenly distributed about the mean (0.52) and the median (0.54). The
FMC standards vary by T/M/S and by deployment status, and the overall monthly FMC
standard for the Super Hornet is 0.58 while the deployed and non-deployed standards are
0.63 and 0.53 respectively (Buckley et al. 2011). FMC ranged from 0.07 to 0.96.
14
Deployed Non-
Deployed Met FMC Standard 28 97 125 (37.8%) (44.3%) Failed to Meet FMC Standard 46 122 168 (62.2%) (55.7%) 74 219 293
Table 2. Wing/Months where FMC Standards are Met by Deployment Status
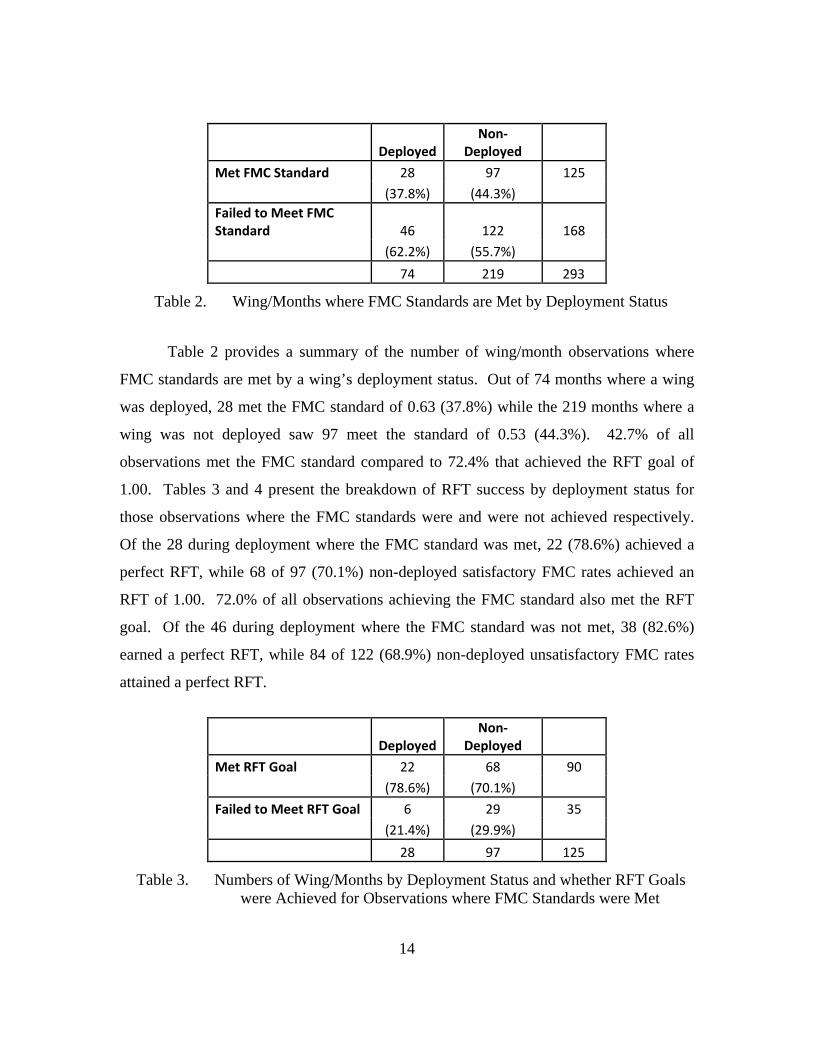
Table 2 provides a summary of the number of wing/month observations where
FMC standards are met by a wing’s deployment status. Out of 74 months where a wing
was deployed, 28 met the FMC standard of 0.63 (37.8%) while the 219 months where a
wing was not deployed saw 97 meet the standard of 0.53 (44.3%). 42.7% of all
observations met the FMC standard compared to 72.4% that achieved the RFT goal of
1.00. Tables 3 and 4 present the breakdown of RFT success by deployment status for
those observations where the FMC standards were and were not achieved respectively.
Of the 28 during deployment where the FMC standard was met, 22 (78.6%) achieved a
perfect RFT, while 68 of 97 (70.1%) non-deployed satisfactory FMC rates achieved an
RFT of 1.00. 72.0% of all observations achieving the FMC standard also met the RFT
goal. Of the 46 during deployment where the FMC standard was not met, 38 (82.6%)
earned a perfect RFT, while 84 of 122 (68.9%) non-deployed unsatisfactory FMC rates
attained a perfect RFT.
Deployed Non-
Deployed Met RFT Goal 22 68 90 (78.6%) (70.1%) Failed to Meet RFT Goal 6 29 35 (21.4%) (29.9%) 28 97 125
Table 3. Numbers of Wing/Months by Deployment Status and whether RFT Goals were Achieved for Observations where FMC Standards were Met
15
Deployed Non-
Deployed Met RFT Goal 38 84 122 (82.6%) (68.9%) Failed to Meet RFT Goal 8 38 46 (17.4%) (31.1%) 46 122 168
Table 4. Numbers of Wing/Months by Deployment Status and whether RFT Goals were Achieved for Observations where FMC Standards were not Met
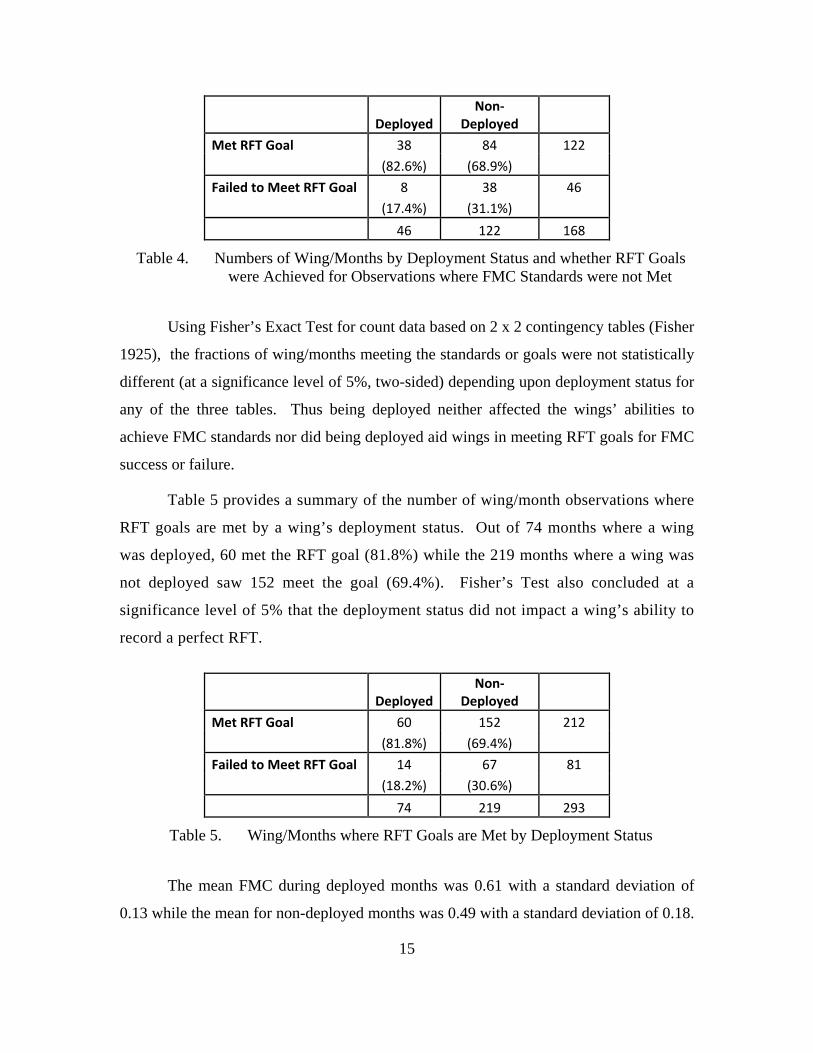
Using Fisher’s Exact Test for count data based on 2 x 2 contingency tables (Fisher
1925), the fractions of wing/months meeting the standards or goals were not statistically
different (at a significance level of 5%, two-sided) depending upon deployment status for
any of the three tables. Thus being deployed neither affected the wings’ abilities to
achieve FMC standards nor did being deployed aid wings in meeting RFT goals for FMC
success or failure.
Table 5 provides a summary of the number of wing/month observations where
RFT goals are met by a wing’s deployment status. Out of 74 months where a wing
was deployed, 60 met the RFT goal (81.8%) while the 219 months where a wing was
not deployed saw 152 meet the goal (69.4%). Fisher’s Test also concluded at a
significance level of 5% that the deployment status did not impact a wing’s ability to
record a perfect RFT.
Deployed Non-
Deployed Met RFT Goal 60 152 212 (81.8%) (69.4%) Failed to Meet RFT Goal 14 67 81 (18.2%) (30.6%) 74 219 293
Table 5. Wing/Months where RFT Goals are Met by Deployment Status
The mean FMC during deployed months was 0.61 with a standard deviation of
0.13 while the mean for non-deployed months was 0.49 with a standard deviation of 0.18.
16
This shows that on average wings are barely missing the FMC standards, but the majority
of observations (72.4%) achieve an RFT of 1.00. Thus depending upon which metric is
used, a dataset can either show via RFT that the squadrons are being supported
reasonably well or it can be concluded via FMC that the squadrons are not receiving
enough support to achieve readiness standards. A further look into the data reveals that
of the 14 observations where FMC was below 0.20, eight achieved a perfect RFT. Nine
of these 14 observations were in the Maintenance Phase, two each in Basic and
Intermediate, and the other was in Sustainment. The RFT entitlements during these
phases are not as high as in Deployed, thus a smaller number of actual RFT A/C is
required to achieve a perfect RFT fraction of 1.00.
Clearly the relationship between RFT and FMC is weak. Given a value of FMC
without any additional information, one cannot predict RFT to a reasonable degree of
certainty other than by guessing RFT = 1.00 every time. The exception to this is when
FMC is abnormally high there is a good chance RFT = 1.00; however, only 13 of 293
observations achieved an FMC as high as 0.80 (two of which had RFT < 1.00). For the
87 instances when RFT < 1.00 the average RFT was 0.90, thus when units fall short of
the RFT goal they are not falling short by a large margin.
B. ANALYSIS OF RFT VERSUS FMC FOR EACH WING
In this section, we consider RFT and FMC separately for each wing. Detailed
plots of FMC and RFT by month and phase within the FRTP illustrate how FMC paints a
much clearer picture of wing readiness than does RFT.
17
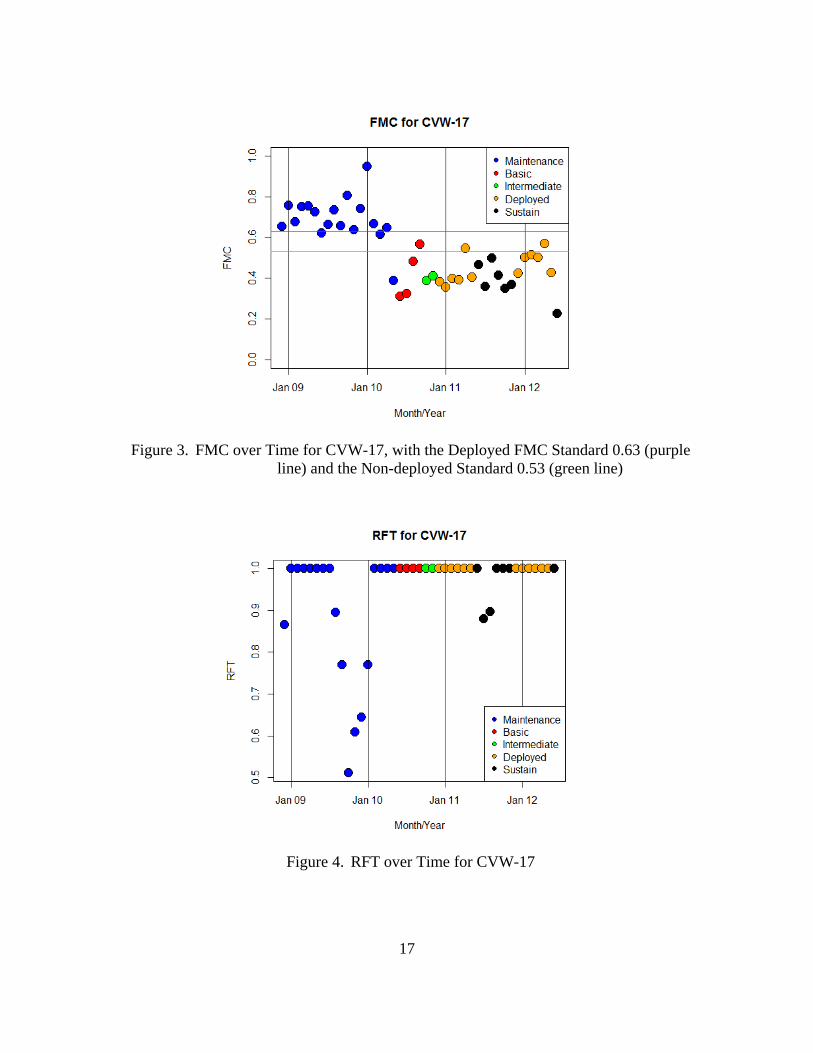
Figure 3. FMC over Time for CVW-17, with the Deployed FMC Standard 0.63 (purple
line) and the Non-deployed Standard 0.53 (green line)
Figure 4. RFT over Time for CVW-17
18
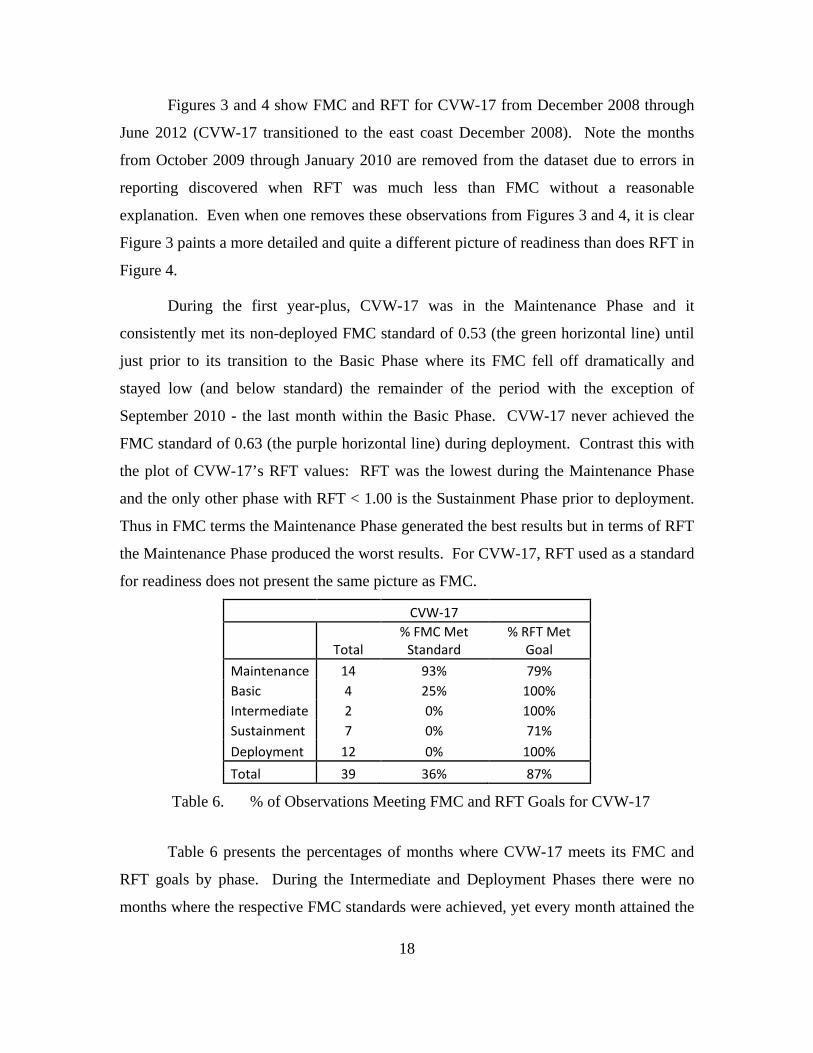
Figures 3 and 4 show FMC and RFT for CVW-17 from December 2008 through
June 2012 (CVW-17 transitioned to the east coast December 2008). Note the months
from October 2009 through January 2010 are removed from the dataset due to errors in
reporting discovered when RFT was much less than FMC without a reasonable
explanation. Even when one removes these observations from Figures 3 and 4, it is clear
Figure 3 paints a more detailed and quite a different picture of readiness than does RFT in
Figure 4.
During the first year-plus, CVW-17 was in the Maintenance Phase and it
consistently met its non-deployed FMC standard of 0.53 (the green horizontal line) until
just prior to its transition to the Basic Phase where its FMC fell off dramatically and
stayed low (and below standard) the remainder of the period with the exception of
September 2010 - the last month within the Basic Phase. CVW-17 never achieved the
FMC standard of 0.63 (the purple horizontal line) during deployment. Contrast this with
the plot of CVW-17’s RFT values: RFT was the lowest during the Maintenance Phase
and the only other phase with RFT < 1.00 is the Sustainment Phase prior to deployment.
Thus in FMC terms the Maintenance Phase generated the best results but in terms of RFT
the Maintenance Phase produced the worst results. For CVW-17, RFT used as a standard
for readiness does not present the same picture as FMC.
CVW-17
Total % FMC Met
Standard % RFT Met
Goal Maintenance 14 93% 79% Basic 4 25% 100% Intermediate 2 0% 100% Sustainment 7 0% 71% Deployment 12 0% 100% Total 39 36% 87%
Table 6. % of Observations Meeting FMC and RFT Goals for CVW-17
Table 6 presents the percentages of months where CVW-17 meets its FMC and
RFT goals by phase. During the Intermediate and Deployment Phases there were no
months where the respective FMC standards were achieved, yet every month attained the

19
RFT goal. Overall more than twice as many months met the RFT goal as compared to
FMC. Thanks largely due to the success during the Maintenance Phase, Fisher’s Test
concludes the FMC results are statistically significant at the level of 5% – there is a
difference in achieving the FMC standards between the phases. However, there is not a
statistically significant difference in the achievement of the RFT goal between phases.
20
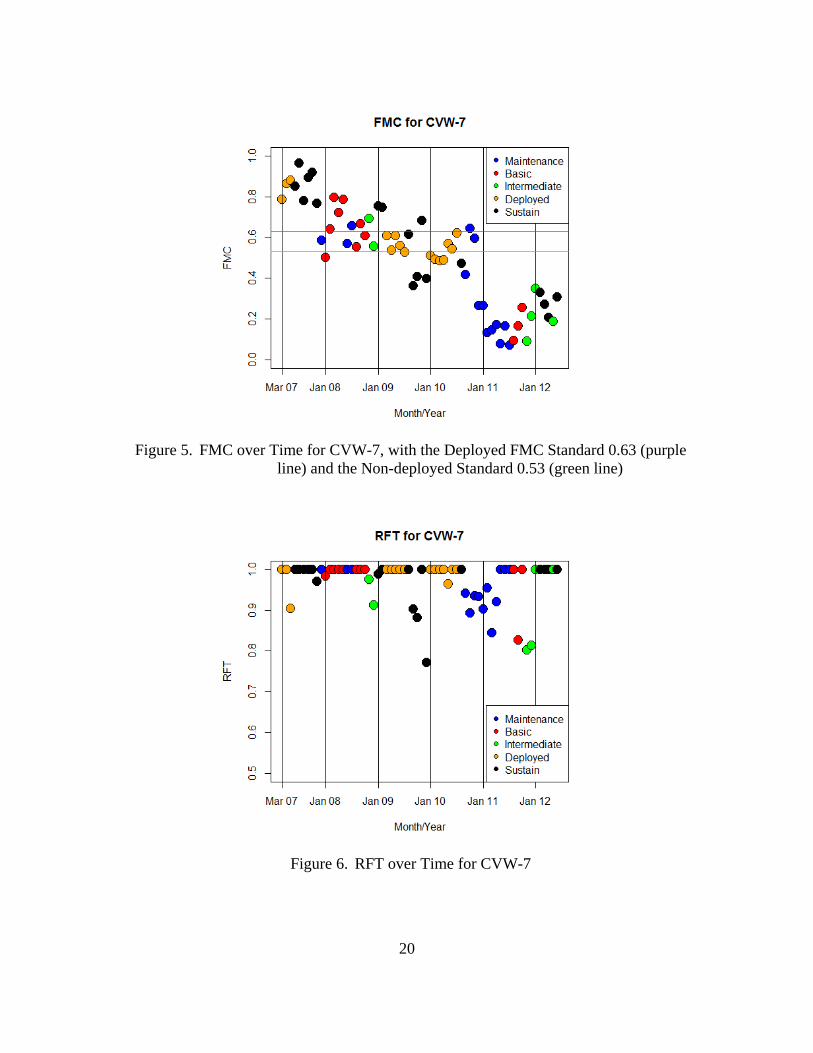
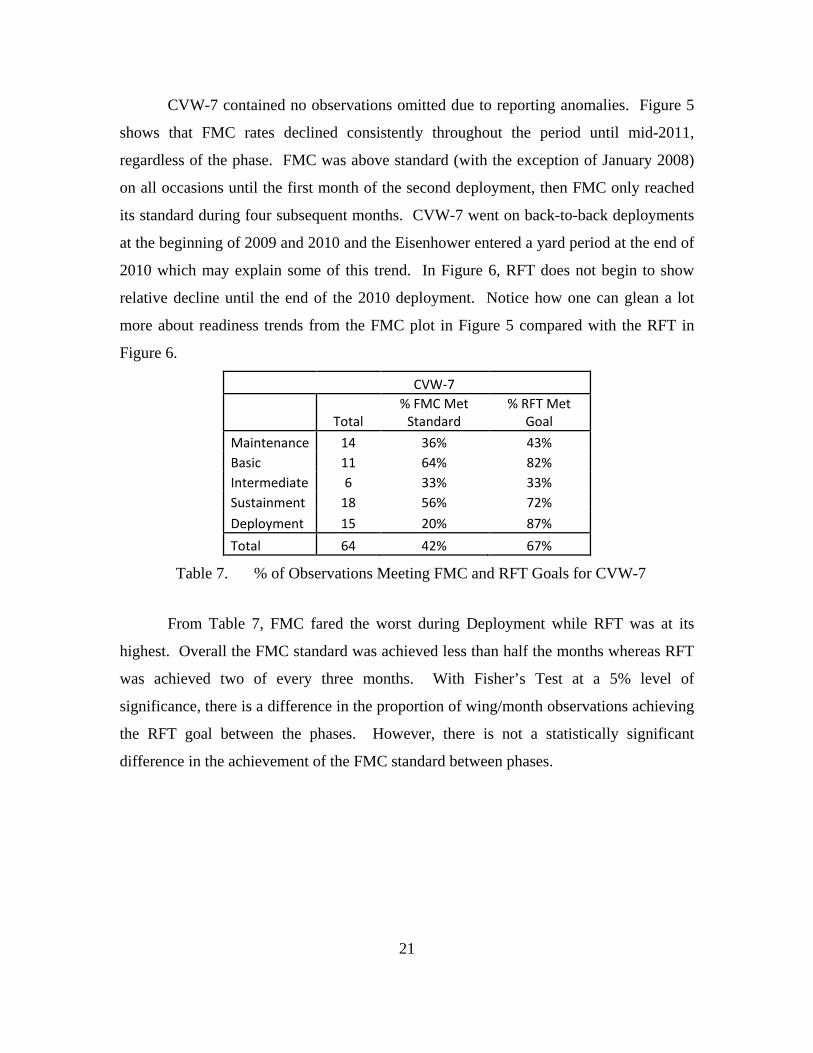
Figure 5. FMC over Time for CVW-7, with the Deployed FMC Standard 0.63 (purple
line) and the Non-deployed Standard 0.53 (green line)
Figure 6. RFT over Time for CVW-7
21
CVW-7 contained no observations omitted due to reporting anomalies. Figure 5
shows that FMC rates declined consistently throughout the period until mid-2011,
regardless of the phase. FMC was above standard (with the exception of January 2008)
on all occasions until the first month of the second deployment, then FMC only reached
its standard during four subsequent months. CVW-7 went on back-to-back deployments
at the beginning of 2009 and 2010 and the Eisenhower entered a yard period at the end of
2010 which may explain some of this trend. In Figure 6, RFT does not begin to show
relative decline until the end of the 2010 deployment. Notice how one can glean a lot
more about readiness trends from the FMC plot in Figure 5 compared with the RFT in
Figure 6.
CVW-7
Total % FMC Met
Standard % RFT Met
Goal Maintenance 14 36% 43% Basic 11 64% 82% Intermediate 6 33% 33% Sustainment 18 56% 72% Deployment 15 20% 87% Total 64 42% 67%
Table 7. % of Observations Meeting FMC and RFT Goals for CVW-7
From Table 7, FMC fared the worst during Deployment while RFT was at its
highest. Overall the FMC standard was achieved less than half the months whereas RFT
was achieved two of every three months. With Fisher’s Test at a 5% level of
significance, there is a difference in the proportion of wing/month observations achieving
the RFT goal between the phases. However, there is not a statistically significant
difference in the achievement of the FMC standard between phases.
22
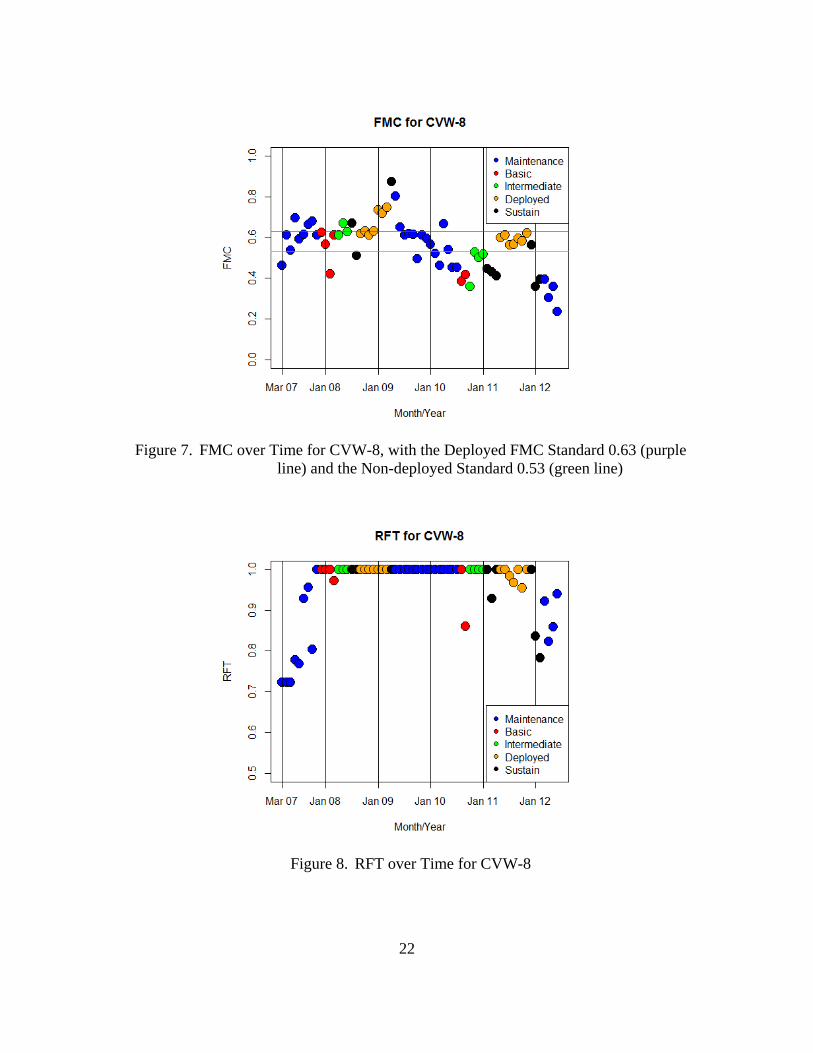
Figure 7. FMC over Time for CVW-8, with the Deployed FMC Standard 0.63 (purple
line) and the Non-deployed Standard 0.53 (green line)
Figure 8. RFT over Time for CVW-8
23
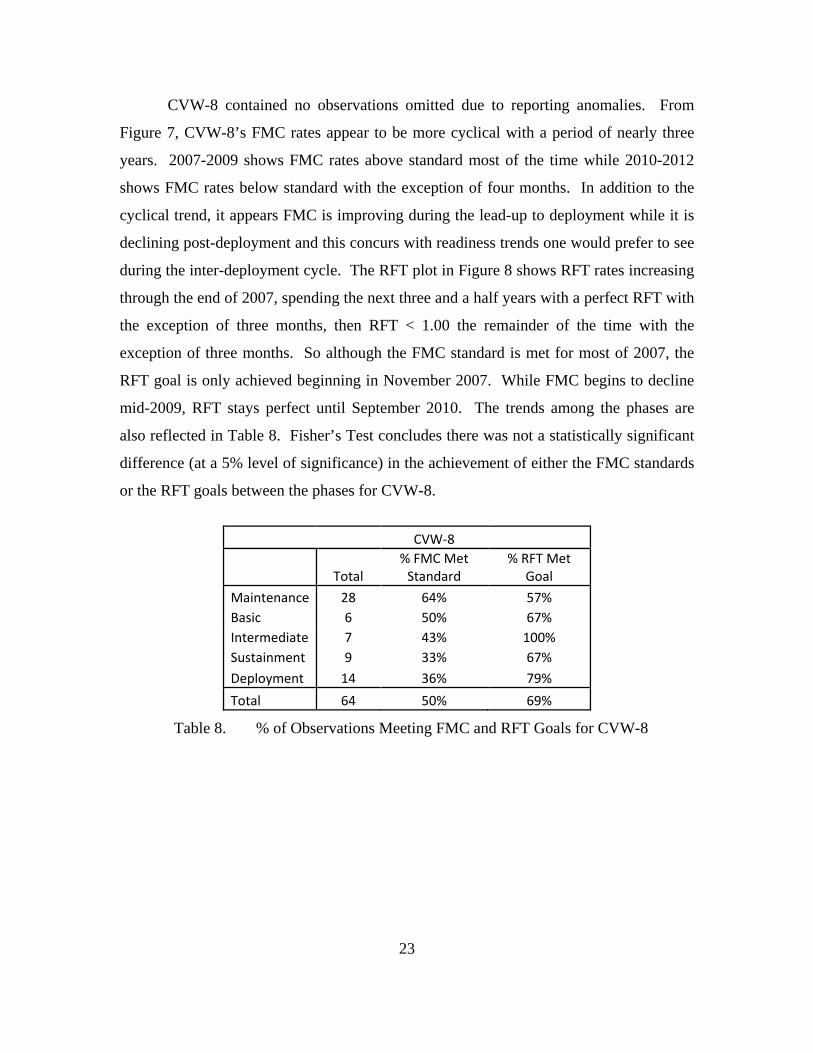
CVW-8 contained no observations omitted due to reporting anomalies. From
Figure 7, CVW-8’s FMC rates appear to be more cyclical with a period of nearly three
years. 2007-2009 shows FMC rates above standard most of the time while 2010-2012
shows FMC rates below standard with the exception of four months. In addition to the
cyclical trend, it appears FMC is improving during the lead-up to deployment while it is
declining post-deployment and this concurs with readiness trends one would prefer to see
during the inter-deployment cycle. The RFT plot in Figure 8 shows RFT rates increasing
through the end of 2007, spending the next three and a half years with a perfect RFT with
the exception of three months, then RFT < 1.00 the remainder of the time with the
exception of three months. So although the FMC standard is met for most of 2007, the
RFT goal is only achieved beginning in November 2007. While FMC begins to decline
mid-2009, RFT stays perfect until September 2010. The trends among the phases are
also reflected in Table 8. Fisher’s Test concludes there was not a statistically significant
difference (at a 5% level of significance) in the achievement of either the FMC standards
or the RFT goals between the phases for CVW-8.
CVW-8
Total % FMC Met
Standard % RFT Met
Goal Maintenance 28 64% 57% Basic 6 50% 67% Intermediate 7 43% 100% Sustainment 9 33% 67% Deployment 14 36% 79% Total 64 50% 69%
Table 8. % of Observations Meeting FMC and RFT Goals for CVW-8
24
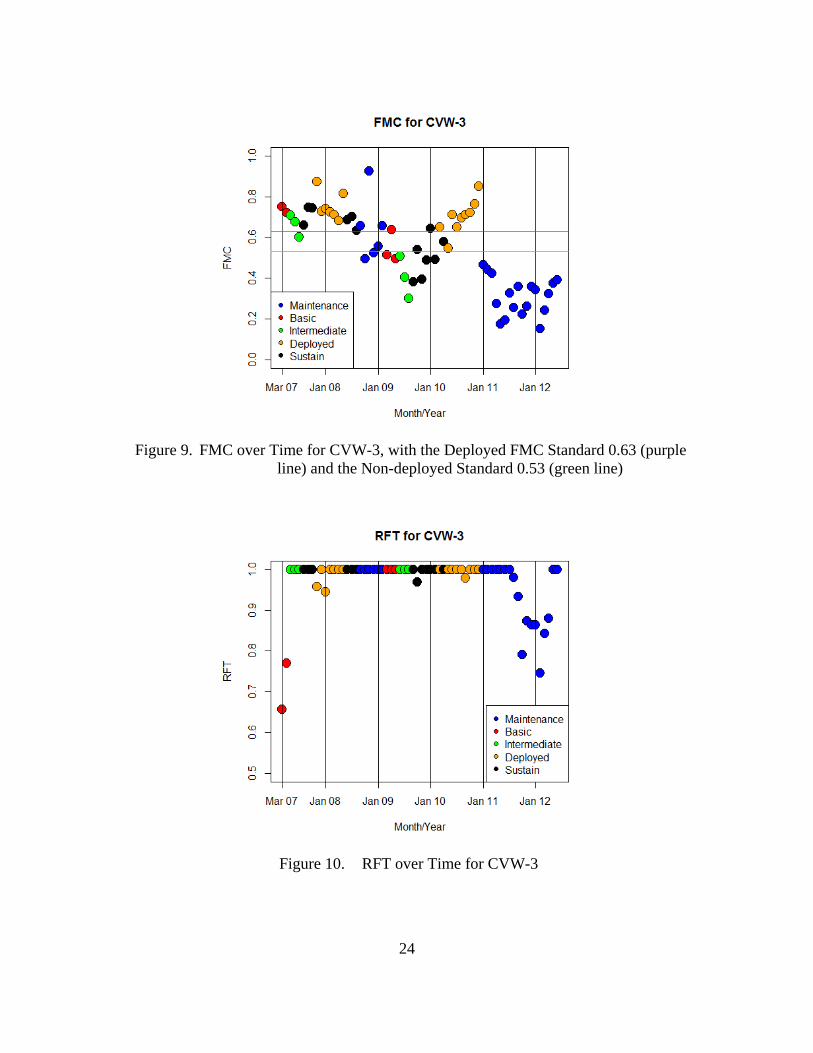
Figure 9. FMC over Time for CVW-3, with the Deployed FMC Standard 0.63 (purple
line) and the Non-deployed Standard 0.53 (green line)
Figure 10. RFT over Time for CVW-3
25
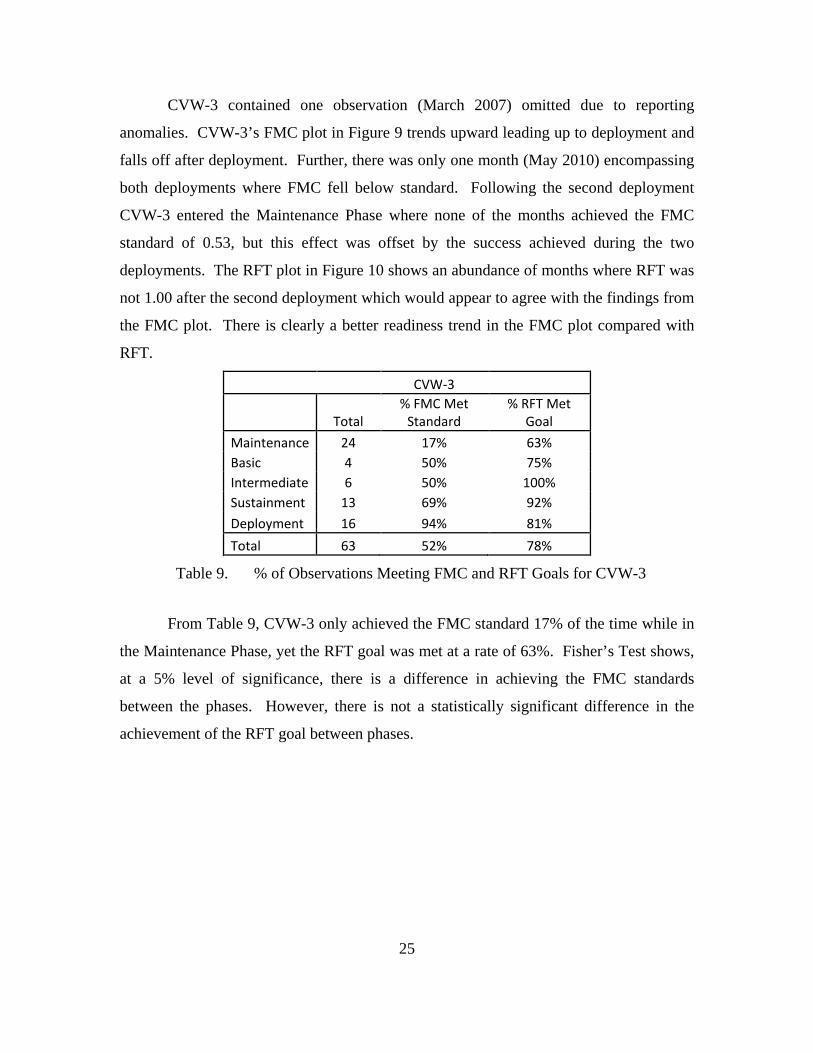
CVW-3 contained one observation (March 2007) omitted due to reporting
anomalies. CVW-3’s FMC plot in Figure 9 trends upward leading up to deployment and
falls off after deployment. Further, there was only one month (May 2010) encompassing
both deployments where FMC fell below standard. Following the second deployment
CVW-3 entered the Maintenance Phase where none of the months achieved the FMC
standard of 0.53, but this effect was offset by the success achieved during the two
deployments. The RFT plot in Figure 10 shows an abundance of months where RFT was
not 1.00 after the second deployment which would appear to agree with the findings from
the FMC plot. There is clearly a better readiness trend in the FMC plot compared with
RFT.
CVW-3
Total % FMC Met
Standard % RFT Met
Goal Maintenance 24 17% 63% Basic 4 50% 75% Intermediate 6 50% 100% Sustainment 13 69% 92% Deployment 16 94% 81% Total 63 52% 78%
Table 9. % of Observations Meeting FMC and RFT Goals for CVW-3
From Table 9, CVW-3 only achieved the FMC standard 17% of the time while in
the Maintenance Phase, yet the RFT goal was met at a rate of 63%. Fisher’s Test shows,
at a 5% level of significance, there is a difference in achieving the FMC standards
between the phases. However, there is not a statistically significant difference in the
achievement of the RFT goal between phases.
26
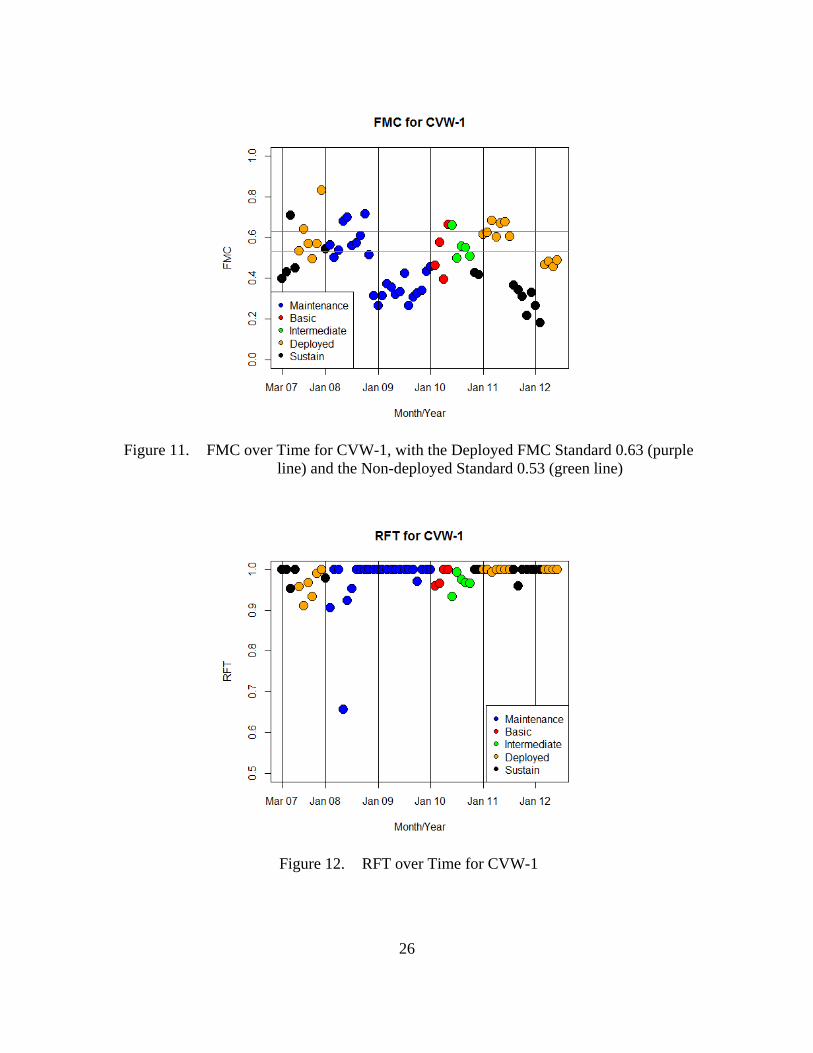
Figure 11. FMC over Time for CVW-1, with the Deployed FMC Standard 0.63 (purple
line) and the Non-deployed Standard 0.53 (green line)
Figure 12. RFT over Time for CVW-1
27
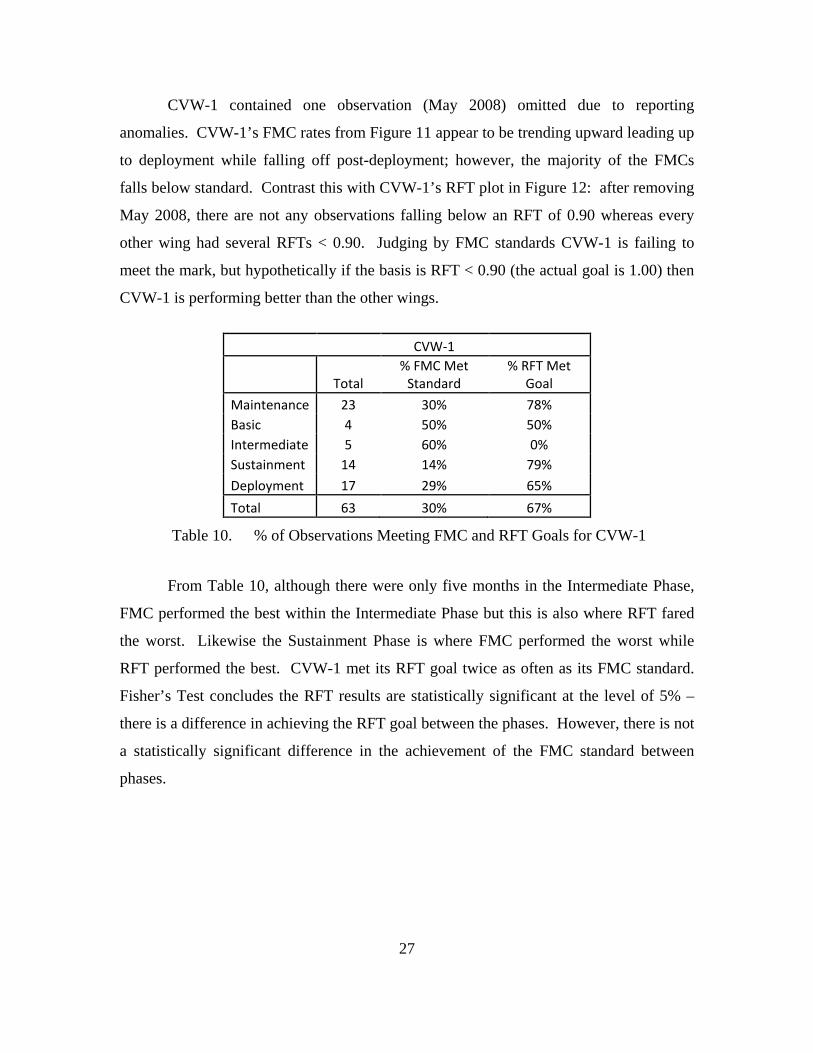
CVW-1 contained one observation (May 2008) omitted due to reporting
anomalies. CVW-1’s FMC rates from Figure 11 appear to be trending upward leading up
to deployment while falling off post-deployment; however, the majority of the FMCs
falls below standard. Contrast this with CVW-1’s RFT plot in Figure 12: after removing
May 2008, there are not any observations falling below an RFT of 0.90 whereas every
other wing had several RFTs < 0.90. Judging by FMC standards CVW-1 is failing to
meet the mark, but hypothetically if the basis is RFT < 0.90 (the actual goal is 1.00) then
CVW-1 is performing better than the other wings.
CVW-1
Total % FMC Met
Standard % RFT Met
Goal Maintenance 23 30% 78% Basic 4 50% 50% Intermediate 5 60% 0% Sustainment 14 14% 79% Deployment 17 29% 65% Total 63 30% 67%
Table 10. % of Observations Meeting FMC and RFT Goals for CVW-1
From Table 10, although there were only five months in the Intermediate Phase,
FMC performed the best within the Intermediate Phase but this is also where RFT fared
the worst. Likewise the Sustainment Phase is where FMC performed the worst while
RFT performed the best. CVW-1 met its RFT goal twice as often as its FMC standard.
Fisher’s Test concludes the RFT results are statistically significant at the level of 5% –
there is a difference in achieving the RFT goal between the phases. However, there is not
a statistically significant difference in the achievement of the FMC standard between
phases.
28
C. COMBINED RFT AND FMC PERFORMANCE RATES
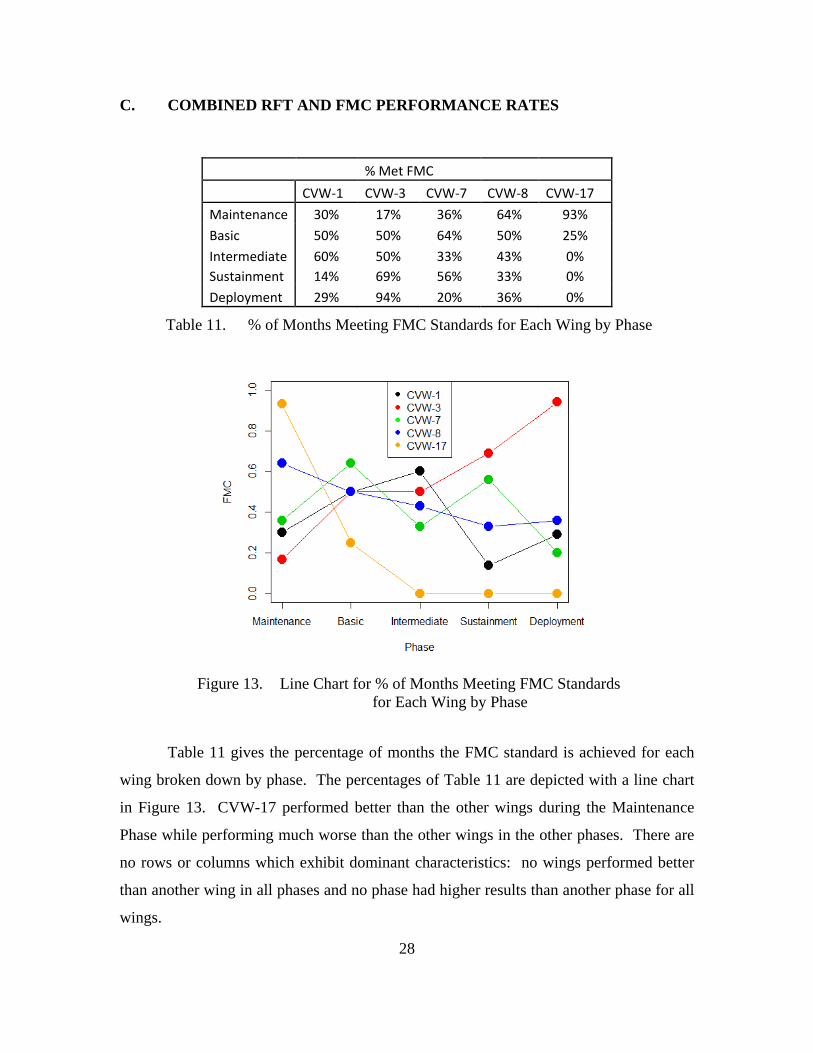
% Met FMC CVW-1 CVW-3 CVW-7 CVW-8 CVW-17 Maintenance 30% 17% 36% 64% 93% Basic 50% 50% 64% 50% 25% Intermediate 60% 50% 33% 43% 0% Sustainment 14% 69% 56% 33% 0% Deployment 29% 94% 20% 36% 0%
Table 11. % of Months Meeting FMC Standards for Each Wing by Phase
Figure 13. Line Chart for % of Months Meeting FMC Standards
for Each Wing by Phase
Table 11 gives the percentage of months the FMC standard is achieved for each
wing broken down by phase. The percentages of Table 11 are depicted with a line chart
in Figure 13. CVW-17 performed better than the other wings during the Maintenance
Phase while performing much worse than the other wings in the other phases. There are
no rows or columns which exhibit dominant characteristics: no wings performed better
than another wing in all phases and no phase had higher results than another phase for all
wings.
29
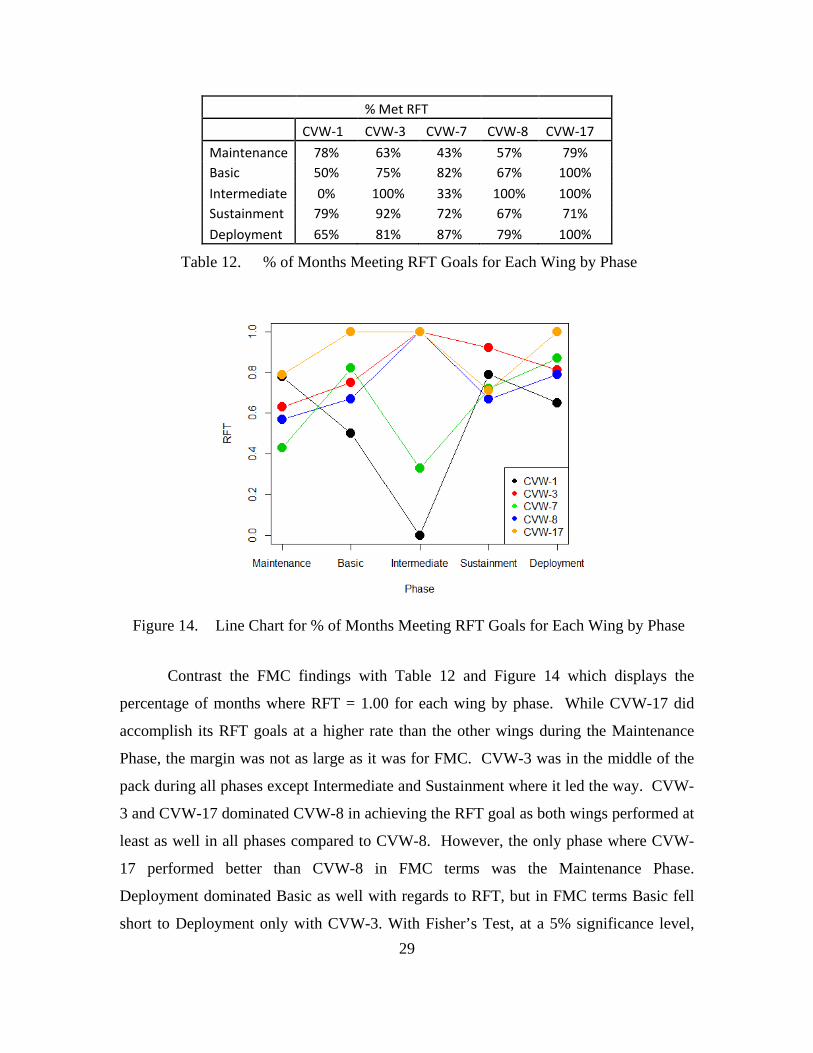
% Met RFT CVW-1 CVW-3 CVW-7 CVW-8 CVW-17 Maintenance 78% 63% 43% 57% 79% Basic 50% 75% 82% 67% 100% Intermediate 0% 100% 33% 100% 100% Sustainment 79% 92% 72% 67% 71% Deployment 65% 81% 87% 79% 100%
Table 12. % of Months Meeting RFT Goals for Each Wing by Phase
Figure 14. Line Chart for % of Months Meeting RFT Goals for Each Wing by Phase
Contrast the FMC findings with Table 12 and Figure 14 which displays the
percentage of months where RFT = 1.00 for each wing by phase. While CVW-17 did
accomplish its RFT goals at a higher rate than the other wings during the Maintenance
Phase, the margin was not as large as it was for FMC. CVW-3 was in the middle of the
pack during all phases except Intermediate and Sustainment where it led the way. CVW-
3 and CVW-17 dominated CVW-8 in achieving the RFT goal as both wings performed at
least as well in all phases compared to CVW-8. However, the only phase where CVW-
17 performed better than CVW-8 in FMC terms was the Maintenance Phase.
Deployment dominated Basic as well with regards to RFT, but in FMC terms Basic fell
short to Deployment only with CVW-3. With Fisher’s Test, at a 5% significance level,
30
neither the phase nor the wing impacts the ability to achieve either the FMC standard or
the RFT goal when evaluated as a whole. Knowing the wing (without the phase) does
not help one predict whether FMC and/or RFT will be met, and knowing the phase
(without the wing) is not helpful either. The combination of the wing and the phase is
significant though for certain wings/phases as shown in the previous section.
Specifically, phase mattered in FMC standards for CVW-3 and CVW-17 while phase was
a factor in the achievement of a perfect monthly RFT for CVW-1 and CVW-7.
D. SUMMARY
There are three key observations from the comparisons of RFT and FMC:
1. Correlation between RFT and FMC is Small but Inconclusive
The correlation between RFT and FMC is 0.17, which demonstrates a small but
inconclusive relationship. In fact both CVW-1 and CVW-17 had negative correlation
coefficients: as RFT improved, FMC declined. RFT appears to increase with FMC with
the exception of the interval from FMC = 0.5 to FMC = 0.65. This interval includes the
FMC standards for the Super Hornet: 0.63 for deployed, 0.53 for non-deployed, and 0.58
overall. The decline in RFT over this interval is interesting and it prevents the correlation
from being stronger. RFT and FMC are not measuring the same aspects of readiness.
2. RFT and FMC were not Systematically Affected by Wing or Phase
At a 5% significance level, neither the phase nor the wing showed systematic
differences in the ability to achieve either the FMC standard or the RFT goal when
evaluated as a whole. Knowing the wing (without the phase) does not help one predict
whether FMC and/or RFT will be met, while knowing the phase (without the wing) is not
helpful either. The combination of the wing and the phase is significant though for
certain wings/phases. Specifically, phase mattered in the accomplishment of FMC for
CVW-3 and CVW-17 while phase was a factor in the achievement of a perfect monthly
RFT for CVW-1 and CVW-7.
31
3. FMC Presents a Clearer Readiness Trend than RFT
There are trends in overall readiness one can detect with the FMC plots that
cannot be observed from RFT. For example, with FMC one can discern readiness
increasing leading to deployment and then falling post-deployment. This difference in
trends can be explained by the excess readiness available in RFT while there is no such
thing as excess readiness for FMC. Imagine a scenario where there are 10 A/C that can
perform all required missions, but the RFT Entitled is five. Only five of the A/C will
contribute towards the RFT fraction since by definition RFT Actual cannot exceed RFT
Entitled. In contrast, all 10 A/C contribute to the FMC fraction. Thus when utilized as
fractions, FMC provides a clearer picture of readiness than RFT.

32
THIS PAGE INTENTIONALLY LEFT BLANK
33
IV. TYPICAL TRENDS WITHIN THE INTER-DEPLOYMENT CYCLE
A. INTRODUCTION
This chapter begins by describing the phases within the inter-deployment cycle in
more detail. In the aim of providing visual clarity of trends among phases, scatterplots of
each variable considered within this analysis are also provided. These scatterplots
illustrate the relationships between variables and show how different variables change
during the course of the 27-month FRTP. Explanations for the trends are also suggested.
Further, plots of RFT Actual and RFT are provided for comparison of the two, although
RFT Actual is not utilized in any models to predict RFT in this thesis.
B. PHASES WITHIN THE FRTP
The FRTP contains five distinct phases: Maintenance, Basic, Intermediate,
Sustainment, and Deployment. Each phase corresponds to specific readiness,
maintenance, and performance expectations with the underlying goal of being as prepared
as possible to conduct operational missions during scheduled deployments and
unscheduled contingencies. Different air wings are in different phases of the FRTP at
any given moment, and the FRTP is designed to last 27 months. During the Maintenance
Phase extensive maintenance is performed to extend the lifetime of the A/C. Training at
the unit level is conducted during the Basic Phase, while the wings integrate with their
aircraft carriers and CSGs during the Intermediate Phase. This is also the phase where
the major pre-deployment exercise for the battle group - COMPTUEX – is conducted. A
wing is ready to deploy at short notice during the Sustainment Phase and this
immediately precedes and follows the Deployment. The taxpayers receive their returns
on investment during the Deployment Phase when the wing and battle group is typically
underway at least six months. This is when readiness is desired to be at its apex (Sanford
2007).
Within this dataset of 293 wing/month observations, on average wings spent nine
months in the Maintenance Phase and all wings entered the Basic Phase from
34
Maintenance. Wings spent three months in the Basic Phase and 89% transitioned to the
Intermediate Phase from Basic. Wings spent three months in the Intermediate Phase and
89% transitioned to the Sustainment Phase. Wings spent three months in the Sustainment
Phase and they either transitioned to Deployment or Maintenance depending upon
whether they were ramping up for deployment or returning home. Wings spent six
months in Deployment and 91% entered the Sustainment Phase.
While the FRTP is designed to last 27 months, operational requirements and
world events often require modifications to this schedule. For example, CVW-7
embarked on back-to-back deployments 2009 and 2010 and as a result the COMPTUEX
took place during the Sustainment Phase instead of Intermediate. This chapter provides
plots of variables along the FRTP with color-coded phases as introduced in Chapter III:
blue – Maintenance; red – Basic; green – Intermediate; black – Sustainment; and gold –
Deployment. This technique provides a visual reference to help one grasp the ebbs and
flows during the inter-deployment cycle.
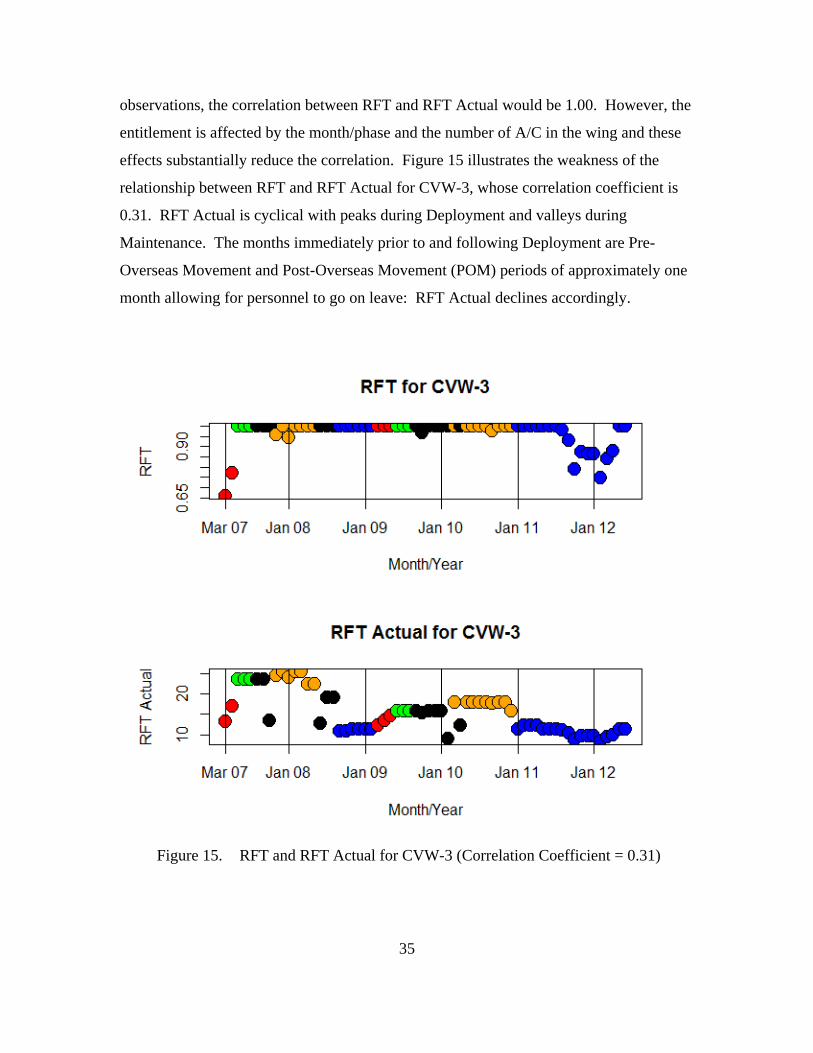
C. RFT AND RFT ACTUAL
Of the variables considered in this thesis, RFT is most strongly related with RFT
Actual – the average number of A/C designated RFT during a month – with a correlation
coefficient of 0.28 (a low correlation; definite but small relationship). A 1.00 value
indicates a perfect positive linear relationship (as one variable goes up, the other variable
goes up by a constant proportion); while a -1.00 value indicates a perfect negative linear
relationship (as one variable goes up, the other variable goes down by a constant
proportion). A 0.00 coefficient indicates no linear relationship whatsoever. The 2011
LMI study regarding the readiness impacts of aviation spares funding levels will be used
as a guide to assess correlation strength as was done in Chapter III (Buckley et al. 2011).
Since RFT is calculated as RFT Actual divided by RFT Entitled and the entitlement is
more informative than the actual, RFT Actual will not be considered while retaining RFT
Entitled.
As the daily average of A/C designated RFT increases (RFT Actual), an increase
in the fraction of RFT is expected. If the RFT Entitled was constant for all 293
35
observations, the correlation between RFT and RFT Actual would be 1.00. However, the
entitlement is affected by the month/phase and the number of A/C in the wing and these
effects substantially reduce the correlation. Figure 15 illustrates the weakness of the
relationship between RFT and RFT Actual for CVW-3, whose correlation coefficient is
0.31. RFT Actual is cyclical with peaks during Deployment and valleys during
Maintenance. The months immediately prior to and following Deployment are Pre-
Overseas Movement and Post-Overseas Movement (POM) periods of approximately one
month allowing for personnel to go on leave: RFT Actual declines accordingly.
Figure 15. RFT and RFT Actual for CVW-3 (Correlation Coefficient = 0.31)
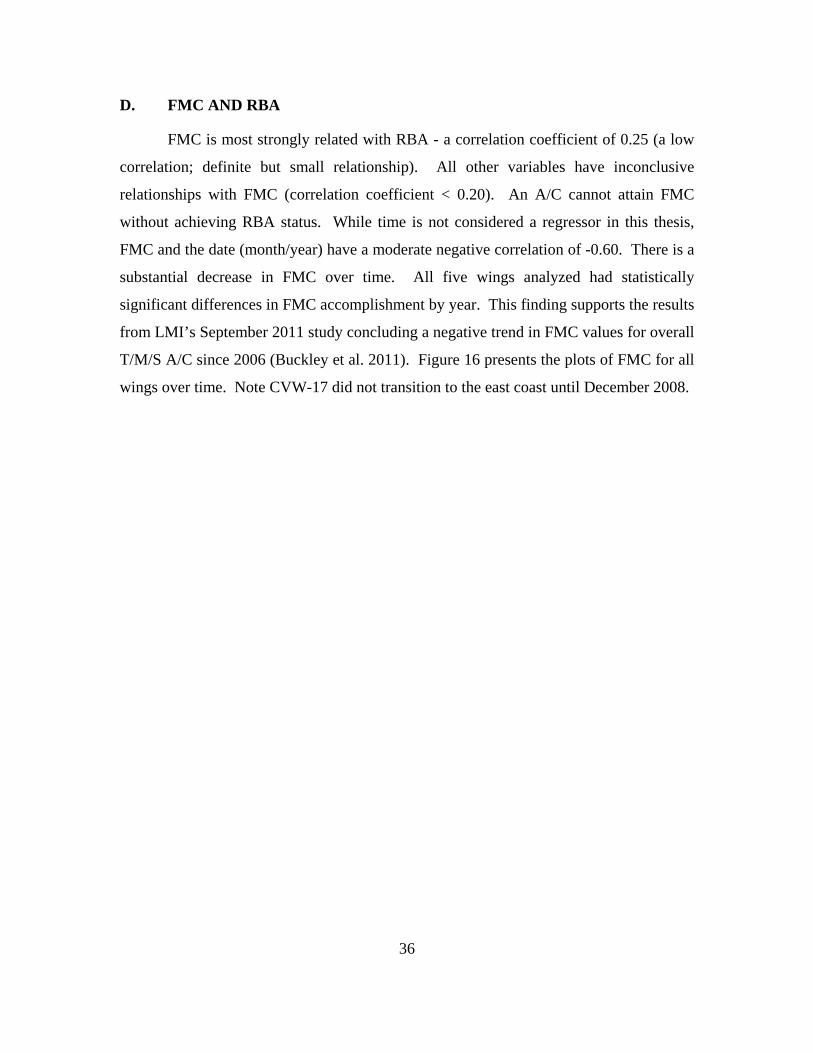
36
D. FMC AND RBA
FMC is most strongly related with RBA - a correlation coefficient of 0.25 (a low
correlation; definite but small relationship). All other variables have inconclusive
relationships with FMC (correlation coefficient < 0.20). An A/C cannot attain FMC
without achieving RBA status. While time is not considered a regressor in this thesis,
FMC and the date (month/year) have a moderate negative correlation of -0.60. There is a
substantial decrease in FMC over time. All five wings analyzed had statistically
significant differences in FMC accomplishment by year. This finding supports the results
from LMI’s September 2011 study concluding a negative trend in FMC values for overall
T/M/S A/C since 2006 (Buckley et al. 2011). Figure 16 presents the plots of FMC for all
wings over time. Note CVW-17 did not transition to the east coast until December 2008.
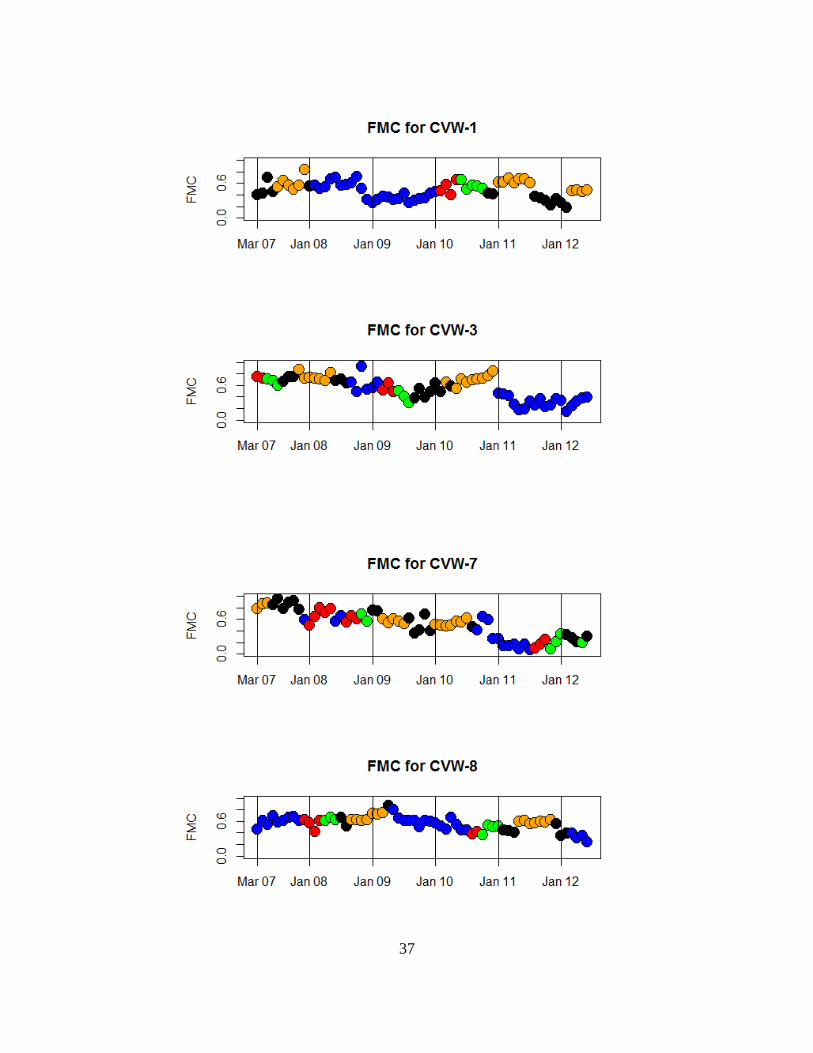
37
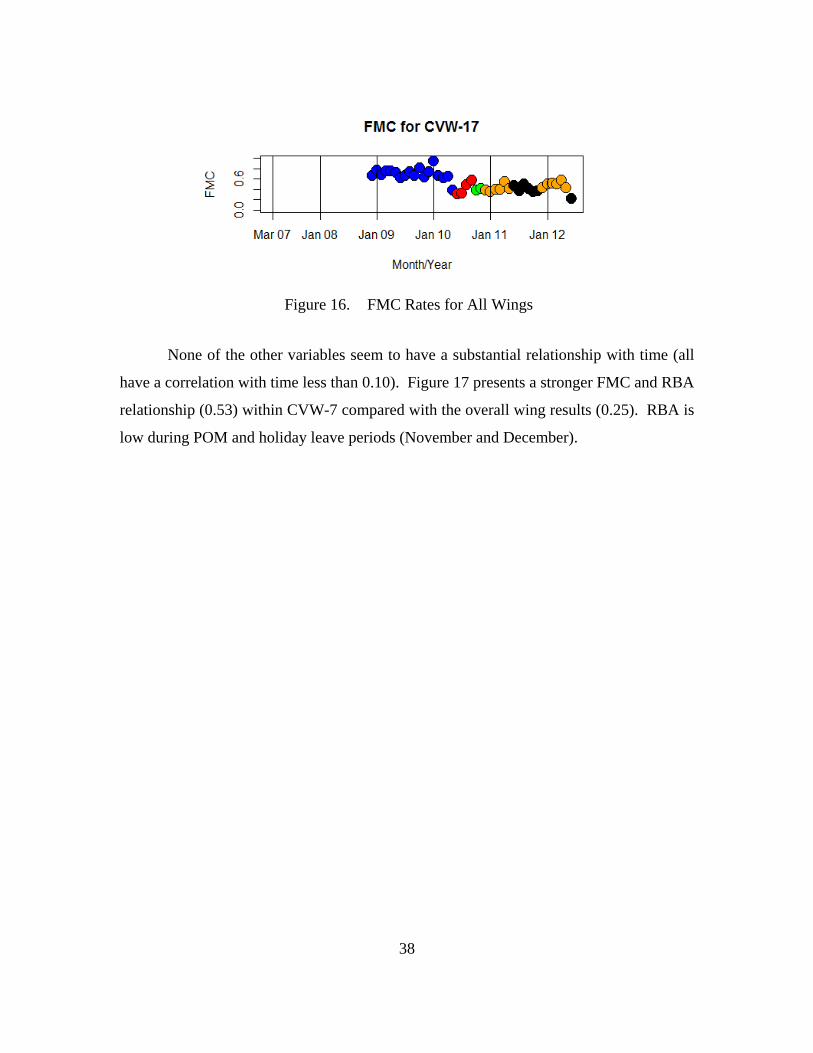
38
Figure 16. FMC Rates for All Wings
None of the other variables seem to have a substantial relationship with time (all
have a correlation with time less than 0.10). Figure 17 presents a stronger FMC and RBA
relationship (0.53) within CVW-7 compared with the overall wing results (0.25). RBA is
low during POM and holiday leave periods (November and December).
39
Figure 17. FMC and RBA for CVW-7 (Correlation Coefficient = 0.53 for FMC and
RBA)
E. RFT ACTUAL AND RFT ENTITLED
RFT Actual has a very strong positive linear relationship with several variables
including RFT Entitled (0.99), TFHR Entitled (0.98), FHRS Entitled (0.96), FLA Entitled
(0.93), and RBA (0.90). A marked relationship exists with FLA (0.86) and Assigned A/C
(0.82). RFT Actual trends closely with RFT Entitled as a result of the finding from
Chapter III that 72.4% of wing/month combinations achieved a perfect RFT = 1.00
(where RFT Actual equals RFT Entitled). Since more flight hours required for training
and mission accomplishment generate an increase in demand for RFT A/C, the variables
RFT Actual, TFHR Entitled, and FHRS Entitled are strongly related with one another.
Similarly as the number of A/C required increases, the number of A/C assigned to the
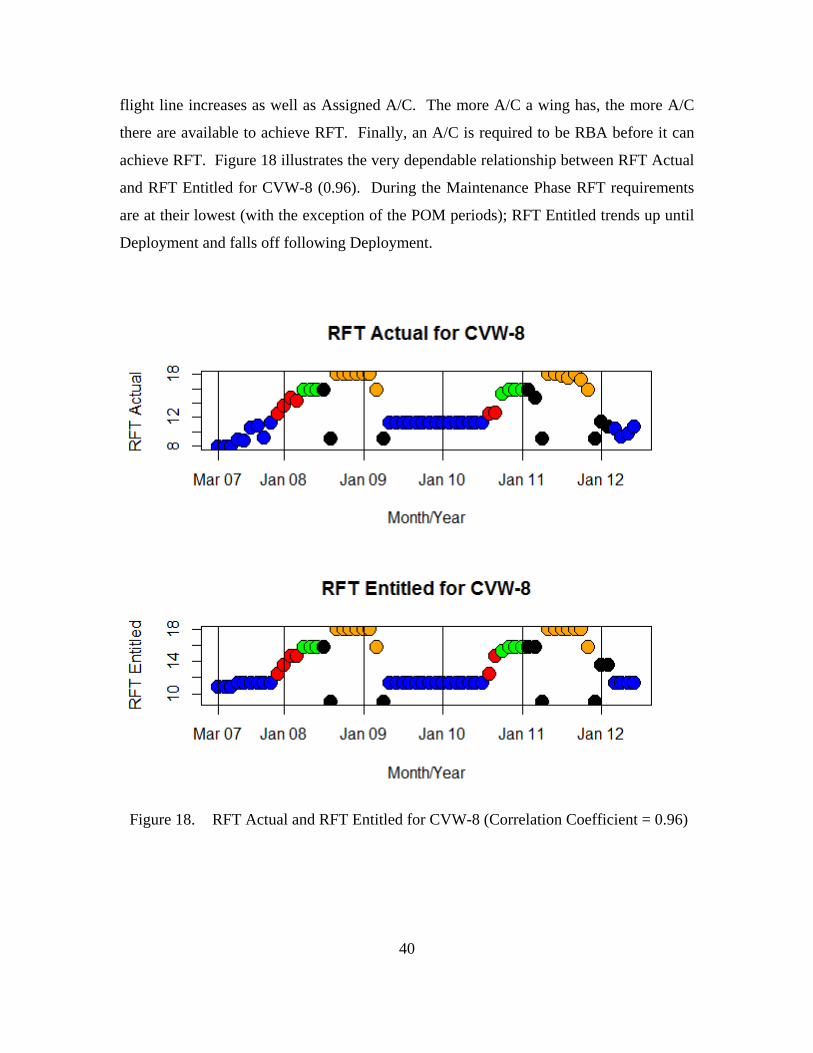
40
flight line increases as well as Assigned A/C. The more A/C a wing has, the more A/C
there are available to achieve RFT. Finally, an A/C is required to be RBA before it can
achieve RFT. Figure 18 illustrates the very dependable relationship between RFT Actual
and RFT Entitled for CVW-8 (0.96). During the Maintenance Phase RFT requirements
are at their lowest (with the exception of the POM periods); RFT Entitled trends up until
Deployment and falls off following Deployment.
Figure 18. RFT Actual and RFT Entitled for CVW-8 (Correlation Coefficient = 0.96)
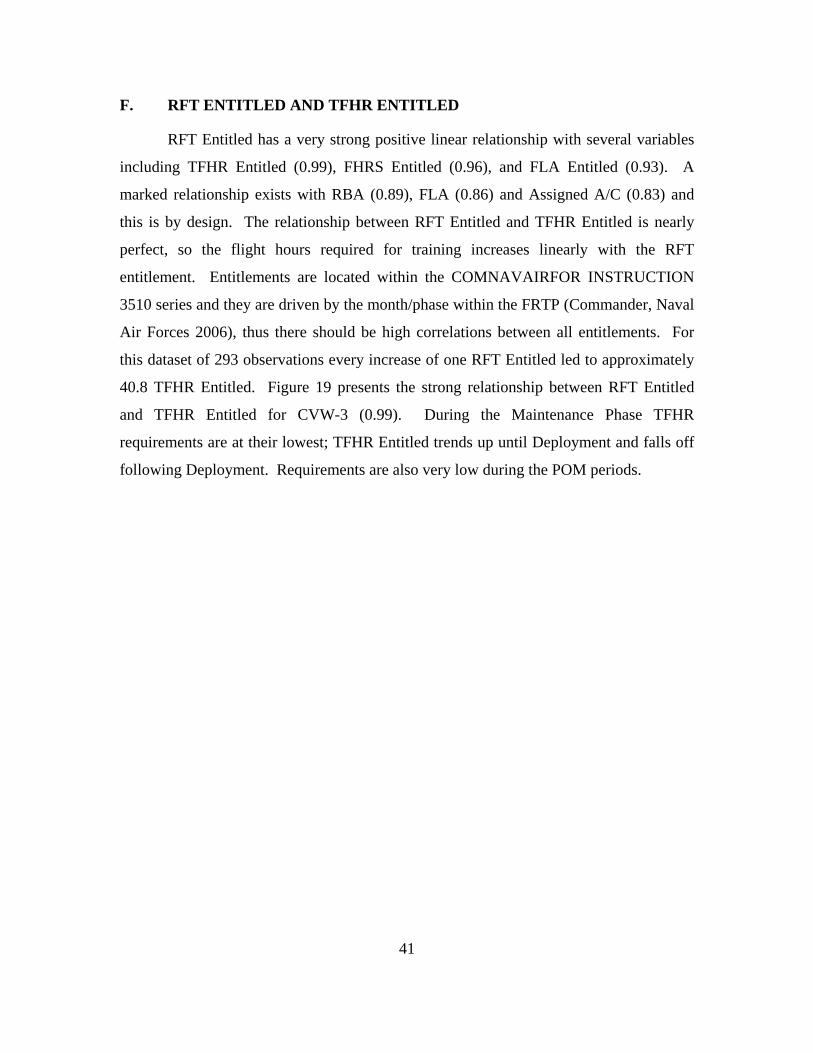
41
F. RFT ENTITLED AND TFHR ENTITLED
RFT Entitled has a very strong positive linear relationship with several variables
including TFHR Entitled (0.99), FHRS Entitled (0.96), and FLA Entitled (0.93). A
marked relationship exists with RBA (0.89), FLA (0.86) and Assigned A/C (0.83) and
this is by design. The relationship between RFT Entitled and TFHR Entitled is nearly
perfect, so the flight hours required for training increases linearly with the RFT
entitlement. Entitlements are located within the COMNAVAIRFOR INSTRUCTION
3510 series and they are driven by the month/phase within the FRTP (Commander, Naval
Air Forces 2006), thus there should be high correlations between all entitlements. For
this dataset of 293 observations every increase of one RFT Entitled led to approximately
40.8 TFHR Entitled. Figure 19 presents the strong relationship between RFT Entitled
and TFHR Entitled for CVW-3 (0.99). During the Maintenance Phase TFHR
requirements are at their lowest; TFHR Entitled trends up until Deployment and falls off
following Deployment. Requirements are also very low during the POM periods.
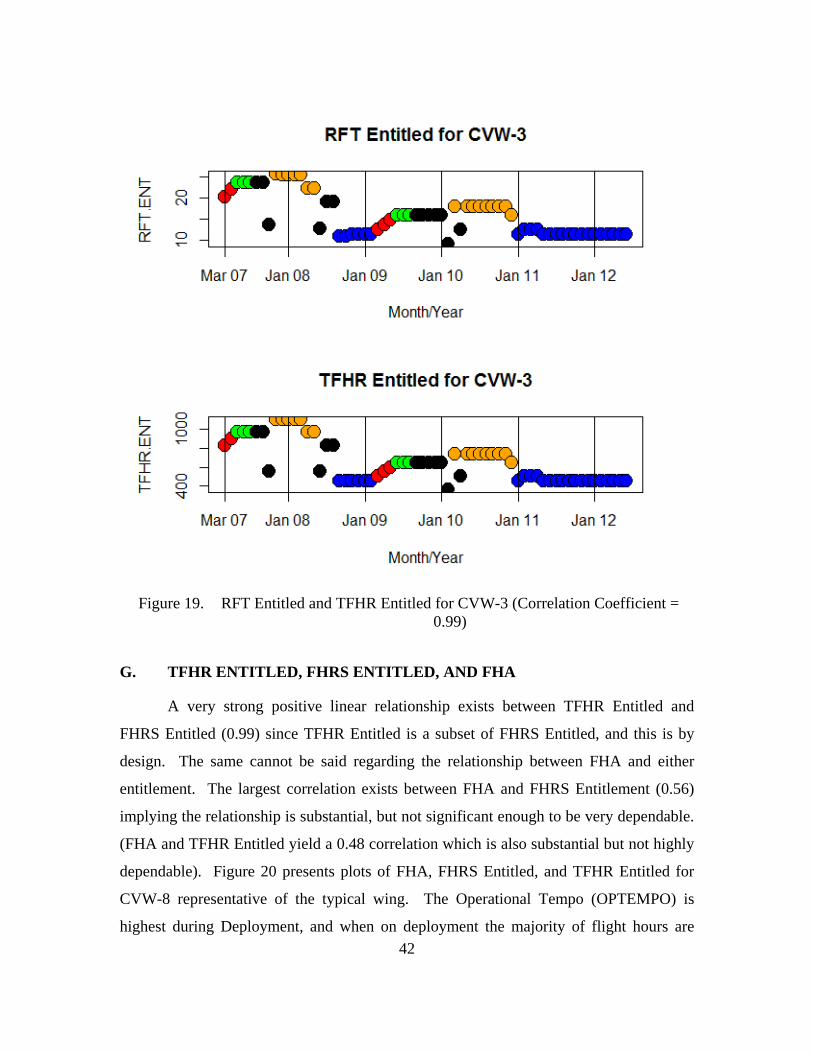
42
Figure 19. RFT Entitled and TFHR Entitled for CVW-3 (Correlation Coefficient =
0.99)
G. TFHR ENTITLED, FHRS ENTITLED, AND FHA
A very strong positive linear relationship exists between TFHR Entitled and
FHRS Entitled (0.99) since TFHR Entitled is a subset of FHRS Entitled, and this is by
design. The same cannot be said regarding the relationship between FHA and either
entitlement. The largest correlation exists between FHA and FHRS Entitlement (0.56)
implying the relationship is substantial, but not significant enough to be very dependable.
(FHA and TFHR Entitled yield a 0.48 correlation which is also substantial but not highly
dependable). Figure 20 presents plots of FHA, FHRS Entitled, and TFHR Entitled for
CVW-8 representative of the typical wing. The Operational Tempo (OPTEMPO) is
highest during Deployment, and when on deployment the majority of flight hours are
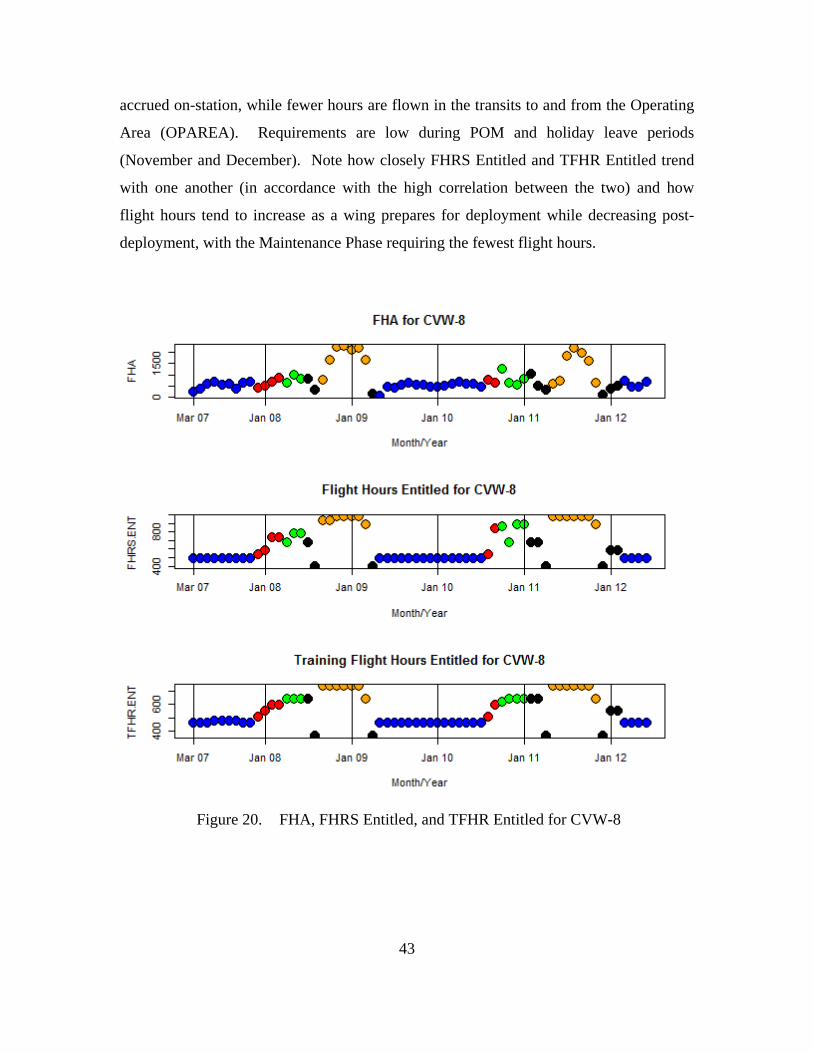
43
accrued on-station, while fewer hours are flown in the transits to and from the Operating
Area (OPAREA). Requirements are low during POM and holiday leave periods
(November and December). Note how closely FHRS Entitled and TFHR Entitled trend
with one another (in accordance with the high correlation between the two) and how
flight hours tend to increase as a wing prepares for deployment while decreasing post-
deployment, with the Maintenance Phase requiring the fewest flight hours.
Figure 20. FHA, FHRS Entitled, and TFHR Entitled for CVW-8
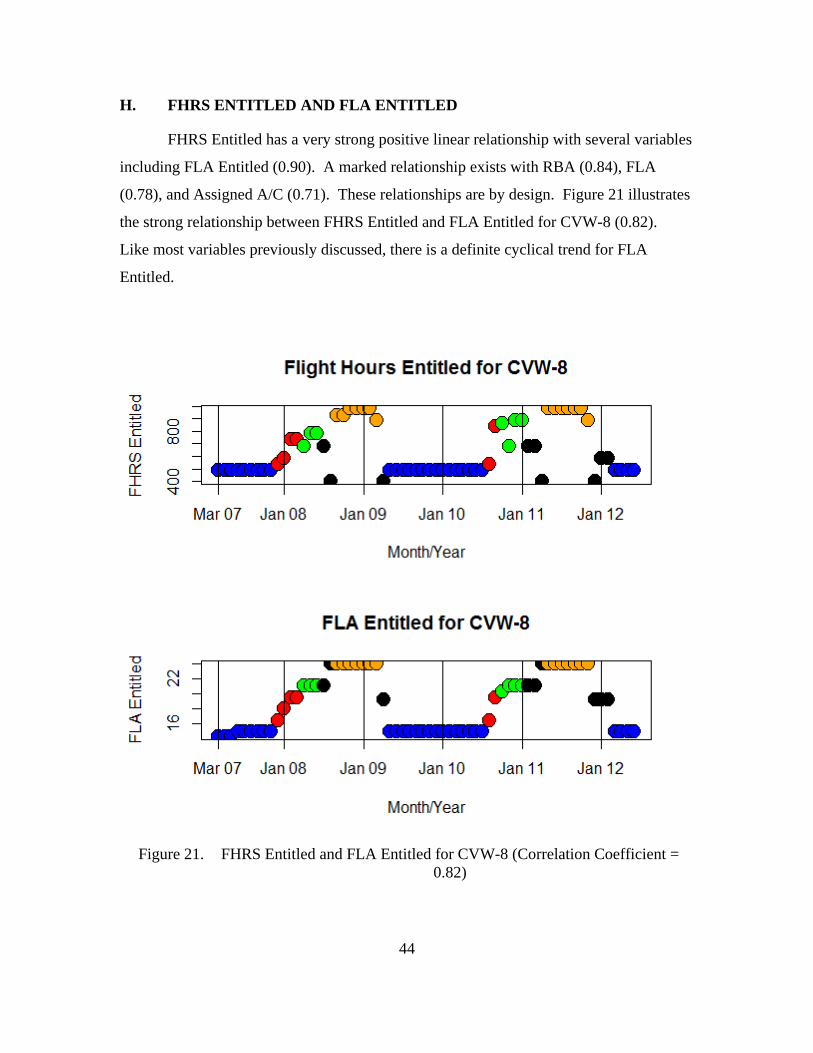
44
H. FHRS ENTITLED AND FLA ENTITLED
FHRS Entitled has a very strong positive linear relationship with several variables
including FLA Entitled (0.90). A marked relationship exists with RBA (0.84), FLA
(0.78), and Assigned A/C (0.71). These relationships are by design. Figure 21 illustrates
the strong relationship between FHRS Entitled and FLA Entitled for CVW-8 (0.82).
Like most variables previously discussed, there is a definite cyclical trend for FLA
Entitled.
Figure 21. FHRS Entitled and FLA Entitled for CVW-8 (Correlation Coefficient =
0.82)
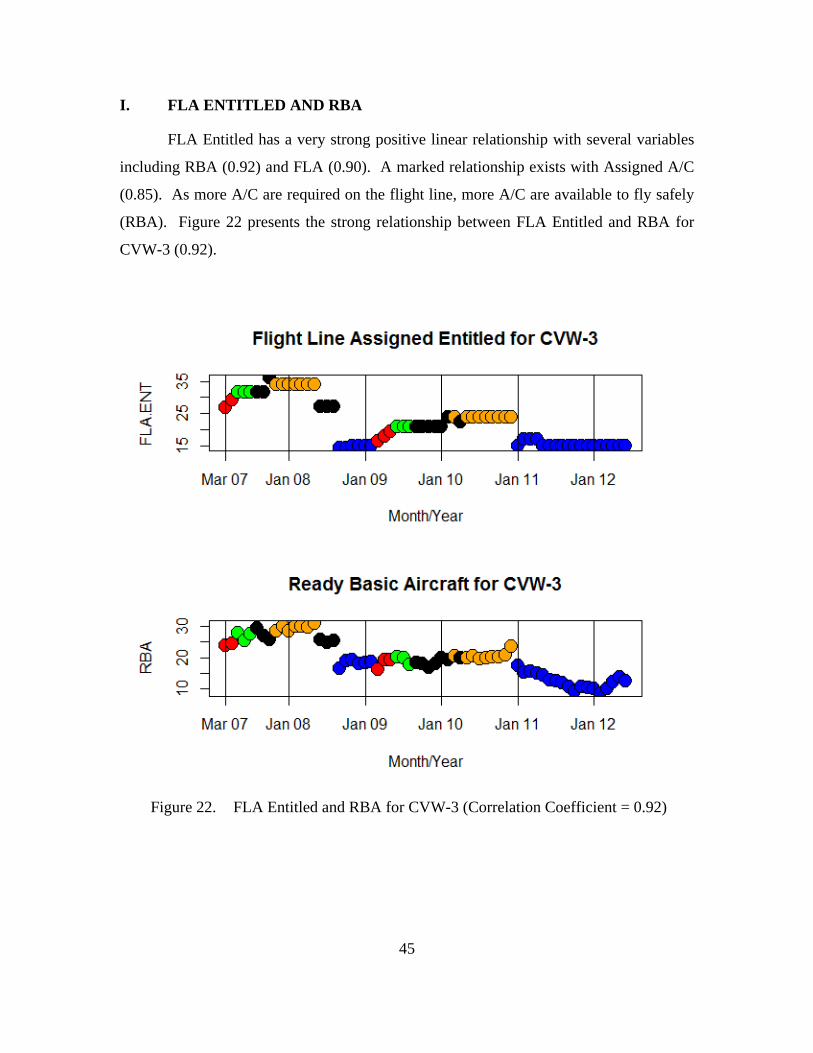
45
I. FLA ENTITLED AND RBA
FLA Entitled has a very strong positive linear relationship with several variables
including RBA (0.92) and FLA (0.90). A marked relationship exists with Assigned A/C
(0.85). As more A/C are required on the flight line, more A/C are available to fly safely
(RBA). Figure 22 presents the strong relationship between FLA Entitled and RBA for
CVW-3 (0.92).
Figure 22. FLA Entitled and RBA for CVW-3 (Correlation Coefficient = 0.92)
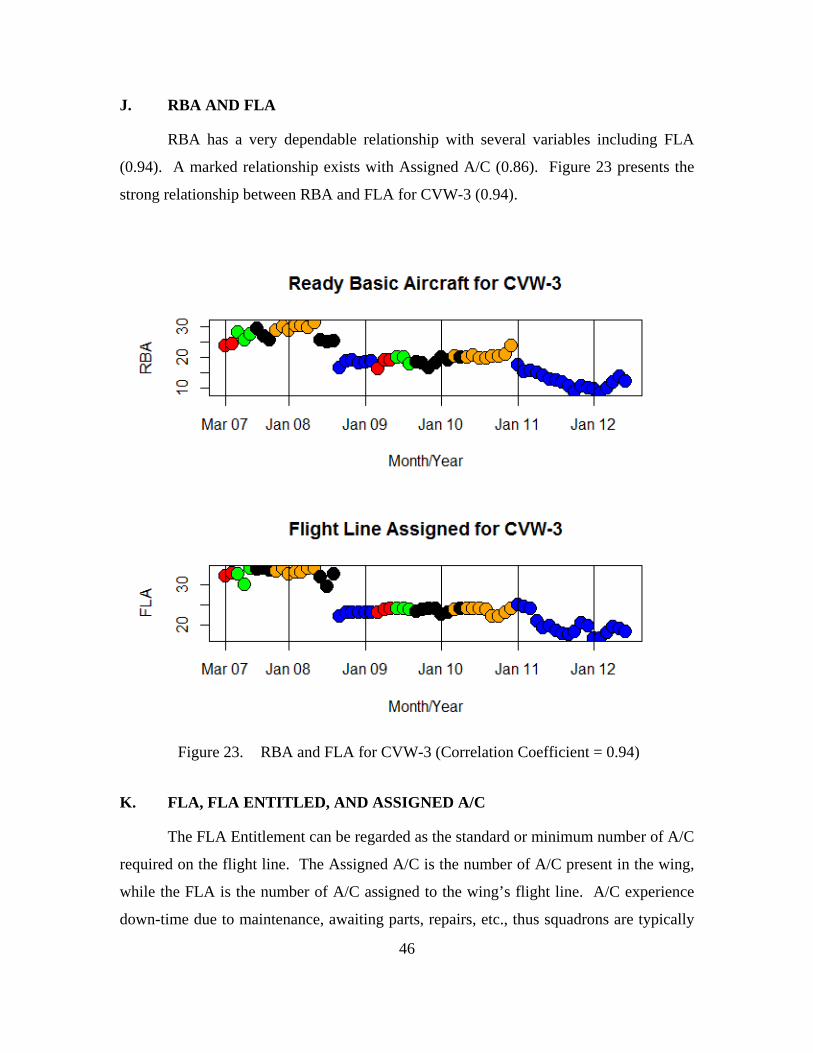
46
J. RBA AND FLA
RBA has a very dependable relationship with several variables including FLA
(0.94). A marked relationship exists with Assigned A/C (0.86). Figure 23 presents the
strong relationship between RBA and FLA for CVW-3 (0.94).
Figure 23. RBA and FLA for CVW-3 (Correlation Coefficient = 0.94)
K. FLA, FLA ENTITLED, AND ASSIGNED A/C
The FLA Entitlement can be regarded as the standard or minimum number of A/C
required on the flight line. The Assigned A/C is the number of A/C present in the wing,
while the FLA is the number of A/C assigned to the wing’s flight line. A/C experience
down-time due to maintenance, awaiting parts, repairs, etc., thus squadrons are typically
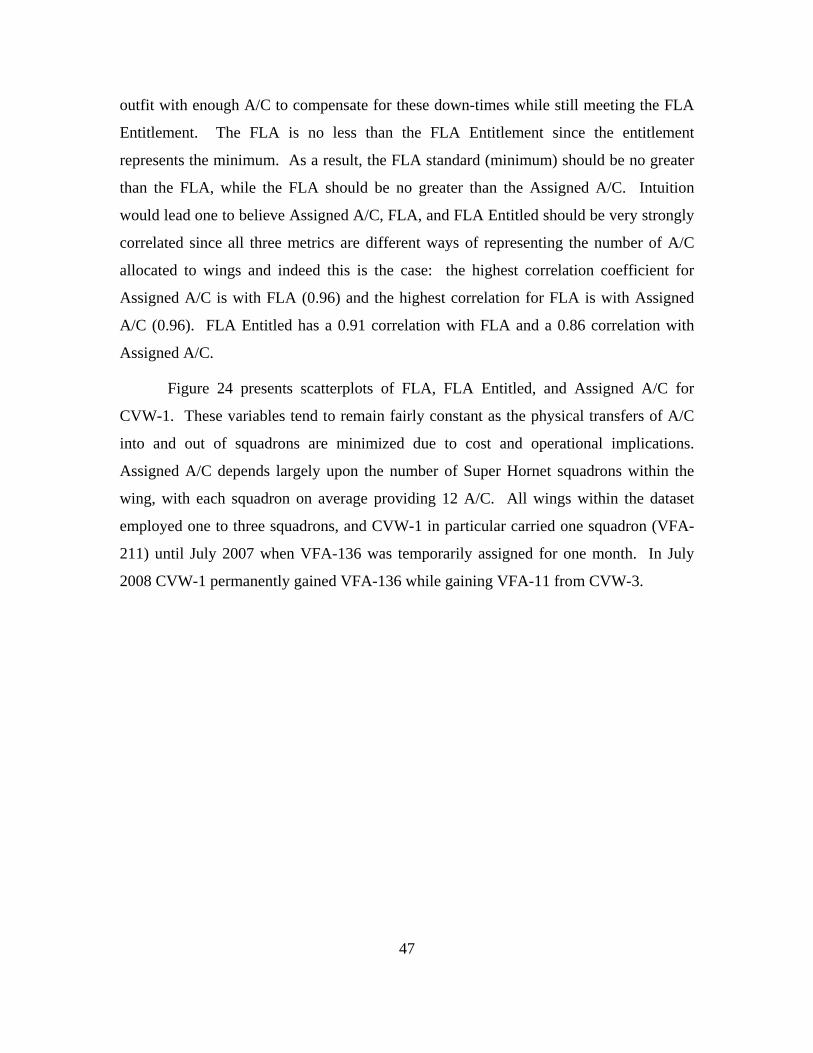
47
outfit with enough A/C to compensate for these down-times while still meeting the FLA
Entitlement. The FLA is no less than the FLA Entitlement since the entitlement
represents the minimum. As a result, the FLA standard (minimum) should be no greater
than the FLA, while the FLA should be no greater than the Assigned A/C. Intuition
would lead one to believe Assigned A/C, FLA, and FLA Entitled should be very strongly
correlated since all three metrics are different ways of representing the number of A/C
allocated to wings and indeed this is the case: the highest correlation coefficient for
Assigned A/C is with FLA (0.96) and the highest correlation for FLA is with Assigned
A/C (0.96). FLA Entitled has a 0.91 correlation with FLA and a 0.86 correlation with
Assigned A/C.
Figure 24 presents scatterplots of FLA, FLA Entitled, and Assigned A/C for
CVW-1. These variables tend to remain fairly constant as the physical transfers of A/C
into and out of squadrons are minimized due to cost and operational implications.
Assigned A/C depends largely upon the number of Super Hornet squadrons within the
wing, with each squadron on average providing 12 A/C. All wings within the dataset
employed one to three squadrons, and CVW-1 in particular carried one squadron (VFA-
211) until July 2007 when VFA-136 was temporarily assigned for one month. In July
2008 CVW-1 permanently gained VFA-136 while gaining VFA-11 from CVW-3.
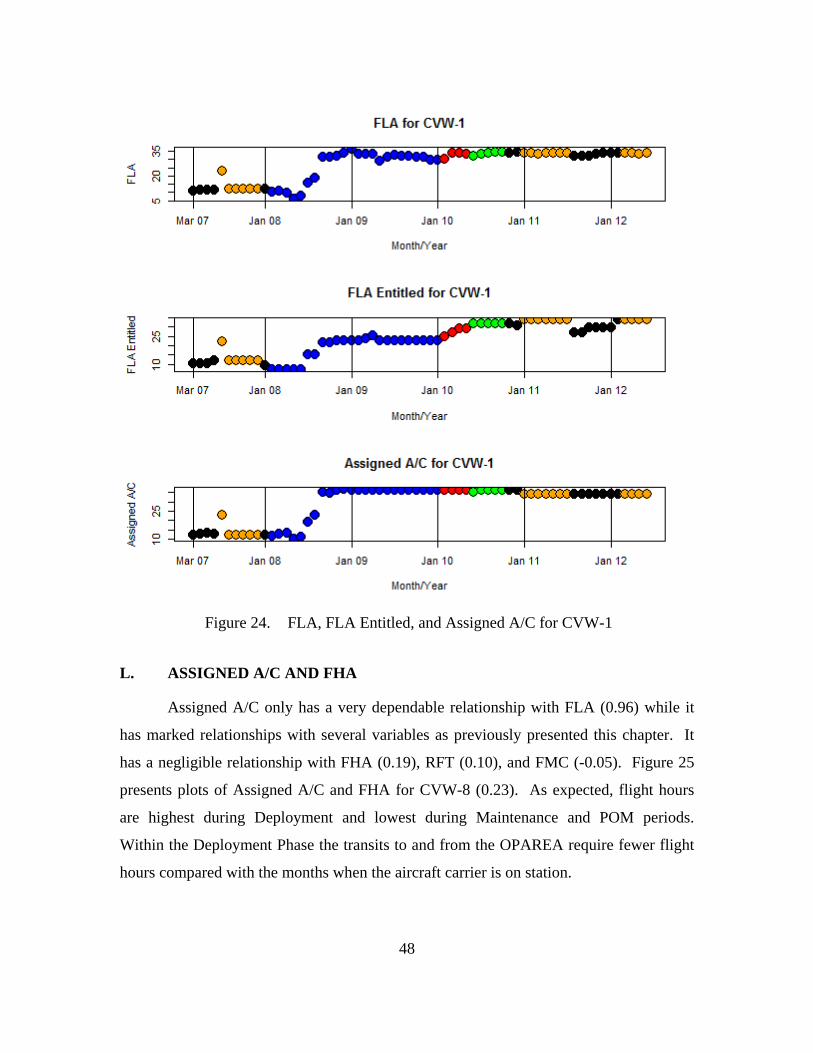
48
Figure 24. FLA, FLA Entitled, and Assigned A/C for CVW-1
L. ASSIGNED A/C AND FHA
Assigned A/C only has a very dependable relationship with FLA (0.96) while it
has marked relationships with several variables as previously presented this chapter. It
has a negligible relationship with FHA (0.19), RFT (0.10), and FMC (-0.05). Figure 25
presents plots of Assigned A/C and FHA for CVW-8 (0.23). As expected, flight hours
are highest during Deployment and lowest during Maintenance and POM periods.
Within the Deployment Phase the transits to and from the OPAREA require fewer flight
hours compared with the months when the aircraft carrier is on station.
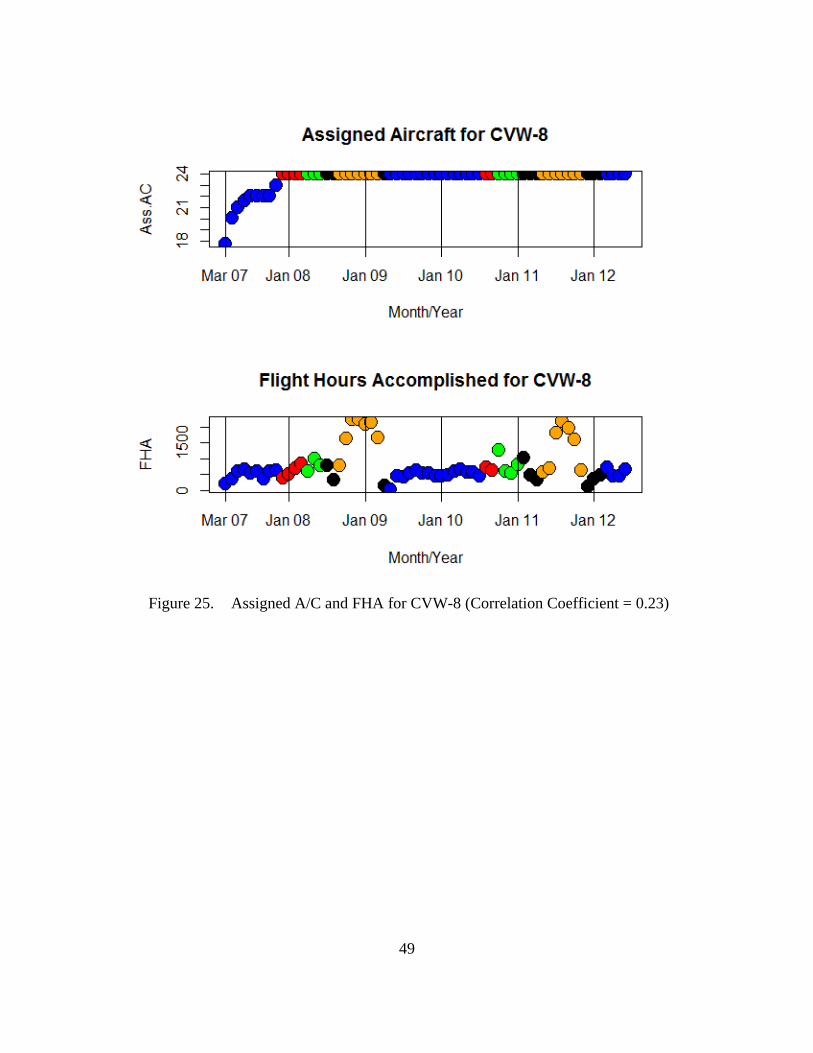
49
Figure 25. Assigned A/C and FHA for CVW-8 (Correlation Coefficient = 0.23)

50
THIS PAGE INTENTIONALLY LEFT BLANK
51
V. MODELING ANALYSIS
A. OBJECTIVE
The previous chapter studied the relationships variables have with one another
and their trends during the FRTP. In this chapter we will fit two models to provide
insight into the combined effects of the variables on RFT. One model will fit a logistic
regression to predict when a wing will achieve a perfect 1.00 RFT for a particular month.
The second model will utilize a multiple regression approach incorporating only those
observations of RFT falling below 1.00. Taken together these two models provide a
mixture model of RFT as a function of the 11 variables considered in this thesis. As
noted earlier, it is extremely rare but possible for RFT to be below FMC during a month.
However, this dataset contained six observations where RFT was significantly below
FMC without a reasonable explanation beyond errors in the respective values reported.
Thus, these six anomalies were removed from the dataset and 293 observations remained
for analysis. The removed observations are: CVW-1 May 2008, CVW-3 March 2007,
and CVW-17 October 2009 through January 2010.
B. LOGISTIC REGRESSION MODEL
The commander’s goal each month is to achieve a perfect RFT (1.00). If there are
any days where a 1.00 RFT is not achieved, the commander will fall short of the monthly
1.00 RFT goal. Anything below 1.00 RFT is below goal, therefore it is useful to
incorporate a model which predicts whether a wing will achieve a 1.00 RFT during a
month and a logistic regression model is produced for this purpose. Within the dataset a
binary variable replaces RFT % with 1 being assigned when a perfect RFT is achieved
(success) and 0 being assigned otherwise (failure).
Observations of 1.00 RFT correspond to higher averages of all variables than
observations below 1.00 RFT (Table 13). While wing commanders always endeavor to
achieve a perfect RFT, they are most concerned with achieving maximum readiness
during deployments and least concerned during the Maintenance Phase and the results
bear this out (Table 14). CVW-17 performed the best using the percentage of months
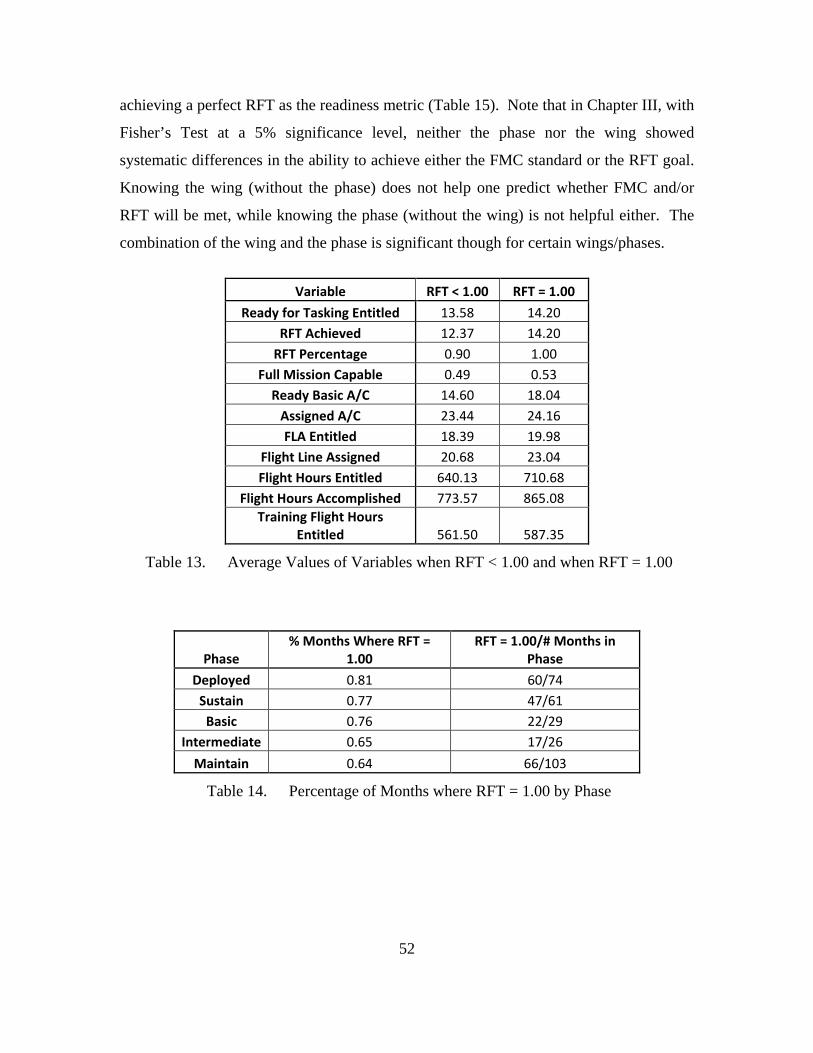
52
achieving a perfect RFT as the readiness metric (Table 15). Note that in Chapter III, with
Fisher’s Test at a 5% significance level, neither the phase nor the wing showed
systematic differences in the ability to achieve either the FMC standard or the RFT goal.
Knowing the wing (without the phase) does not help one predict whether FMC and/or
RFT will be met, while knowing the phase (without the wing) is not helpful either. The
combination of the wing and the phase is significant though for certain wings/phases.
Variable RFT < 1.00 RFT = 1.00 Ready for Tasking Entitled 13.58 14.20
RFT Achieved 12.37 14.20 RFT Percentage 0.90 1.00
Full Mission Capable 0.49 0.53 Ready Basic A/C 14.60 18.04
Assigned A/C 23.44 24.16 FLA Entitled 18.39 19.98
Flight Line Assigned 20.68 23.04 Flight Hours Entitled 640.13 710.68
Flight Hours Accomplished 773.57 865.08 Training Flight Hours
Entitled 561.50 587.35
Table 13. Average Values of Variables when RFT < 1.00 and when RFT = 1.00
Phase % Months Where RFT =
1.00 RFT = 1.00/# Months in
Phase Deployed 0.81 60/74
Sustain 0.77 47/61 Basic 0.76 22/29
Intermediate 0.65 17/26 Maintain 0.64 66/103
Table 14. Percentage of Months where RFT = 1.00 by Phase
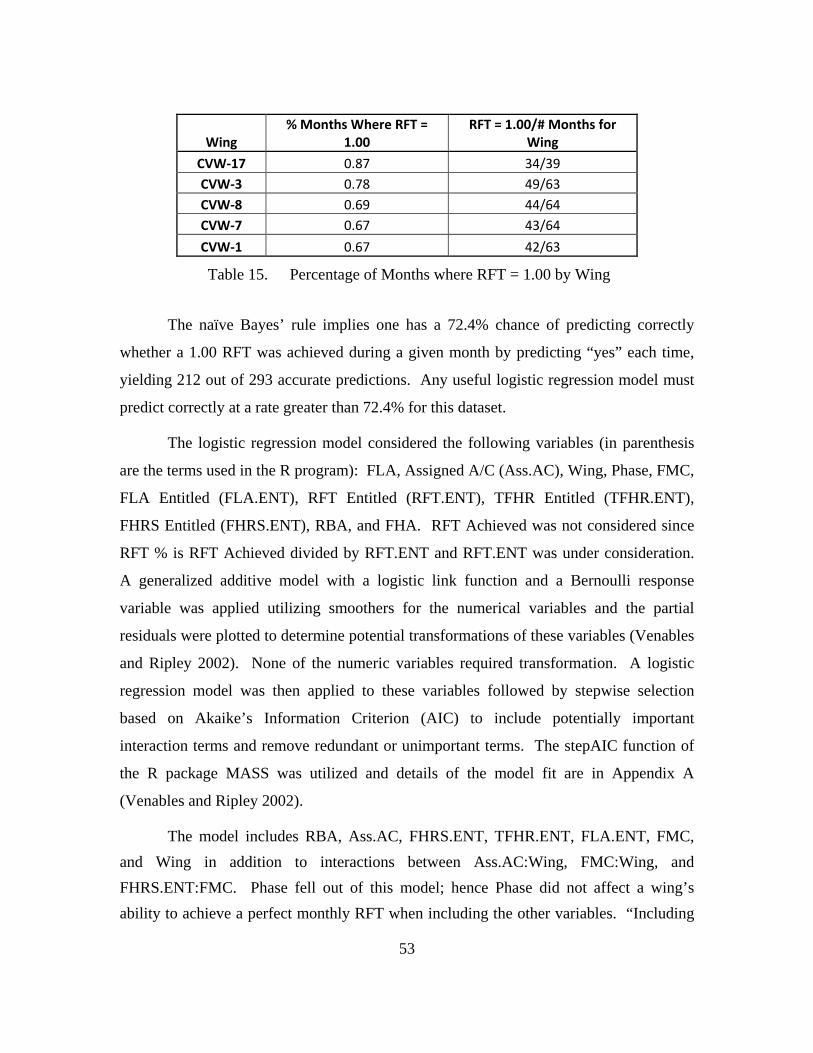
53
Wing % Months Where RFT =
1.00 RFT = 1.00/# Months for
Wing CVW-17 0.87 34/39 CVW-3 0.78 49/63 CVW-8 0.69 44/64 CVW-7 0.67 43/64 CVW-1 0.67 42/63
Table 15. Percentage of Months where RFT = 1.00 by Wing
The naïve Bayes’ rule implies one has a 72.4% chance of predicting correctly
whether a 1.00 RFT was achieved during a given month by predicting “yes” each time,
yielding 212 out of 293 accurate predictions. Any useful logistic regression model must
predict correctly at a rate greater than 72.4% for this dataset.
The logistic regression model considered the following variables (in parenthesis
are the terms used in the R program): FLA, Assigned A/C (Ass.AC), Wing, Phase, FMC,
FLA Entitled (FLA.ENT), RFT Entitled (RFT.ENT), TFHR Entitled (TFHR.ENT),
FHRS Entitled (FHRS.ENT), RBA, and FHA. RFT Achieved was not considered since
RFT % is RFT Achieved divided by RFT.ENT and RFT.ENT was under consideration.
A generalized additive model with a logistic link function and a Bernoulli response
variable was applied utilizing smoothers for the numerical variables and the partial
residuals were plotted to determine potential transformations of these variables (Venables
and Ripley 2002). None of the numeric variables required transformation. A logistic
regression model was then applied to these variables followed by stepwise selection
based on Akaike’s Information Criterion (AIC) to include potentially important
interaction terms and remove redundant or unimportant terms. The stepAIC function of
the R package MASS was utilized and details of the model fit are in Appendix A
(Venables and Ripley 2002).
The model includes RBA, Ass.AC, FHRS.ENT, TFHR.ENT, FLA.ENT, FMC, and Wing in addition to interactions between Ass.AC:Wing, FMC:Wing, and FHRS.ENT:FMC. Phase fell out of this model; hence Phase did not affect a wing’s ability to achieve a perfect monthly RFT when including the other variables. “Including
54
the other variables” is a key distinction as we discovered via Fisher’s Test that CVW-1 and CVW-7’s RFT performance was affected by Phase in isolation. Thus there are other variables with relationships involving Phase (recall entitlements are driven by month/phase and number of A/C) that enable Phase to be omitted from the final model. FLA and RFT.ENT fell out of the model due to their extremely high correlations with Ass.AC (0.96) and TFHR.ENT (0.99) respectively, while the model also does not require FHA.
Ten-fold cross-validation (see e.g. Montgomery et al. 2006) was used to estimate the misclassification rate for the logistic regression model. In cross-validation the observations are randomly partitioned into 10 subsets of approximately equal numbers. The model is fit to each subset and the fraction of observations misclassified is computed. The total misclassification rate is the average of all 10 misclassification fractions. A misclassification can either occur when the model predicts a 1 (determined when the estimated probability exceeds 0.5) and a 0 results or when the model predicts a 0 (estimated probability is less than or equal to 0.5) and a 1 results. Using this method with the model and dataset misclassified 16.37% of observations. Utilizing the naïve Bayes rule and predicting a 1 for all observations would misclassify 27.6% of observations so this logistic regression model improves predictive capabilities: the model reduces the misclassification rate by 40.7% compared with the naïve Bayes rule.
The empirical misclassification rate (using all observations) was 11.95%. There were 24 false positives where a 1 was predicted but a 0 was achieved and 11 false negatives where a 0 was predicted while a 1 was achieved. For each wing the logistic regression model predicted more accurately than the naïve Bayes rule. Ten of 35 misclassifications occurred when the probability was between 0.40 and 0.60 and hence the confidence of these predictions was not very high. Fifteen misclassifications had large leverages while 12 had large R-Student residuals. The largest Cook’s Distance and the largest leverage occurred during the same observation (values were 0.291 and 0.630 respectively, occasion resulted in a false negative) thus no observations were influential. The largest absolute value for R-Student residuals was 3.54 and this observation registered a false positive. See Montgomery et al. (2006) for a discussion on how the statistics R-Student residuals, leverages, and Cook’s Distances are used to identify unusual and influential observations.
55
C. MODEL EXCLUDING PERFECT READY FOR TASKINGS
Upon removal of the six anomalies, 81 of 293 remaining observations achieved an
RFT below 1.00 (27.6%) for a given month. In this section, we fit a multiple regression
to these 81 observations. The correlation between RFT and FMC is higher (0.26 vs.
0.17) when observations where RFT = 1.00 are excluded, although the relationship is still
not a strong one. 77.3% of the pairwise correlations were stronger with the dataset
excluding RFT = 1.00, but most of those differences were marginal.
The following variables are used: FHA, RBA, FLA, Assigned A/C (Ass.AC),
FHRS Entitled (FHRS.ENT), TFHR Entitled (TFHR.ENT), RFT Entitled (RFT.ENT),
FLA Entitled (FLA.ENT), FMC, Wing, and Phase. After fitting a multiple regression of
RFT modeled by all variables, residual diagnostic plots uncovered unequal variance: as
predicted RFT increases the variability of the residuals decreases (Figure 26). There is a
simple explanation for this. The maximum RFT by definition is 1.00, however the
predicted RFT can exceed 1.00. Since the residual is calculated as the predicted RFT
subtracted from observed RFT, when the predicted RFT is 0.85 the maximum residual is
0.15 and when the predicted RFT is 0.95 the maximum residual is 0.05. This explains
why the spread in the residuals is greater for predicted values around 0.85 than it is when
predicted values are around 0.95.
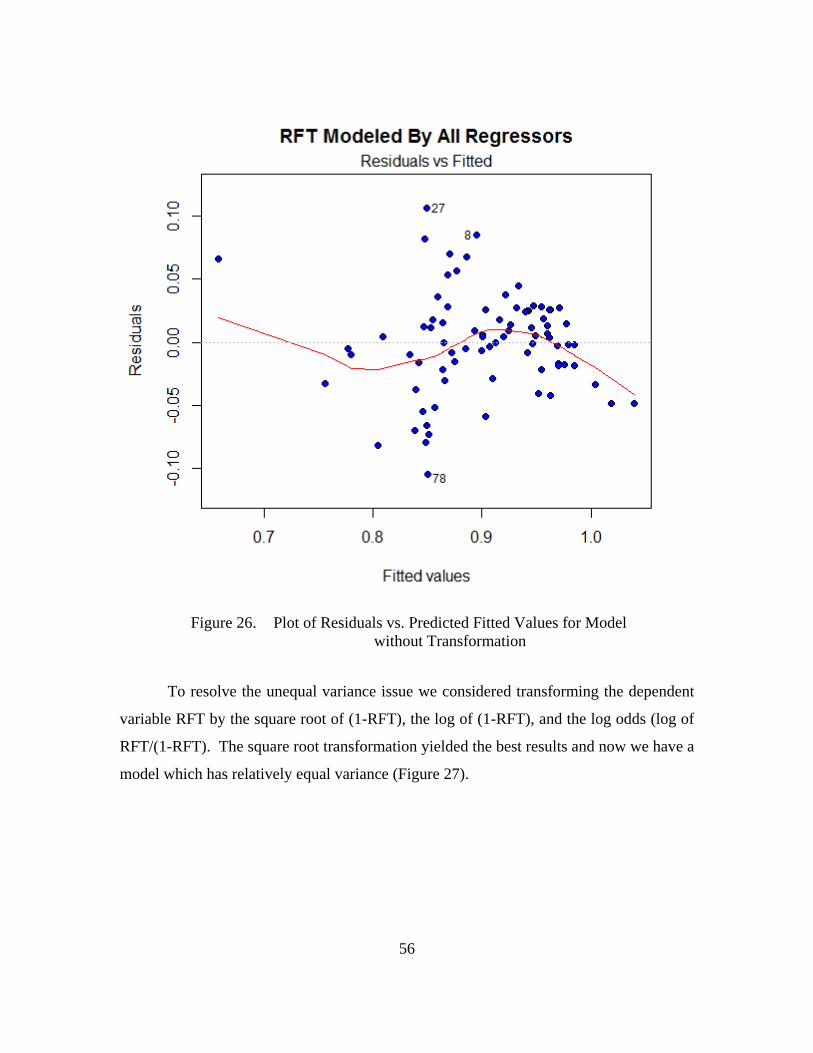
56
Figure 26. Plot of Residuals vs. Predicted Fitted Values for Model
without Transformation
To resolve the unequal variance issue we considered transforming the dependent
variable RFT by the square root of (1-RFT), the log of (1-RFT), and the log odds (log of
RFT/(1-RFT). The square root transformation yielded the best results and now we have a
model which has relatively equal variance (Figure 27).
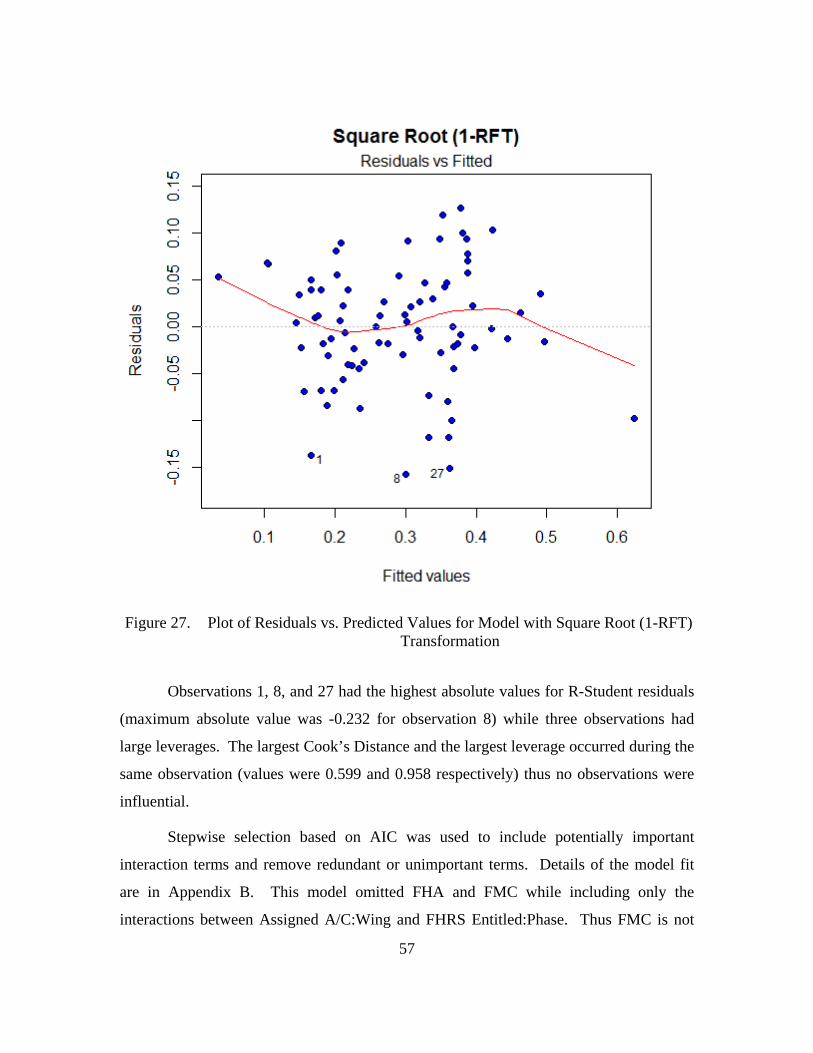
57
Figure 27. Plot of Residuals vs. Predicted Values for Model with Square Root (1-RFT)
Transformation
Observations 1, 8, and 27 had the highest absolute values for R-Student residuals
(maximum absolute value was -0.232 for observation 8) while three observations had
large leverages. The largest Cook’s Distance and the largest leverage occurred during the
same observation (values were 0.599 and 0.958 respectively) thus no observations were
influential.
Stepwise selection based on AIC was used to include potentially important
interaction terms and remove redundant or unimportant terms. Details of the model fit
are in Appendix B. This model omitted FHA and FMC while including only the
interactions between Assigned A/C:Wing and FHRS Entitled:Phase. Thus FMC is not
58
necessary for predicting RFT when utilizing a multiple regression model in the presence
of the other variables. In fact, FMC fell out of all four models cited above.
D. DISCUSSION
While predicting when a wing achieves a perfect RFT during a month by
employing a logistic regression model, Phase was surprisingly omitted from the best
model although Fisher’s Test concluded at a 5% significance level that CVW-1 and
CVW-7’s RFT performance was affected by Phase. Recall the entitlements are located
within the CNAF INSTRUCTION 3510 series, and they are driven by the month/phase
within the FRTP. The relationships Phase has with other variables (as displayed within
the plots in Chapter IV) are strong enough to include those variables in the model in lieu
of Phase. FHA fell out of the model, so at an average of $10K per flight hour FHA does
not directly impact RFT in the presence of the other variables. When predicting a wing’s
monthly RFT given the wing was unable to achieve the RFT goal of 1.00, the multiple
regression model omitted FMC in the presence of the other variables. FMC lacked a
strong correlation with all variables including RFT which may explain its omission. FHA
was also unnecessary for this model.
The importance of the models exists in the variables considered necessary (or
more appropriately, unnecessary) in the presence of other predictors. The air wing
commanders cannot easily manipulate any variables considered within this analysis. The
month within the FRTP determines the Phase, the Wing is self-explanatory, and the
entitlements can only be adjusted by higher echelons. Increasing Assigned A/C will lead
to a rise in FLA, thus there is a larger selection of A/C to draw from to become RFT.
However, increasing the Assigned A/C is expensive and there is an opportunity cost
associated with reallocating A/C from other wings in support of a specific wing’s RFT
goal. Similarly to RFT, FMC and RBA are readiness metrics computed at the end of the
month so there is no forecasting potential with FMC or RBA.
Finally only Super Hornets supported via NAS Oceana during March 2007
through June 2012 were considered for this analysis. Alternative T/M/S, support
locations, or time frames may produce contradicting conclusions.
59
VI. CONCLUSIONS AND RECOMMENDATIONS
A. CONCLUSIONS
1. Correlation of RFT to FMC is Small but Inconclusive
The correlation between RFT and FMC is only 0.17, which demonstrates a small
but inconclusive relationship. In fact both CVW-1 and CVW-17 had negative correlation
coefficients: as RFT improved, FMC declined (Devore, 2012). RFT and FMC as
fractions are not measuring the same aspects of readiness: while all FMC A/C are
included in FMC calculations as a fraction, only A/C rated RFT up to the number of RFT
Entitled are included in the RFT fractional calculation.
2. RFT and FMC were not Systematically Affected by Wing or Phase
We found that neither the phase nor the wing showed systematic differences in
the ability to achieve either the FMC standard or the RFT goal when evaluated as a
whole. Knowing the wing (without the phase) does not help one predict whether FMC
and/or RFT will be met, while knowing the phase (without the wing) is not helpful either.
The combination of the wing and the phase is significant though for certain wings/phases
as shown in Chapter III. Specifically, phase mattered in the accomplishment of FMC for
CVW-3 and CVW-17 while phase was a factor in the achievement of a perfect monthly
RFT for CVW-1 and CVW-7.
3. FMC Presents a Clearer Readiness Trend than RFT
There are trends one can detect with the FMC plots that cannot be observed from
RFT, including the finding that the readiness of wings tends to trend upward leading to
deployment while falling off post-deployment. There appears to be value in retaining
both metrics: if the primary concern is accomplishing missions when required then RFT
has a purpose, while FMC is useful to portray readiness trends and as a funding input.
Employing RFT as an input for aviation spares funding models could have significant
fiscal effects if a perfect RFT is the goal since this thesis found 72.4% of observations
60
meeting the goal. Previous studies have addressed the trends with FMC and funding and
the ARROWs model already utilizes FMC as an input.
4. “Lies, Damned Lies, and Statistics”
Mark Twain is credited with “Lies, Damned Lies, and Statistics” and based upon
the image we wish to portray, we can generate several conclusions from the same dataset
by selecting FMC or RFT as the metric of choice. If achieving an RFT of 1.00 during
deployment is the ultimate goal, CVW-17 had the highest readiness of the five East Coast
air wings during this five year period. However, if meeting an FMC standard of 0.63
during deployment is the measuring stick, CVW-17 had the worst readiness. Thus it is
critical to select an appropriate readiness metric and while the commander may simply
desire to accomplish the mission, one can better detect trends and patterns with FMC than
via RFT.
5. FMC’s Negative Trend over Time
FMC had a stronger relationship with time (correlation coefficient of -0.60),
where time is measured by the month/year, than any variable considered during this
analysis. FHA had the next largest correlation (0.10) with time and this represents an
undetermined linear relationship. This finding supports the results from LMI’s
September 2011 study concluding a negative trend in FMC values for overall T/M/S A/C
since 2006 (Buckley et al. 2011). Table 16 presents the rates wings met the FMC
standards by year. Beginning in 2008 the overall FMC accomplishment rate has declined
each year and during the first six months of 2012 none of the wings met their FMC
standards (0.53 non-deployed, 0.63 deployed). Fisher’s Test supports the conclusion that
overall FMC is declining beyond what would be expected by chance. CVWs 7, 8, and 17
are in a declining trend while CVW-1 has been consistently missing the mark throughout
with the exception of 2008. Statistically speaking, 2008 was an anomaly for CVW-1:
without 2008 there would not have been a difference between the years.
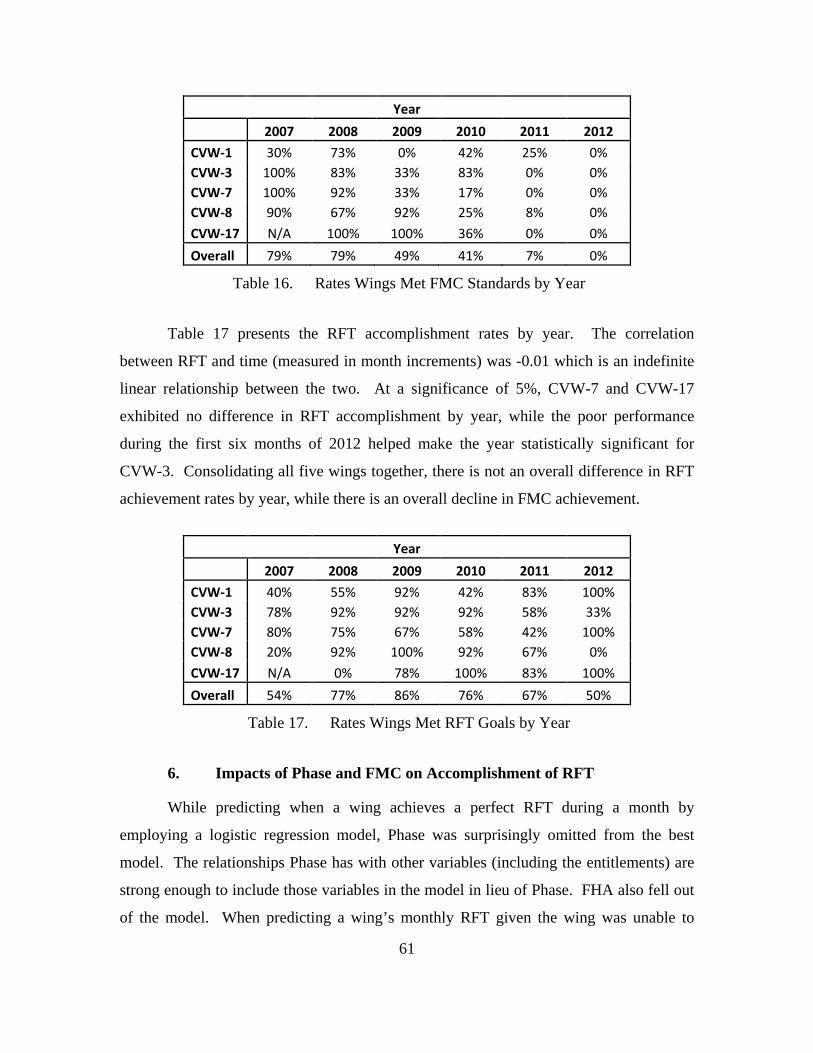
61
Year 2007 2008 2009 2010 2011 2012 CVW-1 30% 73% 0% 42% 25% 0% CVW-3 100% 83% 33% 83% 0% 0% CVW-7 100% 92% 33% 17% 0% 0% CVW-8 90% 67% 92% 25% 8% 0% CVW-17 N/A 100% 100% 36% 0% 0% Overall 79% 79% 49% 41% 7% 0%
Table 16. Rates Wings Met FMC Standards by Year
Table 17 presents the RFT accomplishment rates by year. The correlation
between RFT and time (measured in month increments) was -0.01 which is an indefinite
linear relationship between the two. At a significance of 5%, CVW-7 and CVW-17
exhibited no difference in RFT accomplishment by year, while the poor performance
during the first six months of 2012 helped make the year statistically significant for
CVW-3. Consolidating all five wings together, there is not an overall difference in RFT
achievement rates by year, while there is an overall decline in FMC achievement.
Year 2007 2008 2009 2010 2011 2012 CVW-1 40% 55% 92% 42% 83% 100% CVW-3 78% 92% 92% 92% 58% 33% CVW-7 80% 75% 67% 58% 42% 100% CVW-8 20% 92% 100% 92% 67% 0% CVW-17 N/A 0% 78% 100% 83% 100% Overall 54% 77% 86% 76% 67% 50%
Table 17. Rates Wings Met RFT Goals by Year
6. Impacts of Phase and FMC on Accomplishment of RFT
While predicting when a wing achieves a perfect RFT during a month by
employing a logistic regression model, Phase was surprisingly omitted from the best
model. The relationships Phase has with other variables (including the entitlements) are
strong enough to include those variables in the model in lieu of Phase. FHA also fell out
of the model. When predicting a wing’s monthly RFT given the wing was unable to
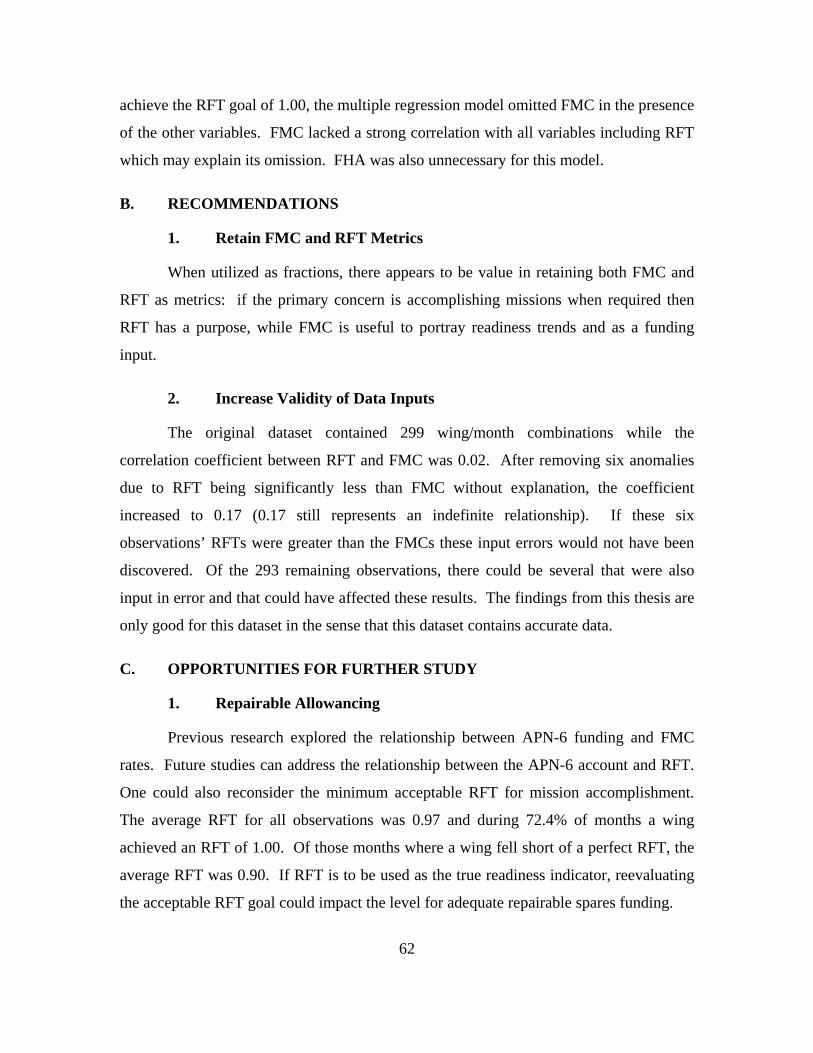
62
achieve the RFT goal of 1.00, the multiple regression model omitted FMC in the presence
of the other variables. FMC lacked a strong correlation with all variables including RFT
which may explain its omission. FHA was also unnecessary for this model.
B. RECOMMENDATIONS
1. Retain FMC and RFT Metrics
When utilized as fractions, there appears to be value in retaining both FMC and
RFT as metrics: if the primary concern is accomplishing missions when required then
RFT has a purpose, while FMC is useful to portray readiness trends and as a funding
input.
2. Increase Validity of Data Inputs
The original dataset contained 299 wing/month combinations while the
correlation coefficient between RFT and FMC was 0.02. After removing six anomalies
due to RFT being significantly less than FMC without explanation, the coefficient
increased to 0.17 (0.17 still represents an indefinite relationship). If these six
observations’ RFTs were greater than the FMCs these input errors would not have been
discovered. Of the 293 remaining observations, there could be several that were also
input in error and that could have affected these results. The findings from this thesis are
only good for this dataset in the sense that this dataset contains accurate data.
C. OPPORTUNITIES FOR FURTHER STUDY
1. Repairable Allowancing
Previous research explored the relationship between APN-6 funding and FMC
rates. Future studies can address the relationship between the APN-6 account and RFT.
One could also reconsider the minimum acceptable RFT for mission accomplishment.
The average RFT for all observations was 0.97 and during 72.4% of months a wing
achieved an RFT of 1.00. Of those months where a wing fell short of a perfect RFT, the
average RFT was 0.90. If RFT is to be used as the true readiness indicator, reevaluating
the acceptable RFT goal could impact the level for adequate repairable spares funding.
63
2. Supply Material Availability
Originally, this thesis was designed to factor in as much emphasis on Supply
Material Availability (SMA) at the retail level as RFT and FMC. Due to time constraints
we were unable to obtain the SMA fill rate data for this analysis. Utilizing the work
provided within this thesis, future studies can tie in fill rate data to discover the
relationships RFT has with fill rates and to determine if fill rates are required in either
model to predict RFT. Similarly to FMC and RBA, fill rates are computed at the end of
the month thus SMA is unable to forecast RFT achievement.
3. West Coast Squadrons and Alternative T/M/S
This thesis only utilized Super Hornets supported via NAS Oceana during March
2007 through June 2012. Alternative T/M/S, support locations, or time frames may
produce different conclusions. Super Hornets on the east coast have experienced
declining FMC rates and it would be interesting to discover whether West Coast Super
Hornets reflect similar relationships between RFT and the variables considered within
this analysis.
4. RFT Achievement by Mission
The RFT data was collected at the monthly level and this thesis did not explore
the specific missions preventing A/C from achieving the RFT goal during a given day. It
would be useful to examine RFT success by required mission sets to determine if there
are mission sets with high demands that are experiencing more failures than others. In
addition, the mission sets could be considered categorical variables and included within
the dataset to discover whether they are significant in multiple or logistic regression
models.

64
THIS PAGE INTENTIONALLY LEFT BLANK
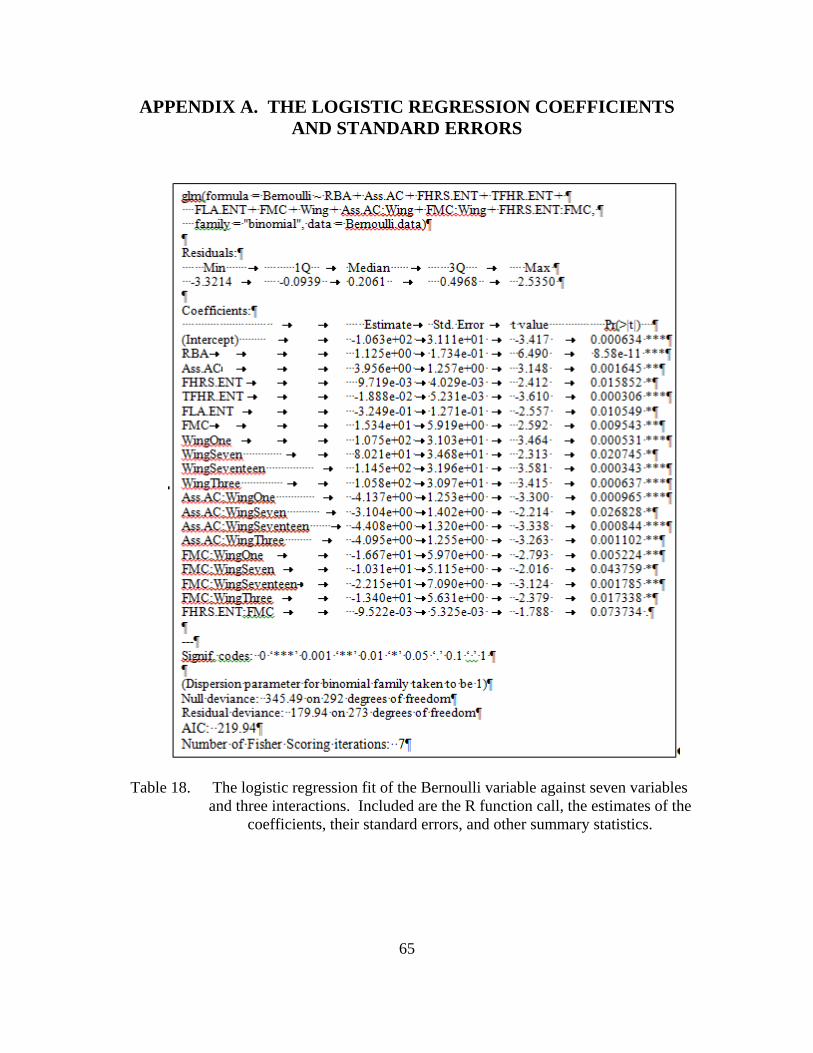
65
APPENDIX A. THE LOGISTIC REGRESSION COEFFICIENTS AND STANDARD ERRORS
Table 18. The logistic regression fit of the Bernoulli variable against seven variables and three interactions. Included are the R function call, the estimates of the
coefficients, their standard errors, and other summary statistics.

66
THIS PAGE INTENTIONALLY LEFT BLANK
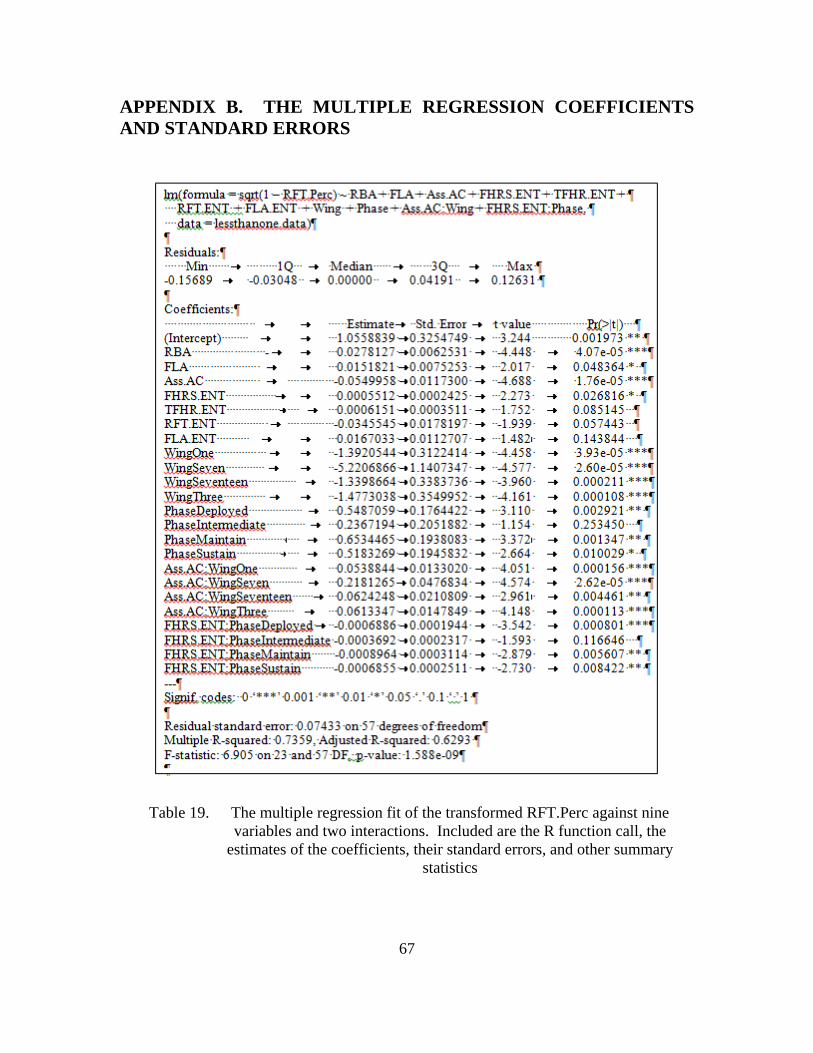
67
APPENDIX B. THE MULTIPLE REGRESSION COEFFICIENTS AND STANDARD ERRORS
Table 19. The multiple regression fit of the transformed RFT.Perc against nine variables and two interactions. Included are the R function call, the
estimates of the coefficients, their standard errors, and other summary statistics

68
THIS PAGE INTENTIONALLY LEFT BLANK
69
LIST OF REFERENCES
Buckley, R., Chan, T., Disano, M., and Williams, A. 2010. Assessing the Use of Full Mission Capability Goals in Aviation Repairable Allowancing. Report SAN01T1. McLean, VA: Logistics Management Institute.
Buckley, R., Chan, T., Disano, M., Heilman, S., and Williams, A. 2011. Readiness Impact of APN-6 Funding Levels. Report SAN12T1. McLean, VA: Logistics Management Institute.
Cleveland, W.S., Grosse, E., and Shyu, W.M. 1992. “Local Regression Models.” In Statistical Models in S, edited by J.M. Chambers and T. Hastie, 309–376. New York: Chapman and Hall.
Commander, Naval Air Forces. 2006. Type Model Series (TMS) Readiness Standards for Naval Air Force Aircraft. COMNAVAIRFOR INSTRUCTION 3510 series.
Commander, Naval Air Forces. 2012. Naval Aviation Maintenance Program (NAMP). COMNAVAIRFOR INSTRUCTION 4790.2B.
Devore, Jay L. 2012. Probability & Statistics for Engineering and the Sciences. 8th edition. Boston: Brooks/Cole.
Fisher, R.A. 1925. Statistical Methods for Research Workers. Edinburgh: Oliver & Boyd.
Montgomery, D.C., Peck, E.A., and Vining, G.G. 2006. Introduction to Linear Regression Analysis. Fourth edition. Hoboken, NJ: Wiley & Sons.
Naval Aviation Enterprise. 2011. Current Readiness Handbook–Chapter 3, Section 4. Patuxent River, MD.
R Core Team (2012). R: A language and environment for statistical computing. R Foundation for Statistical Computing, Vienna, Austria. http://www.R-project.org/.
Sanford, Allen E. 2007 “Effects of Using NATEC Services within E-2C and FA-18 Operational Squadrons.” Master’s thesis, Naval Postgraduate School.
Venables, W. N. and Ripley, B. D. 2002. Modern Applied Statistics with S. 4th edition. New York: Springer.

70
THIS PAGE INTENTIONALLY LEFT BLANK

71
INITIAL DISTRIBUTION LIST
1. Defense Technical Information Center Ft. Belvoir, Virginia 2. Dudley Knox Library Naval Postgraduate School Monterey, California 3. Lyn Whitaker Naval Postgraduate School Monterey, California 4. Walt DeGrange Naval Postgraduate School Monterey, California 5. David Meyers Naval Supply Systems Command Headquarters Mechanicsburg, Pennsylvania 6. Xavier Lugo Naval Supply Systems Command Weapons Systems Support Mechanicsburg, Pennsylvania


![yarriambiack.vic.gov.au · Web view2020-02-09 · RFT for: [insert RFT title] RFT Reference No. [insert] Part 4 Page | 9 . RFT for: Supply & Delivery Used/Demo Tractor . RFT Reference](https://img.pdfslide.net/doc/110x75/5e8ea29539577a3486056189/web-view-2020-02-09-rft-for-insert-rft-title-rft-reference-no-insert-part.jpg)