Embed Size (px)
Citation preview

NAVAL POSTGRADUATE
SCHOOL
MONTEREY, CALIFORNIA
THESIS
Approved for public release; distribution is unlimited
ANALYSIS OF PROTECTION MEASURES FOR NAVAL VESSELS BERTHED AT HARBOR AGAINST
TERRORIST ATTACKS
by
Raja I. Sikandar
June 2016
Thesis Advisor: Thomas W. Lucas Second Reader: Jeffrey E. Kline

THIS PAGE INTENTIONALLY LEFT BLANK

i
REPORT DOCUMENTATION PAGE Form Approved OMB No. 0704–0188
Public reporting burden for this collection of information is estimated to average 1 hour per response, including the time for reviewing instruction, searching existing data sources, gathering and maintaining the data needed, and completing and reviewing the collection of information. Send comments regarding this burden estimate or any other aspect of this collection of information, including suggestions for reducing this burden, to Washington headquarters Services, Directorate for Information Operations and Reports, 1215 Jefferson Davis Highway, Suite 1204, Arlington, VA 22202-4302, and to the Office of Management and Budget, Paperwork Reduction Project (0704-0188) Washington, DC 20503. 1. AGENCY USE ONLY (Leave blank)
2. REPORT DATE June 2016
3. REPORT TYPE AND DATES COVERED Master’s thesis
4. TITLE AND SUBTITLE ANALYSIS OF PROTECTION MEASURES FOR NAVAL VESSELS BERTHED AT HARBOR AGAINST TERRORIST ATTACKS
5. FUNDING NUMBERS
6. AUTHOR(S) Raja I. Sikandar
7. PERFORMING ORGANIZATION NAME(S) AND ADDRESS(ES) Naval Postgraduate School Monterey, CA 93943-5000
8. PERFORMING ORGANIZATION REPORT NUMBER
9. SPONSORING /MONITORING AGENCY NAME(S) AND ADDRESS(ES)
N/A
10. SPONSORING / MONITORING AGENCY REPORT NUMBER
11. SUPPLEMENTARY NOTES The views expressed in this thesis are those of the author and do not reflect the official policy or position of the Department of Defense or the U.S. Government. IRB Protocol number ____N/A____.
12a. DISTRIBUTION / AVAILABILITY STATEMENT Approved for public release; distribution is unlimited
12b. DISTRIBUTION CODE
13. ABSTRACT (maximum 200 words)
The defense of a naval ship berthed in a harbor is a complex task affected by many factors. These include the fishing vessel density close to the ship and the challenge of discriminating neutral vessels from threats. A naval vessel berthed at harbor is more susceptible to attack than a vessel in open seas. The chances of detecting and countering a terrorist boat vary widely depending on several factors, including early identification of the attack and weapons available.
This research uses modeling in Map Aware Non-uniform Automata (MANA) to analyze the protection measures adopted by naval vessels against terrorist boats. Design of experiments is used to efficiently generate data, which is then replicated using high-performance computing, to address a wide range of possibilities and outcomes. The data generated is analyzed using a variety of techniques. The study concludes that lethality of Blue weapons is the most important factor in determining Blue’s ability to counter a Red suicide boat attack. Additionally, the tactic of firing a warning shot followed by disabling shots within the exclusion zone decreases Blue’s success probability. Finally, an exclusion zone of at least 60 meters that is enforced with a patrol boat is recommended. 14. SUBJECT TERMS simulation, agent-based, design of experiments, force protection, ship self-defense
15. NUMBER OF PAGES
85 16. PRICE CODE
17. SECURITY CLASSIFICATION OF REPORT
Unclassified
18. SECURITY CLASSIFICATION OF THIS PAGE
Unclassified
19. SECURITY CLASSIFICATION OF ABSTRACT
Unclassified
20. LIMITATION OF ABSTRACT
UU NSN 7540–01-280-5500 Standard Form 298 (Rev. 2–89) Prescribed by ANSI Std. 239–18

ii
THIS PAGE INTENTIONALLY LEFT BLANK

iii
Approved for public release; distribution is unlimited
ANALYSIS OF PROTECTION MEASURES FOR NAVAL VESSELS BERTHED AT HARBOR AGAINST TERRORIST ATTACKS
Raja I. Sikandar Lieutenant Commander, Pakistan Navy
B.E. (Electronics), NUST Pakistan, 2005
Submitted in partial fulfillment of the requirements for the degree of
MASTER OF SCIENCE IN OPERATIONS RESEARCH
from the
NAVAL POSTGRADUATE SCHOOL June 2016
Approved by: Thomas W. Lucas, Ph.D. Thesis Advisor
Jeffrey E. KlineSecond Reader
Patricia A. Jacobs, Ph.D. Chair, Department of Operations Research

iv
THIS PAGE INTENTIONALLY LEFT BLANK

v
ABSTRACT
The defense of a naval ship berthed in a harbor is a complex task affected by
many factors. These include the fishing vessel density close to the ship and the challenge
of discriminating neutral vessels from threats. A naval vessel berthed at harbor is more
susceptible to attack than a vessel in open seas. The chances of detecting and countering a
terrorist boat vary widely depending on several factors, including early identification of
the attack and weapons available.
This research uses modeling in Map Aware Non-uniform Automata (MANA) to
analyze the protection measures adopted by naval vessels against terrorist boats. Design
of experiments is used to efficiently generate data, which is then replicated using high-
performance computing, to address a wide range of possibilities and outcomes. The data
generated is analyzed using a variety of techniques. The study concludes that lethality of
Blue weapons is the most important factor in determining Blue’s ability to counter a Red
suicide boat attack. Additionally, the tactic of firing a warning shot followed by disabling
shots within the exclusion zone decreases Blue’s success probability. Finally, an
exclusion zone of at least 60 meters that is enforced with a patrol boat is recommended.

vi
THIS PAGE INTENTIONALLY LEFT BLANK

vii
THESIS DISCLAIMER
The reader is cautioned that the computer programs presented in this research may
not have been exercised for all cases of interest. While every effort has been made, within
the time available, to ensure that the programs are free of computational and logical
errors, they cannot be considered validated. Any application of these programs without
additional verification is at the risk of the user.

viii
THIS PAGE INTENTIONALLY LEFT BLANK

ix
TABLE OF CONTENTS
I. INTRODUCTION..................................................................................................1 A. BACKGROUND ........................................................................................1 B. OBJECTIVE ..............................................................................................2 C. SCOPE OF THESIS AND RESEARCH QUESTIONS .........................2 D. THESIS OVERVIEW ...............................................................................3
II. CAPABILITIES, SCENARIO DESCRIPTION, AND LITERATURE REVIEW .................................................................................................................5 A. BLUE UNIT’S RESOURCES AND CAPABILITIES ...........................5
1. 7.62mm G3 / 5.56mm M-16 ...........................................................5 2. 7.62mm Light Machine Gun LMG MG1A3 ................................6 3. 12.7mm Gun ...................................................................................7
B. SCENARIO ................................................................................................8 C. CIRCULATION MODEL.........................................................................9 D. EXPLOSIVES USED IN SUICIDE BOATS .........................................11
1. Categories of Explosives ..............................................................12 a. Low Explosives ..................................................................12 b. High Explosives.................................................................12 c. Blasting Agents .................................................................12
2. Explosives Generally Used by Terrorists ...................................12 E. LITERATURE REVIEW .......................................................................13
III. METHODOLOGY AND MODEL DESCRIPTION ........................................15 A. METHODOLOGY ..................................................................................15 B. CALCULATION OF PROBABILITY OF HIT ...................................15 C. MANA .......................................................................................................18 D. WHY WE USE AN AGENT-BASED MODEL ....................................19 E. MODEL IMPLEMENTATION IN MANA ..........................................20
1. Battlefield ......................................................................................20 2. Squad .............................................................................................21
a. General ..............................................................................22 b. Map ....................................................................................23 c. Personalities ......................................................................23 d. Tangibles ...........................................................................24 e. Sensors ...............................................................................26 f. Weapons ............................................................................27 g. Trigger State ......................................................................28

x
h. Inter Squad SA/Intra Squad SA .......................................29i. Fuel ....................................................................................29
F. ASSUMPTIONS AND LIMITATION OF MODELING IN MANA .......................................................................................................29
IV. DESIGN OF EXPERIMENTS ...........................................................................31A. NEARLY ORTHOGONAL LATIN HYPERCUBE (NOLH) .............31 B. EXPERIMENT FACTORS ....................................................................33
V. ANALYSIS OF DATA ........................................................................................37 A. INITIAL ASSESSMENT OF DATA .....................................................37 B. INFLUENTIAL FACTORS IN MODEL ..............................................39
1. Partition Tree ...............................................................................392. Analysis of Summarized Data .....................................................41
C. LOGISTIC FIT OF DATA .....................................................................45 D. EXPLORING THE EFFECT OF EXCLUSION ZONE
DISTANCE ON RED SUCCESS ...........................................................50 E. REGRESSION ANALYSIS ....................................................................51 F. SIGNIFICANT INTERACTIONS .........................................................54 G. TACTICS WITHIN EXCLUSION ZONE ............................................55
VI. CONCLUSION ....................................................................................................57A. CRITICAL FACTORS IN MODEL ......................................................57 B. FOLLOW-ON WORK ............................................................................58
LIST OF REFERENCES ................................................................................................59
INITIAL DISTRIBUTION LIST ...................................................................................61

xi
LIST OF FIGURES
Figure 1. Assault Rifles G3A3 and M16A4. Source: “Assault Rifle G3” (n.d.), “M16A4” (n.d.) ............................................................................................6
Figure 2. Browning M240 (U.S.) and LMG MG1A3 (Pakistan), Source: “Machine Gun MG3 (MG1A3)” (n.d.), “M240” (n.d.). ..............................7
Figure 3. 12.7mm Gun. Source: “Anti-Aircraft Machine Gun 12.7 MM TYPE 54” (n.d.), “Browning 12.7mm” (n.d.). ........................................................8
Figure 4. General Depiction of Scenario. ....................................................................8
Figure 5. Circulation Model for Terrorist Survival. ..................................................10
Figure 6. Depiction of Driver in the Form of Two Rectangles. ................................16
Figure 7. Probability of Hit of Small Arms versus Range (Meters)..........................17
Figure 8. Edit Battlefield Tab. ...................................................................................21
Figure 9. General Properties for Each Squad. ...........................................................22
Figure 10. Map Tab Used to Give Initial Start and Final Destination. .......................23
Figure 11. Personality Tab Options. ............................................................................24
Figure 12. Tangibles Tab for Describing Physical Properties of Squad. ....................25
Figure 13. Sensors Tab. ...............................................................................................26
Figure 14. Weapons Tab. ............................................................................................27
Figure 15. A Portion of the Trigger States Available to Agents in MANA................28
Figure 16. Annotated Snapshot of the MANA Battle Scenario. .................................30
Figure 17. Comparison of Gridded Design and NOLH. .............................................33
Figure 18. Pairwise Correlation between 257 Design Points NOLH for 6 Factors. .......................................................................................................35
Figure 19. Snapshot of Output File Obtained after Simulation Runs. ........................37
Figure 20. Overall Distribution of “Red Achieves its Goal.” .....................................38
Figure 21. Distribution of “Red Achieves its Goal” versus Number of Red Boats. .........................................................................................................38
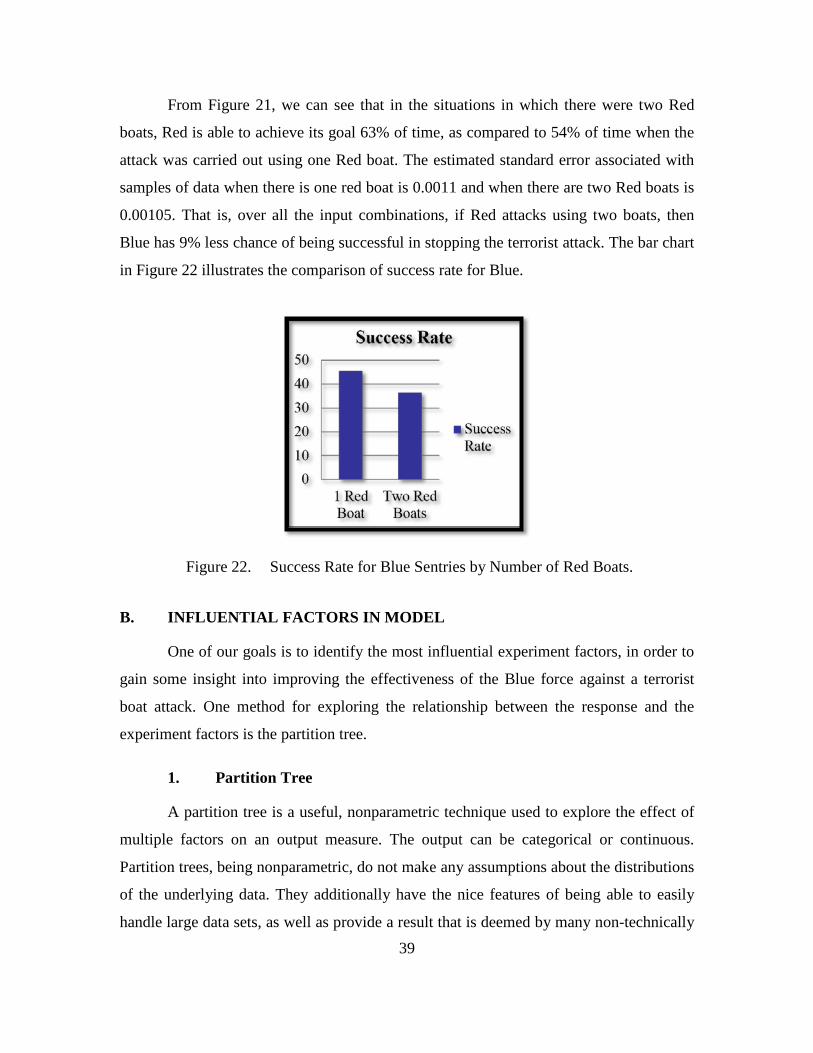
Figure 22. Success Rate for Blue Sentries by Number of Red Boats. ........................39
Figure 23. Partition Tree Indicating Critical Factors of the Model. ............................40
Figure 24. Data Sheet Generated after Creation of Two New Columns in Binary Form. ..........................................................................................................42
Figure 25. Data Sheet Created after Collapsing (Summarizing) Data. .......................42

xii
Figure 26. Histograms and Summary Statistics for Mean Blue and Red Success. .....43
Figure 27. Partition Tree of Collapsed Data for Red Success. ....................................44
Figure 28. Logistic Fit of the Response against Different Input Variables. ................45
Figure 29. Logistic Fit of Red Success by Probability of Hit and Number of Blue Patrol Boats. ......................................................................................46
Figure 30. Logistic Fit of Red Success by Red Boat Speed and Red Boat Hits to Kill. ............................................................................................................47
Figure 31. Logistic Fit of Red Success by Weapon Case and Number of Blue Sentries. ......................................................................................................48
Figure 32. Logistic Fit of Red Success by Exclusion Zone Distance and Number of Red Boats.................................................................................49
Figure 33. Probability of Red Success against Varying Exclusion Zone Distance......................................................................................................51
Figure 34. Regression Model with All Input Factors. .................................................53
Figure 35. Actual by Predicted Plot of Mean (Red Success). .....................................54
Figure 36. Interaction Profiler. ....................................................................................55
Figure 37. Distribution of Red Success after Incorporating a Three- to Four-Second Delay. ............................................................................................56

xiii
LIST OF TABLES
Table 1. Assault Rifle General Characteristics. Adapted from “Automatic rifle G3A3 & G3P4” (n.d.), Powers (2016). ................................................6
Table 2. Light Machine Gun Characteristics. Adapted from “Machine Gun MG3 (MG1A3)” (n.d.), “M240” (n.d.). .......................................................6
Table 3. 12.7mm Machine Gun Characteristics. Adapted from “Anti-Aircraft Machine Gun 12.7 MM TYPE 54” (n.d.), “Browning M2” (n.d.). .............7
Table 4. Blue Sentry Weapon Options.....................................................................34
Table 5. Possible Blue Sentry Weapons Configuration. ..........................................34
Table 6. The Other Six Factors with Ranges. ..........................................................34
Table 7. Factors Used in Scenario for Exploring the Effect of Exclusion Zone Distance on Red Success. ..........................................................................50
Table 8. Mean Probability of Red Success against Exclusion Zone Distance while Keeping Other Inputs Constant. .......................................................51

xiv
THIS PAGE INTENTIONALLY LEFT BLANK

xv
LIST OF ACRONYMS AND ABBREVIATIONS
API Armor Piercing Incendiary
AP Armor Piercing
ATF Alcohol, Tobacco, Firearms, and Explosives
DOE Design of Experiments
HMG Heavy Machine Gun
IRTC Internationally Recommended Transit Corridor
LH Latin Hypercubes
LMG Light Machine Gun
MANA Map Aware Non-Uniform Automata
NOLH Nearly Orthogonal Latin Hypercube
POF Pakistan Ordinance Factories
ROF Rate of Fire
SEED Simulation Experiments & Efficient Designs
SOPs Standard Operating Procedures

xvi
THIS PAGE INTENTIONALLY LEFT BLANK

1
EXECUTIVE SUMMARY
The 12th of October 2000 is a day to be remembered by the whole world. On that
day terrorists carried out a suicide boat attack on USS Cole while it was berthed in the
Port of Aden. The attack was a major incident that generated many questions, including
reconsidering tactics regarding ship protection. Since then, ship protection and force
protection has been an important aspect for any warship—be it in harbor or at sea. Many
defensive tactics are developed, tested, implemented, and are being improved upon each
day.
When naval ships are berthed in a naval port, ship protection is often not a big
concern for the ship’s staff as there will be no or only controlled civilian vessels moving
around the ship or in the harbor. However, when warships are berthed in a port that is
under civilian control, or when the ship is on a goodwill or flag hoisting mission to
another country, then the ships are berthed in a civilian port where there is a lot of nearby
civilian vessel activity in the form of fishing vessels, cargo dhows, and recreational boats.
When this occurs, ship protection is a real concern for the ship’s staff. As per the threat
level enforced, the ship maintains appropriate protection levels and posts armed sentries
to thwart any untoward incident.
In order to analyze the action and protection measures adopted by a naval ship
against terrorist boats, the following research objectives were identified to guide this
research:
• Determine which weapons systems, how many of them, and whataccompanying tactics are required to ensure successful defense of navalvessels berthed at harbor.
• Explore the probability of successful ship defense as a function of thenumber, type, and effectiveness of weapons used against differentnumbers and tactics of the threat.
To begin this research a baseline scenario was developed for a warship berthed at
harbor with three sentries posted with weapons on board ship facing seaward. An
exclusion zone around the ship on its seaward side is established. No boat is allowed in
this area unless positively identified. An armed boat patrols the area at the fringes of the

2
exclusion zone. The task of this patrol boat is to ensure that no boat/vessel enters the
exclusion zone. If the patrol finds a potentially threatening boat heading towards the
exclusion zone, then it will intercept the threat and will direct that vessel to avoid the
exclusion zone using non-lethal means, such as a whistle, bright light, or verbal warning.
If an incoming boat is found to be non-compliant to the instructions, then the patrol boat
will raise an alarm informing all sentries onboard the ship and patrol boat of the threat.
The sentries are then allowed to fire disabling rounds as soon as the incoming boat enters
the exclusion zone. The sentries have been ordered to ensure that no incoming boat is
able to reach within five meters of the ship using whatever means they have to in order to
stop the threat.
In this scenario Blue is able to achieve successful defense if all Red boats are
destroyed before hitting the ship’s side. If one or more Red boats are able to reach their
target, then Red has achieved its mission and it’s a failure for Blue. To explore the
effectiveness of ship self-defense measures, a simulation of this tactical situation was
developed using the agent-based modeling environment Map Aware Non-uniform
Automata (MANA) (McIntosh, 2007). Many different scenarios were studied by
efficiently varying inputs to the model in many possible combinations.
After the scenario was built, the next step was to apply design of experiments
(DOE) to efficiently explore the model over a range of controllable and uncontrollable
factors. Using different factor combinations, different scenarios were generated varying
the number of Red boats, exclusion zone distance, number of sentries, probability of hit
of Blue agents, speed of Red boats, and the number of shots taken by a Red boat before it
sinks (i.e., its staying power). These factors were used in a Nearly Orthogonal Latin
Hypercube (NOLH) design to obtain 257 space-filling design points. As the design points
were obtained by a NOLH, the maximum absolute pairwise correlation between any two
factors was 0.058. These 257 design points were crossed with eight levels of weapon
combinations for Blue sentries and two-levels of the number of Blue patrol boats to
obtain 4,112 unique design points. Using the cluster computers in the Simulation
Experiments & Efficient Design (SEED) lab, each design point was replicated 100 times,

3
for a total of 411,200 simulated terrorist attacks on a warship berthed at harbor. The
output was analyzed to obtain insight on the thesis research objectives above.
Different analysis techniques, such as regression models, partition trees,
histograms, and ANOVA were used to analyze the data generated by the simulation
experiments. The following important insights were obtained:
• The most important factor to defend a ship is the lethality of Blue weapons against the Red boat. In simple words, the type of weapons the sentries used is the most important factor in protecting the ship. There was a clear distinction among the results when the Red boat was able to sustain against Blue weapons and when it was not able to do so.
• Another important factor is the probability of hit by Blue sentries—i.e., their skill level.
• The presence of the Blue patrol boat and the speed of the Red boat also emerged as important factors. In almost all scenarios, the Blue patrol boat played an important part in ensuring a successful defense.
• The probability of successful defense is reduced when multiple Red boats attacked simultaneously, but it was not a major factor.
• Exclusion zone distance also played an important role in ensuring successful defense of the Blue ship. An exclusion zone of at least 60 meters is recommended to be maintained by the Blue force.
• It was also found that sentries should fire on the Red boat as soon as they enter the exclusion zone. Delivering a warning shot followed by a disabling shot will substantially reduce Blue’s success probability.
References
McIntosh, G.C. (2007). MANA version 4 user manual. Auckland, New Zealand: Defence Technology Agency.

4
THIS PAGE INTENTIONALLY LEFT BLANK

5
ACKNOWLEDGMENTS
I would like to express the deepest appreciation and respect for my thesis advisor,
Professor Thomas Lucas. Without his constant guidance, mentorship and supervision, I
would not have been able to complete this thesis. He was a source of inspiration,
encouragement, and reassurance.
Captain Jeffery E. Kline, I am really thankful to you for your ideas, suggestions,
and direction for timely completion of my thesis work.
My special recognition and thanks for Mary L. McDonald, a research associate in
the SEED center, for your step-by-step support in data farming and model building. Your
help and guidance was critical in completing my thesis.
The successful and final outcome of this thesis is also a result of discussion and
communication among many of my cohorts. I am really thankful for their support and
backing.
Last but not the least, I am really thankful to my wife and kids for their support,
patience, and tolerance while I completed my master’s degree at NPS.

6
THIS PAGE INTENTIONALLY LEFT BLANK

1
I. INTRODUCTION
A. BACKGROUND
“On October 12, 2000, suicide terrorists exploded a small boat alongside the USS
Cole, as it was refueling in the Yemeni port of Aden. The blast ripped a 40-foot-wide
hole near the waterline of the Cole, killing 17 American sailors and injuring 39 others”
(FBI, 2005). This suicide attack severely damaged the ship. It had to be towed to another
location for necessary repairs in order to make it sea worthy again. Force Protection Plan
Bravo was enforced onboard USS Cole at that time. This terrorist attack raised a series of
questions regarding the efficacy and implementation of the force protection plan. Since
that event, ship protection procedures have changed a lot. Navies around the globe have
reviewed their protection plans and tactics, and tried to implement such plans in practice.
Many changes were made in tactics and different standard operating procedures (SOPs)
were devised. With every passing day improvements are being incorporated in these
SOPs to ensure a reliable defense of naval vessels at sea and at harbor.
When a naval vessel is berthed at harbor within a home country, it is generally
berthed at a naval harbor (that is, the harbor is controlled by the Navy). In a naval harbor,
there is controlled movement of all vessels, and any vessel moving in close proximity of
naval ships is well identified, so the chances of a terrorist suicide attack are low.
However, when ships are berthed in a civilian controlled port or when warships pay
goodwill or flag hoisting visits to other countries, then naval ships are generally berthed
at a commercial jetty in a civilian port. Standard procedure is that an exclusion zone of 40
meters to 70 meters, depending on the space available, is established by the local host
nation. No vessel is allowed to enter this exclusion zone, and an armed boat patrols this
area to avoid a breach of this exclusion zone. It is the responsibility of this patrol boat to
intercept any vessel moving towards the exclusion zone and direct them away from it,
using non-lethal means, for example, whistles, bright lights, and radios. However, if any
boat does not alter its course and continues to move towards the exclusion zone, then the
vessel is believed to be hostile. In such a situation, the patrol boat alerts all sentries
onboard the ship, and sentries are allowed to fire disabling shots on the boat entering the

2
exclusion zone. The number and type of weapons manned by the sentries depends on the
threat level enforced at that time. Outside this exclusion zone, normal harbor traffic runs,
including fishing boats, recreation boats, or cargo dhows. From this traffic, if there are
one or more terrorist boats that alter their course to hit the side of the naval ship, then
only sentries with small arms are available to defend against the attack. At that time, the
probability of successful defense will mainly depend on the alertness of the sentries, the
probability of hit by weapons carried by sentries, training of sentries, and the lethality of
the weapons. To ensure an acceptable level of successful defense, the number and type of
weapons by sentries, along with the width of exclusion zone, must be known by the
ship’s crew at all times.
B. OBJECTIVE
The goal of this thesis is to determine whether the standard procedures and
weapons that are currently in place can ensure a successful defense of a naval vessel
berthed at a civilian harbor. In addition, it explores which weapon systems and how many
of them, as well as accompanying tactics, are required to ensure a successful defense of a
naval vessel berthed at harbor. Here, “tactics” means the width of the exclusion zone,
whether sentries should fire immediately on any vessel entering the exclusion zone, or
whether they should first fire a warning shot and then disabling shots. This thesis also
explores the probability of successful defense when the number and combinations of
weapons is changed alongside the width of exclusion zone.
C. SCOPE OF THESIS AND RESEARCH QUESTIONS
This research focuses on tactical level scenarios in which a naval vessel is berthed
at harbor. The threat level is high and it is believed that a suicide attack may be
imminent. The ship is utilizing three sentries with weapons, and one armed patrol boat is
maintaining an exclusion zone around ship. The objective of these defensive forces is to
thwart any suicide attack in the form of suicide boats. The primary research question
guiding this thesis research is:
• What type of and how many weapons are required to ensure the successful defense of a berthed ship against a terrorist suicide boat?

3
Supporting questions are as follows:
• What should be the width of the exclusion zone with different weapon combinations?
• What accompanying tactics are required to ensure the defense of the ship?
• If the number of weapons, type of weapons, or width of the exclusion zone is changed, how does it impact the probability of successful defense by the Blue ship?
D. THESIS OVERVIEW
The information about the capabilities of the Blue force, i.e., the weapons held by
the sentries and their characteristics, is provided in Chapter II. A general literature review
about important terms and methods used during this thesis are also explained in this
chapter. Chapter III provides an overview of the methodology adapted for the research. In
addition, this chapter also explains the agent-based modeling environment Map Aware
Non-uniform Automata (MANA) that is used for simulating the scenario. Chapter IV
describes the efficient design of experiments (DOE) techniques used to explore the model
to answer the research questions. Chapter V presents an analysis of the data obtained
from the simulation experiments and Chapter VI summarizes the conclusion drawn from
the analysis.

4
THIS PAGE INTENTIONALLY LEFT BLANK

5
II. CAPABILITIES, SCENARIO DESCRIPTION, AND LITERATURE REVIEW
This chapter describes the capabilities and characteristics of different weapons
held by Blue units. It also describes the operational setting used to calculate the measure
of effectiveness (MOE), i.e., the probability of successful defense by Blue. In addition,
this chapter discusses important concepts and methods used during this study.
A. BLUE UNIT’S RESOURCES AND CAPABILITIES
Sentries onboard ships are posted as per the threat level enforced. The strength of
these sentries and the weapons carried by them depends on the threat level. If the threat
level is high, sentries are required to man big caliber guns and the number of sentries will
increase. Threat level is issued via shore authorities and the ship has no control over it. A
ship may take measures as per the threat level enforced, or if deemed appropriate by the
commanding officer, as per one level above the level promulgated. The following are the
type of guns carried/manned by sentries:
• 7.62mm G3/M16
• 7.62mm LMG
• 12.7mm Gun
1. 7.62mm G3 / 5.56mm M-16
Sentries armed with assault rifles are deployed if the threat level is low or it is
considered that no attack will occur without adequate warning. The two types of assault
rifles being considered here are the G3A3 and M16A4 (see Figure 1), respectively. Table
1 depicts the general characteristics of these assault rifles.

6
Table 1. Assault Rifle General Characteristics. Adapted from “Automatic rifle G3A3 & G3P4” (n.d.), Powers (2016).
Rifle Country ROF Magazine Capacity
7.62 mm G3A3 Pakistan 500–600 rpm 20 rounds
5.56 mm M16A4 U.S. 700–750 rpm 30 rounds
Figure 1. Assault Rifles G3A3 and M16A4. Source: “Assault Rifle G3” (n.d.), “M16A4” (n.d.)
2. 7.62mm Light Machine Gun LMG MG1A3
Another potential weapon manned is the 7.62mm machine gun. “The MG3
(MG1A3) is an open, fully automatic weapon for sustained firing and firing in bursts. It is
a ‘recoil-operated weapon’ in which the recoil forces are used to feed and load the
cartridges and to extract and eject the spent cartridge cases” (“Machine Gun MG3
(MG1A3)”, n.d.). It is a highly effective weapon in terms of its rate of fire (ROF) and
ammunition capacity. Table 2 depicts general characteristics of a 7.62mm LMG.
Table 2. Light Machine Gun Characteristics. Adapted from “Machine Gun MG3 (MG1A3)” (n.d.), “M240” (n.d.).
Weapon Country ROF Magazine Capacity
7.62 mm MG1A3 Pakistan 1000–1300 rpm 250 rounds
7.62 mm Browning M240 U.S. 650–1000 200 rounds

7
The two different types of machine guns, whose characteristics are given in Table
2, are depicted in Figure 2.
Figure 2. Browning M240 (U.S.) and LMG MG1A3 (Pakistan), Source: “Machine Gun MG3 (MG1A3)” (n.d.), “M240” (n.d.).
3. 12.7mm Gun
A 12.7 mm gun is an automatic weapon that employs 12.7 mm armor piercing
(AP), armor piercing incendiary (API), and hard core ammunition. It is very effective
against low flying aircraft and ground targets, especially armored vehicles (“Anti-Aircraft
Machine Gun 12.7 MM TYPE 54,” n.d.). Therefore, it can be considered the most
effective weapon against incoming suicide boats, especially if the aim is to destroy and
sink the boat. Table 3 depicts the general characteristics of two types of 12.7 mm guns.
Table 3. 12.7mm Machine Gun Characteristics. Adapted from “Anti-Aircraft Machine Gun 12.7 MM TYPE 54” (n.d.),
“Browning M2” (n.d.).
Weapon Country ROF Magazine
Capacity
Armor
Penetration
12.7mm gun Pakistan 600 rpm 70 rounds 15mm at 500 m
12.7mm Browning
M2 (HMG)
U.S. 500 rpm 110 rounds 15mm at 500 m
Figure 3 depicts the 12.7 mm machine guns used onboard ships by the Pakistan
Navy and U.S. Navy.

8
Figure 3. 12.7mm Gun. Source: “Anti-Aircraft Machine Gun 12.7 MM TYPE 54” (n.d.), “Browning 12.7mm” (n.d.).
B. SCENARIO
A general depiction of the scenario we analyze is given in Figure 4.
Figure 4. General Depiction of Scenario.

9
Figure 4 shows a Blue ship berthed at a civilian harbor. The threat level is high, so
three armed sentries are deployed onboard the ship. In addition to these sentries, one
patrol boat is also patrolling in the area. The purpose of this boat is to ensure that no
threat boat is able to reach the ship. To ensure this, an exclusion zone of 50 meters is
established seaward side of the ship and no unidentified boat is allowed to enter in this
area. If any boat tries to force her way towards the ship and enters the exclusion zone,
then all sentries are allowed to fire on the threat boat until it is neutralized. Outside the
exclusion zone, normal harbor traffic is allowed, including cargo dhows, recreational
boats, and fishing vessels. The Red force consists of one or two Red explosive-laden
suicide boats, which are not identified until these boats try to force their way towards the
ship and enter the exclusion zone. It is assumed that as soon as any Red boat alters her
course towards the ship, she will increase her speed to maximum and try to ram her boat
into the side of the Blue ship. The Red boat is successful if any one or all of the Red
boats are able to reach the ship’s side (i.e., Red successfully rams boats into the Blue
ship). The Blue force is successful if all Red boats are neutralized before they were able
to reach their target.
C. CIRCULATION MODEL
Defense of naval ships in harbor is best explained by the half leg of a circulation
model. Defensive weapons on the ship and patrol boats are not the only available
defensive arrangement for the ship; rather the ship’s defense is a tiered operation, and
sentries and patrol boats are the last tier of its defense. Another important tier is the
“harbor protection organization.” The purpose of this study is to analyze the last tier of
the ship’s defense. This last tier becomes particularly important when the ship is berthed
in a foreign port where we do not control, have much information, or trust on other tiers.
The circulation model is explained in ensuing paragraphs.
Let’s say a terrorist leaves his base to attack a naval ship in harbor. After he gets
into the water with an explosives-laden boat, he is expected to encounter two main tiers
of defense. Each of the tiers has its own factors and players which will define the
effectiveness of that tier in stopping the terrorist. These tiers will each have their own

10
probability of detection/hunting the terrorist and similarly the terrorist will have his
survival probability from each tier. In this model we assume independence of these two
tiers, although in reality they can be somewhat dependent depending on the coordination
between harbor security and ship security. This concept is illustrated in Figure 5.
Figure 5. Circulation Model for Terrorist Survival.
ph = probability (terrorist neutralized by harbor defense personnel).
ps = probability (terrorist is neutralized by ship based/patrol boat sentries).
qh = probability (terrorist is not neutralized by harbor patrol defense) = survival
probability of terrorist from harbor defense personnel = 1 – ph.
qs = probability (terrorist is not neutralized by ship based defense) = survival
probability of terrorist against ship based defense = 1 − ps.
The aggregate survival probability of a terrorist for a successful attack on the ship
is q, which can be calculated as:

11
q = qh × qs
So, q is one of two parts of the survival probability of the terrorist. As we are considering
a suicide boat mission against the ship, the other part of the circulation model is not
important, thereby the whole model can be viewed as a half circulation model, which
simplifies to a Bernoulli distribution.
Let us suppose each tier has a probability of neutralizing the terrorist of 0.6; then,
for a terrorist we have qh = qs = (1 − 0.6) = 0.4, which means that the terrorist has 40%
chance of survival at each stage. Then, the cumulative probability that a terrorist can have
a successful attack on a ship berthed at harbor can be calculated as:
q = qh × qs = 0.4 × 0.4 = 0.16,
which means that each terrorist has a 16% chance that he will be successful, assuming
independence between all events. The probability of his success can be reduced by
increasing the probability to neutralize the terrorist at any one or all of the stages. If the
probability of intercepting the threat is increased by 0.1 at each stage, then the chances of
success for a terrorist decreases drastically and it comes down to 9%. If ships are berthed
at a home port, then ph is important. However, if the ship is in a foreign port, then ps (the
probability of terrorist neutralization by the ship) becomes very important. At that time, it
becomes very important for the ship’s Commanding Officer to increase ps as much as
possible to decrease the terrorist’s probability of success.
D. EXPLOSIVES USED IN SUICIDE BOATS
There are hundreds of types of explosives used by terrorists. The explosives may
be stable and not explode even if someone shoots at it or even sets it on fire. In other
cases, the explosive can be very sensitive to fire or a bullet hit. Although it may be true in
rare cases that explosives are sensitive, generally it is not true. Explosives that terrorists
generally use are inert and are not affected even if they are sprayed with bullets.

12
1. Categories of Explosives
There are hundreds of formulas and compounds of explosive materials.
Explosives can consist of a chemically pure compound, such as nitroglycerin, or a
mixture of a catalyst fuel and oxidizer mixture, such as black powder (Peters, Tanner, &
Kasper, 2010). The United States Bureau of Alcohol, Tobacco, Firearms, and Explosives
(ATF) categorizes explosives into three types.
a. Low Explosives
Low explosives deflagrate, meaning, they combust at much slower rates, thereby
giving a reaction of a burst or flair of flame (Peters et al., 2010). Most fireworks fall into
this category. These explosives are primarily used as a propellant to push an object.
However, when low explosives are packed in a container, then natural forces of physics
come in play and these explosives can be very dangerous and can detonate like high
explosives.
b. High Explosives
High explosives are those that are generally used for commercial applications like
demolition, mining, and military uses (Peters et al., 2010). These explosives can be
initiated using a blasting cap, which sends a shock wave into the explosive to cause it to
burn. The burn rate of high explosives is very high. It causes more destruction as a shock
wave is generated due to its high burn rate.
c. Blasting Agents
Blasting agents are a mix of fuel and oxidizer that produce a high pressure
shockwave when detonated (Peters et al., 2010). On their own they cannot be ignited or
burned, as they require a more sensitive high explosive booster to set them off.
2. Explosives Generally Used by Terrorists
When not in custody of gunpowder, terrorists often resort to improvisation to
fulfill their evil deeds, by using improvised explosives. Generally available material,
which is used as improvised explosives and is expected to be used by terrorists in urban
13
areas when gunpowder is not easily available, is inert and stable. The following is a list of
generally used materials (there are many more as well) that can be used for making an
improvised explosive device (IED) (Asthana & Nirmal, 2008):
• Chlorate Mixtures
• Flash Powders
• Bangor (Firecracker Powder)
• Permagnate Powder
• Ammonium Nitrate and Aluminum Powder
• Ammonium Nitrate Gel Explosives
These are the chemical names of the main substances used for making IEDs, according to
the fact sheet by National Academies and Department of Homeland Security (Department
of Homeland Security, 2008). The fact sheet further explains:
Many commonly available materials, such as fertilizer, gunpowder, and hydrogen peroxide, can be used as explosive materials in IEDs. Explosives must contain a fuel and an oxidizer, which provides the oxygen needed to sustain the reaction. A common example is ANFO, a mixture of ammonium nitrate, which acts as the oxidizer, and fuel oil (the fuel source). Concern about the use of explosives created from liquid components that can be transported in a stable form and mixed at the site of attack is the reason that in 2006 the U.S. Department of Homeland Security restricted the amount of liquids that passengers can carry on commercial aircraft. (Department of Homeland Security, 2008)
E. LITERATURE REVIEW
Various studies have addressed the defense of a naval ship against fast moving
small boats; however, we mention three in particular that have used agent-based
simulation to gain insight into tactical recommendations.
The first study was a thesis done in June, 2011, by Lt Cdr Thomas Tsilis of the
Hellenic Navy, at the Naval Postgraduate School. The author explored the key factors
involved in escorting merchantmen through the Internationally Recommended Transit
Corridor (IRTC) in the Gulf of Aden, as a defense against small pirate boats. He used

14
MANA and design of experiments to conclude that “convoys are most successful when
they contain fewer than 14 merchant ships, travel at speeds greater than 18 knots, position
the warship in front or on the flank of the convoy, and identify pirates at a range of no
less than 4 kilometers” (Tsilis, 2011).
The second study was conducted by Lisa R. Sickinger, Lieutenant, USN, in 2006.
Her research was sponsored by the US Joint Non-Lethal Weapons Directorate. LT
Sickinger considered a naval warship’s defense against small boats while returning to a
port and entering the harbor. The study’s main research question was “What non-lethal
capabilities are required in a maritime force protection environment in order to
effectively determine intent and/or deter suspicious small vessels?” (Sickinger, 2006).
During the course of study Sickinger used Multi Agent Simulation (MAS) alongside
efficient design of experiments and data farming techniques to explore and answer her
research question.
The third study, which is related to this thesis, was done by Felix Martinez
Tiburcio, Lieutenant, Mexican Navy, in December 2005. Martinez analyzed the strategy
developed by the Mexican Navy to prevent terrorist attacks on the strategic Campeche
Sound (petroleum production area) in the Gulf of Mexico. Martinez used agent-based
simulation, implemented in Map Aware Non-uniform Automata (MANA), and data
farming to analyze and evaluate his research questions. From the study, Martinez
concluded that “the most important threat factor in the scenarios is the speed of the
enemy boats; and, with its broad surveillance and communication capabilities, the
HAWKEYE is the most important Navy resource in the area” (Tiburcio, 2005).
All three studies dealt with naval ships against terrorist boats/fast patrol boats by
using agent-based simulation, data farming, and design of experiments in different
scenarios. Leveraging this methodology, this study deals with a scenario in which a naval
ship is berthed at harbor and all major systems of the ship are switched off, and thus, the
defense of the ship is entirely dependent on the vigilance, alertness, and abilities of the
sentries posted.

15
III. METHODOLOGY AND MODEL DESCRIPTION
A. METHODOLOGY
To carry out this study, an agent-based modeling platform known as Map Aware
Non-Uniform Automata (MANA) was used to model different scenarios. By using
MANA, the technique of data farming was used to generate data for subsequent analysis.
Data farming is the process of using simulation and efficient design of experiments to
“grow” output data, which can then be analyzed using data analysis and visualization
techniques (Lucas, Kelton, Sanchez, Sanchez, & Anderson, 2015). After choosing factors
and the ranges of these factors to explore, an efficient design of experiments (DOE) and
cluster computing is used to computationally generate output data. This data is analyzed
in order to identify significant factors, important thresholds, and to see whether
interactions exist between key variables. After data collection, JMP statistical software is
used to analyze the effectiveness of different weapons and tactics in protecting ships
berthed at harbor.
B. CALCULATION OF PROBABILITY OF HIT
In order to analyze the protection measures of naval vessels berthed at harbor, it is
important to calculate the probability of hit for all the weapons being carried by sentries.
To calculate the probability of hit of a G3/12.7mm/7.62mm LMG, a small simulation
using the ‘R’ language (https://www.r-project.org/) was run. To calculate the probability
of hit (Phit) against a man-sized target, a target containing two rectangles, one on
another, was considered. It is assumed that the driver of the boat is behind the wheel of
the Red boat and a sentry has to hit the driver. It is also assumed that the driver’s upper
body is visible and his legs are behind some structure. So, two rectangles, one on top of
other, are considered to depict a man from some distance. The lower rectangle is 1.5 ×
2.5 feet and the upper rectangle is 1 × 1 feet. This is depicted in Figure 6.

16
Figure 6. Depiction of Driver in the Form of Two Rectangles.
To calculate the probability of hit of the weapons, this target was bombarded with
1,000 simulated rounds having specified standard deviations in the x and y axes to
represent weapon error. The aim-point of the bombardment was always the center of
mass, with no aim point bias error. Although the exact values of the standard deviations
in the x and y axis are unknown, but based on practical experience, standard deviations
were estimated as a function of range. The values used were σx = 0.005×range and σy =
0.005×range in meters. Then, the probability of hit, using the data from simulations run
in “R,” was calculated out to 100 meters. Two different situations were simulated. First,
the upper body of the boat driver is visible to the firer and the firer aims at the center of
mass. In the second condition, it is simulated that boat driver has a shelter in front of him
and only the head is visible, so any fire that is away from the upper rectangle (head) is
counted as a miss. Figure 7 depicts the graph of the probability of hit, obtained when the
target was fired upon by a sentry at ranges varying between 0 and 100 meters.

17
Figure 7. Probability of Hit of Small Arms versus Range (Meters).
It is found that the probability of hit for all weapons is near one in both cases, if
the weapon is to be fired at less than 60 meters (which is our main analysis area).
However, this is the probability of hit by the weapon, not including the error induced by
the shooter. The probability of hit by a shooter can be very different than the inherent
probability of hit of the weapon. In an actual scenario, a lot of factors play a pivotal role
in specifying the probability of hit, and these include, but are not limited to, the
following:
• The armed sentry knows that the approaching boat is a suicide boat, so fear may play a very big role.
• Wind conditions at that time can cause inaccuracy of the shot.
• Only 8–10 seconds are available for a sentry to aim, fire, and neutralize the threat, as a 12 knot boat will take 8–10 seconds to cross the exclusion zone and hit the ship.
• The boat, and therefore the driver, is a moving target.
• The sea state may cause the boat as well as sentries to move up and down with the water, hence making it difficult for the sentries to shoot accurately.
All these factors and other conditions may be prevalent at that time, and could
play a very important role in lowering the probability of hit of each weapon. Although no
data is available to determine the probability of hit in such conditions, it is assumed that
the probability of hit for individual rounds may decrease significantly.

18
If we consider that the probability of an individual round hitting the target reduces
to 0.3, then the following is the calculation for multiple independent shots:
• Probability of hit of an individual shot = p = 0.3.
• Number of shots fired = n = 10.
• Probability of at-least one successful shot = 1 − (1 − p)n = 0.9717.
This calculation shows that even if an individual shot has a very low probability of hit,
due to multiple shots being fired in burst mode by automatic weapons, the cumulative
probability of hit increases very rapidly to one (assuming independence). We can see that
within 10 rounds the probability of hit increases to near one. This means that in
conditions such that the sentries are able to shoot several times, the terrorist will likely be
neutralized. But, that’s the case when only one shot is enough to neutralize the terrorist.
However, in most of the cases, the objective of sentries is not to neutralize the terrorist,
but to neutralize the suicide boat, which may take far more shots before it is disabled.
Keeping this in mind, the single shot probability of hit for these weapons was taken as a
factor in the design of experiments (DOE), and it was varied from 0.2 to 0.8.
C. MANA
The modeling environment used to simulate the scenario is Map Aware Non-
Uniform Automata (MANA). MANA is a time-stepped, stochastic, agent-based
distillation model developed by the Defense Technology Agency (DTA) of New Zealand.
As the name suggests, the individual entities (agents) in MANA are “map aware,” which
means that during the simulation individual entities’ situational awareness includes both
terrain information and battle space activities. MANA incorporates several features not
appearing in some other (simpler) cellular automaton combat models; for example, “the
MANA model uses a ‘memory map’ to provide shared situational awareness and guide
entities about the battlefield” (McIntosh, 2007, p iii).

19
D. WHY WE USE AN AGENT-BASED MODEL
According to Grimm and Railsback, “Agent-based models” can be defined as:
An agent-based model (ABM) is one of a class of computational models for simulating the actions and interactions of autonomous agents (both individual and collective entities such as organizations or groups) with a view to assessing their effects on the system as a whole. It combines elements of game theory, complex systems, emergence, computational sociology, multi-agent systems, and evolutionary programming. Monte Carlo methods are used to introduce randomness. ABMs are also called individual-based models (IBMs). (Grimm & Railsback, 2005, p. 485)
Agent-based models are the computational models of heterogeneous populations
of agents and their interactions. It has always been a researcher’s goal to describe any
processes or event with the most simple model and method that can explain that process
with an acceptable degree of accuracy.
The next question that comes to mind is: Why an agent- based model? In military
applications, many different types of models are used to find the optimal solution of wide
range of problems. It is best explained by Winston:
Because of complexity, stochastic relations, and so on, not all real-word problems can be represented adequately in closed-formed models. Attempts to use analytical models for such systems usually require so many simplifying assumptions that the solutions are likely to be inferior or inadequate for implementation. Often, in such instances, the only alternative form of modeling and analysis available for the decision maker is simulation. (Winston, 2004)
Agent-based modeling adds a new aspect to simulations of combat systems. It
allows direct representation of individual battlefield entities and their interactions. We all
know that all individuals are different. Even though in the military, uniformity in actions
and responses is imparted via training and SOPs, it is still true that different individuals
behave differently under varying circumstances and pressure. The varying responses
reflect stochasticity on the part of individual entities. By using agent-based models, the
essence of individual behavior is captured and by running stochastic simulations, a range
of results is produced, which can help provide insight on possible outcomes of combat
scenarios.

20
E. MODEL IMPLEMENTATION IN MANA
After selecting MANA as the modeling environment and deciding on the details
of the desired conceptual model, a base case scenario was developed. The following are
some important aspects of MANA that were used to build the scenario.
1. Battlefield
The first thing to be done in MANA is to define the battlefield, as MANA
recognizes different types of terrain. It is important to select the terrain according to the
scenario when building the model. The user defines the battlefield area for a given
scenario (McIntosh, 2007). Although there are different types of terrains available, we
use the “Billiard Table” terrain, which affords maximum mobility and no concealment or
protection. In this case, we simulate movement of Blue and Red entities on the water
where no physical barrier hampers the movement, so the Billiard Table terrain type is
appropriate. The battlefield settings, including size of the battlefield, are illustrated in
Figure 8.

21
Figure 8. Edit Battlefield Tab.
2. Squad
Groupings of homogeneous (same initial behavioral and physical properties) are
called “squads” in MANA. “Conceptually, a squad is a group of agents of any size
(between 1 and 1,000), as defined by user. Agents in a squad share the same properties
and can switch into different states depending on their circumstances” (McIntosh, 2007,
p. 7). A MANA squad should not be confused with an infantry squad. Agents in a squad
are defined based on their properties with respect to their weapons, characteristics, and
behaviors. For the purpose of this model, five different type of squads were defined; three
blue squads, one red squad and one neutral squad. To add or edit squad properties in
MANA, the “Edit Squad Properties” tab in the setup menu is used. Different tabs within
“Edit Squad Properties” are further explained in the following sections.

22
a. General
On the General tab, several general properties of the squad are assigned, for
example, the squad name, the number of agents in each squad, the initial orientation of
the squad, and the fuel available to each member of the squad. General tab settings are
illustrated in Figure 9.
Figure 9. General Properties for Each Squad.
23
b. Map
Under the Map tab, the initial position for every squad is set by specifying their
home boxes. All squads will start from their assigned home box when the simulation run
starts. Similarly, way points and a final destination for each squad are also given using
the same tab (McIntosh, 2007). An illustration of the “Map” tab is given in Figure 10.
Figure 10. Map Tab Used to Give Initial Start and Final Destination.
c. Personalities
The Personalities tab is very important, as it is used to define the behavior of
individual squad members. Here, how an agent should behave in response to enemy,
friends, and neutrals is defined. For example, the desires to move towards or away from
an enemy, friend, or destination points, are defined here. Agents are given simple rules to

24
move on the battlefield depending on the location of other agents and conditions on the
battlefield (McIntosh, 2007). Using the sliding bar, personality weightings for different
actions are defined by the user. Other options available within this tab are illustrated in
Figure 11.
Figure 11. Personality Tab Options.
d. Tangibles
Beside personality weightings, there are a number of tangible aspects or physical
properties that can be defined under this tab. These include:
• General properties such as allegiance, sensor height of agent, movement speed, and agent class

25
• Self-protection features, such as the number of hits to kill, concealment, and armor thickness
• Waypoint radius (how close an agent has to be to a waypoint to be considered to have arrived at it)
• Fuel consumption rate
• Embussing behavior (determines when a “child” agent is to be released from a “parent” agent)
This tab is depicted in Figure 12.
Figure 12. Tangibles Tab for Describing Physical Properties of Squad.

26
e. Sensors
The sensor model in MANA is intuitive and incorporates simple probabilistic
calculations within the sensor range of each agent (McIntosh, 2007). In the sensor tab, we
can assign range-probability pairs for detection and classification. Detection is knowing
that “something” is present and classification is knowing whether the detected agent is a
friend, enemy, or neutral. One other important property is that the user can also specify
which class(es) of agents can be detected or classified by that particular sensor. An
illustration of sensor tab is given in Figure 13.
Figure 13. Sensors Tab.

27
f. Weapons
Like sensors, weapons in MANA are also based on probabilistic calculations
(McIntosh, 2007). Here, the user can assign primary and secondary weapons (up to four
classes of weapons can be assigned) to a squad and the user can specify probabilities of
hit for each bullet at different ranges. Also, the weapons carried by the squad can be
classified as kinetic energy or high explosive. A screen shot of the Weapons tab is
depicted in Figure 14.
Figure 14. Weapons Tab.

28
g. Trigger State
For a base MANA scenario, all the characteristics and behavior of squad/agents
are first defined for each squad’s default state (McIntosh, 2007). For a simple scenario,
this is all that may be required. But, for more complex scenarios, there may be a situation
which warrants the behavior of an agent to change when certain conditions are fulfilled.
For example, a squad may only be on a surveillance mission and is not allowed to fire on
enemy agents until fired upon. In such situations, trigger states play a vital role. The user
can also specify if an agent is forced into a trigger state, how long it will remain in the
new state, and whether the agent will stay there, or return to its default state or any other
new state. Figure 15 shows some of the trigger states available in MANA.
Figure 15. A Portion of the Trigger States Available to Agents in MANA.

29
h. Inter Squad SA/Intra Squad SA
There are two situational awareness (SA) tabs, which are used to define
communication within the squad as well as between different squads. The Intra Squad SA
controls the flow of the situational awareness within a squad and does not vary with the
trigger states; all of the agents in the simulation retain their original parameters. The Inter
Squad SA controls the flow of situational awareness between different squads
(McIntosh, 2007).
i. Fuel
Fuel capacity and consumption can be defined for each agent. Fuel can be used to
represent a variety of quantities in study (food, batteries, endurance, etc.) and does not
necessarily have to represent literal fuel. “Fuel” exchange can be used as a creative and
symbolic interaction that might, for example, be used to trigger a state change. Examples
of the creative use of fuel as given by the MANA manual are:
• Recording accumulation of some trait such as courage, fatigue or discontent
• Recording interactions with other agents, such as getting “close enough” to trigger a change
• Modeling the logistic supply for some commodity
F. ASSUMPTIONS AND LIMITATION OF MODELING IN MANA
No software model can capture reality one hundred percent. Every model has its
own unique limitations, and additionally, the user must also make certain assumptions
while creating the scenario. The following are important limitations and assumptions with
regard to the MANA model developed for this thesis:
• When the sentry weapon probability of hit was varied as an input factor
for the design of experiments, the probability of hit for all sentry weapons were changed together (lock-stepped) for one simulation run. In reality, different sentries will have different probabilities of hit.
• In the MANA scenario, sentries are always alert and they start firing without any delay as soon as they become aware of a classified enemy. Also, as soon as a Red boat crosses the exclusion zone, sentries start firing

30
simultaneously. In an actual scenario, there may be a delay of few seconds and that too will vary from sentry to sentry. Some may have a delay of one second and some may have a delay of three seconds or even more.
• In MANA weapons always fire. In reality, weapons may misfire.
• In MANA, sensors either make a detection, or a classification, or neither. It is not possible to make an incorrect classification (for example, incorrectly classifying an enemy as a neutral or friend).
• Battle damage assessment is instantaneous, and sentries never assess wrong. If Blue kills Red, he instantly knows it, and stops firing.
• There is no coordinated targeting amongst Blue sentries. Blue sentries independently decide to fire or not, and do not take into consideration who the other sentries are firing at. Thus, two or more sentries may fire upon the same Red boat at the same time. This may or may not be desirable. It is an option, however, for one squad to have the “fire on closest targets” property activated, while another does not.
• In this scenario, the fire rate, magazine size, and lethality of all weapons is the same. In reality, there may be variation in these.
An annotated picture of MANA scenario is depicted in Figure 16.
Figure 16. Annotated Snapshot of the MANA Battle Scenario.

31
IV. DESIGN OF EXPERIMENTS
The more accurate the map, the more it resembles the territory. The most accurate map possible would be the territory, and thus would be perfectly accurate and perfectly useless.
—Neil Gaiman, American Gods
“One of the first things an experimenter or tester must do to design a good
experiment is identify the experimental factors” (Sanchez & Wan, 2009, p. 61). In any
process different factors may have a significant effect on that process and its output.
These factors and their levels are used to determine the design for a particular
experiment. A general way of exploring a process is to vary factors one at a time and
observe how it affects the output of that process. However, it is not efficient or effective
to vary factors one at a time. Factors may have an interaction between them, which
means their effect on the output depends on the value of another factor, and without
simultaneously varying the factors, their interactions can never be identified. Through
design of experiments, the relationship between the input factors and output measure
(response) can be explored in a systematic and effective way. According to Sanchez &
Wan (2009), “if you are interested in exploring the behavior of a simulation model with
more than a handful of input factors, efficient experimental designs are readily
available—and much more powerful—than a petaflop supercomputer” (Sanchez & Wan,
2009, p. 73).
A. NEARLY ORTHOGONAL LATIN HYPERCUBE (NOLH)
A very efficient proven way to design experiments is through the use of the Latin
Hypercube (LHs). According to Sanchez & Wan (2009), “Latin hypercube designs
provide a flexible way of constructing efficient designs for many quantitative factors.
LHs have the appealing space-filling properties of factorial designs with fine grids, but
require orders of magnitude less sampling” (p. 68). LH designs are very effective because
of their efficiency, space-filling properties, and analysis flexibility.

32
In comparison to gridded designs, Nearly Orthogonal Latin Hypercubes (NOLHs)
are very effective and provide better coverage. Efficient NOLH designs were constructed
by Lucas and Cioppa in 2007 (Lucas & Cioppa, 2007). For modest numbers of factors,
efficient NOLH designs have excellent space-filling and orthogonality properties. Despite
their usefulness, Latin hypercubes are sometimes plagued with unacceptable correlation
among input variables. Hernandez, Lucas, and Carlyle (2012) expanded the set of readily
available NOLHs. They developed a mixed integer programming algorithm capable of
generating Latin hypercubes with little or no correlation, thereby overcoming the problem
of correlation among input variables (Hernandez, Lucas, & Carlyle, 2012). Near
orthogonality in Latin hypercubes guarantees that the factors are not confounded; and
space-filling guarantees that there are no large gaps in the exploration. Just to give an
example: if we want to explore a model with four factors and each factor has two levels,
then there will be 24 = 16 design points in a full factorial (all possible combinations)
design. Alternatively, we can explore those four factors, each at more than two levels,
using a catalogued NOLH design freely available via an Excel workbook that can be
downloaded from https://harvest.nps.edu. The NOLH will give far better coverage and
we can add up to three more factors without any additional sampling, and this can be
accomplished with only 17 design points, only one more than the 16 design points
required for the 2-level full factorial gridded design (see Figure 17 for a comparison).

33
Adapted from class notes in OA-4333, Simulation Analysis.
Figure 17. Comparison of Gridded Design and NOLH.
B. EXPERIMENT FACTORS
Based on our knowledge of the scenario and analysis goals, we vary the following
factors in the DOE:
• Probability of hit by Blue sentries
• Number of Blue sentries
• Number of Blue patrol boats
• Blue sentry weapons configuration
• Width of exclusion zone
• Number of Red boats
• Speed of Red boats after they enter the exclusion zone
• Number of shots Red boats takes before being neutralized
The ranges and levels for these factors are given in Tables 4, 5, and 6. Table 4
lists the three weapon options available for the Blue sentries.

34
Table 4. Blue Sentry Weapon Options.
Weapon Type ROF (Rounds per minute)
Magazine Capacity
W1 (7.62mm gun) 500 20 W2 (7.62mm Machine Gun) 1100 250 W3 (12.7mm ) 600 70
Table 5 gives the set of eight cases (options) for how the three Blue sentries are
equipped with weapons.
Table 5. Possible Blue Sentry Weapons Configuration.
Sentry 1 Sentry 2 Sentry 3 W1 W2 W1 W1 W2 --- (no weapon) W1 W3 --- (no weapon) W1 W2 W2 W1 W3 W1 W1 W3 W3 W1 W2 W3 W3 W2 W3
Another important factor is the availability of a Blue patrol boat, so the two
different levels for Blue patrol boat are zero and one, where one indicates that a boat is
protecting the exclusion zone and zero indicates no Blue patrol boat. Besides the Weapon
Configuration and Patrol Boat factors, the following six factors, in Table 6, were varied.
These 6 total factors were explored using a 257 design point NOLH.
Table 6. The Other Six Factors with Ranges.
No Variable Min Value Max Value 1 Probability of hit 0.2 0.8 2 Number of sentries (on ship) 2 3 3 Number of Red boats 1 2 4 Speed of Red boat after it the enters
exclusion zone 8 22
5 Exclusion zone width (in steps of 10) 40 90 6 Number of shots taken by Red boats before
they are disabled 1 25

35
The 257 design points NOLH for the above six factors gave a maximum absolute
pairwise correlation of 0.058, which is only slightly above the desired target of .05, due
to rounding for discrete factors. Figure 18 displays the pairwise correlations and pairwise
scatter plots for the six factors.
Figure 18. Pairwise Correlation between 257 Design Points NOLH for 6 Factors.
These 257 design points were then crossed with a full factorial for the eight levels of Blue
sentry weapon configuration and the two levels for number of Blue patrol boats. This
yielded a total of 4,112 final design points (8×2×257 = 4,112) for our experiment. These
4,112 design points represent 4,112 different simulated conditions of an attack on a ship
when it is berthed at harbor. Since MANA is stochastic, each of the design points was

36
replicated 100 times. The experiment was run on the Simulation Experiments and
Efficient Designs (SEED) high performance cluster. With 160 available processors, the
411,200 total runs were accomplished overnight. The SEED Center has also written a
data postprocessor that gathers the MANA output data from the individual runs and
places them into one file, together with the factor settings, facilitating easy loading and
analysis into a statistical tool of choice, such as Excel or JMP.

37
V. ANALYSIS OF DATA
This chapter uses statistical methods to analyze the data generated from the
experiment discussed in the previous chapter. For the analysis, the JMP statistical
package was the primary tool used (see www.jmp.com). We begin with an initial
assessment of the data and move to a more detailed analysis using a variety of statistical
methods. The primary output metric, our measure of effectiveness, is the probability Red
is able to achieve its goal of reaching the ship. The objective is to determine the
relationship between the input factors and the probability of the Red force achieving its
goal. To quantify this relationship, linear regression and partition tree techniques were
applied. Histograms and other plots were also used to explore the probability that the Red
force is able to achieve its goal as a function of the input conditions.
A. INITIAL ASSESSMENT OF DATA
After the completion of the simulation runs, the MANA output was obtained in
the form of a csv file, which contained 30 output columns and 411,200 rows—with one
row for each of the 411,200 simulated attacks on a Blue ship by one or two Red boats. A
snapshot of a portion of the output file is shown in Figure 19
Figure 19. Snapshot of Output File Obtained after Simulation Runs.
Out of these 30 MANA columns in the obtained csv file, only nine columns are of
importance for our analysis. Eight of the columns are the input factors and one column is
our response—a binary variable for whether or not Red achieved its goal. All of the rows
of data for these nine columns were placed in a separate file for analysis. This file was
Identifier ProbHit RedBoatSpRedBtHits WpnCase NumBlueSNumBluePExclusion NumRedB Run Seed Alleg1Cas(Alleg2Cas(Alleg0Cas(Blue Reach Red Reach Neutral Re StepsI0E0 0.44 20 15 1 3 0 70 2 1 3.14E+08 0 0 0 No Yes No 49I0E0 0.44 20 15 1 3 0 70 2 2 5.96E+08 0 0 0 No Yes No 34I0E0 0.44 20 15 1 3 0 70 2 3 -1.1E+08 0 0 0 No Yes No 31I0E0 0.44 20 15 1 3 0 70 2 4 1.63E+09 0 0 0 No Yes No 48I0E0 0.44 20 15 1 3 0 70 2 5 64128166 0 0 0 No Yes No 55I0E0 0.44 20 15 1 3 0 70 2 6 1.56E+09 0 0 0 No Yes No 57I0E0 0.44 20 15 1 3 0 70 2 7 -5.7E+08 0 0 0 No Yes No 36I0E0 0.44 20 15 1 3 0 70 2 8 5.87E+08 0 0 0 No Yes No 37

38
then imported into JMP. A histogram of “Red Reach Goal” across all 411,200 runs is
given in Figure 20.
Figure 20. Overall Distribution of “Red Achieves its Goal.”
The overall distribution of Red success indicates that Red forces were successful
approximately 59% of the time and Blue was able to stop Red 41% of the time. The
estimated standard error associated with 411,200 samples of independent Bernoulli
random variables with a success probability of .59 is 0.00077. However, it should be
noted that this histogram was obtained across all of simulated attacks and all of the input
combinations. We can view this histogram by one or more factor combinations. In Figure
21 we examine the histogram by the number of Red boats, one on the left and two on the
right.
Figure 21. Distribution of “Red Achieves its Goal” versus Number of Red Boats.
39
From Figure 21, we can see that in the situations in which there were two Red
boats, Red is able to achieve its goal 63% of time, as compared to 54% of time when the
attack was carried out using one Red boat. The estimated standard error associated with
samples of data when there is one red boat is 0.0011 and when there are two Red boats is
0.00105. That is, over all the input combinations, if Red attacks using two boats, then
Blue has 9% less chance of being successful in stopping the terrorist attack. The bar chart
in Figure 22 illustrates the comparison of success rate for Blue.
Figure 22. Success Rate for Blue Sentries by Number of Red Boats.
B. INFLUENTIAL FACTORS IN MODEL
One of our goals is to identify the most influential experiment factors, in order to
gain some insight into improving the effectiveness of the Blue force against a terrorist
boat attack. One method for exploring the relationship between the response and the
experiment factors is the partition tree.
1. Partition Tree
A partition tree is a useful, nonparametric technique used to explore the effect of
multiple factors on an output measure. The output can be categorical or continuous.
Partition trees, being nonparametric, do not make any assumptions about the distributions
of the underlying data. They additionally have the nice features of being able to easily
handle large data sets, as well as provide a result that is deemed by many non-technically
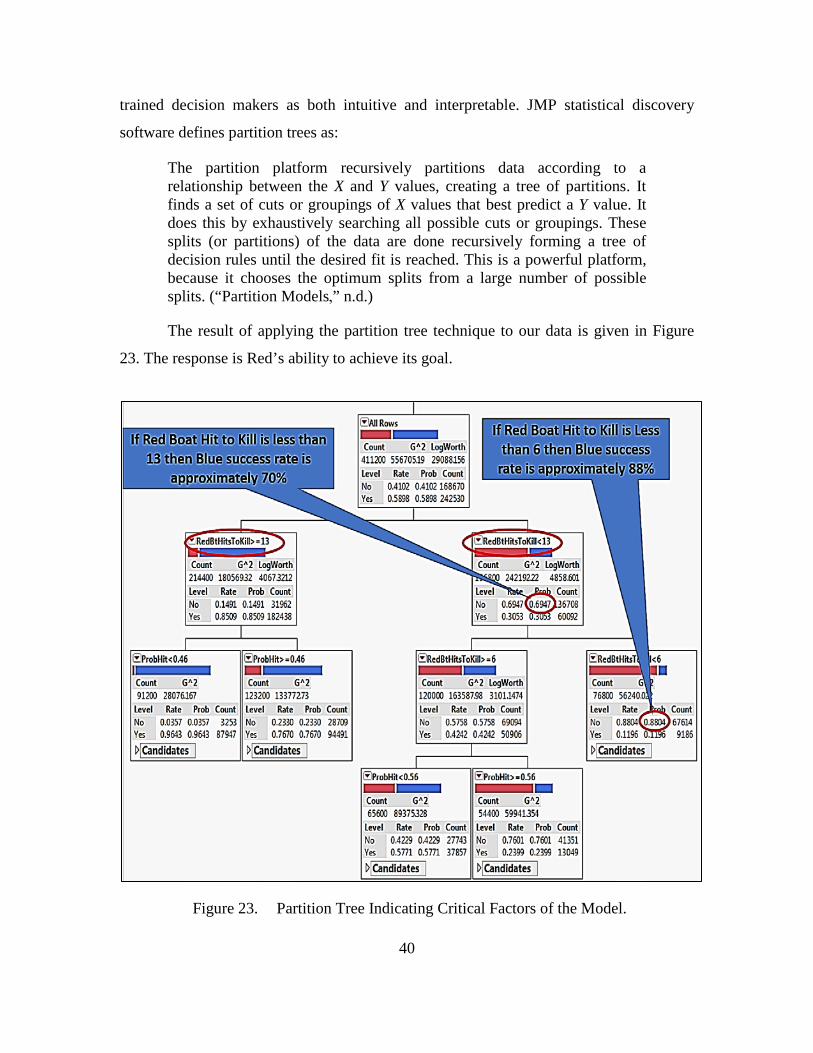
40
trained decision makers as both intuitive and interpretable. JMP statistical discovery
software defines partition trees as:
The partition platform recursively partitions data according to a relationship between the X and Y values, creating a tree of partitions. It finds a set of cuts or groupings of X values that best predict a Y value. It does this by exhaustively searching all possible cuts or groupings. These splits (or partitions) of the data are done recursively forming a tree of decision rules until the desired fit is reached. This is a powerful platform, because it chooses the optimum splits from a large number of possible splits. (“Partition Models,” n.d.)
The result of applying the partition tree technique to our data is given in Figure
23. The response is Red’s ability to achieve its goal.
Figure 23. Partition Tree Indicating Critical Factors of the Model.

41
The response variable selected for partition is “Red achieves its Goal,” and all
input factors were fed to the model. The goal of the analysis is to determine which factors
have the maximum impact on the response variable. We see that the first split occurs on
number of hits on Red boat to kill, which makes it an important factor. Red boats hits to
kill are defined as the number of shots fired by Blue agents to neutralize Red boat. This
depends on the lethality of Blue weapons and the staying power of Red. Since Blue
cannot control the staying power of Red, Blue weapon lethality has the most significant
effect of the controllable factors on the ability to stop a terrorist attack. The next split, in
each group, further defines the next most important factor in each respective group. In the
split performed on the “Red Hits to Kill < 13” category on the right, we see again that we
split on Red boat hits to kill. This suggests a nonlinear relationship between the
probability of Red success and number of shots fired by Blue to neutralize Red boats—
and that this single factor dominates. In subsequent splits, the probability of hit by Blue
sentries plays an important factor. Probability of hit is the probability that Blue sentries
will hit the Red boat per shot. So we can conclude that lethality followed by probability
of hit of Blue weapons (i.e., accuracy) are the two most critical factors in defeating Red
suicide boat attacks.
2. Analysis of Summarized Data
An alternative to analyzing the full data set with 411,200 rows, is to summarize
each of the 4,112 designs points by their mean and standard deviation. We then look to fit
metamodels to the means of the design points, in order to achieve higher R-square values.
For this approach, two new binary columns were created. The “Red Reaches Goal”
column was originally in the form of “Yes” and “No,” and this was converted to binary
numerical form, where one indicates “Yes” and zero indicates “No.” The complement of
this column is “Blue success,” which was also converted to a numerical binary form. A
snapshot of the new data file obtained is depicted in Figure 24.

42
Figure 24. Data Sheet Generated after Creation of Two New Columns in Binary Form.
For each of the 4,112 design points, the sample mean and standard deviation of
Red success and Blue success were calculated. This gives us 4,112 estimates of the
probability of Red and Blue success, an estimate for each of the design’s input
combinations. A snapshot of the new data file generated is shown in Figure 25.
Figure 25. Data Sheet Created after Collapsing (Summarizing) Data.

43
Histograms and summary statistics for Mean(Red Success) and Mean(Blue
Success) are given in Figure 26. Note that the histograms are reflections of each other.
That is, if Red is successful, then Blue is not. It is worth noting that Red’s empirical
probability of success ranges from zero to one over the 4,112 design points. So, we have
induced a good deal of variability with our experiment, useful for evaluating the impact
of the factors.
Figure 26. Histograms and Summary Statistics for Mean Blue and Red Success.
We can see that after collapsing the data, we obtain a partition tree very similar to
the one produced using the full data set. The insights as to the critical factors and breaks
are nearly identical. Figure 27 depicts the partition tree generated from the collapsed data.
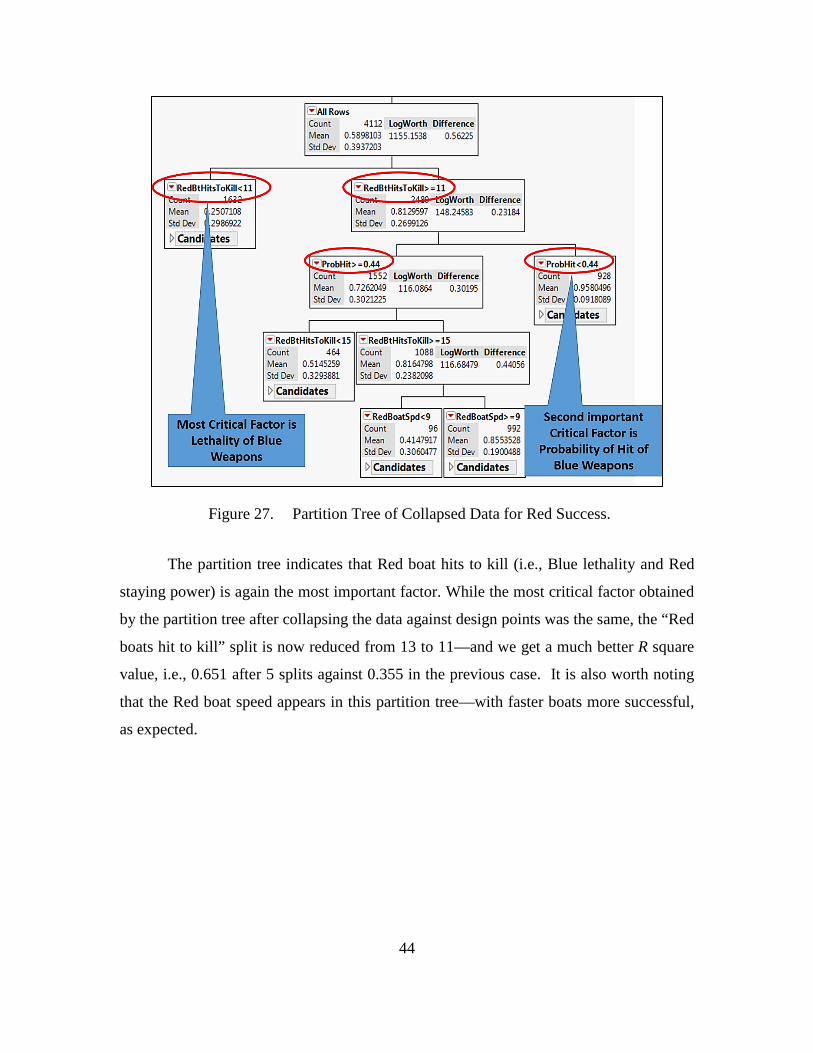
44
Figure 27. Partition Tree of Collapsed Data for Red Success.
The partition tree indicates that Red boat hits to kill (i.e., Blue lethality and Red
staying power) is again the most important factor. While the most critical factor obtained
by the partition tree after collapsing the data against design points was the same, the “Red
boats hit to kill” split is now reduced from 13 to 11—and we get a much better R square
value, i.e., 0.651 after 5 splits against 0.355 in the previous case. It is also worth noting
that the Red boat speed appears in this partition tree—with faster boats more successful,
as expected.

45
C. LOGISTIC FIT OF DATA
In order to check the individual effects of input factors on the probability of Red
success, a logistic regression fit for all input factors, one at a time, was carried out. Since
this approach does not consider interactions between the input factors, we complement
this technique with use of stepwise regression in the next section. Figure 28 shows the
logistic fit of the different input factors against the response.
Figure 28. Logistic Fit of the Response against Different Input Variables.
Here we can see that most variation comes from “Red boats hit to kill” or number
of shots fired by Blue to kill Red boat and probability of hit by Blue weapons. While not
as significant, we also see that Blue does better with more sentries and a patrol boat. Red
does better with two boats and greater attack speed. Weapon cases two and three were
associated with higher Red success, as compared to the other weapon cases. Although,
some labels in Figure 28 are not clearly visible, they appear clear in subsequent figures.
Figure 29 gives the whole model test for a logistic fit of Red Reaches Goal by probability
of hit of Blue weapons and number of Blue patrol boats.

46
Figure 29. Logistic Fit of Red Success by Probability of Hit and Number of Blue Patrol Boats.
Here we can see that the probability of hit and number of Blue patrol boats are both
significant factors as indicated by their respective p-values. The observation is consistent
with our previous findings. The logistic fit graphs show that probability of hit is more
impactful on the outcome than number of blue boats. This finding is also evident from the
R-square values, where bigger R-square values imply that the corresponding factor
explains more of the variability in the outcome. From Figure 29, we observe that R-
square values are low, but we have to keep in mind that these are one factor at a time fits
(while the other factors are changing in the “background”). The whole model test of
logistic fit for Red success against Red boat speed and shots required by Blue to
neutralize Red boats is given in Figure 30.

47
Figure 30. Logistic Fit of Red Success by Red Boat Speed and Red Boat Hits to Kill.
Here we can clearly see that most prominent factor, which has the biggest effect
on output, is Red boats hit to kill, i.e., the lethality of Blue weapons against the target—as
it causes the biggest change. The p-value also indicates its significance, and we can also
see that it has an R-square value of 0.3013, far bigger than other input factors. The other
factor, Red boats speed is also significant, as indicated by the p-value, but it has a low R-
square value, indicating that it has a lower effect on Red success as compared to lethality
of Blue weapons. The logistic fit for weapon configuration case and number of Blue
sentries is given in Figure 31.

48
Figure 31. Logistic Fit of Red Success by Weapon Case and Number of Blue Sentries.
The p-values of both factors indicate these are significant factors. In the case of
logistic fit of Red success by number of Blue sentries, we do not observe much change.
In the weapon case, we see that all weapon cases have approximately the same effect on
Red success except for weapon cases two and three. Weapon cases two and three have
two weapons only, as compared to three weapons by Blue sentries in all other cases, so
this result makes sense. Two weapons reduces the number of shots received by Red,
hence increasing the probability of Red success. Now the question is, why do all other
weapons have the same effect on Red success, despite these weapons cases corresponds
to different weapons combination with Blue sentries? After further analysis it was
revealed that this is a limitation of our model. In an actual scenario, the type of weapons
of Blue sentries determines the number of shots Red takes before it sinks, but in our
model we have defined hits to kill as a separate input factor. In MANA we cannot
directly define that when a sentry is using a particular type of weapon, then the Red boat
will have a particular staying power. Therefore, weapon case is not significant in defining

49
the staying power of Red boat, but it is important for determining the combined rate of
fire (ROF) by Blue sentries. The logistic fit of Red success for exclusion zone distance
and number of attacking Red boats is given in Figure 32.
Figure 32. Logistic Fit of Red Success by Exclusion Zone Distance and Number of Red Boats.
We see that both factors have very low p-values, thereby indicating that these are
significant factors. The number of Red boats has an intuitive effect on the outcome,
although not very pronounced. Out of these factors, we see that the exclusion zone
distance also has minimal effect, which is counter intuitive, so this aspect was further
explored by keeping all other factors as constant and running the MANA simulation for
different exclusion zone distances.

50
D. EXPLORING THE EFFECT OF EXCLUSION ZONE DISTANCE ON RED SUCCESS
Sometimes during an exploration of complicated simulations with many variables,
the effects of one or more factors are masked by other dominant factors. In order to
explore whether exclusion zone distance was dominated by other factors, we did a one
factor experiment on our scenario while keeping all the other factors constant. In the
basic scenario file of MANA, all input factors were fixed except the factor, “Exclusion
Zone Distance,” as shown in Table 7.
Table 7. Factors Used in Scenario for Exploring the Effect of Exclusion Zone Distance on Red Success.
No Input Factor Fixed Value in Scenario
1. Probability of Hit 0.4
2. Red Boat Speed 15
3. Weapon Case 8
4. Number of Blue Sentries 3
5. Number of Red Boats 2
6. Number of Blue Patrol Boat 1
7. Red Boat Hit to Kill (Staying Power) 25
8. Exclusion Zone Distance Varied for Exploration
After fixing the input factors as per Table 7, hundred simulations were run for
each scenario and the data was obtained. The output result of each simulation was placed
in Table 8.

51
Table 8. Mean Probability of Red Success against Exclusion Zone Distance while Keeping Other Inputs Constant.
Serial Number
Exclusion Zone Distance
Mean Probability (Red Success)
Estimated Standard Errors
1 40 0.31 0.046249 2 50 0.13 0.03363 3 60 0.05 0.021794 4 70 0.03 0.017059 5 80 0.02 0.014 6 90 0.01 0.00995
Table 8 is displayed graphically in Figure 33.
Figure 33. Probability of Red Success against Varying Exclusion Zone Distance.
It can be seen that, as exclusion zone distance increases from 40 to 60 meters the
probability of Red success decreases sharply, but after 60 meters there is not much
difference. The knee of curve lies at about 60 meters, indicating that a 60 meter exclusion
zone may be taken as an acceptable distance to protect the Blue ship.
E. REGRESSION ANALYSIS
Out of many important applications of statistics, one is regression analysis. It is
the process of estimating (predicting) the mean value of a response variable y, based on
knowledge of related independent variables x (Mendenhall & Sincich, 2007). When we
perform regression analysis, there may be a large number of potentially important
independent variables, with associated main effects and interactions. A popular objective

52
method of building a parsimonious model with only the most important independent
variables and building a model is called stepwise regression analysis (Mendenhall &
Sincich, 2007).
It is important to note that with binary responses the basic assumptions for linear
regression are not met. Specifically, the errors will not be normally distributed with a
constant variance. Moreover, the response must be restricted to between zero and one,
while the regression equation may make predictions outside of this region at the
extremes. However, we are using the regression for descriptive purposes, i.e., to provide
insight into the relationship between the input factors and our response (Kleijnen et al.
2005). Ideally, we will produce readily interpretable relationships between the input
variables and the response. As noted by Hellevik (2009), “the intuitively meaningful
interpretation [of linear regression] makes it easier to communicate research results [than
logistic regression].” Of course, since the errors are not normally distributed, or even
continuous, the p-values do not have a precise interpretation. Nonetheless, the p-values
are functions of the sums of squares explained by the variables, and smaller p-values
indicate more significance for the terms.
While not optimal in terms of power, the regression coefficient estimates are
unbiased. Furthermore, given our large sample and high R-square value, optimal power is
not a critical issue. For more discussion on this common practice, see Hellevik (2009).
Stepwise regression was performed on the data collapsed across design points to
explore the relationships between different input factors on the probability of Red
success. The response variable is the probability of Red boat survival. The purpose of
regression is to find a mathematical model that estimates the success rate of Blue or Red
forces based on different input factors. Figure 34 displays the final regression model that
was obtained.

53
Figure 34. Regression Model with All Input Factors.
The R square and adjusted R square values are very high, indicating that the
regression model is capturing over 80% of the variability of the simulation model. The
maximum value of t ratio is 111.32, for hits to kill Red boats. A large t-ratio indicates the
significance of the corresponding factor—though the lack of normality of the residuals
means that these values should not be intercepted in the usual sense. Our regression
confirms our earlier finding that shots required to neutralize Red boats is the most
important factor. From the regression model above, we can also see the consistency of the
second most important factor being the probability of hit (with a −44.59 t ratio). The
negative sign associated with t ratio indicates that there is a negative correlation between

54
that factor and the output response. That is, as the probability of hit increases, the
probability of Red success decreases. The prediction profiler plots show the marginal
effects of each factor on the probability of Red success. It is worth noting that the main
effects are more significant than the interactions.
Figure 35 displays the actual by predicted plot. It can be seen that predicted
values are generally consistent with actual values, indicating the effectiveness of the
model. It should be noted that the residuals are not normal, thus the p-values are not
precise.
Figure 35. Actual by Predicted Plot of Mean (Red Success).
F. SIGNIFICANT INTERACTIONS
An interaction measures the change in response (Red reaches goal) caused by
varying one input factor that is dependent on the value of another input factor. In this
model, there are eight different inputs and all may potentially have interactions between
them. In order to examine the interactions between different factors, an interaction profile
plot was generated and examined to look for significant interactions between input
factors. The interaction plot in Figure 36 shows the high and low levels of all pairs of
factors, and the effect on the response. By observing the near parallel lines in the graphs,
we see that the interactions are not that strong. Some interesting interactions are (1) the

55
probability of Red success drops faster with probability of Blue shots hitting Red, when
the exclusion zone is greater and (2) the probability of Red success drops faster with
probability of Blue shots hitting Red, when there are three sentries as opposed to two.
Figure 36. Interaction Profiler.
G. TACTICS WITHIN EXCLUSION ZONE
If sentries see an incoming boat heading towards a ship inside the exclusion zone,
should the sentries fire a warning shot and then disabling shots, or they should directly
fire disabling shots? A ship’s crew is always concerned about what to do in this situation.
Although we did not carry out simulation for this scenario, the situation was analyzed

56
using the results of previous simulation runs (with an exclusion zone distance of 60
meters) and simple mathematics calculations involving time and distance. We have found
in our analysis that, with the given parameters, 60 meters is an adequate exclusion zone
distance, which must be maintained to have an acceptable level of defense by the Blue
ship. A boat traveling at 15 knots will cover 7.5 meters each second. If a sentry fires a
warning shot, observes its effect on the incoming boat and then fires disabling shots, it
may take six to eight seconds and at best it will take three to four seconds. A boat moving
at 15 knots will take only eight seconds to cross the exclusion zone and hit the ship’s
side. If sentries are very alert and good at observing the effect of a warning shot, even
then there will be only about five seconds available for the sentries to disable the
attacking boat. It will be the same as if exclusion zone is now established at 38 to 40
meters. After incorporating the delay of three to four seconds in opening up disabling
fire, the overall distribution of Red achieves its goal is depicted in Figure 33.
Figure 37. Distribution of Red Success after Incorporating a Three- to Four-Second Delay.
We can see that incorporating a delay of three to four seconds results in the
probability of Red success increasing from 6% to 32%, indicating that a warning shot
may not be a good idea if the exclusion zone is of only 60 meters or less in width. Thus,
the Blue patrol boat should be tasked with implementing the exclusion zone effectively.

57
VI. CONCLUSION
The main purpose of this study was to analyze the protection measures that might
be employed by a ship’s crew against a suicide terrorist boat. To that end, 4,112 design
points were generated for simulation. Each design point represents a set of input factors
that generates the output, i.e., whether Red achieves its goal or not. Each design point
was replicated 100 times in order to explore a range of possible results from the
stochastic model. This study analyzes the data obtained by performing 411,200 simulated
attacks on a Blue ship by Red boats. Analysis techniques used to explore the resultant
data include histograms, partition trees, logistic fits of Red success against all input
factors, and stepwise regression. In order to further explore the exclusion zone distance
effect on Red success, a one factor experiment was also performed.
A. CRITICAL FACTORS IN MODEL
After analyzing the data, the following important insights were discovered:
• The most important factor is the number of Blue shots needed to kill theRed boat (neutralize)—that is, the lethality of Blue weapons against thethreat. Further, an important threshold value for this factor was 11. Inother words, there was a clear difference in the estimate of Red successwhen hits required to neutralize Red boat were less than eleven or morethan eleven. All analysis techniques recommended that lethality of Blueweapons is the most critical factor. This is because, in such a situation,time is very important. Sentries will have 6-12 seconds, depending on thespeed of the Red boat and the exclusion zone distance. So, the more lethalthe Blue weapons are, the greater the chances are of stopping a Red boatattack.
• Another important factor is the probability of hit by Blue Sentries. In suchsituations, probability of hit by Blue sentries will largely depend on theirweapons, environmental factors, confidence, fear factor and their resolveto stop the attack. Out of these factors, confidence, control of fear, andresolve of sentries to stop a Red boat, can be improved by better trainingof Blue sentries.
• Exclusion zone distance also plays an important role. At least a 60 meterexclusion zone is recommended, but it will depend on input factors,especially hits required to neutralize Red boat. It is very important to

58
know how many rounds of a particular weapon are required to neutralize the attacking boat.
• The presence of a Blue patrol boat also reduces the chances of Redsuccess, but is not a dominant factor. However, a Blue patrol boat is vitalfor implementing the exclusion zone.
• At whatever distance the exclusion zone is established, it must beimplemented effectively by a Blue patrol boat. There will be a manifoldincrease in the probability of Red success if the tactic of firing a warningshot followed by disabling shot is adopted.
B. FOLLOW-ON WORK
We recommend the following potential areas for future research:
• The standard deviations of weapons in the x and y axis was not available,so for the purpose of this study, values for standard deviation wereassumed, based on experience. Theoretical probability of hit of allweapons can be calculated by using actual standard deviations based onlive fire tests. Additionally, in-field calculation of probability of hit byBlue sentries can be carried out in near actual conditions.
• No data was available on the actual effectiveness of particular types ofweapons in terms of how many rounds are required to neutralize anattacking Red boat. Collection of this data would therefore be useful torefine the scenario.
• A useful scenario variant to consider is if a Red boat also starts firing onthe Blue ship, while attacking. In our scenario, this was not the case.
• It would also be useful to study the case of a Blue ship coming under attack from the sea as well as from the land—what tactics and protection measures are required?
• Allow friendly boats to also enter the exclusion zone.

59
LIST OF REFERENCES
Anti-Aircraft Machine Gun 12.7 MM TYPE 54. (n.d.). Retrieved May 20, 2016, from http://pof.gov.pk/products/Infantry_Weapons/Anti-Aircraft_Machine_Gun_ 12.7_MM_TYPE_54/5/
Assault Rifle G3. (n.d.). Retrieved May 16, 2016, from http://collosalwar.forumotion.net/ t3-assault-rifle-g3-sas-g3a3-g3a4
Asthana, N., & Nirmal, A. (2008). The ultimate book of explosives, bombs and IEDs. Jaipur, India: Pointer Publishers.
Automatic rifle G3A3 & G3P4) (n.d.). Retrieved May 16, 2016, from http://pof.gov.pk/ products/Infantry_Weapons/Automatic_Rifle_G3A3_AND_G3P4/3/
Browning 12.7mm Heavy Machine Gun. (n.d.). Retrieved May 16, 2016, from http://www.military.ie/naval-service/equipment/
Browning M2 (HMG) Multi-role heavy machine gun. (n.d.). Retrieved May 22, 2016, from http://www.militaryfactory.com/smallarms/detail.asp?smallarms_id=13
Cioppa, T. M., & Lucas, T. W. (2007). Efficient nearly orthogonal and space-filling Latin hypercubes. Technometric, 49(1), 45–55.
Department of Homeland Security. (2008). News & terrorism communicating in crises. Retrieved from https://www.dhs.gov/xlibrary/assets/prep_ied_fact_sheet.pdf
FBI. (2005, February). The USS Cole bombing. Retrieved from https://www.fbi.gov/ about-us/history/famous-cases/uss-cole
Grimm, V., & Railsback, S. F. (2005). Individual based modeling and ecology. Princeton, NJ: Princeton University Press.
Hernandez, A. S., Lucas, T. W., & Carlyle, M. (2012). Constructing nearly orthogonal Latin hypercubes for any nonsaturated run-variable combination. ACM Transactions on Modeling and Computer Simulation, 22(4), 1–20.
Hellevik, O. (2009). Linear versus logistic regression when the dependent variable is a dichotomy. Quality & Quantity, 43(1), 59–74.
Kleijnen, J. P., Sanchez, S. M., Lucas, T. W., & Cioppa, T. M. (2005). State-of-the-art review: a user’s guide to the brave new world of designing simulation experiments. INFORMS Journal on Computing, 17(3), 263–289.

60
Lucas, T., Kelton, W., Sanchez, S., Sanchez, P., & Anderson, B. I. (2015). Changing the paradigm: Simulation, now a method of first resort. Naval Research Logistics, 62(4), 293–303. Retrieved from https://harvest.nps.edu/papers/Lucas_et_al-2015-Naval_Research_Logistics_First_Resort.pdf
Machine gun MG3 (MG1A3). (n.d.). Retrieved May 18, 2016, from http://pof.gov.pk/ products/Infantry_Weapons/Machine_Gun_MG3_(MG1A3)/4/
McIntosh, G.C. (2007). MANA version 4 user manual. Auckland, New Zealand: Defence Technology Agency.
Mendenhall, W., & Sincich, T. (2007). Statistics for engineering and sciences (5th ed.) Upper Saddle River, NJ: Pearsen Prentice Hall.
M16A4. (n.d.). In Wikia. Retrieved May 16, 2016, from http://armedassault.wikia.com/ wiki/M16A4
M240. (n.d.). Retrieved May 22, 2016, from http://www.military.com/equipment/m240b-machine-gun
Partition models. (n.d.). Retrieved May 20, 2016, from http://www.jmp.com/support/ help/Partition_Models.shtml#1276098
Peters, J. W., Tanner, D. J., & Kasper, A. (2010). Explosive and blasting. Eugene, OR: DO NORTH Media.
Powers, R. (2016, June 5). M16A2 and M16A4 5.56mm rifles—Features and background. Retrieved from http://usmilitary.about.com/od/weapons/a/ m16rifles.htm
Sanchez, S. M., & Wan, H. (2009). Better than a petaflop: The power of efficient experimental design, Proceedings of the 2009 Winter Simulation Conference, 60–74.
Sickinger, L. (2006). Effectiveness of non-lethal capabilities in a maritime environment (Master’s thesis). Retrieved from Calhoun: http://calhoun.nps.edu/handle/ 10945/2657
Tiburcio, F.M. (2005). Maritime protection of critical infrastructure assets in the Campeche Sound (Master’s thesis). Retrieved from Calhoun: http://calhoun.nps.edu/handle/10945/1745
Tsilis, T. (2011). Counter-piracy escort operations in the Gulf of Aden (Master’s thesis). Retrieved from Calhoun: http://calhoun.nps.edu/handle/10945/5633
Winston, W. L. (2004). Operations research: Application and algorithms (4th ed.). Pacific Grove, CA: Brooks/Cole

61
INITIAL DISTRIBUTION LIST
1. Defense Technical Information Center Ft. Belvoir, Virginia 2. Dudley Knox Library Naval Postgraduate School Monterey, California