Embed Size (px)
Citation preview

7/29/2019 Navigant's Kitimat Refinery Final Report
http://slidepdf.com/reader/full/navigants-kitimat-refinery-final-report 1/33
© 2013 Navigant Consulting, Inc.
Review of the Proposed Kitimat
Refinery Project
Technical Assessment and
Asian Supply / Demand Analysis
Prepared for:Government of British Columbia
Ministry of Jobs, Tourism and Skills Training,
Major Investments Office
Navigant Consulting, Inc.
3100 Zinfandel Drive
6th Floor, Suite No. 600
Rancho Cordova, CA 95670
916.631.3200
Navigant Consulting (Europe) Ltd
25 Basinghall Street
London EC2V 5HA
+ 44.20.7469.1173
Authored by:
Edward Osterwald
www.navigant.com
14 March 2013

7/29/2019 Navigant's Kitimat Refinery Final Report
http://slidepdf.com/reader/full/navigants-kitimat-refinery-final-report 2/33
iGovernment of British ColumbiaKitimat Refinery Review and Asian Supply – Demand Analysis
NOTICE
This report (the “report”) was prepared for the Government of British Columbia, Ministry of Jobs, Tourismand Skills Training, Major Investments Office (“Client”), on terms specifically limiting the liability of
Navigant Consulting, Inc. (“Navigant”). The report was prepared solely for the purposes set forth in the
report and may not be used for any other purpose. No part of the report may be circulated, quoted or
reproduced for distribution outside of the Client without prior written approval from Navigant. Use of this
report should not, and does not, absolve any third parties from using due diligence in verifying the
report’s contents.
Navigant’s conclusions are the results of the exercise of Navigant’s reasonable professional judgment,
based in part upon materials provided by the Client and others, and these materials have not been
independently verified for accuracy or validity. Therefore, Navigant does not make any representations or
warranties of any kind with respect to the accuracy or completeness of the information contained in thisreport or in any of the other documents, errors or omissions, or any conclusions reached by Navigant as a
result of this report.
Any use which the reader makes of this report, or any reliance on it, is the responsibility of the reader.
Navigant accepts no duty of care or liability of any kind whatsoever to the reader, and all parties waive
and release Navigant for all claims, liabilities and damages, if any, suffered as a result of decisions made,
or not made, or actions taken, or not taken, based on this report.

7/29/2019 Navigant's Kitimat Refinery Final Report
http://slidepdf.com/reader/full/navigants-kitimat-refinery-final-report 3/33
Government of British ColumbiaKitimat Refinery Review and Asian Supply – Demand Analysis
Table of Contents
1. Executive Summary ........................................................................................................... 1 2. Conclusions and Objectives of Report .......................................................................... 3
2.1 Key Conclusions ........................................................... ................................................................. ...... 3 2.2 Background................................................................... ............................................................... ......... 3
3. The Refining Industry: Technology and Terminology .............................................. 4 3.1 Refinery Technology and Terminology ............................................................................................ 4
3.1.1 Introduction ............................................................... ............................................................ 4 3.1.2 Key Refining Processes ....................................................... .................................................. 4 3.1.3 Types of Refinery Configurations .............................................................................. ......... 5 3.1.4 Other Essential Terminology ............................................................................................... 6 3.1.5 Refinery Economics ............................................................. .................................................. 7
3.2 Refinery Utilisation and Profitability ......................................................... ....................................... 8 3.3 The Global Refining Industry .... ................................................................. ..................................... 10 3.4 Conclusions ............................................................................. ........................................................... 10
4. Technical Review of the Proposed Refinery at Kitimat .......................................... 11 4.1
Introduction ........................................................ ................................................................. ............... 11
4.2 Process Flow Scheme......................................................................................................................... 11 4.3 Mass Balance ...................................................... ................................................................. ............... 12 4.4 Offsites and Logistics ................................................... .............................................................. ....... 13 4.5 Estimated Capital Cost ............................................................ .......................................................... 14 4.6 Economics ................................................................................................................. .......................... 15 4.7 Operational Models and Target Markets ....... .............................................................. .................. 15 4.8 Conclusions ............................................................................. ........................................................... 16
5. Asian Fuel Product Supply and Demand ................................................................... 17 5.1 Introduction ........................................................ ................................................................. ............... 17 5.2 China ................................................................................................................................................... 17 5.2.1 Chinese Supply and Demand ............................................................................................ 17
5.2.2 The Chinese Refining Industry .......................................................................................... 19 5.3 India .......................................................... ................................................................. .......................... 19
5.3.1 Indian Supply and Demand ............................................................................................... 19 5.3.2 The Indian Refining Industry ....................... .............................................................. ....... 20
5.4 South Korea ............................................................................. ........................................................... 21 5.4.1 South Korean Supply and Demand .................................................................................. 21 5.4.2 The South Korean Refining Industry ................................................................................ 23
5.5 Japan ......................................................... ................................................................. .......................... 24 5.5.1 Japanese Supply and Demand ................................................................ ........................... 24 5.5.2 The Japanese Refining Industry ...................................................................... .................. 25 5.6 Asia / Oceania..................................................................................................................................... 25 5.6.1 Asian / Oceania Supply and Demand .............................. ................................................ 25

7/29/2019 Navigant's Kitimat Refinery Final Report
http://slidepdf.com/reader/full/navigants-kitimat-refinery-final-report 4/33
Government of British ColumbiaKitimat Refinery Review and Asian Supply – Demand Analysis
5.7 Evolution of the Refining Industry in Key Countries ............................................................... .... 27 5.8 Conclusions ............................................................................. ........................................................... 28
FIGURES
Figure 1: Key Processes in a ‘Conversion’ Refinery ................................................................ ............................ 4 Figure 2: Regional Refining Net Margins and Average Utilisation .................................................................. 9 Figure 3: Global Refinery Capacity and Configuration .................................................................................... 10 Figure 4: Generic Process Flow Diagram of Hydrocracking / Coking Refinery ............................................ 12 Figure 5: China – Fuel Product Output and Consumption ....................................................................... ....... 18 Figure 6: Fuel China – Product Imports and Exports .............................................................. .......................... 18 Figure 7: India – Fuel Product Output and Consumption ................................................................ ............... 19 Figure 8: India – Fuel Product Imports and Exports .................................................................................. ....... 21 Figure 9: South Korea – Fuel Product Output and Consumption ............................................................... .... 22
Figure 10: South Korea – Fuel Product Imports and Exports ..................................... ..................................... 23 Figure 11: Japan – Fuel Product Output and Consumption .............................................................. ............... 24 Figure 12: Japan – Fuel Product Imports and Exports ............................................................................... ....... 25 Figure 13: Asia / Oceania – Fuel Product Output and Consumption ................................... .......................... 26 Figure 14: Asia / Oceania – Fuel Product Imports and Exports ........................................................ ............... 26 Figure 15: Comparison of Refining Complexity, Industry Size and Market Structure ................................ 27 TABLES
Table 1: Typical Refinery Configurations ........................................................... .................................................. 6 Table 2: Mass Balance Comparison ................................................................................ ..................................... 13 Table 3: Capital Cost Comparison ................................................................................................................ ....... 14 Table 4: Ownership of Indian Refineries............................................................. ................................................ 20 Table 5: Ownership of South Korean Refineries ........................................................... ..................................... 23

7/29/2019 Navigant's Kitimat Refinery Final Report
http://slidepdf.com/reader/full/navigants-kitimat-refinery-final-report 5/33
Government of British ColumbiaKitimat Refinery Review and Asian Supply – Demand Analysis
DEFINITIONS
CCR continuous catalytic reformerCDU crude distillation unit
DWT dead weight tonnes
EIA US Energy Information Administration
FCC fluidised catalytic cracker
GDP gross domestic product
HC hydrocracker
HDS hydrodesulphurisation
HN heavy naphtha
HT hydro-treated or hydro-treater
HVGO heavy vacuum gas oil
IEA International Energy AgencyISBL inside battery limits
KC Kitimat Clean Fuels
LCO light cycle oil (from catalytic cracking units)
LN light naphtha
LNG liquefied natural gas (mainly methane)
LPG liquefied petroleum gas (mainly propane and / or butane)
LVGO light vacuum gas oil
mbd million barrels per day
MN medium naphtha
MTBE methyl tertiary butyl ether
NGL natural gas liquidsOH overheads (i.e. gases or light ends)
OSBL outside battery limits
PSU Indian Public Sector Undertaking (i.e. a state-owned company)
tbd thousand barrels per day
VDU vacuum distillation unit
VGO vacuum gas oil
VLCC very large crude carrier
VTB vacuum tower bottoms

7/29/2019 Navigant's Kitimat Refinery Final Report
http://slidepdf.com/reader/full/navigants-kitimat-refinery-final-report 6/33
1Government of British ColumbiaKitimat Refinery Review and Asian Supply – Demand Analysis
1.
Executive Summary
To assist the Province of British Columbia with its appraisal of a proposed greenfield refinery on the west
coast of Canada at Kitimat, Navigant Consulting, Inc. (Navigant) was retained to consider the following
aspects of the project:
Prepare a technical review, including an estimate the likely economic performance of the
refinery; and
Compile an assessment of the Asian fuel supply / demand balance and whether the output from
Kitimat could be sold profitably to customers in four Asian countries (namely China, India,
South Korea and Japan).
Navigant’s view, based on the information available at the present time, is that building a refinery on the
coast of British Columbia has economic merit and should be considered seriously by the Government of
the Province. Such a refinery would provide incremental long term economic benefits to the region,
compared to export of unfinished feedstock. In addition and equally importantly, if configured carefully
and managed properly, the refinery would create sustainable margins that otherwise would be lost to
Asian purchasers of Canada’s oil sands production.
Furthermore, it is our recommendation that the Province approve a design for Kitimat that would make
it capable of manufacturing fuel products for a myriad of countries around the Pacific Rim. This would
preclude being tied into only a few destination markets (or perhaps just one).
It is Navigant’s opinion that the refinery configuration recommended by Kitimat Clean Fuels (KC) is
technically sound. They have suggested using a combination of hydrocracking and delayed coking to
process oil sands from Alberta into various clean fuels. This particular configuration is well-proven and
widely employed in many locations around the world.
KC has estimated the cost of a new refinery at Kitimat to be about $13 billion. Although we were
provided with very little detail supporting this estimate, Navigant was able to compare to another
proposal of similar size and configuration (albeit from 2006). We concluded that KC’s cost projection
might be on the high side. It is also fair to say, however, that the 2006 case study is not fully
representative of current costs, despite being similar in size and configuration to Kitimat, because:
Expenditures for capital equipment and labour have risen since 2006; The remoteness of the Kitimat site will, without doubt, increase construction costs considerably.
Navigant has not examined the magnitude of such an increase;
The 2006 US refinery did not need a new plant for power generation, but one will be required at
Kitimat; and
The US example was not designed to process oil sands. Thus it is a somewhat imperfect
comparator to Kitimat.
If these factors are taken into consideration, Navigant would expect the total installed cost of Kitimat
(including the power plant) to exceed $7 billion. It is not possible at this stage to provide a more precise
estimate. We would therefore recommend that a more detailed projection of capex for Kitimat be carried
out.We also analysed the fuel product supply and demand balance for each of the four target countries from
1990 to 2010, as well as for the entire Asia / Oceania region. Despite strong economic growth in some

7/29/2019 Navigant's Kitimat Refinery Final Report
http://slidepdf.com/reader/full/navigants-kitimat-refinery-final-report 7/33
2Government of British ColumbiaKitimat Refinery Review and Asian Supply – Demand Analysis
Asian countries, the aggregate demand for product imports has been surprisingly stable at roughly two
million barrels per day for about the last 15 years. Thus the output from Kitimat (0.5 million barrels per
day) could be accommodated by markets in Asia / Oceania without major disruption to local spotmarkets.
We reviewed the history of the refining sector in the same four countries and compared the size and
complexity of each of their industries to major developed economies (i.e. the US, Western Europe and
Canada). Despite major and ongoing investments, the Asian refining industry lags the latter group, both
in terms of technical upgrading capability, as well as absolute size (versus the US and Western Europe).
Thus a sophisticated export refinery on the Pacific Rim could help fill the region’s ongoing import needs.

7/29/2019 Navigant's Kitimat Refinery Final Report
http://slidepdf.com/reader/full/navigants-kitimat-refinery-final-report 8/33
3Government of British ColumbiaKitimat Refinery Review and Asian Supply – Demand Analysis
2. Conclusions and Objectives of Report
2.1 Key Conclusions
Navigant’s view, based on the information available at the present time, is that building a refinery on the
coast of British Columbia has economic merit and should be considered seriously by the Government of
the Province. Such a refinery would provide incremental long term economic benefits to the region,
compared to export of unfinished feedstock. In addition and equally importantly, if configured carefully
and managed properly, the refinery would generate sustainable margins that otherwise would be lost to
Asian purchasers of Canada’s oil sands production.
Furthermore, it is our recommendation that the Province select a design for Kitimat that would make it
capable of manufacturing fuel products for a myriad of countries around the Pacific Rim. This wouldpreclude being tied into only a few destination markets (or perhaps just one).
2.2 Background
The increase in output of “unconventional” oil and gas in Canada, combined with the remarkable impact
of shale gas and shale oil in the United States, has fundamentally shifted the energy balance. The Federal
Government and their Provincial counterparts are examining options to maximise value creation for
Canada, due to the magnitude of changes in the North American energy mix and supply patterns.
British Columbia has requested further analysis of two options:
1. Exports of bitumen in large cargoes (up to VLCC) to refiners in Asia; or2. Processing in a greenfield refinery at Kitimat in British Columbia, from which smaller cargoes of
fuel products would be exported to customers in Asia or elsewhere on the American continents.
To assist the Province of BC with its assessment, Navigant was retained to consider certain aspects that
are critical to the Kitimat project (i.e. option 2 above):
One of the key objectives of the study was to estimate the economic performance of the refining option,
in light of contraction of the industry in the US. Another essential element is to examine is the potential to
sell the output from Kitimat in Asian countries.
This study was based on a review of documents and literature in the public domain, certain informationand sources of information available to Navigant and the knowledge and experience of the author.

7/29/2019 Navigant's Kitimat Refinery Final Report
http://slidepdf.com/reader/full/navigants-kitimat-refinery-final-report 9/33
4Government of British ColumbiaKitimat Refinery Review and Asian Supply – Demand Analysis
3.
The Refining Industry: Technology and Terminology
3.1 Refinery Technology and Terminology
3.1.1 Introduction
To appreciate the commercial and technical issues relevant to the Kitimat project, it is important that
readers develop a high level understanding of the key steps in refining, as well as the applicable
terminology. In so doing, they will be better placed to consider Kitimat in the context of the global oil
market in which it may eventually compete. This section therefore explains some of the technology
employed to convert hydrocarbon feedstock, such crude oil or bitumen, into saleable products that can
be used as fuel, lubricants or to manufacture chemicals.
Feedstock is a mixture of hydrocarbon molecules of various weights, sizes and shapes. To be converted
into saleable products, they need to be separated into lighter fractions (through distillation), reshaped to
more useful structures (reforming, mainly for gasoline) or broken into smaller molecules (cracking).
Refiners use combinations of these processes to achieve the desire results.
The main steps are presented in Figure 1 below. They are explained in the text thereafter.
Figure 1: Key Processes in a ‘Conversion’ Refinery
3.1.2 Key Refining Processes
3.1.2.1 Atmospheric and Vacuum Distillation
In a crude distillation unit (CDU), crude oil is heated in a furnace and then fed into a vertical distillation
column that contains horizontal trays. The trays are used separate the volatile hydrocarbons into a range

7/29/2019 Navigant's Kitimat Refinery Final Report
http://slidepdf.com/reader/full/navigants-kitimat-refinery-final-report 10/33
5Government of British ColumbiaKitimat Refinery Review and Asian Supply – Demand Analysis
of fractions, due variations in boiling points. For example, lighter molecules, such as gases (e.g. propane,
butane, etc.) are taken out at the upper levels of a CDU. Heavier fractions migrate to the bottom. The
densest residual material is extracted from the bottom of the atmospheric distillation unit (termed “heavyresidue”). By heating and then distilling the residue in a column under reduced pressure (i.e. a vacuum
distillation unit or VDU), it is quite straightforward to separate higher boiling range materials in the
upper levels of the vacuum column. Side streams from the VDU include vacuum gasoil (VGO), which is
the main feedstock for catalytic cracking units
Due to impurities, the products from atmospheric or vacuum distillation are rarely suitable for end use.
3.1.2.2 Cracking
Cracking units mix vacuum gas oil and highly specialised catalysts, under high pressure and heat, to
break down the VGO into lighter, more valuable products. Generally speaking, there are two types ofcatalytic crackers:
Fluidised catalytic cracking (FCC): catalysts are mixed to convert VGO into components
suitable for gasoline and other products; and
Hydrocracking (HC or hydrocracker): large quantities of hydrogen, again at very high
temperatures and pressures, react over a catalyst with VGO to produce middle distillates, mainly
diesel and jet fuel.
3.1.2.3 Catalytic Reforming
Reforming is a key process in gasoline production. Heavy naphtha from the distillation unit is treated
with a catalyst at high temperatures. The molecules are reshaped (“reformed”) which enhances theamount of energy that can be released when they are burned in gasoline engines. Not surprisingly, the
main product of catalytic reforming is termed “reformate.” It is a high octane blending component.
3.1.2.4 Hydrotreating or Hydrodesulphurisation
Fuel specifications around the world are requiring refiners to steadily reduce the amount of sulphur in
fuels. Thus sulphur removal is one of the most essential steps in modern refineries. It also relies on the
availability of large quantities of hydrogen.
More specifically, desulphurisation is achieved by reacting products and catalysts, in the presence of
hydrogen, at elevated temperatures and pressures. This is referred to as “hydrodesulphurisation” and iscarried out in an HDS unit.
3.1.3 Types of Refinery Configurations
It is worth noting that all oil refineries are unique, in the sense that each one was designed and built to
meet the specific environment in which it operates. Thus not only are no two alike, but more importantly
the levels of complexity and sophistication vary widely. Nevertheless, over time the industry has
developed terminology to describe common combinations of process units (Table 1).
The simplest plants only possess atmospheric distillation units and are classified as “topping” refineries.
If combined with a catalytic reformer and hydrodesulphurisation unit, they would then be described as
“hydroskimming.”

7/29/2019 Navigant's Kitimat Refinery Final Report
http://slidepdf.com/reader/full/navigants-kitimat-refinery-final-report 11/33
6Government of British ColumbiaKitimat Refinery Review and Asian Supply – Demand Analysis
Other important refinery configurations are:
Conversion / Complex: Include the same constituents as a hydroskimming plant, combinedwith catalytic cracking;
Deep Conversion / Highly Complex: Refineries that completely convert heavy residues to
lighter products. Thus little or no fuel oil is produced. Many refineries in North America are
deep conversion because they use coking units to convert heavy residue into other products;
Lubes: Some refineries are specifically designed to process heavy residues into lubricants.
Others manufacture waxes and solvents;
Bitumen: Similar to a lube refinery, but instead focused on output of asphalt and related
products;
Petrochemical integration: Utilises streams from oil refineries (especially light naphtha and
certain gases) as feedstock for petrochemical production;
Toll processors: Processes crude oil for third parties. In return for an agreed fee, provides theowners of the crude with a set product yield; and
Export Refineries: Designed to export fuel products to multiple countries and / or regions. Such
plants are configured to be able to meet a wide range of fuel specifications.
Table 1: Typical Refinery Configurations
Complexity Description Used by
Industry
Typical Process Units
Very simple Topping CDU
Simple Hydroskimming CDU, HDS, Reforming
Complex Conversion CDU, HDS, Reforming,
VDU, FCC, HC,
Isomerisation,
Alkylation, MTBE,
Visbreaking.
Highly complex Deep conversion CDU, HDS, Reforming
VDU, FCC, HC,
Isomerisation,
Alkylation, MTBE,
Visbreaking,
Coking,
Residue conversion or
gasification.
3.1.4 Other Essential Terminology
The list below provides definitions of other parameters that are important in understanding the refining
industry:
Refining Capacity: The maximum quantity of crude oil that a refinery can process. Usually
expressed either as barrels per day or million tonnes per year.
Refining Throughput: The actual quantity of crude oil processed, again measured in barrels per
day or million tonnes per year.
Utilisation: The extent to which capacity is being utilised, assessed as a percentage of
throughput capacity. Shutdown: Refers to a planned closure for maintenance work , normally called a “turnaround.”

7/29/2019 Navigant's Kitimat Refinery Final Report
http://slidepdf.com/reader/full/navigants-kitimat-refinery-final-report 12/33
7Government of British ColumbiaKitimat Refinery Review and Asian Supply – Demand Analysis
Refining Margin: A measure of profitability, expressed as dollars per barrel or per metric tonne
of crude.
Gross Margin: The sum of the value of all products produced from a barrel of oil less thedelivered cost of that barrel of oil to the refinery.
Variable Margin: Gross Margin, less variable operating costs (usually chemicals, additives and
utilities).
Cash Margin: Variable Margin, less fixed costs (typically maintenance and labour).
(Note that it is standard industry practice to exclude depreciation and tax when assessing margins).
3.1.5 Refinery Economics
It should be apparent from the preceding paragraphs that refineries process a wide variety of feedstock
using a complex combination of units. Thus unlike most manufacturing operations, it is virtually
impossible to know the cost to produce a unit of output from a refinery. This does not pose a problem for
the industry, however, because maximising profitability (i.e. margins) is of paramount importance. It is
fair to say that refining margins generally depend on combinations of pricing, location and complexity.
Locational differences are determined by the cost to deliver product from alternative sources of supply.
Over time, there has been a consistent trend to add ever more complex upgrading units, since they are
better placed to deliver sustained profitability over the longer term.
It is worth noting that in unregulated markets there is generally a lag between increased crude oil prices
and higher refined product prices. In general therefore, during periods of increasing crude prices, low
refining margins are to be expected. The opposite trend occurs when oil prices decline; margins normally
rise.
Crude prices have been stable in recent months. In general, refinery margins have improved since the
2009 / 10 recession, due to gradual economic recovery in developed countries, especially the United
States. Profitability has also improved in Western Europe, partially due to reductions in capacity since
numerous plants have been closed since 2008.
Development of an export refinery on the Pacific coast of British Columbia would not only create
employment and economic benefits for the Province, but would also increase the overall value of
Canada’s natural resources, versus exports of crude oil and / or bitumen. It is for similar reasons that
some oil exporting countries, such as Saudi Arabia, have developed fuel product export refineries.
Another important trend is that variable and fixed costs are relatively small, compared to product
revenues and feedstock costs. Therefore refiners need to ensure that:
Gross Margins are maximised by selection of an optimal feedstock slate that maximises output of
more valuable lighter products, typically to be delivered to neighbouring markets; and
Minimises fixed and variable costs.
Not surprisingly refiners need to acquire and process crudes that generate the best margins. These may
not always be the cheapest or those which are readily available in the refiners’ local region. To make the
selection, traders and refiners utilise highly complex linear programme simulations of refinery operations
that help identify relative values of alternative crude slates.

7/29/2019 Navigant's Kitimat Refinery Final Report
http://slidepdf.com/reader/full/navigants-kitimat-refinery-final-report 13/33
8Government of British ColumbiaKitimat Refinery Review and Asian Supply – Demand Analysis
Other actions that are important to maximising margins are:
Identify unit-by-unit operating strategies to achieve optimum gross margin. Typically this entailsmaximising throughput on the main conversion units;
Optimise product blending, which again requires a linear programme;
Maintain continuous operations. Unplanned shutdowns are to be avoided. Best practice is to
maintain steady and optimal operations between major turnarounds (usually five years or more);
Schedule turnarounds carefully to minimise the frequency and duration; and
Manage inventories carefully within clearly specified and acceptable limits.
3.2 Refinery Utilisation and Profitability
It is well known that refinery profitability in recent years has been low. This occurred for a multitude of
reasons, most notably the impact of the global recession on demand for oil-based fuels. Coupled with a
shift away from gasoline in developed countries, especially the United States, the result has been closureand / or bankruptcy for many refineries. A good example was European Petroplus, which went into
receivership in early 2012.
Nevertheless, financial losses in recent years do not mean that refining is a permanently unattractive
industry. As can be seen in Figure 2, average utilisation in the economic downturn of 2001 / 2002 was
very similar to 2009 – 2011, but margins during the latter years have been far worse. This suggests that
the differences are due to a complex mixture of factors, among them changes in demand patterns in
developed countries (in particular declining gasoline demand and increasing fuel efficiency of motor
vehicles, as well as climate change policies to encourage lower consumption).
Thus when poor margins are ascribed, simplistically, to “surplus refinery capacity” , it ignores manyother factors related to supply and demand imbalances across the barrel and fluctuations in global oil
prices.

7/29/2019 Navigant's Kitimat Refinery Final Report
http://slidepdf.com/reader/full/navigants-kitimat-refinery-final-report 14/33
9Government of British ColumbiaKitimat Refinery Review and Asian Supply – Demand Analysis
Figure 2: Regional Refining Net Margins and Average Utilisation
Source: Navigant Consulting analysis
Figure 2 also makes it apparent that refineries with coking capability fared much better during the
downturn. This is because deep conversion plants eliminate heavy fuel oil and maximise production of
transport fuels.
As a further example, most complex refineries are configured such that the cracking units reach full
capacity before their crude distillation units are fully utilised. Hence, there is generally some spare
atmospheric distillation capacity in most North American and West European refineries. Whenever
regional topping or hydroskimming margins rise above breakeven on a variable cost basis, complex
refineries will increase throughput on their distillation units. As production rises, oversupply will
suppress profitability and in turn, refiners will reduce runs and / or shut down distillation units.
Deep conversion refineries, such as proposed for Kitimat, will on average always have the highest
profitability.

7/29/2019 Navigant's Kitimat Refinery Final Report
http://slidepdf.com/reader/full/navigants-kitimat-refinery-final-report 15/33
10Government of British ColumbiaKitimat Refinery Review and Asian Supply – Demand Analysis
3.3 The Global Refining Industry
Figure 3: Global Refinery Capacity and Configuration
Source: Oil & Gas Journal, 2013 Worldwide Refinery Survey
Figure 3 above shows the capacity of different types of process units in each of the major regions of the
world. Although Asia is now the largest, with more plants and the highest distillation capacity, it lags
North America in upgrading (i.e. vacuum distillation, catalytic / hydrocracking and coking). The effect of
the higher complexity is apparent in Figure 2, where net margins at US coking refineries were
consistently highest.
3.4 Conclusions
Refineries are highly complex manufacturing operations. Their financial results arise from an inter play
of a multitude of factors. It is for this reason that despite the overall downturn in global margins in recent
years, the industry continued to do well in certain conditions, such as inland refiners with captive local
markets, or large export plants capable of selling into a variety of end user markets.

7/29/2019 Navigant's Kitimat Refinery Final Report
http://slidepdf.com/reader/full/navigants-kitimat-refinery-final-report 16/33
11Government of British ColumbiaKitimat Refinery Review and Asian Supply – Demand Analysis
4.
Technical Review of the Proposed Refinery at Kitimat
4.1 Introduction
Kitimat Clean Limited has suggested an intriguing solution to increase the economic value of oil sands
production in Alberta, while at the same time creating benefits for British Columbia. The Company’s
recommendation is to construct a 550,000 barrel / day greenfield, deep conversion refinery on the 3,000-
hectare Dubose site, which is Crown land and located roughly midway between Kitimat and Terrace.
This Section will provide a very high level technical review of the proposed refinery. It is based on a
limited amount of technical information, combined with insight and observations from other consulting
assignments.
Feedstock for the Kitimat facility, if it were to be constructed, would consist of natural gas (for power
generation and hydrogen production) and diluted bitumen. Finished products would include:
Product Volume (barrels / day)
Propane details not available
Gasoline 100,000
Jet fuel / kerosene 50,000
Diesel 240,000
Petroleum coke details not available
Sulphur details not available
The lack of fuel oil output confirms that the proposed process scheme is indeed deep conversion.
4.2 Process Flow Scheme
The key units at Kitimat are arranged in a format that has been applied successfully in numerous new
refinery projects in recent years. The proposed process flow is commonly used and consists of crude and
vacuum distillation, followed by a hydrocracker (for jet and diesel production), together with continuous
catalytic reforming and isomerisation (for the manufacture of gasoline). A delayed coker would also be
constructed to eliminate output of heavy fuel oil. A generic process flow diagram for this type of plant is
presented in Figure 4.
It is worth noting that Kitimat resembles quite closely a greenfield refinery in Liaoning Province, China
that was commissioned a few years ago. The author carried out extensive due diligence on this plant for a
potential joint venture partner between 2008 and 2011. It started operations on schedule. Our due
diligence concluded that the plant was very profitable (up to the first quarter of 2011, when negotiations
ended).
Figure 4.1 of the Kitimat refinery Project Description (September 14, 2012) shows two processing trains.
This is actually something of a misnomer, since in fact what was described is typical for a hydrocracking /
coking refinery. Atmospheric distillation would produce gases (i.e. “light ends”), gasoline, jet fuel and
gas oil (mainly diesel), while vacuum distillation generates VGO for the hydrocracker. The vacuum
residue would then be fed to the delayed coker (Figure 4).

7/29/2019 Navigant's Kitimat Refinery Final Report
http://slidepdf.com/reader/full/navigants-kitimat-refinery-final-report 17/33
12Government of British ColumbiaKitimat Refinery Review and Asian Supply – Demand Analysis
Processing Train #1: Light ends processing, hydro-desulphurisation, isomerisation and
catalytic reforming.
Processing Train #2: Vacuum distillation, hydrocracking, coking.
Figure 4: Generic Process Flow Diagram of Hydrocracking / Coking Refinery
4.3 Mass Balance
Navigant understands that Kitimat Clean has not finalised its configuration and has not completed its
filing at the British Columbia Environmental Assessment Office. Thus the information available to
Navigant is limited. That being the case, it is hardly surprising that a detailed mass balance for the plant
is not available. Nevertheless, we have been able to compare the estimated output from Kitimat shownabove, to results prepared for other greenfield refinery projects.
Our analysis is presented in Table 2. The expected Kitimat yield, as shown in the September 14, 2012
Project Description , was converted to a volume percentage basis. It shows that the output from a generic
model of a hydrocracking / coking deep conversion refinery, which was prepared for another assignment
(running to maximise diesel production), is reasonably similar, given the uncertainties in the data, to the
published estimate for Kitimat (red text). We therefore conclude that the output of Kitimat is likely to
resemble what has been suggested, albeit at this early stage in development.
In addition, the developer’s approach to reduce emissions of sulphur dioxide, nitrous oxides and other
particulates is consistent with normal practice. The selection of hydrocracking as the main upgradingunit will also contribute to lower emissions of all such materials.

7/29/2019 Navigant's Kitimat Refinery Final Report
http://slidepdf.com/reader/full/navigants-kitimat-refinery-final-report 18/33
13Government of British ColumbiaKitimat Refinery Review and Asian Supply – Demand Analysis
Table 2: Mass Balance Comparison
Estimatedmass balance
from "Project
Description"
Standardconversion
factors
Estimatedmass balance
from "Project
Description"
Yield fromgeneric model
of a
hydrocracking
/ coking
refinery
Barrels / day Barrels / tonne Volume % Weight %
Feedstock Dilbit 550,000 ? n/a n/a
Products Propane ? ? ? 4.0%
Gasoline 100,000 8.5 18.2% 24.0%
Jet fuel /kerosene
50,000 8.0 9.1% 13.0%
Diesel 240,000 7.5 43.6% 47.0%
Coke ? n/a ? 9.0%
Sulphur ? n/a ? -
Fuel and loss ? n/a ? 3.0%
Total: 390,000 100.0%
4.4 Offsites and Logistics
Figure 5.1 of the Kitimat Project Description sets out a “conceptual facility layout” for the maincomponents at the refinery. It resembles the arrangement that we have seen at other hydrocracking /
coking refineries. Items of particular note are:
The tankage for feedstock is separated from product storage. This is good operating practice,
since fire risk is always somewhat higher with finished fuel products.
Coke handling and rail loading are adjacent to Processing Train 2, which includes the delayed
coking unit. Again this is best practice, since it minimises the distance that coke must be
transported before loading and thus reduces the likelihood of particulate pollution.
The Administration and Maintenance centre is physically separated from the main process units.
We would assume that the main control room would be positioned with Administration. Such an
arrangement is normal to ensure the control room is protected, should explosions or fires occur
in the main process units.
Most refineries and petrochemical plants use their own feedstock to generate some of the electric power,
stream and water required for safe and successful operations. Navigant understand that Kitimat intends
to construct a gas-fired cogeneration plant to produce utilities.
It is our understanding that if the refinery is not constructed, Enbridge has suggested that a marine
terminal be constructed on the Douglas Channel. Presumably this will entail large crude oil tankers to
handle the bitumen. These are expected to range from Aframax 80,000 – 120,000 dead weight tonnes
(DWT), to VLCC >200,000 DWT.
One advantage to a refinery, versus exports of bitumen, is that vessels used to export products would, on
average, be considerably smaller. We would envisage that the largest would be Long Range II (70,000 to
7/29/2019 Navigant's Kitimat Refinery Final Report
http://slidepdf.com/reader/full/navigants-kitimat-refinery-final-report 19/33
14Government of British ColumbiaKitimat Refinery Review and Asian Supply – Demand Analysis
100,000+ tonnes) product tankers. Given the smaller parcel sizes with products, however, the number of
vessel movements would by necessity have to increase.
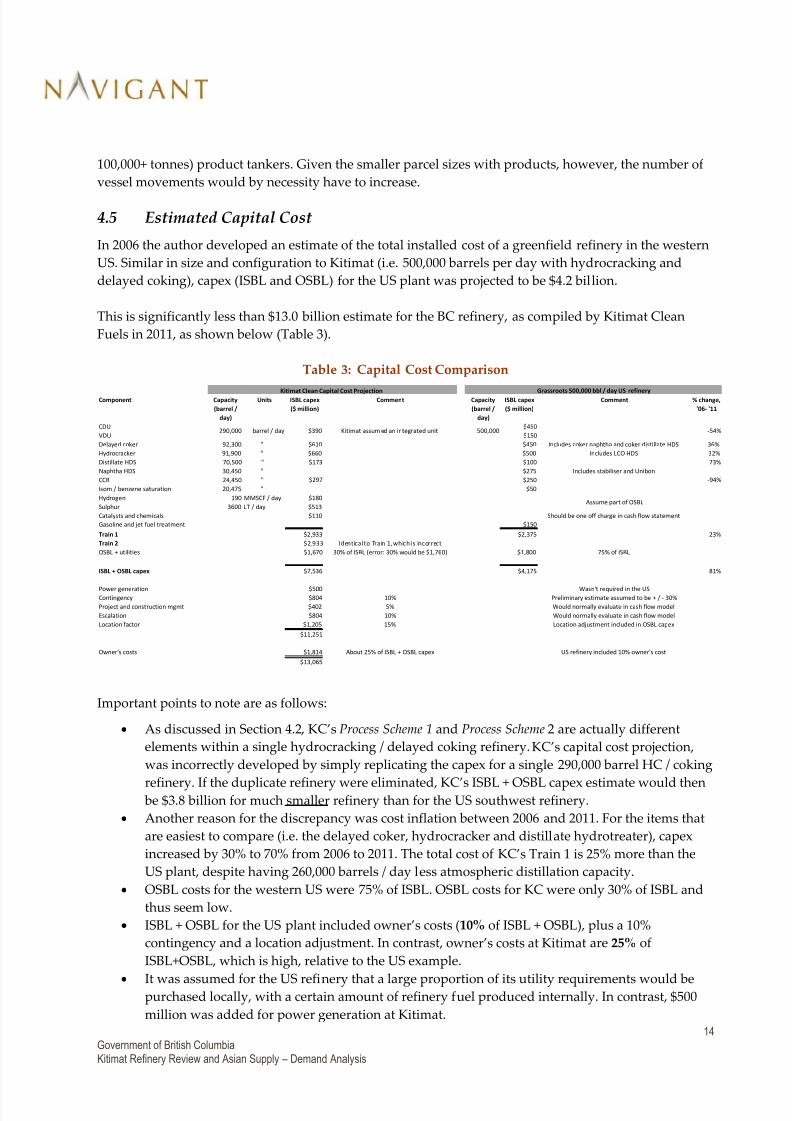
4.5 Estimated Capital Cost
In 2006 the author developed an estimate of the total installed cost of a greenfield refinery in the western
US. Similar in size and configuration to Kitimat (i.e. 500,000 barrels per day with hydrocracking and
delayed coking), capex (ISBL and OSBL) for the US plant was projected to be $4.2 billion.
This is significantly less than $13.0 billion estimate for the BC refinery, as compiled by Kitimat Clean
Fuels in 2011, as shown below (Table 3).
Table 3: Capital Cost Comparison
Component Capacity
(barrel /
day)
Units ISBL capex
($ million)
Comment Capacity
(barrel /
day)
ISBL capex
($ million)
Comment % change,
'06- '11
CDU $450
VDU $150
Delayed coker 92,300 " $610 $450 Includes coker naphtha and coker distillate HDS 36%
Hydrocracker 91,900 " $660 $500 Includes LCO HDS 32%
Distillate HDS 70,500 " $173 $100 73%
Naphtha HDS 30,450 " $275 Includes stabiliser and Unibon
CCR 24,450 " $250
Isom / benzene saturation 20,475 " $50
Hydrogen 190 MMSCF / day $180
Sulphur 3600 LT / day $513
Catalysts and chemicals $110 Should be one off charge in cash flow statement
Gasoline and jet fuel treatment $150
Train 1 $2,933 $2,375 23%
Train 2 $2,933 Identical to Train 1, which is incorrect
OSBL + utilities $1,670 30% of ISBL (error: 30% would be $1,760) $1,800 75% of ISBL
ISBL + OSBL capex $7,536 $4,175 81%
Power generation $500 Wasn't required in the USContingency $804 10% Preliminary estimate assumed to be + / - 30%
Project and construction mgmt $402 5% Would normally evaluate in cash flow model
Escalation $804 10% Would normally evaluate in cash flow model
Location factor $1,205 15% Location adjustment included in OSBL capex
$11,251
Owner's costs $1,814 About 25% of ISBL + OSBL capex US refinery included 10% owner's cost
$13,065
-54%
-94%
Assume part of OSBL
Grassroots 500,000 bbl / day US refinery
500,000
$297
Kitimat Clean Capital Cost Projection
290,000 barrel / day $390 Kitimat assum ed an integrated unit
Important points to note are as follows:
As discussed in Section 4.2 , KC’s Process Scheme 1 and Process Scheme 2 are actually different
elements within a single hydrocracking / delayed coking refinery. KC’s capital cost projection,
was incorrectly developed by simply replicating the capex for a single 290,000 barrel HC / coking
refinery. If the duplicate refinery were eliminated, KC’s ISBL + OSBL capex estimate would then be $3.8 billion for much smaller refinery than for the US southwest refinery.
Another reason for the discrepancy was cost inflation between 2006 and 2011. For the items that
are easiest to compare (i.e. the delayed coker, hydrocracker and distillate hydrotreater), capex
increased by 30% to 70% from 2006 to 2011. The total cost of KC’s Train 1 is 25% more than the
US plant, despite having 260,000 barrels / day less atmospheric distillation capacity.
OSBL costs for the western US were 75% of ISBL. OSBL costs for KC were only 30% of ISBL and
thus seem low.
ISBL + OSBL for the US plant included owner’s costs (10% of ISBL + OSBL), plus a 10%
contingency and a location adjustment. In contrast, owner’s costs at Kitimat are 25% of
ISBL+OSBL, which is high, relative to the US example.
It was assumed for the US refinery that a large proportion of its utility requirements would bepurchased locally, with a certain amount of refinery fuel produced internally. In contrast, $500
million was added for power generation at Kitimat.

7/29/2019 Navigant's Kitimat Refinery Final Report
http://slidepdf.com/reader/full/navigants-kitimat-refinery-final-report 20/33
15Government of British ColumbiaKitimat Refinery Review and Asian Supply – Demand Analysis
In the limited time available to carry out this analysis, we identified numerous issues which led us to
wonder whether Kitimat Clean’s capital cost estimate might be on the high side. It is also fair to say,however, that the 2006 case study is not fully representative of current costs, despite being similar in size
and configuration to Kitimat, because:
Equipment and labour costs have risen since 2006;
The remoteness of the Kitimat site will, without doubt, increase construction costs considerably.
Navigant has not examined the magnitude of such an increase;
The 2006 southwestern US refinery did not need a new plant for power generation, while one
will be required at Kitimat; and
The US example was not designed to process oilsands. Thus it is a somewhat imperfect
comparator to Kitimat.
If these factors are taken into consideration, Navigant would expect the total installed cost of Kitimat
(including the power plant) to exceed $7 billion. It is not possible at this stage to provide a more precise
estimate. We would therefore recommend that a more detailed projection of capex for Kitimat be carried
out.
4.6 Economics
Minimising capital costs is essential to ensuring that a process industry project will be economically
viable. For example, total installed cost is a major driver financing requirements. Thus an accurate
estimate of the capex needed to build Kitimat will be essential to maximising cash margins.
Having said that, it should be clear that the markets to which the output of Kitimat will be targeted havenot been determined and that profitability will be dependent on market selection. Since its production
could, in theory, be delivered to any of the importing countries around the Pacific Rim, one approach to
maximise margin would be to design the refinery so ensure that it can blend finished products to meet
the likely specifications in any of these countries. Such an approach has been used successfully in many
export refineries around the world, particularly in resources-rich countries of the Middle East. Shell and
ExxonMobil have operated profitable joint venture export refineries in Saudi Arabia since the mid-1980s.
4.7 Operational Models and Target Markets
In effect, therefore, Kitimat as an oil refiner has two choices for its preferring operating model.
It could on the one hand focus marketing efforts on only a few countries, or perhaps just one (e.g. China).
Such an approach has the advantage of reducing the marketing and trading skills that would need to be
acquired by the export refiner, since the seller would not need to find and supply products to the optimal
mixture of customers and markets. Thus to enter such a structure, however, would require the buyer to
be willing to pay a premium to the seller (in this case Kitimat), because the latter has given up the
flexibility and ability to optimise margins across markets.
The other alternative, as mentioned previously, would be to develop the capabilities needed to be an
export refinery, able to sell its output to a multitude of end-user markets. To do so successfully would
require a sophisticated mix of operational, marketing, trading and oil supply skills. These are essential,
given the ever-shifting relative differences in price levels and product qualities between countries.

7/29/2019 Navigant's Kitimat Refinery Final Report
http://slidepdf.com/reader/full/navigants-kitimat-refinery-final-report 21/33
16Government of British ColumbiaKitimat Refinery Review and Asian Supply – Demand Analysis
There are many successful examples where resource-rich nations, with relatively small populations, have
built export refineries and process plants that are jointly owned by the producing country and a
multinational partner. Examples include:
Saudi Arabia: Aramco with ExxonMobil (Yanbu);
Saudi Arabia: Aramco with Shell (Jubail);
Qatar: Qatar Petroleum with Sasol (Oryx GTL);
Qatar: Qatar Petroleum with Shell (Pearl; and
Qatar: Qatar Petroleum with ExxonMobil (RasGas).
4.8 Conclusions
Navigant’s view, based on the information available at the present time, is that building a refinery on the
coast of British Columbia has economic merit and should be considered seriously by the Government of
the Province. Such a refinery would provide incremental long term economic benefits to the region,compared to export of unfinished feedstock. In addition and equally importantly, if configured carefully
and managed properly, the refinery would create sustainable margins that otherwise would be lost to
Asian purchasers of Canada’s oil sands production.
Furthermore, it is our recommendation that the Province approve a design for Kitimat that would make
it capable of manufacturing fuel products for a myriad of countries around the Pacific Rim. This would
preclude being tied to only a few destination markets (or perhaps just one).

7/29/2019 Navigant's Kitimat Refinery Final Report
http://slidepdf.com/reader/full/navigants-kitimat-refinery-final-report 22/33
17Government of British ColumbiaKitimat Refinery Review and Asian Supply – Demand Analysis
5.
Asian Fuel Product Supply and Demand
5.1 Introduction
This Section will examine the fuel product supply and demand balance in key Asian countries, namely
China, India, South Korea and Japan. Historic and current data for each will be compared to the Asia /
Oceania region overall, as well as to the level of product exports from Canada.
Our analysis will show that, despite strong economic growth in some Asian countries, for about the last
15 years the aggregate demand for product imports has been surprisingly stable at roughly 2 million
barrels per day. Thus the output from Kitimat (0.5 million barrels per day) could be accommodated by
markets in Asia / Oceania without major disruption to local spot markets.
Please note that in this Section, “fuel products” are defined as LPG, gasoline, jet fuel, kerosene, gas oil,
diesel, heavy fuel oil and “other” (lubricants, waxes, etc.).
We will also consider the structure of the refining sector in China, India, South Korea and Japan. The size
and complexity of each of their industries will then be compared to major developed economies (i.e. the
US, Western Europe and Canada). Despite major and ongoing investments, the Asian refining industry
lags the latter group, both in terms of technical upgrading capability, as well as absolute size (versus the
US and Western Europe).
5.2
China
5.2.1 Chinese Supply and Demand
The impact on fuel product demand of the steady growth of the Chinese economy can be readily seen in
Figure 5. Domestic production has consistently lagged demand. Despite major investment and expansion
of refining sector, China’s fuel imports remain at about 500,000 barrels / day.

7/29/2019 Navigant's Kitimat Refinery Final Report
http://slidepdf.com/reader/full/navigants-kitimat-refinery-final-report 23/33
18Government of British ColumbiaKitimat Refinery Review and Asian Supply – Demand Analysis
Figure 5: China – Fuel Product Output and Consumption
Figure 6 provides more detail. Net imports correlate closely to China’s GDP growth rate. It is apparent
that China’s imports began to rise sharply from the mid-1990s.
Figure 6: Fuel China – Product Imports and Exports
7/29/2019 Navigant's Kitimat Refinery Final Report
http://slidepdf.com/reader/full/navigants-kitimat-refinery-final-report 24/33
19Government of British ColumbiaKitimat Refinery Review and Asian Supply – Demand Analysis
5.2.2 The Chinese Refining Industry
Chinese refining capacity has been expanding dramatically to help meet growing domestic consumption;approximately 1.1 Mbd of distillation capacity was added in the five years between 2008 and 2013. The
industry is largely state-owned. One of the Government’s policy objectives is to eliminate many of the
small topping and hydroskimming refineries in favour of larger, more complex sites. Thus the
Government began to approve foreign investment in Chinese refineries in early 2007. Participants in
either operational or planned joint ventures within China include BP, Shell and BASF, Saudi Aramco,
ExxonMobil and Qatar Petroleum. Many other companies hope to expand in the country, given the
potential opportunities that it presents.
Domestic fuel prices in China are regulated by the central government. Price controls have resulted in
extensive financial losses by Chinese refiners in recent years. This has encouraged imports.
5.3 India
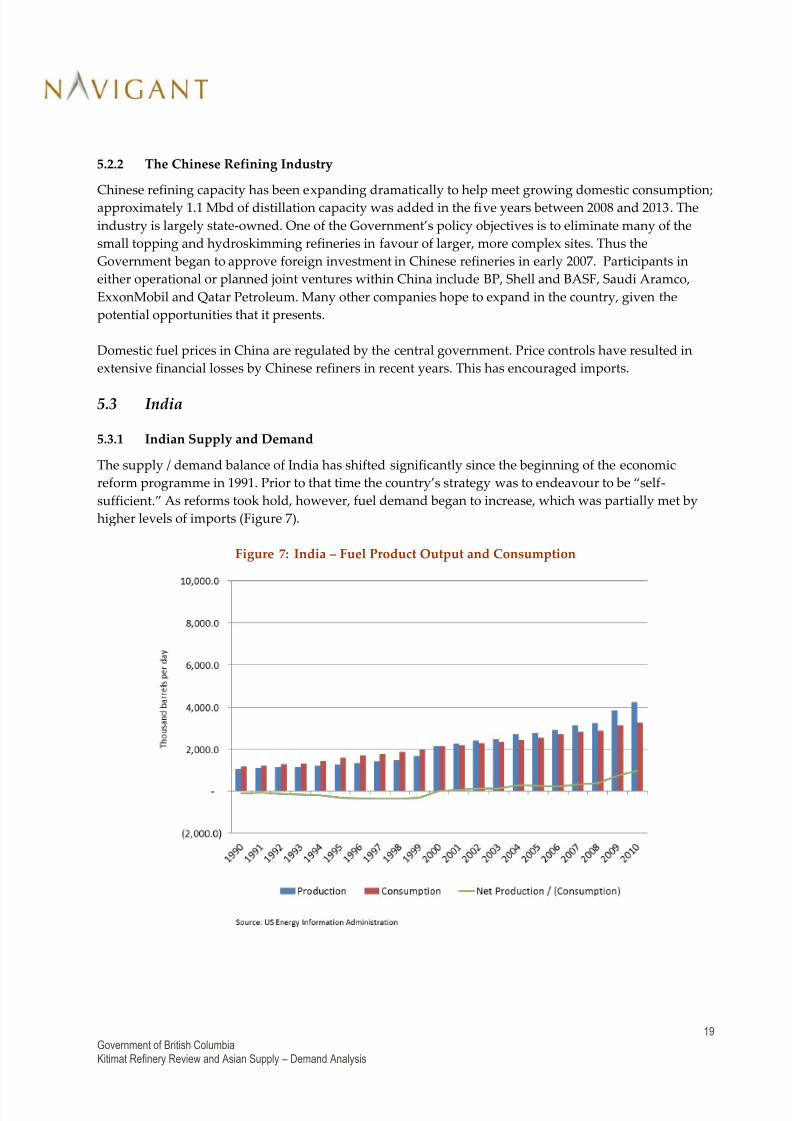
5.3.1 Indian Supply and Demand
The supply / demand balance of India has shifted significantly since the beginning of the economic
reform programme in 1991. Prior to that time the country’s strategy was to endeavour to be “self-
sufficient.” As reforms took hold, however, fuel demand began to increase, which was partially met by
higher levels of imports (Figure 7).
Figure 7: India – Fuel Product Output and Consumption

7/29/2019 Navigant's Kitimat Refinery Final Report
http://slidepdf.com/reader/full/navigants-kitimat-refinery-final-report 25/33
20Government of British ColumbiaKitimat Refinery Review and Asian Supply – Demand Analysis
5.3.2 The Indian Refining Industry
An essential distinction between India and China that should be emphasised is ownership of the refiningindustry. Although much of the latter is state-owned, a few large multi-national companies have
managed to participate in joint ventures with such companies as Sinopec and CNPC.
India is radically different; in the early 1990s most of the sector was owned by Indian Public Sector
Undertakings (PSUs), such as Indian Oil, Hindustan Petroleum, Bharat Petroleum and others. Over the
last decade however, activity by privately-held refineries has risen sharply (Table 4).
Private Indian refiners have increased domestic production sharply, since one of their objectives has been
to supply products to other Asian markets. This export-driven strategy is motivated in part by Indian
price controls, which tend to limit refining margins. The results are clearly demonstrated in Figure 8.
Since 2000, net product exports have gone from zero to nearly 1 million barrels per day.
China is unlikely to follow suit, given that most of the refining sector remains state-owned.
Table 4: Ownership of Indian Refineries
Refineries 2007 2008 2009 2010 2011 2012
Distillation capacity (Mtpa)
PSUs 105.5 105.5 105.5 112.9 122.9 135.0
Joint venture /
private
43.5 43.5 72.5 72.5 70.5 78.1
Total: 149.0 149.0 178.0 185.4 193.4 213.1
Source: Ministry of Petroleum and Natural Gas, Petroleum Planning and Analysis Unit

7/29/2019 Navigant's Kitimat Refinery Final Report
http://slidepdf.com/reader/full/navigants-kitimat-refinery-final-report 26/33
21Government of British ColumbiaKitimat Refinery Review and Asian Supply – Demand Analysis
Figure 8: India – Fuel Product Imports and Exports
5.4 South Korea
5.4.1 South Korean Supply and Demand
Figure 9 provides an overview of the Korean supply / demand balance since 1990. Consumption grew
strongly in the 1990s. Although the country’s refiners were expanding at the same time, they were not
able keep up until later in the decade, when demand growth stabilised at slightly more than two million
barrels per day.
Since then Korean refiners have continued to invest in upgrading projects, so much so that for the last 15
years South Korea has been a net exporter of fuels. This effect was particularly pronounced during the
recession in 2008 and 2009.

7/29/2019 Navigant's Kitimat Refinery Final Report
http://slidepdf.com/reader/full/navigants-kitimat-refinery-final-report 27/33
22Government of British ColumbiaKitimat Refinery Review and Asian Supply – Demand Analysis
Figure 9: South Korea – Fuel Product Output and Consumption
Although South Korean presently exports a relatively small quantity of surplus output (about 250,000
barrels / day, per Figure 10) , it would appear to be more a result of the need to balance the domesticmarket, rather than a specific export-driven strategy by private refiners (as appears to be the case with
India).

7/29/2019 Navigant's Kitimat Refinery Final Report
http://slidepdf.com/reader/full/navigants-kitimat-refinery-final-report 28/33
23Government of British ColumbiaKitimat Refinery Review and Asian Supply – Demand Analysis
Figure 10: South Korea – Fuel Product Imports and Exports
5.4.2 The South Korean Refining Industry
The South Korean refining industry is owned entirely by private companies. In fact it is quite
concentrated. All are listed on the Korean stock market, apart from Hyundai (Table 5):
Table 5: Ownership of South Korean Refineries
Company Number of Fuel Refineries Distillation Capacity (barrels / day)
SK Energy 2 1,115,000
S-Oil 1 669,000
GS Caltex 1 775,000
Hyundai Oil 1 390,000
5 2,949,000
Source: Oil & Gas Journal, 2013 Worldwide Refinery Survey, Company Annual Reports

7/29/2019 Navigant's Kitimat Refinery Final Report
http://slidepdf.com/reader/full/navigants-kitimat-refinery-final-report 29/33
24Government of British ColumbiaKitimat Refinery Review and Asian Supply – Demand Analysis
In much the same way as India, these Korean companies have invested heavily in the last five years.
Approximately $5 billion has been spent on fuel upgrading, petrochemicals and lube expansion projects
in the last five years. This effort has been successful, since the Korean industry is now technically morecomplex than China, India or Japan (
Figure 15).
5.5 Japan
5.5.1 Japanese Supply and Demand
For several years economic growth in Japan has been static at best. This is reflected in fuel consumption,
which began a steady decline in the late 1990s (Figure 11). There was a very severe downturn in the 2008
/ 2009, from which Japan has never fully recovered. Thus Japan resembles the United States more closely
than any of the other countries examined for this report.
Figure 11: Japan – Fuel Product Output and Consumption
Despite these difficulties, Japan still imports a consistent volume of product, which until the recent
recession averaged around 1 million barrels / day (Figure 12).

7/29/2019 Navigant's Kitimat Refinery Final Report
http://slidepdf.com/reader/full/navigants-kitimat-refinery-final-report 30/33
25Government of British ColumbiaKitimat Refinery Review and Asian Supply – Demand Analysis
Figure 12: Japan – Fuel Product Imports and Exports
5.5.2 The Japanese Refining Industry
As a country, Japan’s strategy for many decades has been to encourage domestic refining as a source ofproduct supply, rather than stimulate fuel product imports. The main motivation has been to capture a
perceived benefit arising from lower freight costs. Thus product exports are only used to balance the
system.
Given the steady decline in Japanese product demand, refinery utilisation has dropped concurrently,
despite ongoing efforts at capacity rationalisation. Throughput peaked at 87% in 2005 and has been
falling ever since. Japanese refiners ran at 74% of capacity in 2011. It should come as no surprise that
Japan is no longer considered a high priority market to some of the major international oil companies.
ExxonMobil sold its Japanese downstream subsidiary in 2012 for $ 3 billion to Japanese refiner and
marketer TonenGeneral Sekiyu.
5.6 Asia / Oceania
5.6.1 Asian / Oceania Supply and Demand
Navigant also compiled product supply and demand data for the countries of the Asia / Oceania region,
as defined the US Energy Information Administration. The results are presented in Figure 13 and Figure
14. These charts demonstrate that despite economic success in parts of the region and significant
differences between the refining sectors of the largest countries, the overall level of imports has remained
stable at about two million barrels / day. This suggests that the Asian region could easily accommodate
the output from Kitimat, should it be constructed as an export refinery.

7/29/2019 Navigant's Kitimat Refinery Final Report
http://slidepdf.com/reader/full/navigants-kitimat-refinery-final-report 31/33
26Government of British ColumbiaKitimat Refinery Review and Asian Supply – Demand Analysis
Figure 13: Asia / Oceania – Fuel Product Output and Consumption
Figure 14: Asia / Oceania – Fuel Product Imports and Exports

7/29/2019 Navigant's Kitimat Refinery Final Report
http://slidepdf.com/reader/full/navigants-kitimat-refinery-final-report 32/33
27Government of British ColumbiaKitimat Refinery Review and Asian Supply – Demand Analysis
5.7 Evolution of the Refining Industry in Key Countries
To place the foregoing analysis in context, Navigant compiled data on the countries studied in thisreport, together with the US, Canada and Western Europe. Information was collected on:
Atmospheric distillation capacity at various points since 1980;
The proportion of transport fuel consumption (“light products” - gasoline, diesel, jet, etc.), out of
total demand, at these same times; and
The complexity of the refining industry in each country / region. This was estimated by
comparing atmospheric distillation to the size of the main conversion units (catalytic crackers,
cokers, etc.) after adjusting to an “FCC Equivalent” basis. 1
Results are shown in
Figure 15. Several useful trends are apparent.
Figure 15: Comparison of Refining Complexity, Industry Size and Market Structure
Source: Oil & Gas Journal, 2013 Worldwide Refinery Survey. US Energy Information Administration.
Petroleum Refining: Operations and Management , Jean-Pierre Favennec.
As economies become more sophisticated, they shift from low white product demand and low refining
complexity, to high proportions of both light product consumption and upgrading capability. This effect
has been particularly pronounced in the US (green) and Western Europe (blue), even as the European
industry has continued to rationalise and close capacity.
1 Conversion ratio compares atmospheric distillation to upgrading units, which are adjusted to an FCC equivalent
basis. Non-FCC upgrading capacity therefore is adjusted using coefficients that estimate their ability to convertheavy products into lighter ones. The capacity of the other upgrading units is multiplied by the applicable factors:
FCC = 1.0, hydrocracker = 1.2, thermal cracking = 0.65, coking = 1.7, visbreaking = 0.33, deep conversion 2.1.

7/29/2019 Navigant's Kitimat Refinery Final Report
http://slidepdf.com/reader/full/navigants-kitimat-refinery-final-report 33/33
The linkage is not surprising, since upgrading is essential to deliver the higher quantities of transport
fuels which tend to accompany economic growth. Nevertheless, it is useful to point out that despitemassive investment, none of the four Asian countries examined for this study have yet to attain the
complexity possessed by Western Europe over ten years ago.
More importantly, the analysis also suggests that the refining sectors of China, India, South Korea and
Japan are not yet sufficiently complex to meet the upgrading needs and increasingly stringent product
quality of their home markets. Therefore a sophisticated export refinery on the Pacific Rim could help fill
this market requirement.
It is essential to note that markets in Japan, South Korea and China are not easy for outsiders to
penetrate. For a west coast refiner to do, collaboration with one or more local refining, petrochemical or
LPG distribution companies might make sense. Interestingly Navigant understands from some of ourcontacts in the region that Korean refiners and chemical players are frequently seeking opportunities to
locate secure sources of supplies (i.e. of naphtha diesel, LPG and aromatics), possibly as minority
investors in a refinery on the west coast of North America.
5.8 Conclusions
Navigant concluded from our assessment of the fuel product balance in Asia that exports from a refinery
at Kitimat could probably be accommodated in the Asian market without disrupting local spot prices. It
was also clear that demand patterns in each of the four countries examined in detail have developed
quite differently. The respective markets are served by local refiners that have distinct differences. Some
are state-owned, others private or a mixture of the two. Thus it is difficult to generalise, other than topoint out that their western counterparts in the US, Canada and Western Europe are more technically
complex and likely to remain that way for many years.