Embed Size (px)
Citation preview
Copyright© 2016 by Turbomachinery Laboratory, Texas A&M Engineering Experiment Station
NAVIGATING THE DEPARTMENT OF ENERGY (DOE) ENERGY CONSERVATION
STANDARD AND TEST PROCEDURE FOR PUMPS
Peter Gaydon
Hydraulic Institute
6 Campus Drive, First Floor North
Parsippany, New Jersey 07054-4406
www.Pumps.org
Mr. Peter Gaydon is the
Director of Technical
Affairs at the Hydraulic
Institute. Mr. Gaydon
held design,
development, and test
engineering positions
with major pump
manufacturers prior to
joining the Hydraulic
Institute in 2014. Mr. Gaydon has technical
responsibility for all standards, guidebooks, and
program guides published by the Hydraulic
Institute, as well as management of government
affairs committees responsible for technically
reviewing regulations related to pumps. He is
currently a member of the Appliance Standards
Federal Rulemaking Advisory Committee
(ASRAC) working group for circulator pumps.
Mr. Gaydon obtained his B.S. Degree in
Mechanical Engineering at the University of
Alfred.
ABSTRACT
Following the European Union’s (EU) lead,
the United States (US) Department of Energy
(DOE) began the long process of regulating the
energy consumption of pumps in 2011 and, with
support from the industry and advocates,
published a final Energy Conservation Standard
(ECS) and Test Procedure (TP) for Pumps (US
Department of Energy 2016a) in January 2016.
Compliance to the standard levels set in the ECS
is slated for January 27, 2020.
The rulemaking process was very thorough
involving many stakeholders; however, the
complexity of the standard and inexperience in
the United States leaves many pump
manufacturers, engineering procurement
contractors, consultants, and end users with
uncertainty regarding the requirements and
impact of the regulation. Since this is a first for
the United States, this paper will address the
contents of the ECS and TP to provide an
understanding of the scope; implications to the
manufacturer, end users, and other interested
parties; and the benefits of the rule and future
voluntary product energy labeling initiatives.
INTRODUCTION
Global energy standards for pumps are new
to the industry. European Lot 11 regulations took
effect in 2013 and progressed in 2015, and the US
regulation for commercial and industrial clean
water pumps will take effect in January 2020.
Additionally in the United States there are
separate rulemakings in process for dedicated-
purpose pool pumps and circulator pumps.
The US pump industry has experience
complying with safety, design, and other industry
standards written by trade associations or end
user groups; however, the industry has never
dealt with a law regulating the energy
consumption of products. The industry must pay
close attention to the published regulations and be
proactive in future regulations to ensure
compliance can be achieved.
As has occurred with electric motors, it is
expected that US pump energy standards will
progress vertically and horizontally. Evidence of
this can be seen in Europe where existing
standards have progressed and other pump types
outside of clean water and rotodynamic uses are
being evaluated for energy conservation
standards.
As pump energy conservation standards
progress, it will be more difficult to achieve the
required energy savings through pump efficiency
alone; therefore, an extended product or system
Copyright© 2016 by Turbomachinery Laboratory, Texas A&M Engineering Experiment Station
approach will be required to achieve the energy
savings. More and more, pumps will be sold with
motors and controls. Additional training of the
specifier, installer, and end user will be required
to ensure that published energy savings are
achieved and that “intelligent” systems are not
misapplied, resulting in reduced functionality,
reliability, and potentially increased power
consumption when misapplied.
PROBLEM STATEMENT
The US pump industry is not experienced
with energy conservation standards, and there is
a lack of understanding of the recently released
ESC and TP for pumps.
Manufacturers must understand the following:
Scope of regulated product
Procedures to accurately and repeatedly
measure pump efficiency
How to determine if products are
compliant
Multiple rating options based on the way
the pump or extended product is sold in
commerce
Certification and labeling requirements
End users must understand the following:
Scope of products
Impact on available product
Assumptions made in the calculation that
affect energy representation
Implications of the system interaction
Awareness must be raised and training
provided so that the affected parties understand
the impacts to the industry and benefits of the
regulations.
DOE ENERGY CONSERVATION
STANDARD AND TEST PROCEDURE FOR
PUMPS – PROCESS AND HISTORY
Title III of the Energy Policy and
Conservation Act (EPCA) of 1975, as amended
(42 U.S.C. 6291 et seq.) (United States of
America in Congress, 2013), sets provisions to
improve energy efficiency. Under Part C Section
340 of EPCA, pumps are listed as a type of
industrial equipment that meets the definition of
“covered equipment.” EPCA gives the DOE the
statutory authority to regulate the energy
consumption of pumps as industrial equipment.
Among the objectives of EPCA are to
increase domestic energy supplies and
availability, to restrain energy demand, and to
prepare for energy emergencies. To this end, and
following the standards developed by the EU, on
June 13, 2011 DOE enacted its statutory authority
to regulate pumps when a Request for
Information (RFI) (US Department of Energy,
2011) was issued regarding commercial and
industrial pumps.
In the RFI, DOE estimated that commercial,
industrial, and agricultural pumps consume 0.63
quadrillion Btus (quads) per year, and that
technologies exist that could reduce this
consumption by approximately 0.19 quads
annually. DOE further asked for information
from the public relating to definitions, energy
use, and the pump market, including efficiencies
and applicable test procedures.
The RFI began a five-year process of
communication between the DOE and industry
trade associations and the members thereof to
develop a Notice of Proposed Rule (NOPR) and
subsequent final rules for the ECS and TP for
pumps. The ECS and TP development process for
pumps is illustrated in Figure 1.
Figure 1. Test Procedure and Standards
Rulemaking Process (US DOE 2013b)
As part of the preliminary analysis portion of
the rulemaking, the stakeholders agreed that a
negotiated rulemaking through the Appliance
Standards and Rulemaking Federal Advisory
Committee (ASRAC) would result in the best
outcome for all interested parties. This resulted
in a Notice of Intent (NOI) (US DOE, 2013a) to
establish a commercial and industrial pumps
working group to develop a NOPR for the ECS
and TP for pumps.
Copyright© 2016 by Turbomachinery Laboratory, Texas A&M Engineering Experiment Station
The ASRAC working group membership was
made up of manufacturers, trade associations,
energy advocates, end users, an ASRAC
designee, and the US DOE representative. The
mission of this group was to educate each other,
collect required data, and negotiate and agree to a
term sheet that would be recommended to the
DOE as the basis for a NOPR.
To support the mission of the working group,
the Hydraulic Institute worked with the DOE, the
ASRAC working group, and its members to
facilitate the gathering of performance data on
more than 3000 clean water pumps. These data
were at the heart of the negotiation and eventual
setting of standard levels for pumps. Through
hard work and negotiation, the goal was achieved
on June 29, 2014 when the working group
reached consensus on a term sheet (Commercial
& Industrial Pump Working Group, 2014).
When translating the term sheet to proposed
and final rules, the requirements of EPCA must
be met. The DOE must consider seven factors
during the development and analysis of the
standards setting to verify that the standards set
can be achieved by manufacturers and are
economically justified. The following seven
factors were analyzed by DOE in consideration of
the final regulation:
1. Economic impact on consumers
2. Lifetime operating cost savings
compared to the incremental cost of more
energy efficiency equipment
3. Utility and performance impacts
4. Energy savings for a specified time
period
5. Impact on competition
6. Need for national energy conservation
7. Other factors the Secretary of Energy
considers relevant
DOE considered the above factors along with
the term sheet and published NOPRs for both the
ECS and TP in April 2015. Along with NOPRs, a
technical support document (TSD), government
regulatory impact model (GRIM), national
impact analysis (NIA), and life-cycle cost (LCC)
analyses were published to meet the requirements
of EPCA and support the proposed rules. The
published NOPRs and supporting documents
exceeded 1000 pages, which gives an indication
of the amount of work required by the DOE and
stakeholders to develop the ECS and TP.
Stakeholders reviewed the proposed rules,
documentation provided, attended a public
hearing on the proposed rule, and then submitted
comments regarding the proposed rules. DOE
considered all of the stakeholder’s comments and
addressed them in the final TP and ECS, which
were published in the Federal Register on January
25, 2016 and January 26, 2016, respectively.
SCOPE
The term “pump” is listed in EPCA;
however, it was undefined. For the purpose of the
rulemaking scope, a definition was created as
follows: Pump means equipment that is designed
to move liquids (which may include entrained
gases, free solids, and totally dissolved solids) by
physical or mechanical action and includes at
least a bare pump and, if included by the
manufacturer at the time of sale, mechanical
equipment, driver, and controls. DOE noted that
this broad definition for “pump” would provide
DOE with flexibility to make any necessary
adjustments to its regulations to address potential
scoping changes in the future that DOE may
consider.
As noted by the DOE, the definition of pump
is broad and designed to include all conceivable
pump types. As recommended in the term sheet,
the scope of the ECS and TP was limited to
rotodynamic pumps designed for clean water that
fall into five specific equipment categories and
further limited by performance and design
features.
Table 1 provides a summary of the pump
types, DOE and industry nomenclature, and
scope inclusions and exclusions. To view larger
images and full definitions for each pump type,
visit the following link:
http://www.pumps.org/DOE_Pumps.aspx
The refined scope of the ECS and TP for
pumps is inclusive of five pump equipment
classes designed for clean water:
1. End suction frame mount (ESFM)
2. End suction close coupled (ESCC)
3. In-line (IL)
Copyright© 2016 by Turbomachinery Laboratory, Texas A&M Engineering Experiment Station
4. Radially split multistage vertical in-line
diffuser casing (RSV)
5. Submersible turbine (ST), with 6-in or
smaller bowl diameter
Table 1. ESC & TP for Pumps Final Rule Scope
Summary Pump Type
Diagram
Nomenclature
(DOE)/[Industry] Scope Refinement
End Suction
Frame Mount
(ESFM) [OH0,
OH1]
Included
Clean Water
1 – 200 hp
Flow ≥ 25 gpm
Head ≤ 459 ft
14°F to 248°F
3600/1800 rpm
Ns ≤ 5000
Clean water
excluded
Sanitary spec
Nuclear spec
Mil spec
Mag-drive
Fire pump
Self-priming
Prime assist
Circulators
Pool pumps
Nonclean water
Wastewater
Slurry
API – 610
ASME B73
End Suction
Close Coupled
(ESCC) [OH7]
In-line (IL)
[OH3, OH4,
OH5]
Radially Split
Multistage
Vertical In-line
Diffuser Casing
(RSV) [VS8]
Submersible
Turbine
(ST) [VS0]
The scope is further bounded by power,
performance, and design characteristics as
follows:
Clean water pump design
1 – 200 hp (150 kW) at best efficiency
point (BEP) rate of flow for full impeller
diameter
BEP rate of flow ≥ 25 gpm (1.57 L/s) for
full impeller diameter
Head ≤ 459 ft (140 m) at BEP rate of flow
for full impeller diameter
Design temperature range of 14°F to
248°F ( -10°C to 120°C)
Nominal speed of rotation of 3600 rpm
(2880 – 4320 rpm) or 1800 rpm (1440 –
2160 rpm)
Specific speed (Ns) ≤ 5000 (US
customary units)
The basis of the scope for each pump
equipment category is that the pump is designed
for clean water. A clean water pump is defined as
a pump that is designed for use in pumping water
with a maximum nonabsorbent free solid content
of 0.016 lb/ft3 (0.25 kg/m3), and with a maximum
dissolved solid content of 3.1 lb/ft3 (50 kg/m3),
provided that the total gas content of the water
does not exceed the saturation volume and
disregarding any additives necessary to prevent
the water from freezing at a minimum of 14°F (-
10°C).
The clean water design requirement
specifically excludes the pump types that are
designed for chemical processing, oil and gas,
wastewater, or slurry applications.
Additionally specific kinds of clean water
pumps that would otherwise meet the defined
scope were excluded as follows:
Sanitary spec. pumps
Nuclear spec. pumps
Military spec. pumps
Magnetically driven pumps
Fire pumps
Self-priming pumps
Prime-assist pumps
Circulator pumps
Dedicated-purpose pool pumps
These specific kinds of clean water pumps
were excluded for various reasons ranging from
little energy savings potential, safety, unique
designs, or for consideration under a separate
standard. Two application-type pumps that were
excluded are circulator pumps and dedicated-
purpose pool pumps, which currently have
ASRAC working groups negotiating ECSs and
TPs.
THE TEST PROCEDURE
The final TP for pumps establishes the
requirements to test equipment within scope,
methods to calculate performance metrics, as
well as associated definitions and parameters that
establish the scope of applicability of the TP and
how to determine and certify compliance.
The Hydraulic Institute worked with the
DOE to develop a normative industry test
standard that could be referenced in the final TP.
Copyright© 2016 by Turbomachinery Laboratory, Texas A&M Engineering Experiment Station
HI 40.6-2014 Methods for Rotodynamic Pump
Efficiency Testing was completed in June of 2014
(Hydraulic Institute, 2014) and was incorporated
by reference in the final TP.
HI 40.6-2014 is derived from ANSI/HI 14.6-
2011, extracting the material that pertains
specifically to the determination of the efficiency
of a rotodynamic pump with no criteria for
acceptance because it was developed as a
normative standard solely for the consistent
determination of rotodynamic pump efficiency.
THE NEW STANDARD
Differing from previous EU regulations for
clean water pumps that only considered the bare
pump, the ECS is inclusive of a driver and
controls when applicable.
The ESC sets standard levels and the TP lays
out a methodology to determine if equipment is
compliant as follows:
Determine the Pump Energy Rating
(PER), in which the weighted average
power consumption of the equipment is
being rated inclusive of the driver and
controls when applicable. PER can be
constant load (CL) or variable load (VL)
and;
Determine the Pump Energy Rating
Standard (PERSTD), which is the standard
weighted average power consumption for
a minimally compliant pump inclusive of
a minimally compliant bare pump and a
minimally compliant driver and;
Determine Pump Energy Index (PEI),
which is the constant load (CL) or
variable load (VL) PER divided by the
PERSTD. PEI is the final metric used to
determine if the rated equipment is
compliant with the standard. For rated
equipment to be compliant the PEI must
be 1.0 or less.
PEICL =PERCL/VL
PERSTD≤ 1.00
Table 2 is a summary of all the performance
metrics outlined in the TP for pumps.
Table 2. Performance Metric Summary
The following will be expanded on in the
upcoming sections, but simplistically the metrics
can be described as follows:
C-value - Along with bare pumps’ BEP
rate of flow and specific speed, the C-
value sets the standard pump efficiency
(ƞpump,std) for an equipment class.
ƞpump,std – Used with the hydraulic power
at the bare pump load points along with
standard driver losses to calculate the
PERSTD.
PERSTD – The minimally compliant
weighted average power consumption for
an equipment class inclusive of the
minimally compliant driver. PERSTD is
the basis to compare the power
consumption of the equipment being
rated.
PERCL/VL –The weighted average power
consumption of the equipment being
rated inclusive of standard or actual
driver and control losses if applicable.
PEICL/VL– Is either constant load or
variable load depending if the equipment
is supplied without or with controls. PEI
is the ratio of PERCL/VL and the PERSTD.
STANDARD PUMP EFFICIENCY (ƞpump,std)
In line with the EU, but using an adapted
equation for US surveyed data, the standard
efficiency for pumps (ƞpump,std) is determined
based a constant value (C) and other known
variables that impact bare pump efficiency,
which are pump specific speed (Ns) and rate of
flow at BEP (Q100%). The equation for ƞpump,std is
a quadratic polynomial describing a three-
dimensional surface as shown in Figure 2. Figure
2 illustrates how the standard efficiency level
changes based on the equation variables and
compares the DOE surface to the EU surface.
Constant Load Variable Load
Standard Level C-Value
Standard Pump
Efficiencyηpump,STD
Standard Pump
Energy RatingPERSTD
Pump Energy
Rating (Product)PER PERCL PERVL
Pump Eneryg
Index (Product)PEI PEICL PEIVL
Performance Metric
Independent
Independent
Independent
Copyright© 2016 by Turbomachinery Laboratory, Texas A&M Engineering Experiment Station
Ƞpump,STD = -0.85×ln(Q100%)2-0.38×ln(NS)×ln(Q100%)-
11.48× ln(NS)2+17.80×ln(Q100%)+179.80×ln(NS)-
(C+555.60)
Where at nominal speed of rotation (𝑛𝑠𝑝):
Q100% = Rate of flow, in gpm at the BEP
NS = Pump specific speed = 𝑁𝑆 =𝑛𝑠𝑝∗√𝑄100%
(𝐻100%)0.75
H100% = Head, in ft at the BEP rate of flow
Figure 2. ƞpump,std Three-dimensional Surface,
DOE Compared to EU
A data survey along with the ƞpump,std equation
was used to calculate C-values for the equipment
classes. Figure 3 is a summary of C-value data
for 1800 rpm ESCC pumps surveyed as a
function of specific speed. Note that percentile
lines are overlaid on the chart. These lines
represent the baseline level (5th percentile) and
the negotiated standard level (25th percentile).
Figure 3. Failing C-value sample for ESCC
Pump with 1800 rpm Nominal Speed of Rotation
Based on the survey data, a summary of C-
values by pump types and percentile level is
provided in Table 3. The ƞpump,std equations
illustrate that the C-value is directly proportional
to pump efficiency. For example, for two ESCC
1800 pumps of identical specific speed and BEP
rate of flow, the efficiency of the 25th percentile
(C-value – 128.47) would be 5.96 percent more
efficient than the baseline level (C-value –
134.43).
Table 3. Pump Type C-value Summary by
Percentile Standard Level Set
The ECS published C-values (standard level)
that set the minimally compliant efficiency for
each equipment class as designated by the
highlighted cells in Table 3. To arrive at the C-
values, data was surveyed for all pump types
except RSV 1800/3600 and ST 1800 pumps;
therefore, in the ECS, the standard level for RSV
1800/3600 and ST 1800 pumps was set at the
baseline level and for the remaining equipment
classes the standard level was set at the 25th
percentile, which is the level at which the least
efficient 25% of pumps would be eliminated from
commerce. Based on the standard levels set, DOE
estimated 0.27 quads of energy will be saved
from 2020 through 2050.
US data were not sufficiently surveyed for
RSV types, so the standard level for RSV is
harmonized with the EU level and designated as
the baseline level.
The ST pumps included in the scope of the
ECS are primarily well-type that are of 3600 rpm
nominal speed design. Since 1800 rpm nominal
speed models are not manufactured, data were not
surveyed. To prevent a potential loophole, where
1800 rpm well pumps could be developed, DOE
included a standard value for 1800 rpm ST pumps
based on the baseline value for 3600 rpm ST
pumps.
EL0 EL2 EL4 EL5
Baseline25th Eff
Percentile
55th Eff
Percentile
70th Eff
Percentile
ESCC 1800 134.43 128.47 125.07 123.71
ESCC 3600 135.94 130.48 127.35 125.29
ESFM 1800 134.99 128.85 125.12 123.71
ESFM 3600 136.59 130.99 127.77 126.07
IL 1800 135.92 129.3 126 124.45
IL 3600 141.01 133.84 129.38 127.35
RSV 1800 129.63 - - 124.73
RSV 3600 133.2 - - 129.1
ST 1800 138.78 - - 127.15
ST 3600 138.78 134.85 129.25 127.15
Equipment
Class

Copyright© 2016 by Turbomachinery Laboratory, Texas A&M Engineering Experiment Station
PUMP ENERGY RATING STANDARD
(PERSTD)
In the TP, standard load points for
consideration are designated as 75 percent, 100
percent, and 110 percent of BEP rate of flow and
they are equally weighted. The equipment is
tested per HI 40.6-2014 to determine the BEP rate
of flow and head, and to determine the rate of
flow and head at 75 percent and 110 percent of
BEP as shown in Figure 4. When determining the
PERSTD, the pump power input and driver losses
are not directly measured; they are determined
from the hydraulic power at each load point
divided by the standard pump efficiency and
default driver losses at each load point as
described below.
Figure 4. Graphical Representation
Measurements and Standard Load Points to
Determine PERSTD
The PERSTD is a function of the pump
standard pump efficiency, the hydraulic power,
and the standard driver losses at the designated
load points at the nominal speed of rotation as
expressed below.
PERSTD = ∑ 𝜔𝑖 (𝑃𝑖, 𝑠𝑡𝑑𝑖𝑛 ) =
0.3333 × (𝑃𝑢75%
0.947×𝜂𝑝𝑢𝑚𝑝,𝑆𝑇𝐷
100
+ 𝐿75%𝑠𝑡𝑑 ) + 0.3333 ×
(𝑃𝑢100%
𝜂𝑝𝑢𝑚𝑝,𝑆𝑇𝐷
100
+ 𝐿100%𝑠𝑡𝑑 ) + 0.3333 × (
𝑃𝑢110%
0.985×𝜂𝑝𝑢𝑚𝑝,𝑆𝑇𝐷
100
+ 𝐿110%𝑠𝑡𝑑 )
Where:
𝑷𝒊, 𝒔𝒕𝒅𝒊𝒏 = Driver power input to minimally
compliant pump
𝝎𝒊 = Weighting at load points, this is equal to 0.3333
𝑷𝒖,𝒊 =𝑄𝑖 ∗ 𝐻𝑖
3956= Bare pump hydraulic power
at the load point 𝜼𝒑𝒖𝒎𝒑,𝒔𝒕𝒅 = Standard bare pump efficiency
𝑳𝒊𝒔𝒕𝒅 = Standard driver part load losses at the load
points
𝒊 = Load points 75%, 100%, and 110%
of BEP
The standard driver losses applied are a
function of the 120 percent of BEP rate of flow
power consumption for a bare pump or the
nameplate motor power rating for a pump sold
with a driver or driver and controls. With the
exception of ST pumps, the driver losses are
based on the default minimum of the open or
closed nominal full-load motor efficiency
(𝜂𝑚𝑜𝑡𝑜𝑟,𝑓𝑢𝑙𝑙) listed for two- and four-pole
NEMA design B motors listed in 10 CFR
431.25(g).
Since ST pumps use motors that are not listed
in 10 CFR 431.25(g), DOE surveyed motor
manufacturers and published in the TP a default
motor efficiency table for submersible motors.
In consideration of the PERSTD equation, the
following calculations are made.
1. The standard default full-load motor
losses(𝐿𝑓𝑢𝑙𝑙,𝑠𝑡𝑑) are determined
𝐿𝑓𝑢𝑙𝑙,𝑠𝑡𝑑 = 𝑀𝑜𝑡𝑜𝑟 𝐻𝑃
𝜂𝑚𝑜𝑡𝑜𝑟,𝑓𝑢𝑙𝑙
100
− 𝑀𝑜𝑡𝑜𝑟 𝐻𝑃
2. The standard part-load loss factors
(𝑦𝑖𝑠𝑡𝑑) at each load point
𝑦𝑖𝑠𝑡𝑑 = −0.4508 × (
𝑃𝑖𝑠𝑡𝑑
𝑀𝑜𝑡𝑜𝑟 𝐻𝑃)
3
+ 1.2399 × (𝑃𝑖
𝑠𝑡𝑑
𝑀𝑜𝑡𝑜𝑟 𝐻𝑃)
2
− 0.4301 × (𝑃𝑖
𝑠𝑡𝑑
𝑀𝑜𝑡𝑜𝑟 𝐻𝑃) + 0.6410
3. The part-load losses (𝐿𝑖𝑠𝑡𝑑) at each load
point are calculated based on the part-
load loss factors and the standard full-
load motor losses
𝐿𝑖𝑠𝑡𝑑 = 𝑦𝑖
𝑠𝑡𝑑 × 𝐿𝑓𝑢𝑙𝑙,𝑠𝑡𝑑
75%
100% 110%
Head
Efficiency
Power
BEP rate
of flow
Copyright© 2016 by Turbomachinery Laboratory, Texas A&M Engineering Experiment Station
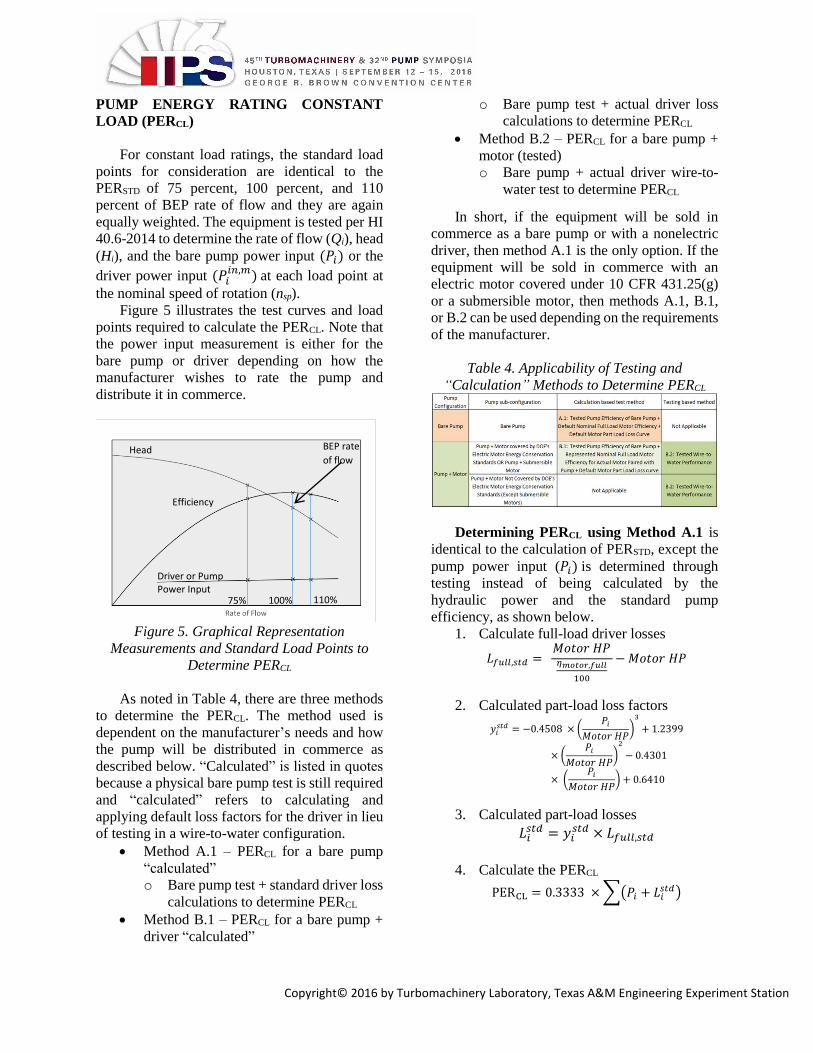
PUMP ENERGY RATING CONSTANT
LOAD (PERCL)
For constant load ratings, the standard load
points for consideration are identical to the
PERSTD of 75 percent, 100 percent, and 110
percent of BEP rate of flow and they are again
equally weighted. The equipment is tested per HI
40.6-2014 to determine the rate of flow (Qi), head
(Hi), and the bare pump power input (𝑃𝑖) or the
driver power input (𝑃𝑖𝑖𝑛,𝑚) at each load point at
the nominal speed of rotation (nsp).
Figure 5 illustrates the test curves and load
points required to calculate the PERCL. Note that
the power input measurement is either for the
bare pump or driver depending on how the
manufacturer wishes to rate the pump and
distribute it in commerce.
Figure 5. Graphical Representation
Measurements and Standard Load Points to
Determine PERCL
As noted in Table 4, there are three methods
to determine the PERCL. The method used is
dependent on the manufacturer’s needs and how
the pump will be distributed in commerce as
described below. “Calculated” is listed in quotes
because a physical bare pump test is still required
and “calculated” refers to calculating and
applying default loss factors for the driver in lieu
of testing in a wire-to-water configuration.
Method A.1 – PERCL for a bare pump
“calculated”
o Bare pump test + standard driver loss
calculations to determine PERCL
Method B.1 – PERCL for a bare pump +
driver “calculated”
o Bare pump test + actual driver loss
calculations to determine PERCL
Method B.2 – PERCL for a bare pump +
motor (tested)
o Bare pump + actual driver wire-to-
water test to determine PERCL
In short, if the equipment will be sold in
commerce as a bare pump or with a nonelectric
driver, then method A.1 is the only option. If the
equipment will be sold in commerce with an
electric motor covered under 10 CFR 431.25(g)
or a submersible motor, then methods A.1, B.1,
or B.2 can be used depending on the requirements
of the manufacturer.
Table 4. Applicability of Testing and
“Calculation” Methods to Determine PERCL
Determining PERCL using Method A.1 is
identical to the calculation of PERSTD, except the
pump power input (𝑃𝑖) is determined through
testing instead of being calculated by the
hydraulic power and the standard pump
efficiency, as shown below.
1. Calculate full-load driver losses
𝐿𝑓𝑢𝑙𝑙,𝑠𝑡𝑑 = 𝑀𝑜𝑡𝑜𝑟 𝐻𝑃𝜂𝑚𝑜𝑡𝑜𝑟,𝑓𝑢𝑙𝑙
100
− 𝑀𝑜𝑡𝑜𝑟 𝐻𝑃
2. Calculated part-load loss factors
𝑦𝑖𝑠𝑡𝑑 = −0.4508 × (
𝑃𝑖
𝑀𝑜𝑡𝑜𝑟 𝐻𝑃)
3
+ 1.2399
× (𝑃𝑖
𝑀𝑜𝑡𝑜𝑟 𝐻𝑃)
2
− 0.4301
× (𝑃𝑖
𝑀𝑜𝑡𝑜𝑟 𝐻𝑃) + 0.6410
3. Calculated part-load losses
𝐿𝑖𝑠𝑡𝑑 = 𝑦𝑖
𝑠𝑡𝑑 × 𝐿𝑓𝑢𝑙𝑙,𝑠𝑡𝑑
4. Calculate the PERCL
PERCL = 0.3333 × ∑(𝑃𝑖 + 𝐿𝑖𝑠𝑡𝑑)
100% 110%
Head
Efficiency
Driver or Pump Power Input
BEP rate
of flow
75%
Copyright© 2016 by Turbomachinery Laboratory, Texas A&M Engineering Experiment Station
Determining PERCL using Method B.1 is
only applicable for pumps distributed in
commerce with motors under 10 CFR Part
431.25(g) or submersible motors. Pumps
distributed in commerce with other motors must
use method B.2. Identical to method A.1, the
pump power input (𝑃𝑖) is determined through
testing; however, the nameplate nominal motor
efficiency is used instead of the default table.
Exception: ST pumps do not use motors
under an ECS; therefore, default motor
efficiencies outlined in the TP must be used, but
the nameplate motor power is used.
1. Calculate full-load driver losses
𝐿𝑓𝑢𝑙𝑙,𝑁𝑃 = 𝑀𝑜𝑡𝑜𝑟𝐻𝑃, 𝑁𝑃
𝜂𝑚𝑜𝑡𝑜𝑟,𝑓𝑢𝑙𝑙,𝑁𝑃
100
− 𝑀𝑜𝑡𝑜𝑟𝐻𝑃, 𝑁𝑃
2. Calculated part-load loss factors
𝑦𝑖𝑠𝑡𝑑 = −0.4508 × (
𝑃𝑖
𝑀𝑜𝑡𝑜𝑟 𝐻𝑃, 𝑁𝑃)
3
+ 1.2399
× (𝑃𝑖
𝑀𝑜𝑡𝑜𝑟 𝐻𝑃, 𝑁𝑃)
2
− 0.4301
× (𝑃𝑖
𝑀𝑜𝑡𝑜𝑟 𝐻𝑃, 𝑁𝑃) + 0.6410
3. Calculated part-load losses
𝐿𝑖𝑠𝑡𝑑 = 𝑦𝑖
𝑠𝑡𝑑 × 𝐿𝑓𝑢𝑙𝑙,𝑁𝑃
4. Calculate the PERCL
PERCL = 0.3333 × ∑(𝑃𝑖 + 𝐿𝑖𝑠𝑡𝑑)
Determining PERCL using Method B.2
eliminates the calculation of motor losses because
the driver input power (𝑃𝑖𝑖𝑛,𝑚) is measured
directly as shown below.
PERCL = 0.3333 × ∑(𝑃𝑖𝑖𝑛,𝑚)
PUMP ENERGY RATING VARIABLE
LOAD (PERVL)
The TP states that equipment distributed in
commerce with continuous or noncontinuous
controls can be rated in a variable-load
configuration. This is a rating advantage over
equipment sold without these controls because
the variable-load rating considers load points
achieved by reducing the pump speed.
A continuous control is defined as a control
that adjusts the speed of the pump driver
continuously over the driver operating speed
range in response to incremental changes in the
required pump flow, head, or power output. As an
example, variable speed drives, including
variable frequency drives and electronically
commutated motors, would meet the definition
for continuous controls.
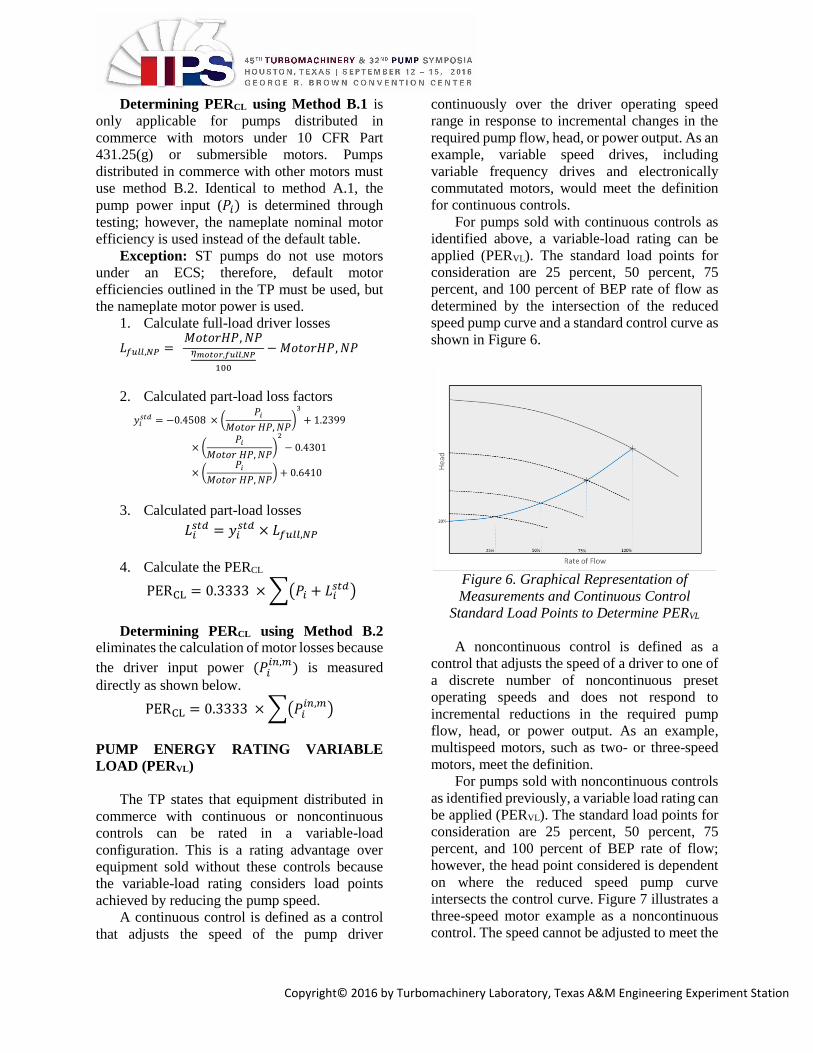
For pumps sold with continuous controls as
identified above, a variable-load rating can be
applied (PERVL). The standard load points for
consideration are 25 percent, 50 percent, 75
percent, and 100 percent of BEP rate of flow as
determined by the intersection of the reduced
speed pump curve and a standard control curve as
shown in Figure 6.
Figure 6. Graphical Representation of
Measurements and Continuous Control
Standard Load Points to Determine PERVL
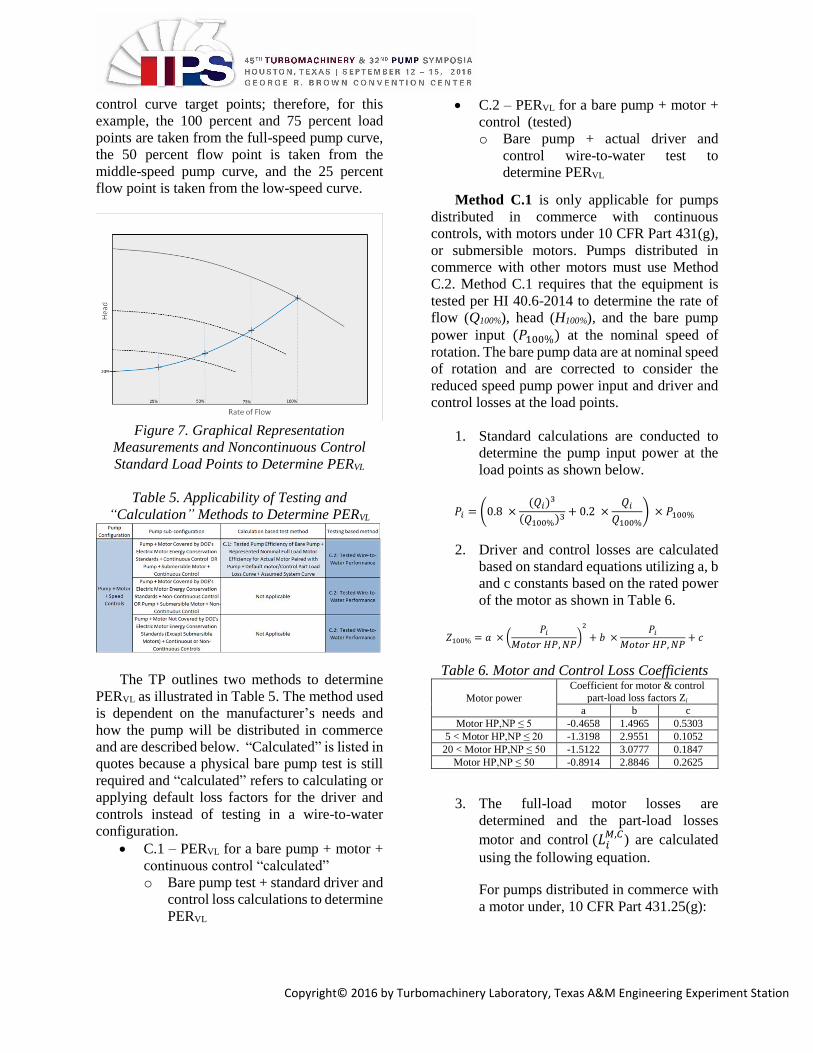
A noncontinuous control is defined as a
control that adjusts the speed of a driver to one of
a discrete number of noncontinuous preset
operating speeds and does not respond to
incremental reductions in the required pump
flow, head, or power output. As an example,
multispeed motors, such as two- or three-speed
motors, meet the definition.
For pumps sold with noncontinuous controls
as identified previously, a variable load rating can
be applied (PERVL). The standard load points for
consideration are 25 percent, 50 percent, 75
percent, and 100 percent of BEP rate of flow;
however, the head point considered is dependent
on where the reduced speed pump curve
intersects the control curve. Figure 7 illustrates a
three-speed motor example as a noncontinuous
control. The speed cannot be adjusted to meet the
Copyright© 2016 by Turbomachinery Laboratory, Texas A&M Engineering Experiment Station
control curve target points; therefore, for this
example, the 100 percent and 75 percent load
points are taken from the full-speed pump curve,
the 50 percent flow point is taken from the
middle-speed pump curve, and the 25 percent
flow point is taken from the low-speed curve.
Figure 7. Graphical Representation
Measurements and Noncontinuous Control
Standard Load Points to Determine PERVL
Table 5. Applicability of Testing and
“Calculation” Methods to Determine PERVL
The TP outlines two methods to determine
PERVL as illustrated in Table 5. The method used
is dependent on the manufacturer’s needs and
how the pump will be distributed in commerce
and are described below. “Calculated” is listed in
quotes because a physical bare pump test is still
required and “calculated” refers to calculating or
applying default loss factors for the driver and
controls instead of testing in a wire-to-water
configuration.
C.1 – PERVL for a bare pump + motor +
continuous control “calculated”
o Bare pump test + standard driver and
control loss calculations to determine
PERVL
C.2 – PERVL for a bare pump + motor +
control (tested)
o Bare pump + actual driver and
control wire-to-water test to
determine PERVL
Method C.1 is only applicable for pumps
distributed in commerce with continuous
controls, with motors under 10 CFR Part 431(g),
or submersible motors. Pumps distributed in
commerce with other motors must use Method
C.2. Method C.1 requires that the equipment is
tested per HI 40.6-2014 to determine the rate of
flow (Q100%), head (H100%), and the bare pump
power input (𝑃100%) at the nominal speed of
rotation. The bare pump data are at nominal speed
of rotation and are corrected to consider the
reduced speed pump power input and driver and
control losses at the load points.
1. Standard calculations are conducted to
determine the pump input power at the
load points as shown below.
𝑃𝑖 = (0.8 ×(𝑄𝑖)3
(𝑄100%)3+ 0.2 ×
𝑄𝑖
𝑄100%) × 𝑃100%
2. Driver and control losses are calculated
based on standard equations utilizing a, b
and c constants based on the rated power
of the motor as shown in Table 6.
𝑍100% = 𝑎 × (𝑃𝑖
𝑀𝑜𝑡𝑜𝑟 𝐻𝑃, 𝑁𝑃)
2
+ 𝑏 ×𝑃𝑖
𝑀𝑜𝑡𝑜𝑟 𝐻𝑃, 𝑁𝑃+ 𝑐
Table 6. Motor and Control Loss Coefficients
Motor power
Coefficient for motor & control
part-load loss factors Zi
a b c
Motor HP,NP ≤ 5 -0.4658 1.4965 0.5303
5 < Motor HP,NP ≤ 20 -1.3198 2.9551 0.1052
20 < Motor HP,NP ≤ 50 -1.5122 3.0777 0.1847
Motor HP,NP ≤ 50 -0.8914 2.8846 0.2625
3. The full-load motor losses are
determined and the part-load losses
motor and control (𝐿𝑖𝑀,𝐶
) are calculated
using the following equation.
For pumps distributed in commerce with
a motor under, 10 CFR Part 431.25(g):
Copyright© 2016 by Turbomachinery Laboratory, Texas A&M Engineering Experiment Station
𝐿𝑓𝑢𝑙𝑙,𝑁𝑃 = 𝑀𝑜𝑡𝑜𝑟𝐻𝑃, 𝑁𝑃
𝜂𝑚𝑜𝑡𝑜𝑟,𝑓𝑢𝑙𝑙,𝑁𝑃
100
− 𝑀𝑜𝑡𝑜𝑟𝐻𝑃, 𝑁𝑃
𝐿𝑖𝑀,𝐶
= Zi × Lfull,NP
For pumps distributed in commerce with
a submersible motor:
𝐿𝑓𝑢𝑙𝑙,𝑠𝑡𝑑 = 𝑀𝑜𝑡𝑜𝑟 𝐻𝑃𝜂𝑚𝑜𝑡𝑜𝑟,𝑓𝑢𝑙𝑙
100
− 𝑀𝑜𝑡𝑜𝑟 𝐻𝑃
𝐿𝑖𝑀,𝐶 = Zi × Lfull,std
4. Calculate PERVL based on the equally
weighted average of the pump power input
and driver and control losses at the load
points.
PERVL = 0.25 × ∑(𝑃𝑖 + 𝐿𝑖𝑀,𝐶)
Method C.2 is applicable for pumps
distributed in commerce with continuous or non-
continuous controls. The TP specifies that in
addition to wire-to-water constant load testing as
outlined in HI 40.6-2014, there is a requirement
to test the equipment as distributed in commerce
and measure the control power input (𝑃𝑖𝑖𝑛,𝐶) at
the load points as identified in Figures 6 and 7.
This method requires no driver and control loss
calculations because they are measured directly;
therefore, the PERVL can be calculated directly in
one step as shown.
PERVL = 0.25 × ∑(𝑃𝑖𝑖𝑛,𝐶)
PUMP ENERGY INDEX (PEI)
The PEI is the final metric that determines
compliance with the ECS. As outlined above it
considers the weighted average power of a
minimally compliant pump (PERSTD) and the
weighted average power of the pump being rated
(PERCL/VL). The ratio of these values creates the
index. For rated equipment to be compliant, the
PEI must be 1.00 or less as described below.
PEICL/VL =PERCL/VL
PERSTD≤ 1.00
When a basic model is not compliant, there
are several options for the manufacturer.
The pump efficiency of the basic model
can be improved,
A more efficient motor can be applied, or
Controls can be added to the basic model
Table 7 summarizes these three options and
shows representative PEICL/VL. In this example,
the bare pump as tested fails the PEI criteria, but
increasing the efficiency of the pump or motor or
adding continuous controls results in a compliant
rating.
Table 7. PEICL/VL Rating Examples
In-line
3600
1 -
Bare
pump
2 - Bare
pump,
increase
efficiency
3 - Bare
pump,
high-
efficiency
motor
4 - Bare
pump,
motor,
controls
Q100% 358.30 358.30 358.30 358.30
H100% 89.34 89.34 89.34 89.34
𝜂𝑝𝑢𝑚𝑝 73.36 74.86 73.36 73.36
P100% 11.03 10.81 11.03 11.03
𝜂𝑚𝑜𝑡𝑜𝑟 90.20 90.20 92.00 90.20
MotorHP 15 15 15 15
PERSTD 12.09 12.09 12.09 12.09
PERCL/VL 12.26 12.12 11.99 6.17
PEICL/VL 1.01 1.00 0.99 0.51
The examples shown in Table 7 illustrate the
benefit of rating a product inclusive of continuous
controls, as can be seen by the reduction in the
PEI from 1.01 to 0.51 without improving the
efficiency of the pump or motor. The reduction
in PEI is the result of the reduced power
consumption at the standard variable load points
and not increased pump, driver, or drive
efficiency; however, the reduced PEI rating
considers the improved system efficiency that
will result from a reduction is system pressure or
elimination of the need to bypass flow to control
the system.
PEI is a ratio of rated power to the minimally
compliant (baseline); therefore, it can easily be
used to estimate power consumption over the
baseline product. Also two PEI-rated products
can be compared and the difference in power
consumption can be estimated. If the example in
Table 7 is examined, the following estimations
for power consumption over or under the DOE
Copyright© 2016 by Turbomachinery Laboratory, Texas A&M Engineering Experiment Station
compliant pump can be made respective of the
PEI ratings using the following equation.
Power savings (hp) = (1 – PEI) × MotorHP
In the above equation, MotorHP is used as the
standard power consumed, but it should be
understood that PERSTD is more accurate;
however, PERSTD is not be readily available to the
user of the equipment, so MotorHP is subsituted
for convenience. Following are examples of the
power consumption or savings over baseline for
the four configurations outlined in Table 7.
1. Power savings (hp) = (1 – 1.01) × 15 =
-0.15 hp
2. Power savings (hp) = (1 – 1.00) × 15 =
0 hp
3. Power savings (hp) = (1 – 0.99) × 15 =
0.15 hp
4. Power savings (hp) = (1 – 0.51) × 15 =
7.35 hp
The user should be aware that the power
savings calculation is an estimate based on the
standard load points and weighting thereof and
the actual power consumption depends on the
operational load points. Two examples where the
estimated power consumptions can be inaccurate
are:
1. If a variable load rated pump is installed
in a constant flow application resulting in
the actual weighting values at each load
point being different than the weighting
values specified in the TP.
2. An application in which the actual load
profile curve differes significantly from
the load profile curve specified in the TP.
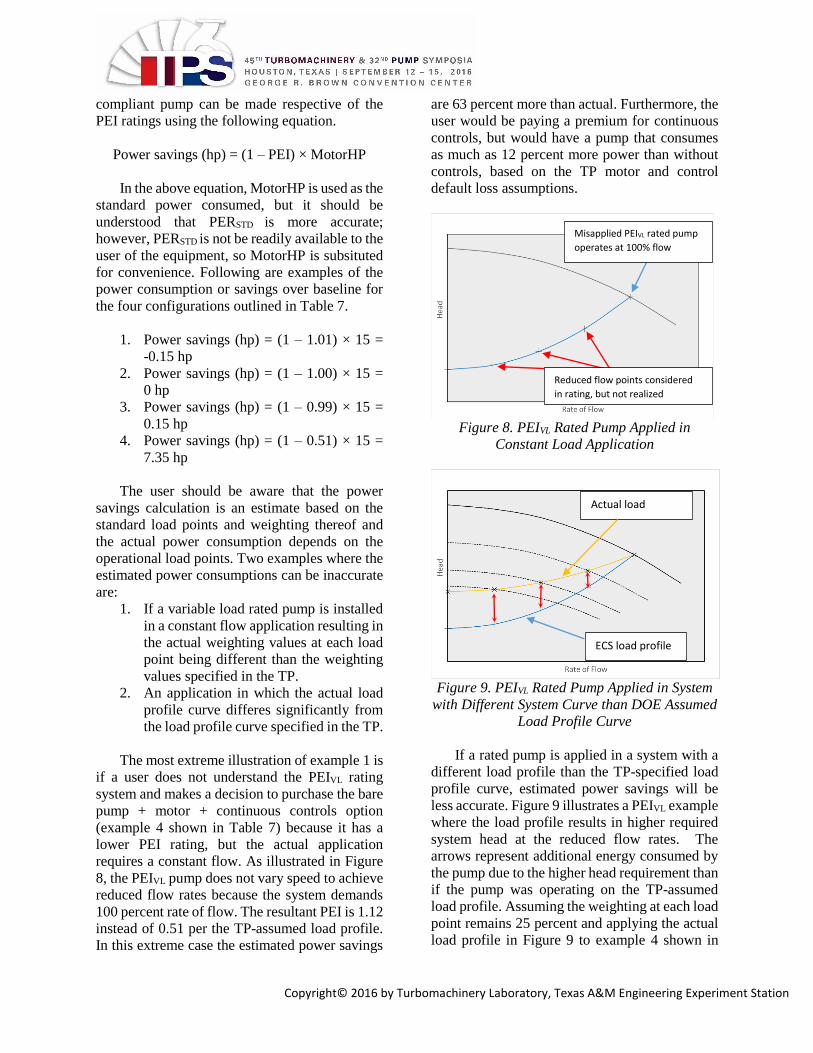
The most extreme illustration of example 1 is
if a user does not understand the PEIVL rating
system and makes a decision to purchase the bare
pump + motor + continuous controls option
(example 4 shown in Table 7) because it has a
lower PEI rating, but the actual application
requires a constant flow. As illustrated in Figure
8, the PEIVL pump does not vary speed to achieve
reduced flow rates because the system demands
100 percent rate of flow. The resultant PEI is 1.12
instead of 0.51 per the TP-assumed load profile.
In this extreme case the estimated power savings
are 63 percent more than actual. Furthermore, the
user would be paying a premium for continuous
controls, but would have a pump that consumes
as much as 12 percent more power than without
controls, based on the TP motor and control
default loss assumptions.
Figure 8. PEIVL Rated Pump Applied in
Constant Load Application
Figure 9. PEIVL Rated Pump Applied in System
with Different System Curve than DOE Assumed
Load Profile Curve
If a rated pump is applied in a system with a
different load profile than the TP-specified load
profile curve, estimated power savings will be
less accurate. Figure 9 illustrates a PEIVL example
where the load profile results in higher required
system head at the reduced flow rates. The
arrows represent additional energy consumed by
the pump due to the higher head requirement than
if the pump was operating on the TP-assumed
load profile. Assuming the weighting at each load
point remains 25 percent and applying the actual
load profile in Figure 9 to example 4 shown in
Reduced flow points considered
in rating, but not realized
Misapplied PEIVL rated pump
operates at 100% flow
ECS load profile
Actual load
profileprofile
Copyright© 2016 by Turbomachinery Laboratory, Texas A&M Engineering Experiment Station
Table 7, the resultant PEIVL is 0.62 instead of
0.51. This is 11 percent more power consumption
than is calculated using the TP-assumed load
profile curve.
The PEI is a great tool for estimating power
and energy savings in a general manner, but the
user of the pump must understand the system in
which it is applied to accuratly determine the
power savings that will be realized. This is more
important when considering pumps with a
variable load rating because system conditions
may not warrant the use of variable speed to
regulate the system flow and, in misapplied cases,
the power consumption could be more than if a
constant load rated pump was applied.
LABELING, CERTIFICATION, AND
COMPLIANCE
Labeling requirements of the ECS are that a
permanent nameplate on the pump and all catalog
and marketing material that represents the energy
consumption of the pump will display the
following:
PEICL or PEIVL
Bare pump model number
Impeller diameter or space left for it if
final trim is determined later in the
commerce stream
The ECS and TP became effective on March
28, 2016 and compliance is required on January
27, 2020. Annual filing is required, with
certification reports due September 1st of each
year; however, the submittal procedure and data
portal has not been specified by DOE.
Certification reports require the following data at
the pump BEP and nominal speed of rotation:
The pump configuration as distributed in
commerce
o Bare pump equipment category
i. with driver
ii. with driver and controls
o Or, must otherwise provide sufficent
information to identify the specific
driver model and/or control models
with which the bare pump is
distributed
Basic model number descriptive of the
bare pump and driver and controls if
applicable
PEICL or PEIVL
Whether PEI is calculated or tested
Pump total head
Flow, in gpm
Calculated driver power input at each
load, in hp
Full impeller diameter
Number of stages for RSV and ST pumps
Bowl diameter for ST pumps
For pumps supplied with motors:
o Nominal motor efficency
o Motor hp
Optional reporting:
o Pump efficiency at BEP
o PERCL or PERVL
VOLUNTARY INDUSTRY LABELING
AND THE EXTENDED MOTOR PRODUCT
LABELING INITIATIVE (EMPLI)
In addition to pumps, the DOE is working on
ECSs for other motor-driven systems. Currently
fans and compressors are in different stages of the
process, with rules expected to be published in the
2016/2017 time frame. Benefits of these ECSs to
the motor-driven systems industry are:
Defined products and scope
Standard efficiency levels
Performance metrics and test procedures
to arrive at consistent representations of
energy consumption.
Since energy conservation standards are
being developed across multiple motor-driven
systems, it gives the industries an opportunity to
develop a common-themed labeling program for
motor-driven equipment.
Early in the rulemaking processes, an
extended motor product labeling initiative
(EMPLI) was created. The initiative is a joint
effort between the American Council for an
Energy Efficient Economy (ACEEE), energy
advocates, utility power administrators, and trade
associations that represent fans (Air Movement &
Controls Association [AMCA]), compressors
(Compressed Air & Gas Institute [CAGI]),
pumps (Hydraulic Institute [HI]), and drives,
Copyright© 2016 by Turbomachinery Laboratory, Texas A&M Engineering Experiment Station
drivers, and controls (National Electrical
Manufacturers Associations [NEMA]).
The goal of EMPLI is to accelerate the
adoption of high-performance equipment into the
marketplace ahead of the compliance date in the
respective ECSs. Users of motor-driven systems
should expect the voluntary labeling programs as
the first noticable impact of the respective ECS
and TP.
To accomplish this, the trade associations are
working together with utility representatives to
develop common-themed, third-party labels that
build on the ECSs, and communicate relative
enegy consumption of the motor-driven system in
an easy and understandable way.
The programs and label or rating must
communicate energy savings verification to meet
the requirements of the public service
commissions in order for power utility
administrators to design incentive programs
based on the label, thereby accelerating the
adoption of more efficient equipment.
The ECS and TP for pumps allowed the HI
pump committee to move forward with
developing a rating system, label, and program to
adminster it. The program is currently under
development, going through committee approval
processes. The HI pump committee understood
the label must provide utility program
administrators the required information to justify
incentives based on power reduction from a base
case. To that end, the HI pump committee
considered several rating ideas, but is ultimately
proposing a “yardstick” approach called the HI
Energy Rating, which is similar to EnergyGuide
ratings seen on appliances. It is understood that
for commercial and industrial products a label
may not be required and that the developed rating
and label may or may not be applied to the
product, but will be placed in marketing and
submittal information used to make purchasing
decisions.
To develop the energy rating, the HI
committee evaluated data published by DOE in
the Technical Support Document (TSD) (US
Department of Energy, 2015) to the ECS. The
TSD presented the scatter plots of C-values for
each pump equipment category. These data were
evaluated to understand the expected range of
PEICL/VL for an equipment category from the base
case to the maximum surveyed, allowing the
maximum and minimum energy consumption to
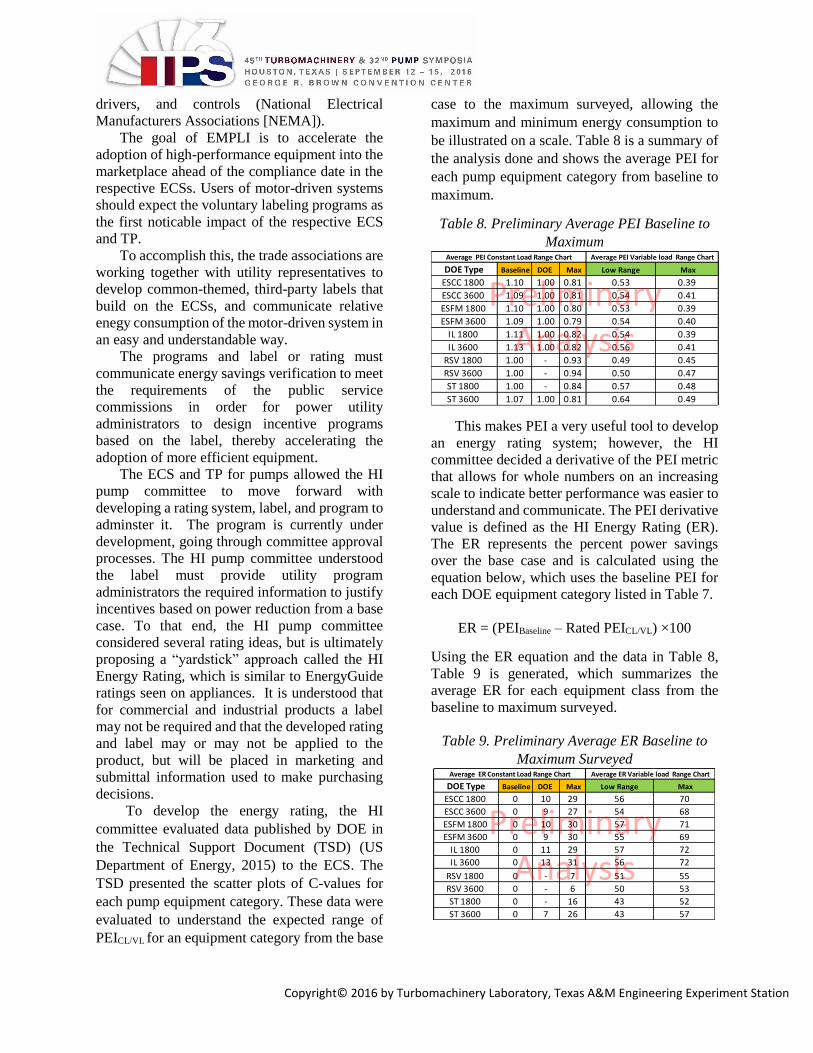
be illustrated on a scale. Table 8 is a summary of
the analysis done and shows the average PEI for
each pump equipment category from baseline to
maximum.
Table 8. Preliminary Average PEI Baseline to
Maximum
This makes PEI a very useful tool to develop
an energy rating system; however, the HI
committee decided a derivative of the PEI metric
that allows for whole numbers on an increasing
scale to indicate better performance was easier to
understand and communicate. The PEI derivative
value is defined as the HI Energy Rating (ER).
The ER represents the percent power savings
over the base case and is calculated using the
equation below, which uses the baseline PEI for
each DOE equipment category listed in Table 7.
ER = (PEIBaseline – Rated PEICL/VL) ×100
Using the ER equation and the data in Table 8,
Table 9 is generated, which summarizes the
average ER for each equipment class from the
baseline to maximum surveyed.
Table 9. Preliminary Average ER Baseline to
Maximum Surveyed
DOE Type Baseline DOE Max Low Range Max
ESCC 1800 1.10 1.00 0.81 0.53 0.39
ESCC 3600 1.09 1.00 0.81 0.54 0.41
ESFM 1800 1.10 1.00 0.80 0.53 0.39
ESFM 3600 1.09 1.00 0.79 0.54 0.40
IL 1800 1.11 1.00 0.82 0.54 0.39
IL 3600 1.13 1.00 0.82 0.56 0.41
RSV 1800 1.00 - 0.93 0.49 0.45
RSV 3600 1.00 - 0.94 0.50 0.47
ST 1800 1.00 - 0.84 0.57 0.48
ST 3600 1.07 1.00 0.81 0.64 0.49
Average PEI Variable load Range ChartAverage PEI Constant Load Range Chart
DOE Type Baseline DOE Max Low Range Max
ESCC 1800 0 10 29 56 70
ESCC 3600 0 9 27 54 68
ESFM 1800 0 10 30 57 71
ESFM 3600 0 9 30 55 69
IL 1800 0 11 29 57 72
IL 3600 0 13 31 56 72
RSV 1800 0 - 7 51 55
RSV 3600 0 - 6 50 53
ST 1800 0 - 16 43 52
ST 3600 0 7 26 43 57
Average ER Constant Load Range Chart Average ER Variable load Range Chart
Copyright© 2016 by Turbomachinery Laboratory, Texas A&M Engineering Experiment Station
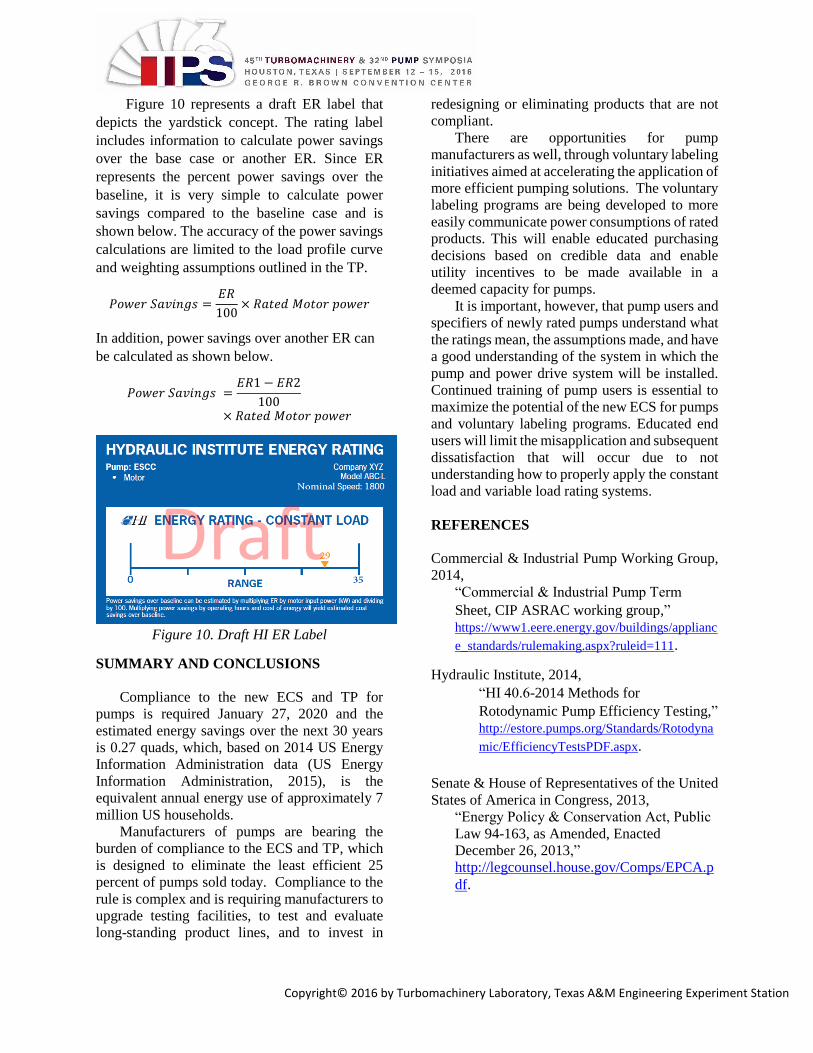
Figure 10 represents a draft ER label that
depicts the yardstick concept. The rating label
includes information to calculate power savings
over the base case or another ER. Since ER
represents the percent power savings over the
baseline, it is very simple to calculate power
savings compared to the baseline case and is
shown below. The accuracy of the power savings
calculations are limited to the load profile curve
and weighting assumptions outlined in the TP.
𝑃𝑜𝑤𝑒𝑟 𝑆𝑎𝑣𝑖𝑛𝑔𝑠 =𝐸𝑅
100× 𝑅𝑎𝑡𝑒𝑑 𝑀𝑜𝑡𝑜𝑟 𝑝𝑜𝑤𝑒𝑟
In addition, power savings over another ER can
be calculated as shown below.
𝑃𝑜𝑤𝑒𝑟 𝑆𝑎𝑣𝑖𝑛𝑔𝑠 =𝐸𝑅1 − 𝐸𝑅2
100
× 𝑅𝑎𝑡𝑒𝑑 𝑀𝑜𝑡𝑜𝑟 𝑝𝑜𝑤𝑒𝑟
Figure 10. Draft HI ER Label
SUMMARY AND CONCLUSIONS
Compliance to the new ECS and TP for
pumps is required January 27, 2020 and the
estimated energy savings over the next 30 years
is 0.27 quads, which, based on 2014 US Energy
Information Administration data (US Energy
Information Administration, 2015), is the
equivalent annual energy use of approximately 7
million US households.
Manufacturers of pumps are bearing the
burden of compliance to the ECS and TP, which
is designed to eliminate the least efficient 25
percent of pumps sold today. Compliance to the
rule is complex and is requiring manufacturers to
upgrade testing facilities, to test and evaluate
long-standing product lines, and to invest in
redesigning or eliminating products that are not
compliant.
There are opportunities for pump
manufacturers as well, through voluntary labeling
initiatives aimed at accelerating the application of
more efficient pumping solutions. The voluntary
labeling programs are being developed to more
easily communicate power consumptions of rated
products. This will enable educated purchasing
decisions based on credible data and enable
utility incentives to be made available in a
deemed capacity for pumps.
It is important, however, that pump users and
specifiers of newly rated pumps understand what
the ratings mean, the assumptions made, and have
a good understanding of the system in which the
pump and power drive system will be installed.
Continued training of pump users is essential to
maximize the potential of the new ECS for pumps
and voluntary labeling programs. Educated end
users will limit the misapplication and subsequent
dissatisfaction that will occur due to not
understanding how to properly apply the constant
load and variable load rating systems.
REFERENCES
Commercial & Industrial Pump Working Group,
2014,
“Commercial & Industrial Pump Term
Sheet, CIP ASRAC working group,”
https://www1.eere.energy.gov/buildings/applianc
e_standards/rulemaking.aspx?ruleid=111.
Hydraulic Institute, 2014,
“HI 40.6-2014 Methods for
Rotodynamic Pump Efficiency Testing,”
http://estore.pumps.org/Standards/Rotodyna
mic/EfficiencyTestsPDF.aspx.
Senate & House of Representatives of the United
States of America in Congress, 2013,
“Energy Policy & Conservation Act, Public
Law 94-163, as Amended, Enacted
December 26, 2013,” http://legcounsel.house.gov/Comps/EPCA.p
df.
Copyright© 2016 by Turbomachinery Laboratory, Texas A&M Engineering Experiment Station
US Department of Energy, 2016a,
“Energy Conservation Standard for Pumps
and their compliance dates,” https://www1.eere.energy.gov/buildings/applianc
e_standards/rulemaking.aspx/ruleid/14.
US Department of Energy, 2016b,
“Appendix A to Subpart Y of Part 431 –
Uniform Test Method for Measurement of
Energy Consumption of Pumps,”
https://www1.eere.energy.gov/buildings/applianc
e_standards/rulemaking.aspx?ruleid=111.
US Department of Energy, 2011,
“Request for Information (RFI) pertaining to
Commercial and Industrial Pumps,” https://www1.eere.energy.gov/buildings/applianc
e_standards/rulemaking.aspx?ruleid=111.
US Department of Energy, 2013a,
“Notice of Intent regarding commercial and
industrial pumps,” https://www1.eere.energy.gov/buildings/applianc
e_standards/rulemaking.aspx?ruleid=111.
US Department of Energy, 2013b,
“Public meeting framework document
regarding commercial & industrial pumps,”
https://www1.eere.energy.gov/buildings/applianc
e_standards/rulemaking.aspx?ruleid=111.
US Department of Energy, 2015,
“Technical Support Document: Energy
Efficiency Program for consumer products
and commercial & industrial equipment,” http://www.regulations.gov/#!documentDetail;D
=EERE-2011-BT-STD-0031-0039.
US Energy Information Administration, 2015,
“Estimate of average US household energy
usage,”
https://www.eia.gov/tools/faqs/faq.cfm?id=97&t=3.