Embed Size (px)
Citation preview
NBER WORKING PAPER SERIES
CHINA’S FDI AND NON-FDI ECONOMIES AND THESUSTAINABILITY OF FUTURE HIGH CHINESE GROWTH
John WhalleyXian Xin
Working Paper 12249http://www.nber.org/papers/w12249
NATIONAL BUREAU OF ECONOMIC RESEARCH1050 Massachusetts Avenue
Cambridge, MA 02138May 2006
We would like to thank James Davies, Kul Bhatia, Xuefeng Mao, and participants at the CIGI and TheEconomic Policy Research Institute (EPRI) China Workshop in the University of Western Ontario, December2005 for helpful comments and suggestions. Email addresses: [email protected] (J. Whalley), [email protected](X. Xin). The views expressed herein are those of the author(s) and do not necessarily reflect the views ofthe National Bureau of Economic Research.
©2006 by John Whalley and Xian Xin. All rights reserved. Short sections of text, not to exceed twoparagraphs, may be quoted without explicit permission provided that full credit, including © notice, is givento the source.
China’s FDI and Non-FDI Economies and the Sustainability of Future High Chinese GrowthJohn Whalley and Xian XinNBER Working Paper No. 12249May 2006JEL No. F43, O40
ABSTRACT
This paper presents assesses of the contribution of inward FDI to China’s recent rapid economicgrowth using a two stage growth accounting approach. Recent econometric literature focuses ontesting whether Chinese growth depends on inward FDI rather than measuring the contribution.Foreign Invested Enterprises (FIEs), often (but not exclusively) are joint ventures between foreigncompanies and Chinese enterprises, and can be thought of as forming a distinctive subpart of theChinese economy. These enterprises account for over 50% of China’s exports and 60% of China’simports. Their share in Chinese GDP has been over 20% in the last two years, but they employ only3% of the workforce, since their average labor productivity exceeds that of Non-FIEs by around 9:1.Their production is more heavily for export rather than the domestic market because FIEs provideaccess to both distribution systems abroad and product design for export markets. Our decompositionresults indicate that China’s FIEs may have contributed over 40% of China’s economic growth in2003 and 2004, and without this inward FDI, China’s overall GDP growth rate could have beenaround 3.4 percentage points lower. We suggest that the sustainability of both China’ export andoverall economic growth may be questionable if inward FDI plateaus in the future.
John WhalleyDepartment of EconomicsSocial Science CentreUniversity of Western OntarioLondon, Ontario N6A 5C2CANADAand [email protected]
Xian XinCenter for Rural Development PolicyCollege of Economics and ManagementChina Agricultural UniversityBeijing, 100094P.R. [email protected]
1
1. Introduction
Since the mid 1980s Chinese GDP growth performance has averaged around 9.3 percent annually
according to official datai. Although the reliability of these estimates has been questioned (see Rawski,
2001; Young, 1997 and 2000), whether this growth performance is sustainable over the next several
decades has been also actively debated both inside and outside China. In this paper, accepting these
estimates as reliable, we assess the part played by inward (and heavily export platform based) FDI since
the early 1990s using a two stage growth accounting decomposition approach. Our results suggest that
the contribution of FDI to growth may have been large and that without inward FDI China’s growth rate
may have been around 3.4 percentage points lower in the last few years. A plateau or decline in inward
FDI in the future could thus significantly lower growth performance in the next few years.
Key to our analysis is to suggest thinking of China’s economy today as comprising two distinct
sub-economies. One involves Foreign Invested Enterprises (FIEs), often joint ventures between foreign
companies supplying FDI, product design, and a sales network abroad and Chinese enterprises
(predominately state-own enterprises, township and village enterprise) supplying land and labor. FIEs
are heavily, but not exclusively, involved in manufacturing activities. The other is the non-FIE part of
the economy in manufacturing, agriculture and services.
These two parts are clearly interlinked to some degree, but they nonetheless stand in sharp contrast
to each other. FIEs employ only a small part of the workforce (24 million out of a workforce of 752
million) and their labor productivity is around 9 times that in the non-FIE sub-economy. FIEs account
for over 50% of exports and 60% of imports. Industrial FIEs account for over 30% of China’s industrial
output. FIEs focused on export typically produce separate and distinct products designed abroad and rely
on the distribution systems of foreign enterprises to sell products in foreign markets. FIEs are also
regionally concentrated in Southern and Eastern China, intensifying inequality from rapid growth.
Under an assumed partition of the economy into these two sub-parts, we extend Solow’s (1957)
growth accounting approach to capture a two stage production structure including both the FIE and
non-FIE parts of the economy. This allows us to decompose China’s growth into that originating from
FDI in the FIE sector and that from the non-FDI/FIE portion of the economy.
The FIE sub-economy is currently growing at around 18%/year, while the non-FDI portion is only
growing at around 5-6%/year. This, in turn, suggests that if FDI inflows plateau (as appears to be the
case for 2005), the sustainability of future Chinese growth in the 7-10% range may be questionable. The
2
absorptive capacity of OECD markets for China’s export volumes may also eventually bound Chinese
growth. In contrast, if FDI inflows continue to grow the dualism we highlight may generate further
increased inequality in China, Thought of in this way, China’s economy seems currently unbalanced, and
perhaps only capable of sustaining growth if these imbalances are addressed. Some of the current
reforms represent a move in this direction, but ultimately the non-FDI portion of the economy seems to
need to be addressed for high growth to continue.
The paper is organized as follows. Section two provides background on China’s inward FDI along
with a brief review of prior literature on the impact of inward FDI on China’s economy. Section three
presents decompositions yielding the contributions of the FDI and non-FDI parts of China’s economy
for GDP growth. Section four discusses the sustainability of China’s growth in light of these results.
2. China’s FDI economy and foreign invested enterprise (FIEs)
2.1 Overview of China’s FDI inflows
FDI inflows into China have increased rapidly over the last two decades. Before 1979, FDI was
prohibited in China, a restriction which was lifted following the adoption of China’s open door policy in
1979, when a new foreign investment law was adopted. In its early stages, FDI was restricted to China’s
Four Special Economic Zones and limited to equity joint ventures. Most of the FDI went into hotel
construction and energy extraction. In 1984, a new foreign investment law was adopted to accelerate
FDI growth and a number of preferential policies were used by both central and local governments to
attract FDI. A sharp increase occurred after 1992 when China reaffirmed policies of openness and
market-oriented reforms introduced earlier.
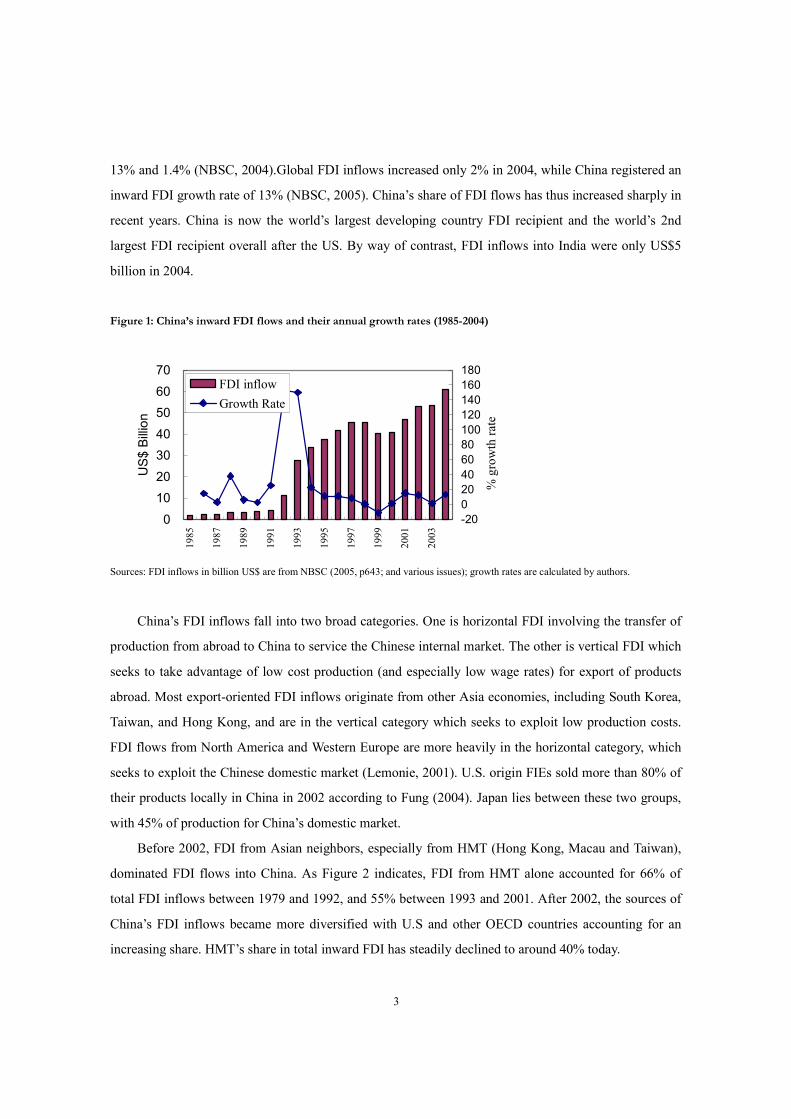
As Figure 1 indicates, growth in China’s inward FDI has been spectacular. In 1985, annual FDI
inflows were less than US$ 2 billion; while in 2004, they were US$ 61 billion, 30 times those of 20
years earlier. Between 1985 and 1991, the annual growth rate of FDI inflows into China was 14%, and
annual FDI inflows during this period remained less than US$ 4.5 billion. FDI inflows increased sharply
to US$ 11 billion in 1992 and again to US$ 28 billion in 1993, with growth rates of over 150% in both
years.
By 1997, China had FDI inflows of US$ 49 billion. Although the late 1990s saw a small decrease in
FDI inflows, the annual growth rate of FDI inflows into China increased again to over 10% after China
joined the WTO in 2001. During the three years 2001, 2002 and 2003, world FDI inflows declined
sharply by 41%, 13% and 12% respectively (UNCTAD, 2005), but China registered FDI growth of 15%,
3
13% and 1.4% (NBSC, 2004).Global FDI inflows increased only 2% in 2004, while China registered an
inward FDI growth rate of 13% (NBSC, 2005). China’s share of FDI flows has thus increased sharply in
recent years. China is now the world’s largest developing country FDI recipient and the world’s 2nd
largest FDI recipient overall after the US. By way of contrast, FDI inflows into India were only US$5
billion in 2004.
Figure 1: China’s inward FDI flows and their annual growth rates (1985-2004)
0
10
20
30
40
50
60
70
1985
1987
1989
1991
1993
1995
1997
1999
2001
2003
US$ Billion
-20
0
20
40
60
80
100
120
140
160
180
% growth rate
FDI inflow
Growth Rate
Sources: FDI inflows in billion US$ are from NBSC (2005, p643; and various issues); growth rates are calculated by authors.
China’s FDI inflows fall into two broad categories. One is horizontal FDI involving the transfer of
production from abroad to China to service the Chinese internal market. The other is vertical FDI which
seeks to take advantage of low cost production (and especially low wage rates) for export of products
abroad. Most export-oriented FDI inflows originate from other Asia economies, including South Korea,
Taiwan, and Hong Kong, and are in the vertical category which seeks to exploit low production costs.
FDI flows from North America and Western Europe are more heavily in the horizontal category, which
seeks to exploit the Chinese domestic market (Lemonie, 2001). U.S. origin FIEs sold more than 80% of
their products locally in China in 2002 according to Fung (2004). Japan lies between these two groups,
with 45% of production for China’s domestic market.
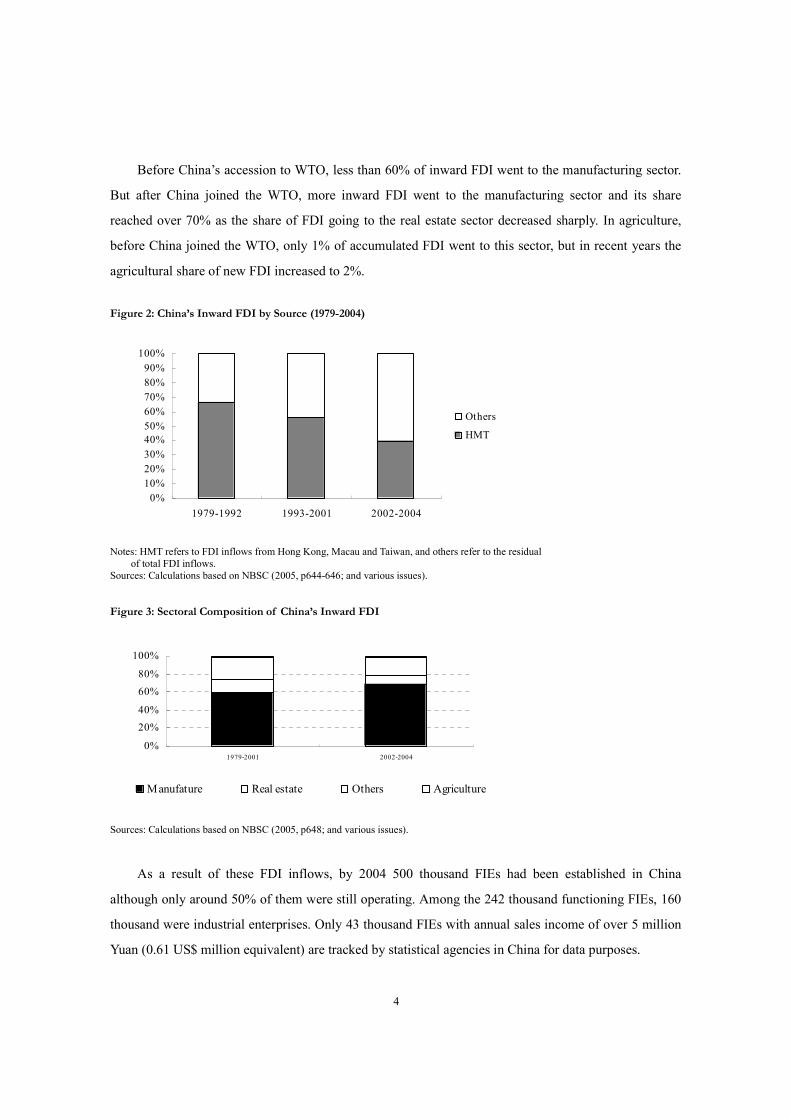
Before 2002, FDI from Asian neighbors, especially from HMT (Hong Kong, Macau and Taiwan),
dominated FDI flows into China. As Figure 2 indicates, FDI from HMT alone accounted for 66% of
total FDI inflows between 1979 and 1992, and 55% between 1993 and 2001. After 2002, the sources of
China’s FDI inflows became more diversified with U.S and other OECD countries accounting for an
increasing share. HMT’s share in total inward FDI has steadily declined to around 40% today.
4
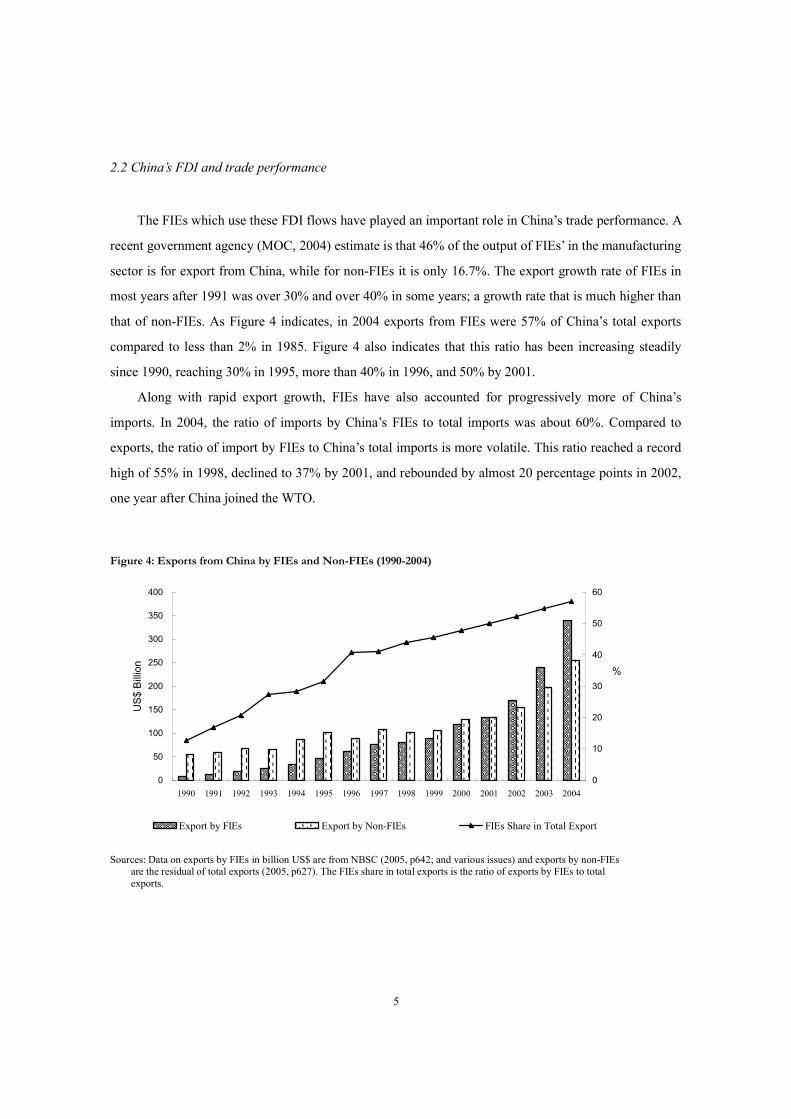
Before China’s accession to WTO, less than 60% of inward FDI went to the manufacturing sector.
But after China joined the WTO, more inward FDI went to the manufacturing sector and its share
reached over 70% as the share of FDI going to the real estate sector decreased sharply. In agriculture,
before China joined the WTO, only 1% of accumulated FDI went to this sector, but in recent years the
agricultural share of new FDI increased to 2%.
Figure 2: China’s Inward FDI by Source (1979-2004)
0%
10%
20%
30%
40%
50%
60%
70%
80%
90%
100%
1979-1992 1993-2001 2002-2004
Others
HMT
Notes: HMT refers to FDI inflows from Hong Kong, Macau and Taiwan, and others refer to the residual
of total FDI inflows. Sources: Calculations based on NBSC (2005, p644-646; and various issues).
Figure 3: Sectoral Composition of China’s Inward FDI
0%
20%
40%
60%
80%
100%
1979-2001 2002-2004
Manufature Real estate Others Agriculture
Sources: Calculations based on NBSC (2005, p648; and various issues).
As a result of these FDI inflows, by 2004 500 thousand FIEs had been established in China
although only around 50% of them were still operating. Among the 242 thousand functioning FIEs, 160
thousand were industrial enterprises. Only 43 thousand FIEs with annual sales income of over 5 million
Yuan (0.61 US$ million equivalent) are tracked by statistical agencies in China for data purposes.
5
2.2 China’s FDI and trade performance
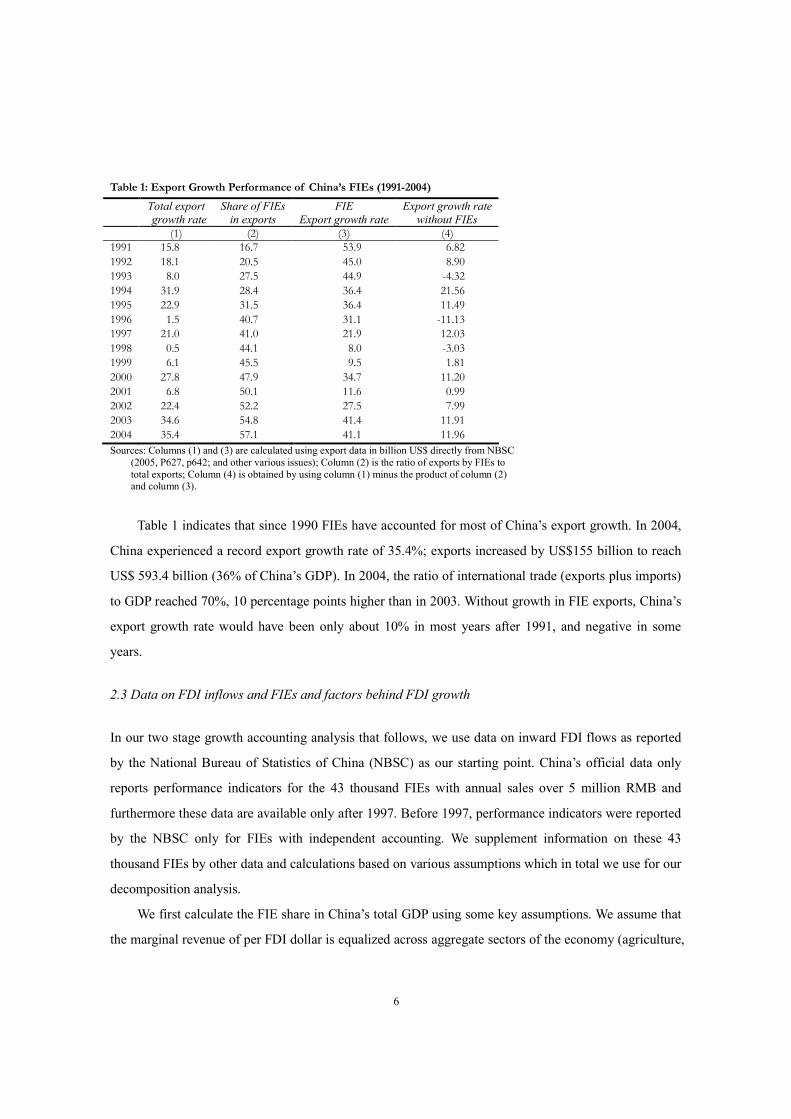
The FIEs which use these FDI flows have played an important role in China’s trade performance. A
recent government agency (MOC, 2004) estimate is that 46% of the output of FIEs’ in the manufacturing
sector is for export from China, while for non-FIEs it is only 16.7%. The export growth rate of FIEs in
most years after 1991 was over 30% and over 40% in some years; a growth rate that is much higher than
that of non-FIEs. As Figure 4 indicates, in 2004 exports from FIEs were 57% of China’s total exports
compared to less than 2% in 1985. Figure 4 also indicates that this ratio has been increasing steadily
since 1990, reaching 30% in 1995, more than 40% in 1996, and 50% by 2001.
Along with rapid export growth, FIEs have also accounted for progressively more of China’s
imports. In 2004, the ratio of imports by China’s FIEs to total imports was about 60%. Compared to
exports, the ratio of import by FIEs to China’s total imports is more volatile. This ratio reached a record
high of 55% in 1998, declined to 37% by 2001, and rebounded by almost 20 percentage points in 2002,
one year after China joined the WTO.
Figure 4: Exports from China by FIEs and Non-FIEs (1990-2004)
0
50
100
150
200
250
300
350
400
1990 1991 1992 1993 1994 1995 1996 1997 1998 1999 2000 2001 2002 2003 2004
US$ Billion
0
10
20
30
40
50
60
%
Export by FIEs Export by Non-FIEs FIEs Share in Total Export
Sources: Data on exports by FIEs in billion US$ are from NBSC (2005, p642; and various issues) and exports by non-FIEs
are the residual of total exports (2005, p627). The FIEs share in total exports is the ratio of exports by FIEs to total exports.
6
Table 1: Export Growth Performance of China’s FIEs (1991-2004)
Total export
growth rate
Share of FIEs
in exports
FIE
Export growth rate
Export growth rate
without FIEs
(1) (2) (3) (4)
1991 15.8 16.7 53.9 6.82
1992 18.1 20.5 45.0 8.90
1993 8.0 27.5 44.9 -4.32
1994 31.9 28.4 36.4 21.56
1995 22.9 31.5 36.4 11.49
1996 1.5 40.7 31.1 -11.13
1997 21.0 41.0 21.9 12.03
1998 0.5 44.1 8.0 -3.03
1999 6.1 45.5 9.5 1.81
2000 27.8 47.9 34.7 11.20
2001 6.8 50.1 11.6 0.99
2002 22.4 52.2 27.5 7.99
2003 34.6 54.8 41.4 11.91
2004 35.4 57.1 41.1 11.96
Sources: Columns (1) and (3) are calculated using export data in billion US$ directly from NBSC (2005, P627, p642; and other various issues); Column (2) is the ratio of exports by FIEs to total exports; Column (4) is obtained by using column (1) minus the product of column (2) and column (3).
Table 1 indicates that since 1990 FIEs have accounted for most of China’s export growth. In 2004,
China experienced a record export growth rate of 35.4%; exports increased by US$155 billion to reach
US$ 593.4 billion (36% of China’s GDP). In 2004, the ratio of international trade (exports plus imports)
to GDP reached 70%, 10 percentage points higher than in 2003. Without growth in FIE exports, China’s
export growth rate would have been only about 10% in most years after 1991, and negative in some
years.
2.3 Data on FDI inflows and FIEs and factors behind FDI growth
In our two stage growth accounting analysis that follows, we use data on inward FDI flows as reported
by the National Bureau of Statistics of China (NBSC) as our starting point. China’s official data only
reports performance indicators for the 43 thousand FIEs with annual sales over 5 million RMB and
furthermore these data are available only after 1997. Before 1997, performance indicators were reported
by the NBSC only for FIEs with independent accounting. We supplement information on these 43
thousand FIEs by other data and calculations based on various assumptions which in total we use for our
decomposition analysis.
We first calculate the FIE share in China’s total GDP using some key assumptions. We assume that
the marginal revenue of per FDI dollar is equalized across aggregate sectors of the economy (agriculture,
7
manufacturing, and services). The share of FIEs in China’s industrial value added can then be estimated
by using value added for FIEs divided by the value added of the industrial sector from NBSC (2005,
p488; and other various issues). We multiply this share by China’s industrial share in total GDP (NBSC,
2005, p52), and then divide by the industrial FDI share in total inward FDI ((NBSC, 2005, p648 and
other various issues) to estimate the FIE share in China’s total GDP. The shares of HMT and FFE
enterprises in China’s total GDP are estimated similarly using data from NBSC (2005, p488; and other
various issues).We separately calculate the GDP share of Foreign Funded Enterprises (FFEs) excluding
FDI from Hong Kong, Macao, and Taiwan from the share of those using FDI originating from Hong
Kong, Macao, and Taiwan FDI (HMT).
Relevant to our discussion is the accuracy of FDI inflow data as reported by the National Bureau of
Statistics China (NBSC) since there are discrepancies between FDI figures as reported by China and by
individual investing countries (UNCTAD, 2005; Gao, 2005; Xiao, 2004). Taking Hong Kong and the
U.S. as examples, UNCTAD (2005) reports FDI inflows from Hong Kong in 2002 of U.S. $ 17.9 billion
by China compared to U.S.$ 15.9 billion reported by Hong Kong; FDI inflows from U.S. in 2002 were
reported by China as U.S.$ 5.4 billion compared to U.S.$ 0.9 billion as reported by the U.S.ii Some
authors raise the possibility that for some investing countries there is under-reporting of FDI in China to
Chinese statistical agencies (UNCTAD, 2005; Gao, 2005). In 2001, FDI inflows from the United
Kingdom were U.S.$ 0.9 billion as reported by China (NBSC), but U.S.$ 1.1 billion reported by the
United Kingdom (UNCTAD, 2005); and in 2000 FDI inflows from Hong Kong were U.S.$ 15.5 billion
as reported by China, and U.S.$ 46.4 billion as reported by Hong Kongiii.
One further issue is the size of the portion of China’s FDI inflows that involve round-trips, namely
FDI originating from Mainland China and returning through Hong Kong (Graham and Wada, 2001;
Dees, 1998). Some estimates suggest that up to 20% of FDI flows seemingly originating from Hong
Kong are in reality round-tripping (Dees, 1998; Harod and Lall, 1993). Xiao (2004) estimated that
China’s overall round-trips FDI ratio is likely to be 40%. FDI inflow data is thus a little problematic;
even though there seems little doubt that that there has been substantial growth in FDI inflows into
China over the last two decades.
Literature discussion of the factors that account for China’s rapid inward FDI growth is also
relevant. Taube and Ogutcu (2002) , Lim (2001) and Tseng and Zebregs (2002) cite such factors as
market size, agglomeration effects, wage costs, fiscal incentives, the business and investment climate,
political/economic stability and political risk, and trade barriers and increasing openness as factors
influencing FDI flows both positively and negatively. Sicular’s (1998) study indicates that structural
8
changes in China’s economy, especially the rapid growth in TVEs, have also contributed to its
attractiveness to foreign investors. Survey data reported by Grub et al (1990) indicates that for U.S.
investments the size of the potential market and cheap labor are the most important determinants. A
survey by the World Bank in 1994, covering 173 Japanese firms investing in China shows market size,
the cost of labor, and FDI policies as the most important determinants (Kawagguchi, 1994).
Other authors stress China’s improved policy environment, and especially preferential policies for
FDI, its large market and its rapid growth rate as the most important determinants (Lim, 2001; Fung,
2002 and 2004; Berthelemy and Demurger, 2000, and Grub et al, 1990). The reduced political role of
SOEs, as the share of non-SOEs in China’s economy has fallen, also tends to generate more inward FDI
flow according to Branstetter and Feenstra (2002). Another factor has been improved convertibility of
domestic currency and the lifting of some mandatory restrictions on repatriation of export earnings.
Convertibility and the repatriation of earnings, as well as mandatory restrictions on local content and
joint ventures were disincentives to early inward FDI flows.
2.4 FIEs, China’s GDP growth, and labor productivity
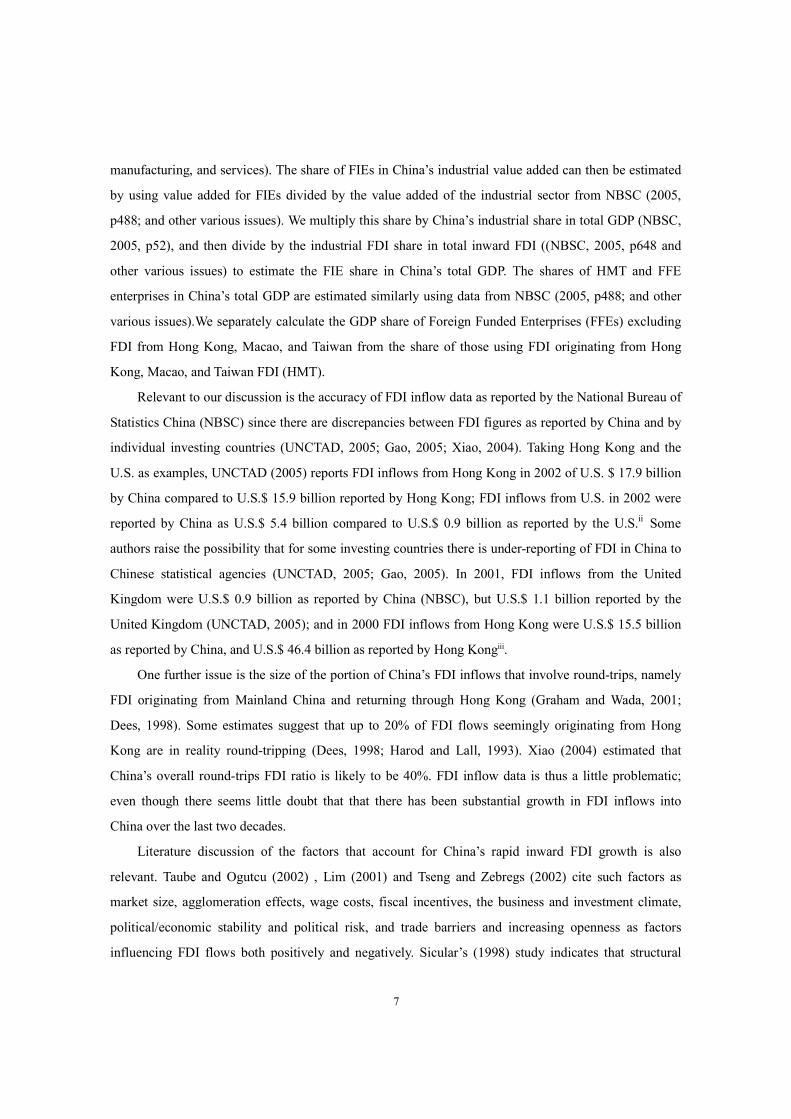
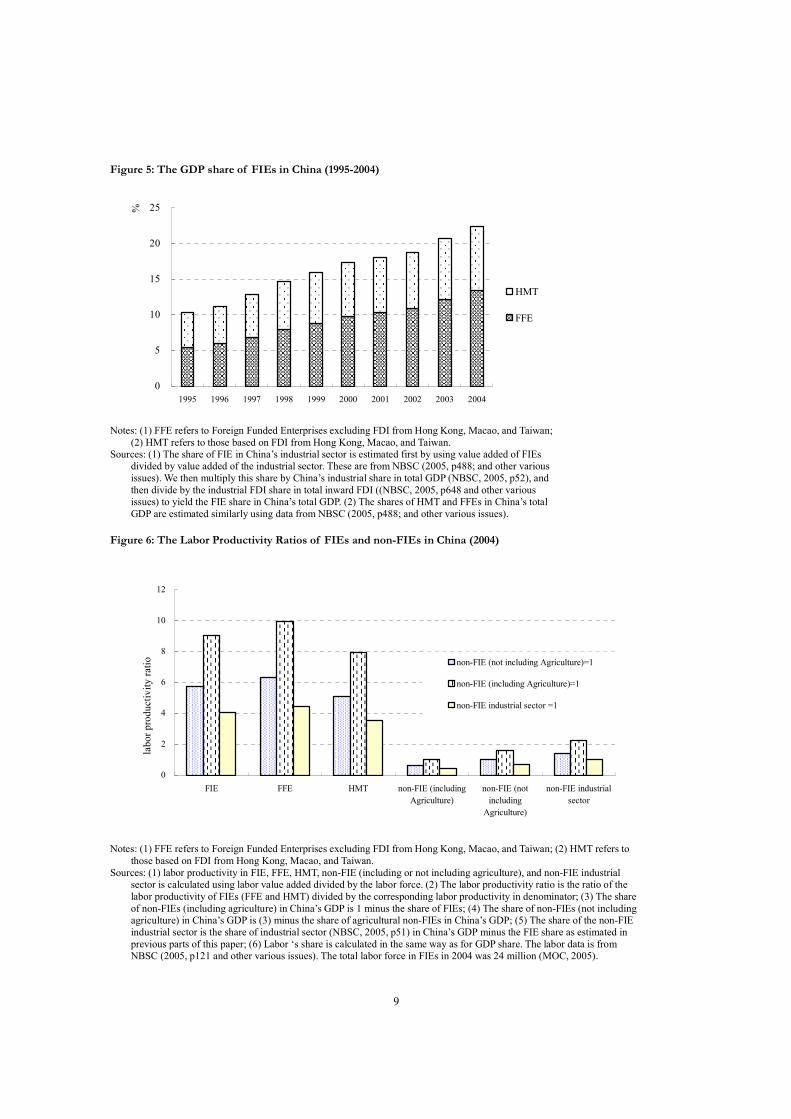
Figure 5 reports the FIE share in China’s economy estimated as above. In 1995, this was around 10%,
and reached over 20% in the last two years. The portion attributable to FDI originally from HMT drops
from 50% in 1995 to around 40% in 2004. Despite these large shares of FIEs in GDP, the FIEs’ share in
total employment is small, with only about 24 million people employed in 2004 (or around 3% of
China’s total labor force) even though total employment in FIEs has been increasing over 15% annually
in recent years. Not surprisingly, labor productivity in FIEs is significantly higher than that of the
non-FIEs since only 3% of labor produces 22% of China’s GDP and over 55% of China’s exports in
2004. The remaining 97% of China’s labor force produces 78% of GDP.
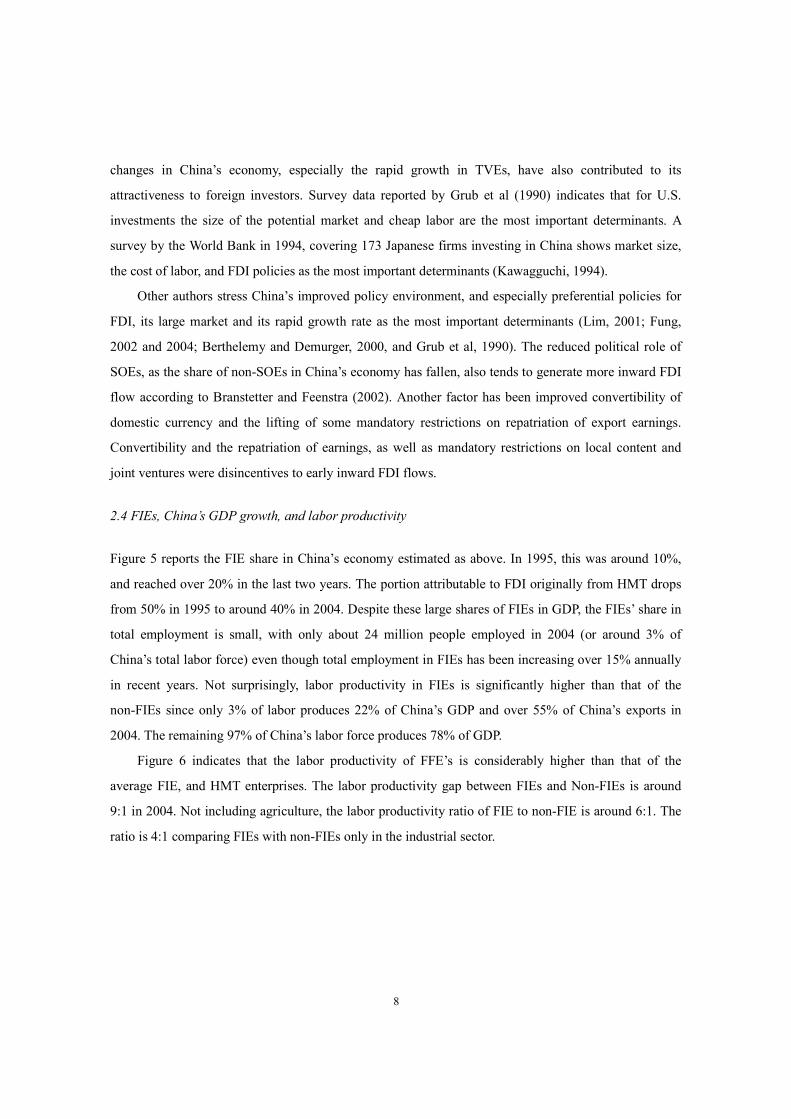
Figure 6 indicates that the labor productivity of FFE’s is considerably higher than that of the
average FIE, and HMT enterprises. The labor productivity gap between FIEs and Non-FIEs is around
9:1 in 2004. Not including agriculture, the labor productivity ratio of FIE to non-FIE is around 6:1. The
ratio is 4:1 comparing FIEs with non-FIEs only in the industrial sector.
9
Figure 5: The GDP share of FIEs in China (1995-2004)
0
5
10
15
20
25
1995 1996 1997 1998 1999 2000 2001 2002 2003 2004
%
HMT
FFE
Notes: (1) FFE refers to Foreign Funded Enterprises excluding FDI from Hong Kong, Macao, and Taiwan;
(2) HMT refers to those based on FDI from Hong Kong, Macao, and Taiwan. Sources: (1) The share of FIE in China’s industrial sector is estimated first by using value added of FIEs
divided by value added of the industrial sector. These are from NBSC (2005, p488; and other various issues). We then multiply this share by China’s industrial share in total GDP (NBSC, 2005, p52), and then divide by the industrial FDI share in total inward FDI ((NBSC, 2005, p648 and other various issues) to yield the FIE share in China’s total GDP. (2) The shares of HMT and FFEs in China’s total GDP are estimated similarly using data from NBSC (2005, p488; and other various issues).
Figure 6: The Labor Productivity Ratios of FIEs and non-FIEs in China (2004)
0
2
4
6
8
10
12
FIE FFE HMT non-FIE (including
Agriculture)
non-FIE (not
including
Agriculture)
non-FIE industrial
sector
labor productivity ratio non-FIE (not including Agriculture)=1
non-FIE (including Agriculture)=1
non-FIE industrial sector =1
Notes: (1) FFE refers to Foreign Funded Enterprises excluding FDI from Hong Kong, Macao, and Taiwan; (2) HMT refers to those based on FDI from Hong Kong, Macao, and Taiwan.
Sources: (1) labor productivity in FIE, FFE, HMT, non-FIE (including or not including agriculture), and non-FIE industrial sector is calculated using labor value added divided by the labor force. (2) The labor productivity ratio is the ratio of the labor productivity of FIEs (FFE and HMT) divided by the corresponding labor productivity in denominator; (3) The share of non-FIEs (including agriculture) in China’s GDP is 1 minus the share of FIEs; (4) The share of non-FIEs (not including agriculture) in China’s GDP is (3) minus the share of agricultural non-FIEs in China’s GDP; (5) The share of the non-FIE industrial sector is the share of industrial sector (NBSC, 2005, p51) in China’s GDP minus the FIE share as estimated in previous parts of this paper; (6) Labor ‘s share is calculated in the same way as for GDP share. The labor data is from NBSC (2005, p121 and other various issues). The total labor force in FIEs in 2004 was 24 million (MOC, 2005).
10
2.5 Literature on the impact of FDI/FIEs on China’s economy
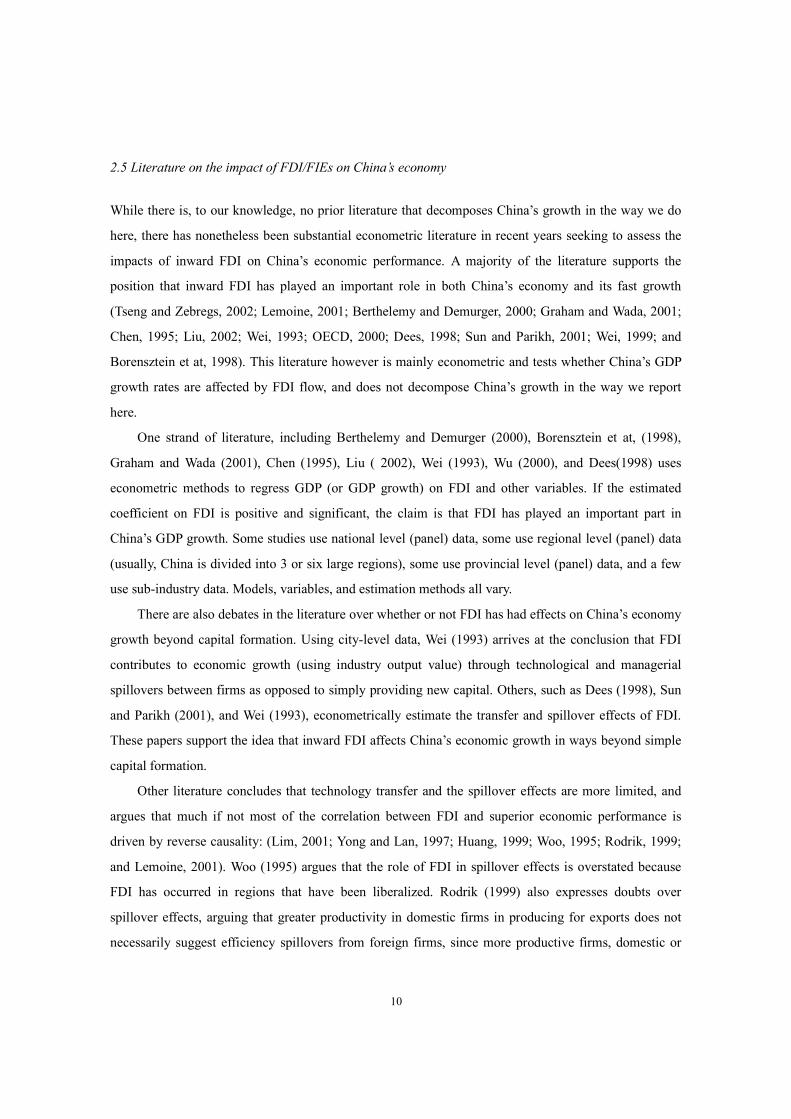
While there is, to our knowledge, no prior literature that decomposes China’s growth in the way we do
here, there has nonetheless been substantial econometric literature in recent years seeking to assess the
impacts of inward FDI on China’s economic performance. A majority of the literature supports the
position that inward FDI has played an important role in both China’s economy and its fast growth
(Tseng and Zebregs, 2002; Lemoine, 2001; Berthelemy and Demurger, 2000; Graham and Wada, 2001;
Chen, 1995; Liu, 2002; Wei, 1993; OECD, 2000; Dees, 1998; Sun and Parikh, 2001; Wei, 1999; and
Borensztein et at, 1998). This literature however is mainly econometric and tests whether China’s GDP
growth rates are affected by FDI flow, and does not decompose China’s growth in the way we report
here.
One strand of literature, including Berthelemy and Demurger (2000), Borensztein et at, (1998),
Graham and Wada (2001), Chen (1995), Liu ( 2002), Wei (1993), Wu (2000), and Dees(1998) uses
econometric methods to regress GDP (or GDP growth) on FDI and other variables. If the estimated
coefficient on FDI is positive and significant, the claim is that FDI has played an important part in
China’s GDP growth. Some studies use national level (panel) data, some use regional level (panel) data
(usually, China is divided into 3 or six large regions), some use provincial level (panel) data, and a few
use sub-industry data. Models, variables, and estimation methods all vary.
There are also debates in the literature over whether or not FDI has had effects on China’s economy
growth beyond capital formation. Using city-level data, Wei (1993) arrives at the conclusion that FDI
contributes to economic growth (using industry output value) through technological and managerial
spillovers between firms as opposed to simply providing new capital. Others, such as Dees (1998), Sun
and Parikh (2001), and Wei (1993), econometrically estimate the transfer and spillover effects of FDI.
These papers support the idea that inward FDI affects China’s economic growth in ways beyond simple
capital formation.
Other literature concludes that technology transfer and the spillover effects are more limited, and
argues that much if not most of the correlation between FDI and superior economic performance is
driven by reverse causality: (Lim, 2001; Yong and Lan, 1997; Huang, 1999; Woo, 1995; Rodrik, 1999;
and Lemoine, 2001). Woo (1995) argues that the role of FDI in spillover effects is overstated because
FDI has occurred in regions that have been liberalized. Rodrik (1999) also expresses doubts over
spillover effects, arguing that greater productivity in domestic firms in producing for exports does not
necessarily suggest efficiency spillovers from foreign firms, since more productive firms, domestic or
11
foreign, tend to locate in export sectors.
3. China’s growth performance and the FDI and non-FDI economies
To determine the portion of China’s growth which can be attributed to FDI inflows, as distinct from
econometrically test whether FDI flows play a significant role in China’s growth, we use an extension of
the growth accounting approach long associated with Solow (1957) and Dennison (1967). In this earlier
literature, an aggregate production function is assumed of the form,
))(),(()()( tLtKFtAtY = (1)
where capital (K(t)) and labor (L(t)) are the inputs in aggregate production in period t, technical progress
is disembodied and Hicksian neutral and reflected in the term A(t), and Y(t) is output.
Taking a total derivative through the production function and yields the well-known Solow growth
accounting equation,
L
LS
K
KS
A
A
Y
YLK
&&&&
++= (2)
where Y& , A& , K& and L& are time derivatives, and kS and
LS are shares of capital and labor.
Solow’s original purpose was to investigate the contribution of technical progress relative to factor
accumulation in U.S. long term growth, which he put at 87.5% of growth. Dennison (1967) later used
Solow’s framework to explore the factors explaining why growth rates differed across OECD counties
and Jorgenson and Griliches (1967) investigated the role of embodied technical progress on growth,
concluding it was substantial. Young (1995) later used this growth accounting approach to analyze
growth experiences more broadly in Asia, finding that the higher growth in the newly industrializing
countries of east Asia was not due to rapid technological progress and other factors affecting the Solow
residual, but rather capital accumulation. The Solow framework has recently been extended to open
economies by Kohli (2003a and 2003b) to capture terms of trade effects in growth performance of open
economies.
Here we extend the original Solow framework in a different way by using a two stage production
growth accounting approach. Following trade literature (see Dixit and Norman, 1980), we first write a
GDP function in which the outputs of the FIE and non-FIE portions of the Chinese economy discussed
earlier aggregate to yield GDP,
))(),(()( tNFIEtFIEgtO = (3)
12
where O(t) refers to aggregate output, and FIE(t) and NFIE(t) are outputs of the FIE and non-FIE
portions of the economy.
In the second stage we use separate production functions for each sector,
))(),(()()( tLtFDIftAtFIE FF= (4)
))(),(()()( tLtKhtAtNFIE NN= (5)
where )(tAF and )(tAN are the Hichsian neutral technical change terms, )(tLF and )(tLN are the
labor inputs used in the FIE and non-FIE parts of the economy, FDI(t) and K(t) are the stocks of
accumulated FDI and capital used in the FIE and non-FIE parts of the economy. We make the strong
assumption that foreign supplied capital (FDI) is the only non-labor input in the FIE portion of the
economy. .
Taking time derivatives through (4) and (5) yields,
F
FF
L
F
FDIF
F
L
LS
FDI
FDIS
A
A
FIE
FIE••••
++= (6)
and, N
NN
L
N
KN
N
L
LS
K
KS
A
A
NFIE
NFIE••••
++= (7)
where F
LS and F
FDIS are the shares of labor and FDI in FIE production and N
LS and N
KS are the shares
of labor and capital in non-FIE production.
The economy wide growth accounting equation for this two stage production structure can thus be
expressed as,
)()(N
NN
L
N
KN
NN
F
FF
L
F
FDIF
FF
L
LS
K
KS
A
Ag
L
LS
FDI
FDIS
A
Ag
O
O•••••••
+++++= (8)
where Fg and Ng are shares of FIE and non-FIE output in the GDP function. If (3), (4), and (5)
are Cobb Douglas, then the associated share parameters are constant. If (3), (4), and (5) are CES then the
share parameters in (8) change over time. The role of changing shares where rates of factor
accumulation differ significantly by factor was stressed by Weitzman (1970) in his application of Solow
growth accounting to Soviet post war growth.
For the FIE part of the economy we can also decompose this into FFE and HMT sub-parts since the
FFE share is increasing relative to that of HMT enterprises. In this case, (8) becomes
13
)(
)()(
N
NN
L
N
KN
NN
HMT
HMTHMT
LHMT
HMTHMT
FDIHMT
HMTHMT
FFE
FFEFFE
LFFE
FFEFFE
FDIFFE
FFEFFE
L
LS
K
KS
A
Ag
L
LS
FDI
FDIS
A
Ag
L
LS
FDI
FDIS
A
Ag
O
O
&&
&&&&
+++
+++++=
•
•••
(9)
In our decompositions, the parameter Fg is estimated using the methods set out in section 2.4
above. The parameter Ng can then be obtained by residual since the sum of Fg and Ng is one. The
labor share parameters, F
LS and N
LS in FIE and non-FIE production functions are estimated using the
labor force wage bill divided by value added for the two parts of the economy, and F
FDIS and N
KS are
obtained by residual. The wage bill of FIEs is estimated by multiplying wage rate (NBSC, 2005, p174)
and labor force data (NSBC, p506, p121). The wage bill of non-FIEs is China’s total labor
remunerationiv (NBSC, 2005, p62; and other various years) minus the FIE wage bill. Data on China’s
labor force is from NBSC (2005, p118) and the labor force in non-FIEs is taken to be the total labor
force minus that in FIEs.
To determine the capital stock and growth variables, we first estimate the Chinese total capital
stock along with the FIE capital stock as accumulated FDI net of depreciation. We use the total capital
stock minus the FDI stock as our estimate of the non-FIE capital stock.
The Chinese capital stock is obtained by firstly deflating annual capital formation data using a fixed
investment price index NSBC (2005, p301)v. A depreciation rate of 0.04, similar to that used by Chow
(1993 and 2003), is assumed for the depreciation of the annual capital stock after 1985. Before 1985, a
depreciation factor of 0.10 is used instead to account for outmoded fixed equipment. Annual capital
formation is from the World Bank database (WB, 2005) in US$.
The resulting growth rates of variables from 1995 to 2004, along with the estimated share
parameters are reported in Table 2. Labor force, wage rates and annual FDI inflows for FFE and HMT
data are from NBSC (2005, p121, p174, p506, p644-646; and other various issues). Corresponding
parameters and growth rate variables for FFEs and HMTs are listed in Table 3.
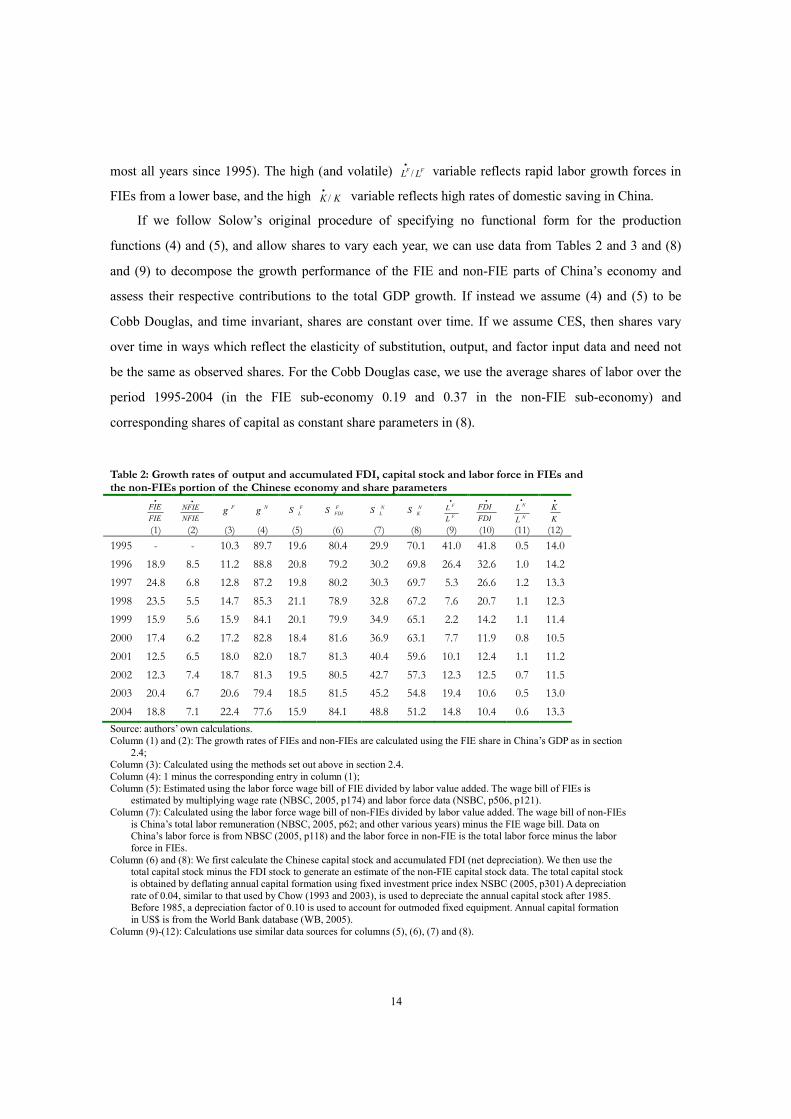
These data indicate that while FIEs produce one fifth of China’s total GDP, the FIE subpart of the
Chinese economy grew three times faster than the non-FIE portion between 1995 and 2004,
considerably faster than China’s economy as a whole. In the last two years (2003 and 2004), over 40%
of China’s growth comes from FIEs and in the last decade (from 1995 to 2004), over 30% of China’s
economic growth.
A striking feature of these data is the high capital share in the non-FIE portion of the economy
(declining from 70% to only 50% in 2004), and the even higher share of FDI in FIE output (over 80% in
14
most all years since 1995). The high (and volatile) FF LL /•
variable reflects rapid labor growth forces in
FIEs from a lower base, and the high KK /•
variable reflects high rates of domestic saving in China.
If we follow Solow’s original procedure of specifying no functional form for the production
functions (4) and (5), and allow shares to vary each year, we can use data from Tables 2 and 3 and (8)
and (9) to decompose the growth performance of the FIE and non-FIE parts of China’s economy and
assess their respective contributions to the total GDP growth. If instead we assume (4) and (5) to be
Cobb Douglas, and time invariant, shares are constant over time. If we assume CES, then shares vary
over time in ways which reflect the elasticity of substitution, output, and factor input data and need not
be the same as observed shares. For the Cobb Douglas case, we use the average shares of labor over the
period 1995-2004 (in the FIE sub-economy 0.19 and 0.37 in the non-FIE sub-economy) and
corresponding shares of capital as constant share parameters in (8).
Table 2: Growth rates of output and accumulated FDI, capital stock and labor force in FIEs and the non-FIEs portion of the Chinese economy and share parameters
FIE
FIE•
NFIE
NFIE• Fg Ng F
LS F
FDIS N
LS N
KS F
F
L
L•
FDI
FDI•
N
N
L
L•
K
K•
(1) (2) (3) (4) (5) (6) (7) (8) (9) (10) (11) (12)
1995 - - 10.3 89.7 19.6 80.4 29.9 70.1 41.0 41.8 0.5 14.0
1996 18.9 8.5 11.2 88.8 20.8 79.2 30.2 69.8 26.4 32.6 1.0 14.2
1997 24.8 6.8 12.8 87.2 19.8 80.2 30.3 69.7 5.3 26.6 1.2 13.3
1998 23.5 5.5 14.7 85.3 21.1 78.9 32.8 67.2 7.6 20.7 1.1 12.3
1999 15.9 5.6 15.9 84.1 20.1 79.9 34.9 65.1 2.2 14.2 1.1 11.4
2000 17.4 6.2 17.2 82.8 18.4 81.6 36.9 63.1 7.7 11.9 0.8 10.5
2001 12.5 6.5 18.0 82.0 18.7 81.3 40.4 59.6 10.1 12.4 1.1 11.2
2002 12.3 7.4 18.7 81.3 19.5 80.5 42.7 57.3 12.3 12.5 0.7 11.5
2003 20.4 6.7 20.6 79.4 18.5 81.5 45.2 54.8 19.4 10.6 0.5 13.0
2004 18.8 7.1 22.4 77.6 15.9 84.1 48.8 51.2 14.8 10.4 0.6 13.3
Source: authors’ own calculations. Column (1) and (2): The growth rates of FIEs and non-FIEs are calculated using the FIE share in China’s GDP as in section
2.4; Column (3): Calculated using the methods set out above in section 2.4. Column (4): 1 minus the corresponding entry in column (1); Column (5): Estimated using the labor force wage bill of FIE divided by labor value added. The wage bill of FIEs is
estimated by multiplying wage rate (NBSC, 2005, p174) and labor force data (NSBC, p506, p121). Column (7): Calculated using the labor force wage bill of non-FIEs divided by labor value added. The wage bill of non-FIEs
is China’s total labor remuneration (NBSC, 2005, p62; and other various years) minus the FIE wage bill. Data on China’s labor force is from NBSC (2005, p118) and the labor force in non-FIE is the total labor force minus the labor force in FIEs.
Column (6) and (8): We first calculate the Chinese capital stock and accumulated FDI (net depreciation). We then use the total capital stock minus the FDI stock to generate an estimate of the non-FIE capital stock data. The total capital stock is obtained by deflating annual capital formation using fixed investment price index NSBC (2005, p301) A depreciation rate of 0.04, similar to that used by Chow (1993 and 2003), is used to depreciate the annual capital stock after 1985. Before 1985, a depreciation factor of 0.10 is used to account for outmoded fixed equipment. Annual capital formation in US$ is from the World Bank database (WB, 2005).
Column (9)-(12): Calculations use similar data sources for columns (5), (6), (7) and (8).
15
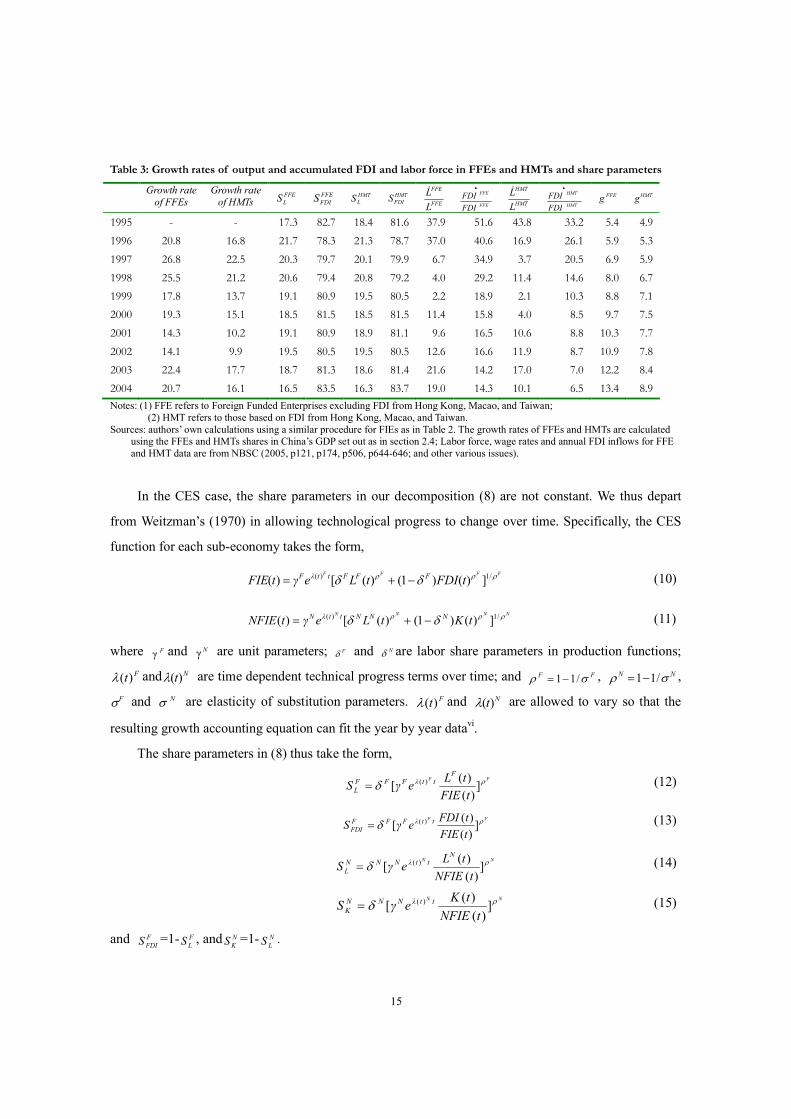
Table 3: Growth rates of output and accumulated FDI and labor force in FFEs and HMTs and share parameters
Growth rate
of FFEs
Growth rate
of HMTs FFE
LS FFE
FDIS HMT
LS HMT
FDIS FFE
FFE
L
L& FFE
FFE
FDI
FDI•
HMT
HMT
L
L& HMT
HMT
FDI
FDI•
FFEg HMTg
1995 - - 17.3 82.7 18.4 81.6 37.9 51.6 43.8 33.2 5.4 4.9
1996 20.8 16.8 21.7 78.3 21.3 78.7 37.0 40.6 16.9 26.1 5.9 5.3
1997 26.8 22.5 20.3 79.7 20.1 79.9 6.7 34.9 3.7 20.5 6.9 5.9
1998 25.5 21.2 20.6 79.4 20.8 79.2 4.0 29.2 11.4 14.6 8.0 6.7
1999 17.8 13.7 19.1 80.9 19.5 80.5 2.2 18.9 2.1 10.3 8.8 7.1
2000 19.3 15.1 18.5 81.5 18.5 81.5 11.4 15.8 4.0 8.5 9.7 7.5
2001 14.3 10.2 19.1 80.9 18.9 81.1 9.6 16.5 10.6 8.8 10.3 7.7
2002 14.1 9.9 19.5 80.5 19.5 80.5 12.6 16.6 11.9 8.7 10.9 7.8
2003 22.4 17.7 18.7 81.3 18.6 81.4 21.6 14.2 17.0 7.0 12.2 8.4
2004 20.7 16.1 16.5 83.5 16.3 83.7 19.0 14.3 10.1 6.5 13.4 8.9
Notes: (1) FFE refers to Foreign Funded Enterprises excluding FDI from Hong Kong, Macao, and Taiwan; (2) HMT refers to those based on FDI from Hong Kong, Macao, and Taiwan.
Sources: authors’ own calculations using a similar procedure for FIEs as in Table 2. The growth rates of FFEs and HMTs are calculated using the FFEs and HMTs shares in China’s GDP set out as in section 2.4; Labor force, wage rates and annual FDI inflows for FFE and HMT data are from NBSC (2005, p121, p174, p506, p644-646; and other various issues).
In the CES case, the share parameters in our decomposition (8) are not constant. We thus depart
from Weitzman’s (1970) in allowing technological progress to change over time. Specifically, the CES
function for each sub-economy takes the form,
FFFF
tFDItLeγtFIE FFFttλF ρρρ δδ /1)( ])()1()([)( −+= (10)
NNNN
tKtLeγtNFIE NNNttλN ρρρ δδ /1)( ])()1()([)( −+= (11)
where Fγ and Nγ are unit parameters; Fδ and Nδ are labor share parameters in production functions;
Ft)(λ and Nt)(λ are time dependent technical progress terms over time; and FF σρ /11−= , NN σρ /11−= ,
Fσ and Nσ are elasticity of substitution parameters. Ft)(λ and Nt)(λ are allowed to vary so that the
resulting growth accounting equation can fit the year by year datavi.
The share parameters in (8) thus take the form,
FF
tFIE
tLeγS
FttλFFF
L
ρδ ])(
)([ )(= (12)
FF
tFIE
tFDIeγS ttλFFF
FDI
ρδ ])(
)([ )(= (13)
NN
tNFIE
tLeγS
NttλNNN
L
ρδ ])(
)([ )(= (14)
NN
tNFIE
tKeγS ttλNNN
K
ρδ ])(
)([ )(= (15)
and F
FDIS =1- F
LS , and N
KS =1- N
LS .
16
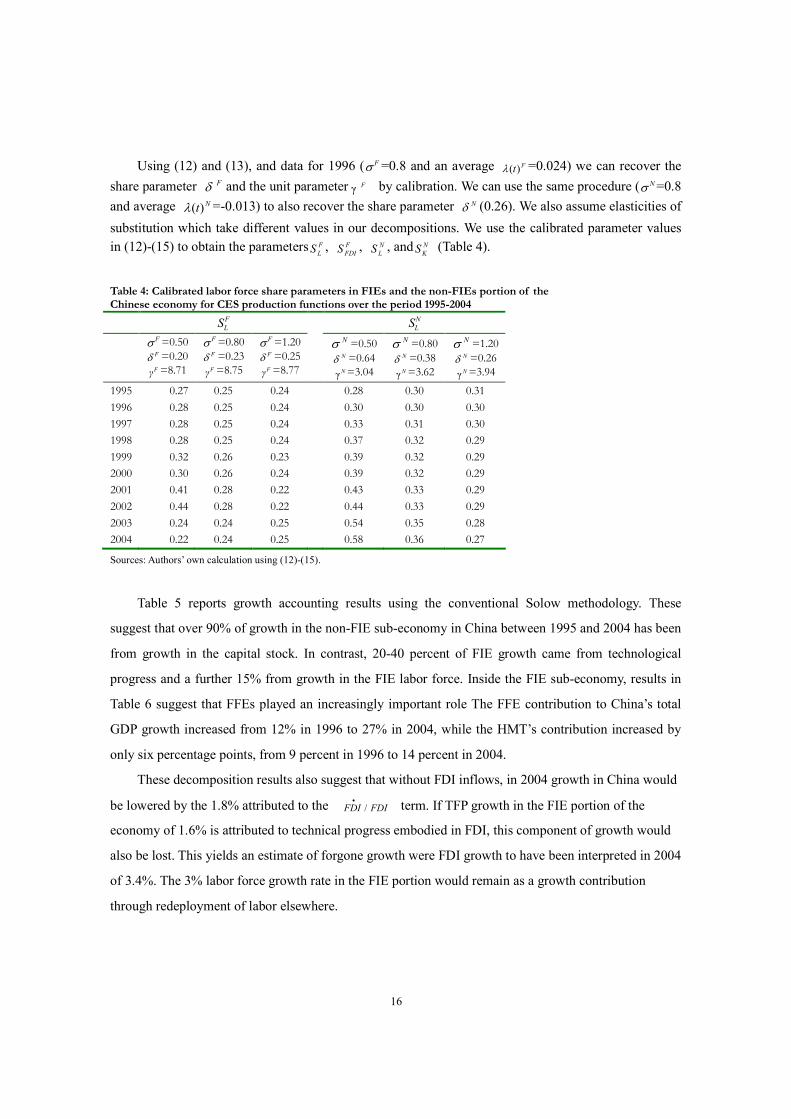
Using (12) and (13), and data for 1996 ( Fσ =0.8 and an average Ft)(λ =0.024) we can recover the
share parameter Fδ and the unit parameter Fγ by calibration. We can use the same procedure ( Nσ =0.8
and average Nt)(λ =-0.013) to also recover the share parameter Nδ (0.26). We also assume elasticities of
substitution which take different values in our decompositions. We use the calibrated parameter values
in (12)-(15) to obtain the parameters F
LS , F
FDIS , N
LS , and N
KS (Table 4).
Table 4: Calibrated labor force share parameters in FIEs and the non-FIEs portion of the Chinese economy for CES production functions over the period 1995-2004
F
LS N
LS
Fσ =0.50 Fδ =0.20 Fγ =8.71
Fσ =0.80 Fδ =0.23 Fγ =8.75
Fσ =1.20 Fδ =0.25 Fγ =8.77
Nσ =0.50 Nδ =0.64 Nγ =3.04
Nσ =0.80 Nδ =0.38 Nγ =3.62
Nσ =1.20 Nδ =0.26 Nγ =3.94
1995 0.27 0.25 0.24 0.28 0.30 0.31
1996 0.28 0.25 0.24 0.30 0.30 0.30
1997 0.28 0.25 0.24 0.33 0.31 0.30
1998 0.28 0.25 0.24 0.37 0.32 0.29
1999 0.32 0.26 0.23 0.39 0.32 0.29
2000 0.30 0.26 0.24 0.39 0.32 0.29
2001 0.41 0.28 0.22 0.43 0.33 0.29
2002 0.44 0.28 0.22 0.44 0.33 0.29
2003 0.24 0.24 0.25 0.54 0.35 0.28
2004 0.22 0.24 0.25 0.58 0.36 0.27
Sources: Authors’ own calculation using (12)-(15).
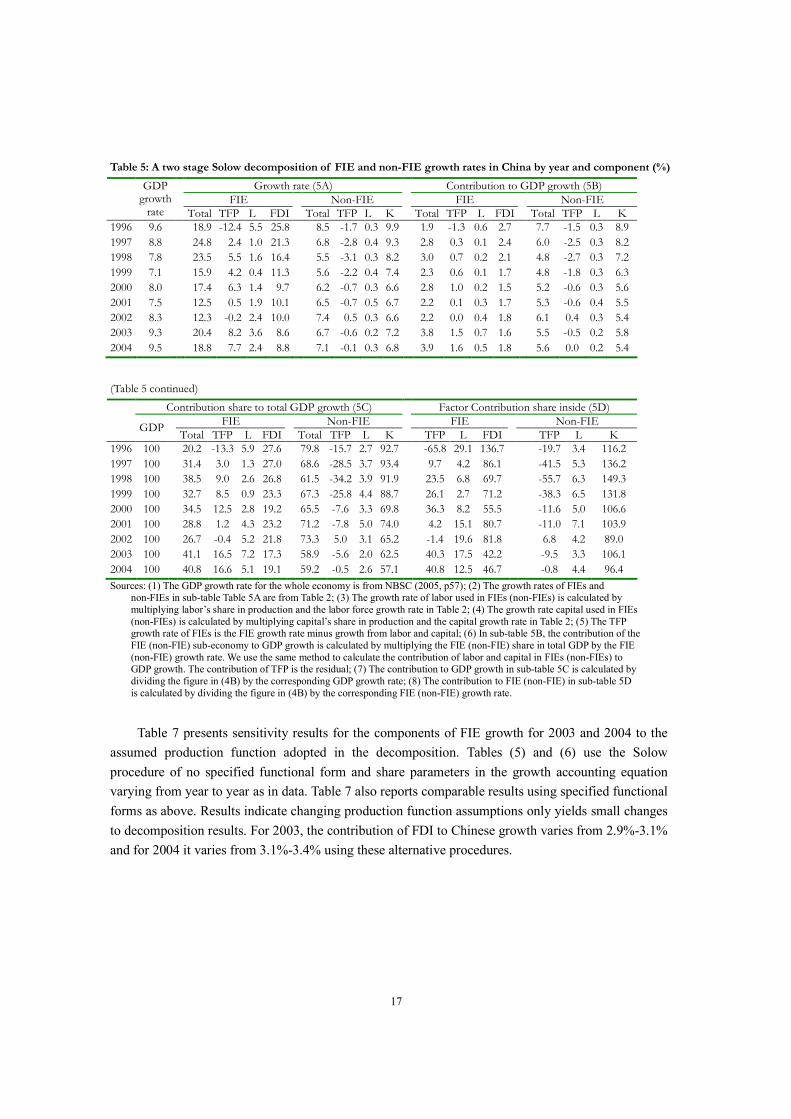
Table 5 reports growth accounting results using the conventional Solow methodology. These
suggest that over 90% of growth in the non-FIE sub-economy in China between 1995 and 2004 has been
from growth in the capital stock. In contrast, 20-40 percent of FIE growth came from technological
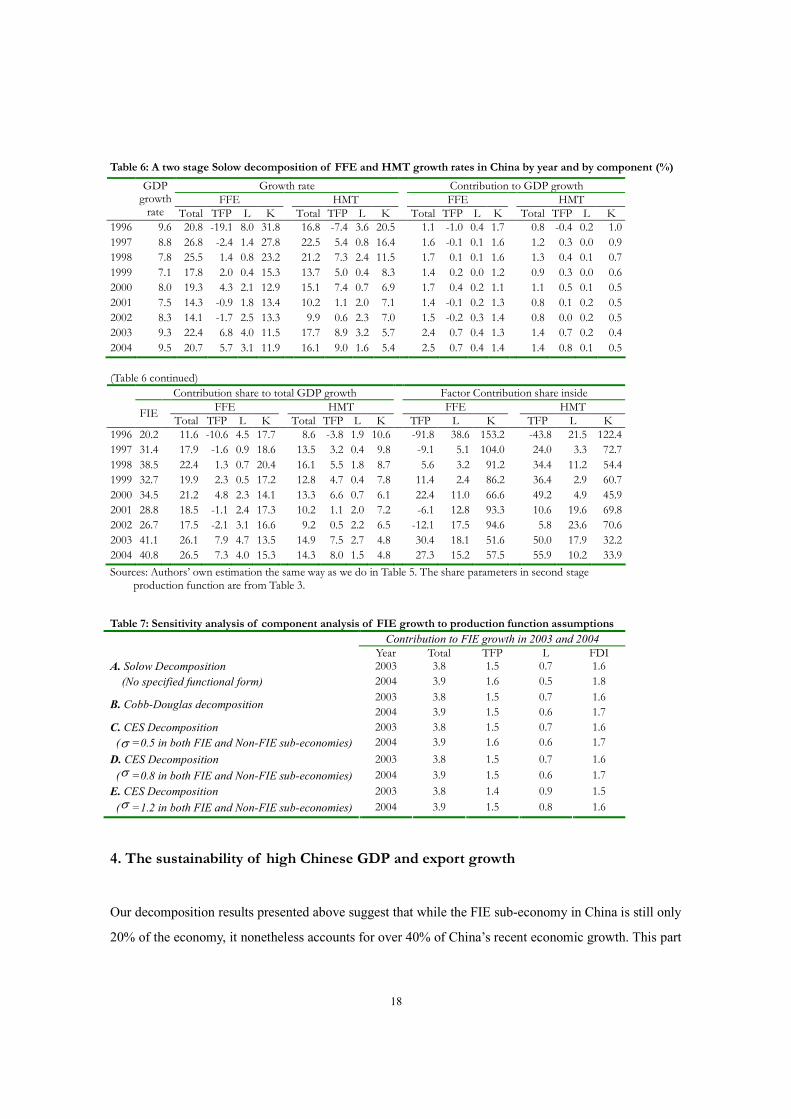
progress and a further 15% from growth in the FIE labor force. Inside the FIE sub-economy, results in
Table 6 suggest that FFEs played an increasingly important role The FFE contribution to China’s total
GDP growth increased from 12% in 1996 to 27% in 2004, while the HMT’s contribution increased by
only six percentage points, from 9 percent in 1996 to 14 percent in 2004.
These decomposition results also suggest that without FDI inflows, in 2004 growth in China would
be lowered by the 1.8% attributed to the FDIFDI /•
term. If TFP growth in the FIE portion of the
economy of 1.6% is attributed to technical progress embodied in FDI, this component of growth would
also be lost. This yields an estimate of forgone growth were FDI growth to have been interpreted in 2004
of 3.4%. The 3% labor force growth rate in the FIE portion would remain as a growth contribution
through redeployment of labor elsewhere.
17
Table 5: A two stage Solow decomposition of FIE and non-FIE growth rates in China by year and component (%)
Growth rate (5A) Contribution to GDP growth (5B)
FIE Non-FIE FIE Non-FIE
GDP growth rate
Total TFP L FDI
Total TFP L K
Total TFP L FDI
Total TFP L K
1996 9.6 18.9 -12.4 5.5 25.8 8.5 -1.7 0.3 9.9 1.9 -1.3 0.6 2.7 7.7 -1.5 0.3 8.9
1997 8.8 24.8 2.4 1.0 21.3 6.8 -2.8 0.4 9.3 2.8 0.3 0.1 2.4 6.0 -2.5 0.3 8.2
1998 7.8 23.5 5.5 1.6 16.4 5.5 -3.1 0.3 8.2 3.0 0.7 0.2 2.1 4.8 -2.7 0.3 7.2
1999 7.1 15.9 4.2 0.4 11.3 5.6 -2.2 0.4 7.4 2.3 0.6 0.1 1.7 4.8 -1.8 0.3 6.3
2000 8.0 17.4 6.3 1.4 9.7 6.2 -0.7 0.3 6.6 2.8 1.0 0.2 1.5 5.2 -0.6 0.3 5.6
2001 7.5 12.5 0.5 1.9 10.1 6.5 -0.7 0.5 6.7 2.2 0.1 0.3 1.7 5.3 -0.6 0.4 5.5
2002 8.3 12.3 -0.2 2.4 10.0 7.4 0.5 0.3 6.6 2.2 0.0 0.4 1.8 6.1 0.4 0.3 5.4
2003 9.3 20.4 8.2 3.6 8.6 6.7 -0.6 0.2 7.2 3.8 1.5 0.7 1.6 5.5 -0.5 0.2 5.8
2004 9.5 18.8 7.7 2.4 8.8 7.1 -0.1 0.3 6.8 3.9 1.6 0.5 1.8 5.6 0.0 0.2 5.4
(Table 5 continued)
Contribution share to total GDP growth (5C) Factor Contribution share inside (5D)
FIE Non-FIE FIE Non-FIE
GDP Total TFP L FDI
Total TFP L K
TFP L FDI
TFP L K
1996 100 20.2 -13.3 5.9 27.6 79.8 -15.7 2.7 92.7 -65.8 29.1 136.7 -19.7 3.4 116.2
1997 100 31.4 3.0 1.3 27.0 68.6 -28.5 3.7 93.4 9.7 4.2 86.1 -41.5 5.3 136.2
1998 100 38.5 9.0 2.6 26.8 61.5 -34.2 3.9 91.9 23.5 6.8 69.7 -55.7 6.3 149.3
1999 100 32.7 8.5 0.9 23.3 67.3 -25.8 4.4 88.7 26.1 2.7 71.2 -38.3 6.5 131.8
2000 100 34.5 12.5 2.8 19.2 65.5 -7.6 3.3 69.8 36.3 8.2 55.5 -11.6 5.0 106.6
2001 100 28.8 1.2 4.3 23.2 71.2 -7.8 5.0 74.0 4.2 15.1 80.7 -11.0 7.1 103.9
2002 100 26.7 -0.4 5.2 21.8 73.3 5.0 3.1 65.2 -1.4 19.6 81.8 6.8 4.2 89.0
2003 100 41.1 16.5 7.2 17.3 58.9 -5.6 2.0 62.5 40.3 17.5 42.2 -9.5 3.3 106.1
2004 100 40.8 16.6 5.1 19.1 59.2 -0.5 2.6 57.1 40.8 12.5 46.7 -0.8 4.4 96.4
Sources: (1) The GDP growth rate for the whole economy is from NBSC (2005, p57); (2) The growth rates of FIEs and non-FIEs in sub-table Table 5A are from Table 2; (3) The growth rate of labor used in FIEs (non-FIEs) is calculated by multiplying labor’s share in production and the labor force growth rate in Table 2; (4) The growth rate capital used in FIEs (non-FIEs) is calculated by multiplying capital’s share in production and the capital growth rate in Table 2; (5) The TFP growth rate of FIEs is the FIE growth rate minus growth from labor and capital; (6) In sub-table 5B, the contribution of the FIE (non-FIE) sub-economy to GDP growth is calculated by multiplying the FIE (non-FIE) share in total GDP by the FIE (non-FIE) growth rate. We use the same method to calculate the contribution of labor and capital in FIEs (non-FIEs) to GDP growth. The contribution of TFP is the residual; (7) The contribution to GDP growth in sub-table 5C is calculated by dividing the figure in (4B) by the corresponding GDP growth rate; (8) The contribution to FIE (non-FIE) in sub-table 5D is calculated by dividing the figure in (4B) by the corresponding FIE (non-FIE) growth rate.
Table 7 presents sensitivity results for the components of FIE growth for 2003 and 2004 to the
assumed production function adopted in the decomposition. Tables (5) and (6) use the Solow
procedure of no specified functional form and share parameters in the growth accounting equation
varying from year to year as in data. Table 7 also reports comparable results using specified functional
forms as above. Results indicate changing production function assumptions only yields small changes
to decomposition results. For 2003, the contribution of FDI to Chinese growth varies from 2.9%-3.1%
and for 2004 it varies from 3.1%-3.4% using these alternative procedures.
18
Table 6: A two stage Solow decomposition of FFE and HMT growth rates in China by year and by component (%)
Growth rate Contribution to GDP growth
FFE HMT FFE HMT
GDP growth rate Total TFP L K
Total TFP L K
Total TFP L K
Total TFP L K
1996 9.6 20.8 -19.1 8.0 31.8 16.8 -7.4 3.6 20.5 1.1 -1.0 0.4 1.7 0.8 -0.4 0.2 1.0
1997 8.8 26.8 -2.4 1.4 27.8 22.5 5.4 0.8 16.4 1.6 -0.1 0.1 1.6 1.2 0.3 0.0 0.9
1998 7.8 25.5 1.4 0.8 23.2 21.2 7.3 2.4 11.5 1.7 0.1 0.1 1.6 1.3 0.4 0.1 0.7
1999 7.1 17.8 2.0 0.4 15.3 13.7 5.0 0.4 8.3 1.4 0.2 0.0 1.2 0.9 0.3 0.0 0.6
2000 8.0 19.3 4.3 2.1 12.9 15.1 7.4 0.7 6.9 1.7 0.4 0.2 1.1 1.1 0.5 0.1 0.5
2001 7.5 14.3 -0.9 1.8 13.4 10.2 1.1 2.0 7.1 1.4 -0.1 0.2 1.3 0.8 0.1 0.2 0.5
2002 8.3 14.1 -1.7 2.5 13.3 9.9 0.6 2.3 7.0 1.5 -0.2 0.3 1.4 0.8 0.0 0.2 0.5
2003 9.3 22.4 6.8 4.0 11.5 17.7 8.9 3.2 5.7 2.4 0.7 0.4 1.3 1.4 0.7 0.2 0.4
2004 9.5 20.7 5.7 3.1 11.9 16.1 9.0 1.6 5.4 2.5 0.7 0.4 1.4 1.4 0.8 0.1 0.5
(Table 6 continued)
Contribution share to total GDP growth Factor Contribution share inside
FFE HMT FFE HMT
FIE Total TFP L K
Total TFP L K
TFP L K
TFP L K
1996 20.2 11.6 -10.6 4.5 17.7 8.6 -3.8 1.9 10.6 -91.8 38.6 153.2 -43.8 21.5 122.4
1997 31.4 17.9 -1.6 0.9 18.6 13.5 3.2 0.4 9.8 -9.1 5.1 104.0 24.0 3.3 72.7
1998 38.5 22.4 1.3 0.7 20.4 16.1 5.5 1.8 8.7 5.6 3.2 91.2 34.4 11.2 54.4
1999 32.7 19.9 2.3 0.5 17.2 12.8 4.7 0.4 7.8 11.4 2.4 86.2 36.4 2.9 60.7
2000 34.5 21.2 4.8 2.3 14.1 13.3 6.6 0.7 6.1 22.4 11.0 66.6 49.2 4.9 45.9
2001 28.8 18.5 -1.1 2.4 17.3 10.2 1.1 2.0 7.2 -6.1 12.8 93.3 10.6 19.6 69.8
2002 26.7 17.5 -2.1 3.1 16.6 9.2 0.5 2.2 6.5 -12.1 17.5 94.6 5.8 23.6 70.6
2003 41.1 26.1 7.9 4.7 13.5 14.9 7.5 2.7 4.8 30.4 18.1 51.6 50.0 17.9 32.2
2004 40.8 26.5 7.3 4.0 15.3 14.3 8.0 1.5 4.8 27.3 15.2 57.5 55.9 10.2 33.9
Sources: Authors’ own estimation the same way as we do in Table 5. The share parameters in second stage production function are from Table 3.
Table 7: Sensitivity analysis of component analysis of FIE growth to production function assumptions
Contribution to FIE growth in 2003 and 2004
Year Total TFP L FDI 2003 3.8 1.5 0.7 1.6 A. Solow Decomposition
(No specified functional form) 2004 3.9 1.6 0.5 1.8
2003 3.8 1.5 0.7 1.6 B. Cobb-Douglas decomposition
2004 3.9 1.5 0.6 1.7
2003 3.8 1.5 0.7 1.6 C. CES Decomposition
(σ =0.5 in both FIE and Non-FIE sub-economies) 2004 3.9 1.6 0.6 1.7
2003 3.8 1.5 0.7 1.6 D. CES Decomposition
(σ =0.8 in both FIE and Non-FIE sub-economies) 2004 3.9 1.5 0.6 1.7
2003 3.8 1.4 0.9 1.5 E. CES Decomposition
(σ =1.2 in both FIE and Non-FIE sub-economies) 2004 3.9 1.5 0.8 1.6
4. The sustainability of high Chinese GDP and export growth
Our decomposition results presented above suggest that while the FIE sub-economy in China is still only
20% of the economy, it nonetheless accounts for over 40% of China’s recent economic growth. This part
19
of the Chinese economy thus has substantial implications for the sustainability of China’s future
economic growth, and whether rapid growth will continue into the future in turn depends on both
continued growth in inward FDI and access to international export markets abroad.
While China’s FDI inflow growth rate has averaged over 10% since 2002 and China’s accession to
the WTO, in 2005 it seems likely to plateau or slightly decline. An important implication of China’s FDI
performance has been the falling share of OECD FDI going to other non-OECD countries ( in Brazil it
fell to US$ 10 billion in 2003 and 18 billion in 2004 from US$33 billion in 2000). As overall OECD FDI
has increased little, the prospects seem to be for plateauing or even falling FDI flows to China as some
further FDI moves to other low wage countries such as Vietnam and Indonesia.
China’s WTO commitments imply both capital market liberalization (in banking) and further
progress on commitments on rule-based WTO issues, including TRIPs and TRIMs. These changes will
help attract more FDI. China is also continuing to see changes in the legal forms that FIEs take, and this
may also help with continued FDI inflows. Before 1993, cooperative joint ventures were the dominant
legal form of FIE and the share of inward FDI in the form of wholly foreign owned firms was only
23.6%. The share of inward FDI through wholly foreign owned enterprises at the end of 2000 was
46.9% of accumulated FDI, and in recent years, wholly foreign owned enterprises provide the dominant
legal form for inward FDI (over 66% of inward FDI in 2004) (NBSC, 2005 and various issues). This
increasing share of wholly owned FIEs may accelerate technology transfer and products upgrading as in
other countries (Mansfield and Romero, 1980; Kokko and Blomstrom, 1995; Ernst, 1998; Moran, 1998).
Access to foreign equipment and technology and intermediate goods will improve with trade
liberalization and lower tariffs will apply to imports.
China’s rapid export growth also raises concerns over the continued absorptive capacities of the
OECD. China’s share of world exports is now around 6% and with a 35% growth rate in exports is
doubling every three years. Continued FDI flows thus may also encounter problems here if they are
export oriented. China’s large trade surplus with the EU and the US also fuels protectionist pressure in
these countries.
A final concern is whether regional disparities within China will growth further with additional
growth in inward FDI. About 84% of China’s inward FDI locates in the nine coastal provinces of
Guangdong, Jiangsu, Shandong, Shanghai, Fujian, Liaoning, Zhejiang, Beijing, Beijing, and Tianjin in
recent years (NBSC, 2005 and various issues). Among them, Guangdong and Jiangsu attracted over 40%
of FDI. The remaining 20 provinces share the rest 12% of inward FDI (NBSC, 2005 and various issues).
Several authors attribute a large portion of the growing regional income gap to the spatial distribution of
20
inward FDI (Wen, 2003). If growing inequality in China becomes constraint on growth, continued FDI
flows could fuel further these pressures.
This leaves the issue of whether the non-FIE part of the economy can generate higher growth in the
future to compensate for slowing growth in the FIE sub-economy. The reform process for SOEs and
labor market and competition related reforms provide the major hope, but results from these reforms
thus far are not conclusive.
Overall then, plateau or falling FDI, limits to FDI diversification from other non-OECD countries,
and continued growth of exports all raise cautions for continued high growth in China in the future.
These negatives are counterbalanced by an ever improving policy environment for FDI in China, but
they seem unlikely to support get more FDI growth into China. Whether growth in the non-FIE
sub-economy can compensate is the issue.
5. Conclusions
This paper uses a two stage decomposition approach to assess the contribution of inward FDI to China’s
recent rapid economic growth. The FIE share in China’s whole economy reached over 20% in last two
years and FIEs contributed over 40% of China’s economic growth. Without FDI inflows in 2004, our
results suggest that China’s overall GDP growth rate would be lower by around 3.4 percentage points.
Excluding FIEs whose FDI from Hong Kong, Macao and Taiwan, FIEs still account for around 30% of
China’s GDP growth. Our findings thus seem to confirm the view that inward FDI has played a
substantial role in China’s recent rapid economy growth, and perhaps even more than currently
appreciated.
These findings raise the issue of the sustainability of both China’s GDP and export growth, which
in turn seem to depend on the performance of the FIE sub-economy. China could still see further modest
growth of inward FDI, supplemented by improvements in legal arrangements in China. Existing FDI
may also contribute more in the future to China’s growth through accelerated technology transfer, and
spillover effects not dependent on new FDI. But a problem for China remains ever growing trade
pressures as the absorptive capacities of OECD markets become a constraint, and this casts further doubt
on continued rapid export growth from FDI related activity. Seemingly more vigor in growth
performance from the non-FIE sub-economy will be needed to compensate for further lagging growth
performance from FIEs.
21
References
Berthelemy, J.C., and Sylvie Demurger, 2000. Foreign Direct Investment and Economic Growth: Theory and Applications to China, Review of Development Economics, 4(2), 140-155.
Borensztein, E., et al, 1998. How Does Foreign Direct Investment Affect Economic Growth, Journal of International Economics, 45, 115-135.
Branstetter, Lee and R. Feenstra, 2002. Trade and Foreign Direct Investment in China: A Political Economy Approach, Journal of International Economics, 58(2), 335-358.
Chen C., L. Chang, and Y.M., Zhang, 1995. The role of Foreign Direct Investment in China post-1978 Economic Development, World Development, 23, 691-703.
Chow, G.C., 1993. Capital Formation and Economic Growth in China, Quarterly Journal of Economics, Vol. 108, No.3, 809-842.
Chow, G.C., and A., Lin, 2003. Accounting for Economic Growth in Taiwan and Mainland China: A Comparative Analysis, EWP-GE/0306003.
Dees, S., 1998. Foreign Direct Investment in China: Determinants and Effects, Economics Planning, 31,175-194.
Dennison, E. F., 1967. Why Growth Rates Differ, Washington, DC: The Brookings Institution.
Dixit, A., and V. Norman, 1980. Theory of International Trade. Cambridge: Cambridge University Press.
Ernst, D., 1998. Globalization, Convergence, and Diversity: the Asia Production Networks of Japanese Electronics Firms, in Rivalry or Riches: International Production Networks in Asia. Ed. By D.Ernst, and S. Haggard, Cornell University Press, Ithaca, NY
Fung, K,C, H. Iizaka and S. Tong, 2002. Foreign Direct Investment in China: Policy, Trend and Impact, Paper prepared for International Conference on “China’s Economy in the 21st Century”, hold on June 24-25, 2002, Hong Kong.
Fung, K,C, H. Iizaka and Stephan Parker, 2002. Determinants of U.S. and Japanese Direct Investment in China, Journal of Comparative Economics, 30, 567-578.
Fung, K.C., 2004. Trade and Investment: China, the United States, and the Asia-Pacific Economies, U.S.-China Economic and Security Review Commission Hearing on China as an Emerging Regional and Technological Power: Implications for U.S. Economic and Security Interests, February, 12-13, 2004.
Gao, T., 2005. Foreign Direct Investment in China: How big are the roles of Culture and Geograph? Pacific Economic Review, 10:2, 153-166.
Graham E.M., and E. Wada, 2001. Foreign Direct Investment in China: Effects on Growth and Economic Performance, Achieving High Growth: Experience of Transition Economies in East Asia, Peter Drysdale ed., Oxford University Press.
Grub, Ph.G. and Lin, J.H., and Xia, M., 1991. Foreign Investment in China, New York, Quorum Books
Harrold P., and R. Lall, 1993. China Reform and Development in 1992-1993, World Bank Discussion Paper, #215, the World Bank.
Huang, Y.S., 1999. The Institutional Foundation of Foreign Invested Enterprises (FIEs) in China, Working Paper No. 264, Harvard Business School, Boston, MA.
Hu J.Y, 2005. China’s Foreign Direct Investment Policy, www. china.org.cn /chinese/ MATERIAL /760645.htm.
Jorgensen, D.W. and Zvi Griliches, 1967. The Explanation of Productivity Change, Review of Economic Studies 34, no.3, 349-383.
Kawagguchi, O., 1994. Foreign Investment in Asia: Trends, Determinants, and Policy Implications, Internal Discussion Paper, World Bank.
Kohli, U., 2003a. Growth Accounting in the Open Economy: International Comparisons, International Review of Economics and Finance, 12, 417-435.
Kohli, U., 2003b. GDP Growth Accounting: A National Income Function Approach, Review of Income and Wealth, 49(1), 23-34.
Kokko, A., and M. Blomstrom, 1995. Policies to Encourage Inflows of Technoogy through Foreign Multinationals, World Development, Vol.23, No.3, 459-468.
Lenovie, F., 2000. FDI and the Opening up of China’s Economy, CEPII Working Paper, Number 2000-11.
Lim, E.G., 2001. Determinants of, and the Relation between, Foreign Direct Investment and Growth: A Summary of the Recent Literature, IMF Working Paper, WP/01/175.
Liu, X., Wang, C., and Y. Wei, 2001. Causal Links Between Foreign Direct Investment and Trade in China, China Economic Review, 12, 190-202.
Liu, X.H., P. Burridge, and P.J.N. Sinclair, 2002. Relations between Economic Growth, Foreign Direct Investment and Trade: Evidence from China, Applied Economics, 34, 1433-1440.
Mansfield, E., and A. Romero, 1980. Technology Transfer to Overseas Subsidiaries by U.S.-based Firms, Quarterly Journal of Economics, Vol.95, No.4, 737-750.
Ministry of Commerce, China (MOC), 2004 and 2005. Foreign Investment Report, www.fdi.gov.cn
Moran, T., 1998. Foreign Direct Investment and Development: The New Policy Agenda for Developing Countries and Economies in Transition, Institute of International Economics, Washington, D.C..
National Bureau of Statistics of China (NBSC), 2005 and other various issues. China Statistical Yearbook, China Statistics Press, Beijing.
OECD, 2000. Main Determinants and Impacts of Foreign Direct Investment on China’s Economy, OECD Working Papers on International Investment, No. 2000/4, Paris.
Rawski, T.G., 2001. What is happening to China's GDP statistics?, China Economic Review, Vol. 12(4), 347-354.
22
Rodrik, D., 1999. The New Global Economy and Developing Countries: Making Openness Work, Policy Essay No.24, Overseas Development Council, Washington D.C.
Sicular T., 1998. Capital Flight and Foreign Investment: Two Tales from China and Russia, World Economy, 21 (), 589-602.
Solow, R.M, 1957, Technical Change and the Aggregate Production Function, Review of Economics and Statistics, 39(3)., 312-320.
Sun, H.S., and A. Parikh, 2001. Exports, Inward Foreign Direct Investment and Regional Economic Growth in China, Regional Studies, Vol. 35.3, 187-196.
Taube, M., and M. Ogutcu, 2002. Main issues on Foreign Investment in China’s Regional Development: Prospects and Policy Challenges, Foreign Direct Investment in China: Challenges and Prospects for Regional Development, OECD.
Tseng, W., and H. Zebregs, 2002. Foreign Direct Investment in China: Some Lessons for other Countries, IMF Policy Discussion Paper, PDP/02/3.
United Nations Conference on Trade and Development (UNCTAD), 2005. World Investment Report 2005, New York and Geneva.
Wei, S.J., 1993. The Open Door Policy and China’s Rapid Growth: Evidence from City-level Data, NBER Working Paper No. 4602.
Wei, Y.Q., X.M., Liu, and D., Parker, and K., Vaidya, 1999. The Regional Distribution of Foreign Direct Investment in China, Regional Studies, 33(9): 857-867.
Weitzman, M.L., 1970. Soviet Postwar Economic Growth and Capital-Labor Substitution, American Economic Review 60, no. 4, 676-692.
Wen M., 2003. Foreign Direct Investment, Regional Geographical and Market Conditions, and Regional development: A Panel Study on China, Division of Economics, RSPAS, Australian National University, June 2003.
Woo, W.T., 1995. Comments on Wei’s (1995) Foreign Direct Investment in China: Sources and Consequences, in Financial Deregulation and Integration in East Asia (Ed.), A. Kruger, The University of Chicago Press, Chicago, 166-189.
World Bank, 2005. WDI database, http://devdata.worldbank.org/data-query/.
Wu, Y.R., 2000. Measuring the Performance of Foreign Direct Investment: A Case Study of China, Economic Letters, 66(2), 143-150.
Xiao G., 2004. People’s Republic of China’s Round-tripping FDI: Scale, Causes, and Implications, Asia Development Bank Institute Discussion Paper No.7.
Young, A., 1995. The Tyranny of Numbers: Confronting the Statistical Reality of the East Asian Growth Experience, Quarterly Journal of Economics, 110, 641-680.
Young, A., 2000, Gold into Base Metals: Productivity Growth in the Peoples Republic of China during the Reform Period, NBER Working Paper W7856, National Bureau of Economic Research, Cambridge.
Young, S., and P. Lan, 1997. Technology Transfer to China through Foreign Direct Investment, Regional Studies, 31(7), 669-679.
Notes
i Chinese government adjusted its GDP data based on national survey conducted in 2005. Due to unavailability of more detailed data on FDI and FIEs economy, we still use the unadjusted data to keep track use of time series data. ii In world wide, bilateral discrepancies between FDI flows as reported by home and host countries can be quite large. According to
UNCTAD (2005) annual report, global FDI outflows were 13% higher than global FDI inflows. iii These discrepancies are much larger than for 2002 data. iv There is no data on the wage bill for rural farmers and other employees, such as labor force in township and village enterprises, private enterprises, who not belong to China’s so called “UNIT” (danwei). NBSC only report the wage bills for those who work in and get payments from state ownership, collective ownership, joint venture, shareholding ownership, FIEs and their affiliates. On the other hand, labor remuneration is more accurately reflected in the total wage payments to the labor force. v This fixed investment price index is only available since 1990. We use an inflation index from the World Bank data base (WB, 2005) to deflate annual capital formation before 1990. vi In Weitzman’s (1970) application of the growth accounting to Soviet postwar data using an aggregate CES function, with central planning, factor share data were not consistent with marginal value pricing of factors. Weitzman thus estimated a CES production
function with constant λ over time and directly calculated shares for use in the growth accounting equation.