Embed Size (px)
Citation preview

J.STUD.ECON.ECONOMETRICS, 2019, 43(3) 1
THE IMPACT OF CHINA’S FDI AND FDI FROM
OTHER SOURCES ON GROWTH IN SUB-SAHARA
AFRICA THROUGH EXPORT UPGRADING
M. Ngundu1* & N. Ngepah2 *
Abstract
his paper seeks to analyse how FDI from China, US, EU, and the rest of Asia transmit to growth in sub-Sahara Africa through export
upgrading for the period (2003-2012). Terms-of-trade is utilized as a proxy for export upgrading. We develop a theoretical argument to show that countries with worsening (less than 1%) terms-of-trade are associated with poor industrialization as a result they can hardly improve quality and quantity of their products for export market, vis-à-vis. In this respect, this study contributes to existing literature in two ways. First, we investigate if technology embodied in FDI from the above-mentioned sources can enhance quantity and quality improvements of export commodities in sub-Sahara Africa. Second, we account for industrial policy heterogeneity of sub-Sahara African countries in order to determine the threshold level at which FDI-induced export upgrading can contribute positively to growth. Using both 2SLS and PTR models, our results reveal that FDI from China and the rest of Asia does not bear significant impact on growth in sub-Sahara Africa through export upgrading. However, PTR analysis demonstrates that FDI from US and EU seem to have a significant negative impact only below a threshold of 1.08%. As the terms-of-trade improves beyond 1.08%, the estimated coefficients of both FDI from US and EU turn positive, albeit insignificant. We conclude that sub-Sahara African countries are far yet to reach a threshold at which FDI-induced export upgrading can contribute positively to growth.
*1 Ph.D. Candidate (Economics), University of Johannesburg, College of Business and Economics, University
of Johannesburg, College of Business and Economics, P.O Box 524, Auckland Park, 2006, South Africa.
Email: [email protected] 2 Associate Professor, University of Johannesburg, College of Business and Economics.
T

2 J.STUD.ECON.ECONOMETRICS, 2019, 43(3)
1 Introduction
Although it can be argued that decrease in terms-of-trade reflects export price
competitiveness of the country’s goods, this paper equally argues that the improving
terms-of-trade implies a rise in the purchasing power of the economy’s exports. All
other things held constant, a rise in the purchasing power of the country’s exports
often improves the balance of trade hence growth. Terms-of-trade exhibit an
economy's export prices relative to its import prices (Wacker, Grosskurth, &
Lakemann, 2014). Accordingly, it can be argued that terms-of-trade improve with
the export value of the merchandise. From the production perspective, the terms-of-
trade can, therefore, be maximized in various ways including minimizing production
costs while improving quality and increasing export basket in terms of quantity.
These factors reflect export upgrading and are driven by production know-how
because of its ability to stimulate productivity (Zhu & Fu, 2013). Mattoo &
Subramanian (2009) suggest that export upgrading and the ability to export to the
industrialized economies enhance economic growth in the country. Harding &
Javorcik (2012) argue that in developing countries export upgrading is not a trivial
task due to several challenges including lack of capital to finance production
technologies and poor reputation in the global market. How these impediments can
be addressed is subject to a vivid academic debate.
However, the latter concede with Romer (1993) and other potential studies in that
FDI is a vital source of innovation to technical laggard economies. In terms of poor
market reputation, (UNCTAD, 2005) suggests that FDI provides opportunities for
technological laggard countries to access the global market even where substantial
costs are involved due to the emanation of positive spillover effects from locational
proximity to an innovation leader. This connection is also exhibited by Mencinger
(2003), who gives confirmation of an unmistakable relationship between the increase
of FDI and the rapid integration into the worldwide trade. These views provide
ample evidence in that FDI as a source of innovation can catalyze export upgrading
and associated terms of trade in the host country.
Zhu et al., (2013) suggest that export-oriented FDI in developing economies is often
accompanied by the imports of high technology immediate inputs. These inputs
enhance the production of sophisticated final products in the host country let alone
making the domestic capital more productive. In line with the latter, Poncet &
Starosta de Waldemar (2012) assert that FDI can directly transmit to product
upgrading since the quality of commodities produced by multinational corporations
(MNCs) in the host country is typically higher than that of the domestic firms. The
J.STUD.ECON.ECONOMETRICS, 2019, 43(3) 3
indirect transmission channel occurs when production technologies from MNCs
spillover to domestic firms. However, this channel depends on the capacity of
domestic firms to absorb foreign production technologies. Demena & Murshed
(2018) argue that significant FDI productivity spillover effects can be realized if
domestic firms have the capacity to imitate high tech production processes exposed
to them by the MNCs. Otherwise, export upgrading will only be reflected in
sophisticated products produced by MNCs. In such cases, growth benefits can hardly
be attained and the former asserts that this is highly likely in developing countries.
In the context of sub-Sahara Africa, FDI productivity diffusion might be constrained
by the nature of industry which foreign investors seem to be targeting. Literature
(Collier & Goderis, 2009; Busse, Erdogan & Muhlen, 2014; Chen, Dollar & Tang,
2015; Donou-Adonsou & Lim, 2018) provide considerable evidence to substantiate
that FDI penetration in Africa from both traditional and new emerging investors is
mainly driven by the investors’ appetite for natural resources. Resource mining
projects are capital intensive investments which most domestic firms in sub-Sahara
Africa cannot afford to operate relatively with MNCs. This explains why the
extraction industry in the region is dominated by foreign investors (Asiedu, 2013).
Based on Demena et al., (2018) and Poncet et al., (2012) assertions, it can be argued
that sophistication induced growth in sub-Sahara Africa could be a statistical mirage
because export upgrading and associated terms-of-trade are reflected only in the
resources extracted by the MNCs. This follows that only resource export platforms
of MNCs are likely to benefit from export upgrading and associated terms of trade
(Busse et al., 2014). However, the benefits are volatile subject to the fluctuations in
global prices of natural resources.
Empirical studies on the growth effects of FDI through export upgrading are still
scarce particularly in the context of Africa. The available potential studies focus
mainly on the impact of FDI on export upgrading in developing countries generally.
For instance, Harding & Javorcik (2012) provide evidence that FDI can enhance
export upgrading in developing countries. In contrast, Wacker, Grosskurth, &
Lakemann (2016) found negative effects of FDI on export upgrading and associated
terms-of-trade in South Asia. The latter, however, argue that FDI productivity
spillover effects on export upgrading depend on the quality of human capital.
Likewise, Zhu et al., (2013) provide evidence that the effect of education is
significant in FDI-induced-export upgrading in low-income countries. This paper
contributes to the existing literature in various ways. First, it uses disaggregated FDI
data to investigate how FDI from various sources can transmit to growth through

4 J.STUD.ECON.ECONOMETRICS, 2019, 43(3)
export upgrading. Second, this paper uses the PTR model to account for the
heterogeneity of African countries’ industrial policy in terms of export upgrading.
The rest of the paper is structured as follows. Section two specifies the model. Section
three describes data, variables and empirical strategies. Section four presents the
empirical results and discusses the findings of the main parameters. Section five
concludes the study.
2 Model specification
In the exogenous growth models pioneered by Solow and Swan (1956), FDI
simultaneously serves as a capital and technological input and hence forestalls
physical capital falling into diminishing returns due to the presence of consistent
contribution of the technology growth (Neuhaus, 2006). Likewise, in endogenous
growth theories pioneered by Romer (1986), technology diffusion through MNCs
impel productivity coming about to increase economic growth both in the short and
long-run. In either case, production technology embodied in FDI promotes capital
deepening which enhances the quality of existing varieties of capital goods (Aghion
& Howitt, 1992; Aghion, Akcigit & Howitt, 2015) and the invention of totally new
varieties of capital goods (Romer, 1990).
Accordingly, the model of this paper follows the FDI-augmented version of the
Solow growth model. The model was proposed by Neuhaus (2006) following the
lead of Mankiw, Romer, & Weil (1992) and Bassanini & Scarpetta (2001). Since
FDI can directly transmit to growth through physical capital accumulation, the model
replaces Human Capital in the augmented-Solow model of Mankiw et al., (1992)
with the stock of FDI. Hence, we account for two different stocks of physical capital;
domestic capital investment (𝐾𝑑) and foreign direct investment (𝐾𝑓).
𝑌(𝑡) = 𝐾𝑑(𝑡)𝛼𝐾𝑓(𝑡)𝛽𝐴(𝑡)𝐿(𝑡)1−𝛼−𝛽 (1)
where 𝑌, 𝐾 and 𝐴 proxy for aggregate output, the stock of physical capital, and the
productivity parameter respectively. The subscript 𝐿 denotes labor input while 𝑡
represents time. 𝛼 and 𝛽 represent production elasticities of domestic and foreign
capital stocks, respectively.
Since our model follows the neoclassical growth theories, we utilize changes in the
log of per capita GDP for income levels in real terms as our dependent variable
(𝑙𝑛𝑦𝑖𝑡 − 𝑙𝑛𝑦𝑖𝑡−1). The specification of our regressors incorporates fundamental

J.STUD.ECON.ECONOMETRICS, 2019, 43(3) 5
determinants of the steady-state and technical progress variables. The steady-state
determinants according to Solow (1956) include the convergence term (𝑦𝑖𝑡−1),
population growth rate (n), changes in technology (g), the rate of depreciation for
capital stock (𝑑) and domestic investment savings rate (𝑠𝑑). Bassanini et al., (2001)
suggest that technical progress (𝐴) consists of two elements. One that accounts for
various policy oriented variables (𝑋𝑖,𝑡) such as institutional framework, inflation rate,
resource rents and terms-of-trade among other variables. The other element reflects
exogenous technical progress, that is, all other unexplained trend growth variables
which the model does not explicitly account for. The basic model can be summarised
using the following econometric statement:
𝑙𝑛𝑦𝑖𝑡 − 𝑙𝑛𝑦𝑖𝑡−1 = 𝛼 + 𝛽𝑙𝑛𝑦𝑖𝑡−1 + 𝛾𝑙𝑛𝑠𝑑,𝑖𝑡 + 𝜑 𝑙𝑛(𝑛𝑖𝑡 + 𝑔 + 𝑑) +
𝜑′𝑙𝑛𝑋𝑖𝑡 + 𝜆𝑡 + 𝜂𝑖 + 𝜀𝑖𝑡 (2)
As highlighted before, this paper incorporates FDI both as physical capital input (𝑠𝑓)
and technology input. However, we are much interested on the latter where
technology embodied in FDI is transmitted towards the production of new varieties
of commodities and quality enhancement of existing varieties of commodities in the
host country. Our assumption being that if the quality and quantity of the
commodities are improved, export value of the host country is also likely to improve.
Increase in the export value is in this study quantified using terms-of-trade and
according to WDI (2019) terms-of-trade above 1% indicate an improvement in the
value of export portfolio otherwise a worsening. Wacker et al., (2014) assert that
terms-of-trade exhibit an economy's export prices relative to its import prices. It can
therefore be argued that terms-of-trade increases with the export value of the
merchandise. In this respect, we compute interaction term between FDI and terms-
of-trade (FDI*TOT) to analyse the impact of FDI from China, EU, US and the rest
of Asia on growth in sub-Sahara Africa through export upgrading.
Moreover, in the study of Mankiw et al., (1992) the depreciation rate of the physical
capital stock (d) and changes in technology (g) is assumed to be constant over time
and equal to 0.05. Thus the equation (2) translates to equation (3) as follows;
𝑙𝑛𝑦𝑖𝑡 = 𝛼 + (𝛽 + 1)𝑙𝑛𝑦𝑖𝑡−1 + 𝛾𝑙𝑛𝑠𝑑,𝑖𝑡 + ∅𝑙𝑛𝑠𝑓,𝑖𝑡 + 𝜑 𝑙𝑛(𝑛𝑖𝑡 + 0.05) +
𝜑′𝑙𝑛𝑋𝑖𝑡 + 𝜗ln (𝐹𝐷𝐼 ∗ 𝑇𝑂𝑇)𝑖𝑡 + 𝜆𝑡 + 𝜂𝑖 + 𝜀𝑖𝑡 (3)
where 𝜆𝑡, 𝜂𝑖 , 𝜀𝑖𝑡 proxy for period-specific effects that are assumed to affect all
countries for example technology shocks, unobserved country-specific effects, and
6 J.STUD.ECON.ECONOMETRICS, 2019, 43(3)
white noise error term respectively. The subscript 𝑖 denotes cross-sectional
dimension.
2.1 Data and variables description
This paper measures per capita GDP in real terms for income levels. The domestic
investment savings rate is measured using Gross Capital Formation as a percentage
of GDP while foreign investment savings rate is measured using the share of inward
stock of FDI in GDP. We use stock rather than flow data of FDI to capture for
perpetual and some of the immeasurable effects of FDI on growth. Neuhaus (2006)
argue that that the ratio of inward stock of FDI to GDP is more accurate than flows
in capturing for perpetual and some immeasurable effects of FDI on economic
growth. FDI is differentiated between FDI from a particular source and FDI from the
rest of the world (ROW) to sub-Saharan African countries. FDI from ROW is
controlled by subtracting source’s FDI from the total inward stock of FDI to Africa.
For population growth, we add 0.05 before generating logs. The components of 𝑋𝑖𝑡
include total natural resource rents as a percentage of GDP to capture the revenue
obtained from extraction of resources, rule of law to proxy for institutional quality
and inflation rate to control for macroeconomic distortions. All these control
variables are in logarithms. The summary of all the variable descriptions and data
sources is provided in Table 1 below.

J.STUD.ECON.ECONOMETRICS, 2019, 43(3) 7
Table 1: Variable descriptions and data sources
VARIABLE DESCRPTION SOURCE
GDP per
capita
Gross Domestic Product (GDP) per capita, constant 2010
US$. WDI (2019)
Domestic
Investment Goss Capital Formation, % of GDP. WDI (2019)
Population
Growth Population growth rate in %. WDI (2019)
Terms of
Trade Terms of trade in %, based on an index 2000=100. WDI (2019)
Inflation GDP deflator, annual change in %. WDI (2019)
Rule of Law
The estimates range from approximately -2,5 to 2.5
indicating weak and strong governance performance
respectively. WDI (2019)
FDI ROW
Total inward stock of FDI from the rest of the world (Total
inward stock of FDI less inward stock of FDI from
China/USA/EU/Asia), % GDP.
UNCTAD
stat (2019)
FDI
(CHINA/US
A/EU/ROA)
Inward stock of FDI from China, USA, European Union and
the Rest of Asia respectively, % of GDP.
UNCTAD
stat (2019)
Total
Natural
Resource
Rent (% of
GDP)
Total natural resources rents are the sum of oil rents, natural
gas rents, coal rents (hard and soft), mineral rents, and forest
rents. WDI (2019)
Our sample embraces a panel of 42 sub-Sahara African countries over the period
(2003-2012). Guided by the analytical framework of Sy (2014)1, our analysis of FDI
sources accounts for China, USA, EU, and Asia excluding China (rest of Asia). Our
study period (2003-2012) is restricted by the availability of inward stock of FDI data
from the named FDI sources to African countries, likewise our sample. The list of
the sample is provided in Table 2 below.
1 An analytical framework of Sy (2014) shows that there has been a surge of inward stock of FDI in Africa
from $27.2 billion to approximately $132.8 billion between the periods (2001-2012). This surge was mainly
fuelled by China, whose FDI grew at an annual rate of 53 percent, compared with, 16 percent for the EU and
14 percent for the U.S. In addition to China, other new emerging investors were increasingly investing in the continent.

8 J.STUD.ECON.ECONOMETRICS, 2019, 43(3)
Table 2: Sample2
Angola Benini Botswana Burkina Faso Burundi Cameroon
Cape Verde Central Africa
Republic Chad Comoros Congo
Cote
D'Ivoire
DRC Equatorial
Guinea Eritrea Ethiopia Gabon
The
Gambia
Ghana Guinea Guinea-
Bissau Kenya Lesotho Liberia
Madagascar Malawi Mali Mozambique Niger Nigeria
Rwanda Sao Tome &
Principe Senegal Seychelles
Sierra
Leone
South
Africa
Swaziland Tanzania Togo Uganda Zambia Zimbabwe
3 Estimation techniques
Endogeneity is a central econometric problem prone to economic growth models.
Hauk (2016) asserts that bias arising from omitted variables and reverse causality are
the most common sources of endogeneity which often renders the OLS parameter
estimates of the growth models inconsistent. In a single regression framework, the
workhorse of dealing with endogeneity is using instrumental variables estimator and
the popular form of that estimator, often utilized is known as two-stage least squares
(2SLS). Accordingly, the estimates of the equation (3) are derived from the fixed-
effects 2SLS regression model. Regressions are conducted separately for each source
of FDI. Following the approach utilized in the study of Donou-Adonsou et al., (2018), we instrument each source of FDI with its first three lags. The consistency of
fixed-effects 2SLS estimator relies upon the test for endogeneity and the validity of
the instruments utilized. The standard formal test for endogeneity is a Hausman test
or C test. For the validity of instruments, we use the Hansen test of overidentifying
restrictions.
However, one of the weakness associated with classical fixed-effects models in as
much as the interaction term is concerned (FDI*TOT) is the inability to capture for
2 The estimation results of the PTR model are based on 34 sub-Sahara African countries for the regression
relating to China and 35 countries for other sources of FDI. Countries removed from the main sample are Benini, Ghana, Guinea-Bissau, Mali, Rwanda, Sao Taome & Principe, Senegal, and Togo. We removed Ghana
on the regression relating to China only. These countries reported very few observations (mostly less than three) of inward stock of FDI from all the FDI sources considered in this study for the period (2001-2012). The
estimation of PTR using STATA is very sensitive to missing values hence, these countries were removed to
obtain a strongly balanced panel data. We hardly could ipolate and epolate for the missing FDI values of the removed countries.
J.STUD.ECON.ECONOMETRICS, 2019, 43(3) 9
varying slopes. Rather, they reflect the heterogeneity of different countries in
intercepts. To circumvent this drawback we also run equation (3) using fixed-effects
panel threshold regression (PTR) of Hansen (1999). While we acknowledge that PTR
model does not fully account for endogeneity, it is crucial to note that the estimation
technique is effective in capturing different links in terms of statistical significance,
magnitude and signs of FDI from a specific source in distinct regimes of terms-of-
trade in sub-Sahara Africa. Accordingly, instrumental variables estimation
techniques and PTR model complement each other. In this study, 2SLS is used to
confirm robustness of the estimated coefficients of the direct impact of FDI from the
sources as well as other control variables while PTR demonstrates how FDI indirectly
transmit to growth through export upgrading by capturing industrial heterogeneity in
sub-Sahara Africa.
Allowing for fixed individual effects (𝜇𝑖) and given terms-of-trade (𝑇𝑂𝑇𝑖,𝑡) as a
threshold variable, the PTR divides the observations into two or more regimes,
depending on whether each observation is above or below a threshold level. The
econometric equation of PTR model with two extreme regimes can be defined as
follows;
𝑦𝑖𝑡 = 𝜇𝑖 + 𝛽𝑖𝑡′ 𝑠𝑓,𝑖𝑡𝑔(𝑇𝑂𝑇𝑖𝑡; 𝑐) + 𝜑′𝑋𝑖𝑡 + 𝜀𝑖𝑡 (4)
where 𝑋𝑖𝑡 denotes for fundamental Solow growth variables and other control
variables discussed above excluding terms-of-trade. Excluding terms-of-trade from
other regressors in the main equation controls for reverse causality and collinearity.
The subscript 𝑠𝑓,𝑖𝑡 represents the inward stock of FDI while 𝜀𝑖𝑡 is the error term. The
binary transition function 𝑔(𝑇𝑂𝑇𝑖𝑡; 𝑐) divides the single threshold equation (4) into
two regimes with coefficients 𝛽1 and 𝛽2, where c is the threshold parameter. This
translate equation (4) into the following equation:
𝑦𝑖𝑡 = {𝜇𝑖 + 𝛽1
′𝑠𝑓,𝑖𝑡 + 𝜑′𝑋𝑖𝑡 + 𝜀𝑖𝑡 𝑖𝑓 𝑇𝑂𝑇𝑖𝑡 ≤ 𝑐
𝜇𝑖 + 𝛽2′ 𝑠𝑓,𝑖𝑡 + 𝜑′𝑋𝑖𝑡 + 𝜀𝑖𝑡 𝑖𝑓 𝑇𝑂𝑇𝑖𝑡 > 𝑐
, (5)
Equation (5) can be thought of as linear heterogeneous panel model with coefficients
that vary across cross-section units and over time. Where the slope parameters
satisfy;
𝜕𝑦𝑖𝑡
𝜕𝑠𝑓,𝑖𝑡= 𝛽𝑖𝑡 = {
𝛽1 𝑖𝑓 𝑇𝑂𝑇𝑖𝑡 ≤ 𝑐𝛽2 𝑖𝑓 𝑇𝑂𝑇𝑖𝑡 > 𝑐
, (6)

10 J.STUD.ECON.ECONOMETRICS, 2019, 43(3)
For multiple thresholds that is, models with 𝑟 + 1 > 2 regimes or threshold
parameters 𝑐1, . . 𝑐𝑟, the general specification is as follows:
𝑦𝑖𝑡 = 𝜇𝑖 + ∑ 𝛽𝑗′𝑟
𝑗=1 𝑠𝑓,𝑖𝑡Ι(𝑐𝑗−1<𝑇𝑂𝑇𝑖𝑡≤𝑐𝑗) + 𝜑′𝑋𝑖𝑡 + 𝜀𝑖𝑡 (7)
where Ι(𝑐𝑗−1<𝑇𝑂𝑇𝑖𝑡≤𝑐𝑗) represents the indicator function and 𝑐0 = −∞ while 𝑐𝑟+1 =
+∞.
Equation (7) ought to be fitted sequentially for instance in the case of a double
threshold that is, three regimes model the specification is presented below;
𝑦𝑖𝑡 = 𝜇𝑖 + 𝛽1′𝑠𝑓,𝑖𝑡(𝑇𝑂𝑇𝑖𝑡 < 𝑐1) + 𝛽2
′ 𝑠𝑓,𝑖𝑡(𝑐1 ≤ 𝑇𝑂𝑇𝑖𝑡 < 𝑐2) +
𝛽3′ 𝑠𝑓,𝑖𝑡(𝑇𝑂𝑇𝑖𝑡 ≥ 𝑐2) + 𝜑′𝑋𝑖𝑡 + 𝜀𝑖𝑡 (8)
where 𝑐1 < 𝑐2.
Notwithstanding uncertainty about the endogeneity bias and potential reverse
causality, this study uses lagged values of FDI and terms-of-trade. This translates
equation (4) and (7) into the following equations, respectively:
𝑦𝑖𝑡 = 𝜇𝑖 + 𝛽𝑖𝑡′ 𝑠𝑓,𝑖𝑡−1𝑔(𝑇𝑂𝑇𝑖𝑡−1; 𝑐) + 𝜑′𝑋𝑖𝑡 + 𝜀𝑖𝑡 (9)
𝑦𝑖𝑡 = 𝜇𝑖 + ∑ 𝛽𝑗′𝑟
𝑗=1 𝑠𝑓,𝑖𝑡−1Ι(𝑐𝑗−1<𝑇𝑂𝑇𝑖𝑡−1≤𝑐𝑗) + 𝜑′𝑋𝑖𝑡 + 𝜀𝑖𝑡 (10)
3.1 Estimation procedures
We begin by reporting results of the baseline specification of Solow model. In this
case, growth is explained only by fundamental determinants of the steady state as
presented below.
𝑙𝑛𝑦𝑖𝑡 = 𝛼 + (𝛽 + 1)𝑙𝑛𝑦𝑖𝑡−1 + 𝛾𝑙𝑛𝑠𝑑,𝑖𝑡 + 𝜑 𝑙𝑛(𝑛𝑖𝑡 + 0.05) + 𝜆𝑡 + 𝜂𝑖 +𝜀𝑖𝑡 (11)
After performing the baseline regression, we estimate equation (3) using the fixed-
effects 2SLS estimator to determine how FDI from China, US, EU and rest of Asia
contribute to growth in sub-Sahara Africa through export upgrading.
J.STUD.ECON.ECONOMETRICS, 2019, 43(3) 11
However, the latter estimation procedure ignores the heterogeneity of the sub-Sahara
African countries in terms of export upgrading policies. Rather, it regards all
countries in the region as one. Precisely, classical fixed-effects models cannot
capture for varying slopes rather they reflect the heterogeneity of different countries
in intercepts. While we acknowledge that sub-Sahara Africa is a region comprising
of countries with common characteristics, industrialization capacity of these
countries as determined by terms-of-trade are significantly different and as a result,
the structural relationships may vary from one country to the other. We, therefore
estimate equation (10) using PTR model to determine the impact of FDI from the
above mentioned sources on growth in sub-Sahara Africa subject to different levels
of terms-of-trade.
The first test of the PTR model is conducted to determine the significance of the
threshold effect in equation (10). The threshold effect hypothesis can be presented as
follows;
𝐻0: 𝛽1 = 𝛽2
The rejection of 𝐻0 is an indication that the single threshold regression is appropriate
otherwise, equation (10) collapses to equation (3). The main econometric problem
associated with the test for no threshold effects is the presence of the nuisance
parameter in the null hypothesis. Thus, the threshold parameter c is not identified
under 𝐻0 Davies (1987). This problem renders the asymptotic distribution of 𝐹1
statistic non-standard. Hansen (1996) proposed the use of bootstrap simulation as a
solution to the nuisance parameter issue. The bootstrap analog produces first-order
asymptotic distributions and therefore test statistic 𝐹1 and the corresponding p-value
attained from the bootstrap are asymptotically valid. The null hypothesis is rejected
if the test statistic 𝐹1 > its critical value.
The second test of the PTR model is conducted to determine the number of
thresholds. A sequential procedure based on 𝐹2, . . . 𝐹𝑗 (until the corresponding 𝐻0 is
accepted) allows the determination of the number of thresholds hence the appropriate
regression. Starting with statistic 𝐹2, 𝐻0: Single threshold regression. The hypothesis
of the single threshold is rejected in favor of a double threshold if 𝐹2 > its critical
value. The corresponding asymptotic p-value for 𝐹2, . . . 𝐹𝑗 can again be estimated
using bootstrap simulation (Hansen, 1999).
4 Estimated results

12 J.STUD.ECON.ECONOMETRICS, 2019, 43(3)
Table 3 reports the results of the standard Solow model variables. Estimated
coefficients of lagged dependent variable3 and domestic investment has expected
signs and are highly significant. Contrary to the potential literature, population
growth estimate is positive, however, insignificant and small. At this stage, our
estimates are predominantly in line with other results of Solow growth estimations
where sub-Sahara African economies are explicitly analyzed, including Busse et al., (2014) and Hoeffler (2002). In terms of R-squared, our result shows that the
regressors explain approximately 82% of the within-country variation in real GDP
per capita. This implies that the model fits relatively well with the utilized set of data
and therefore we can continue to add our variables of principal interest and control
variables.
Table 3: Standard OLS fixed-effects results for baseline specifications of the
Solow model
Dependent Variable: In real GDP per Capita
Lagged Dep Var 0,812***
(0,041)
ln Domestic Investment 0,013***
(0,005)
ln Population Growth 0,027
(0,029)
Observations 390
Countries 42
R-Squared (within) 0,823 Note: Robust standard errors are in parentheses. *significant at the 10% level; **significant at the 5% level;
***significant at the 1% level.
The estimated results of the fixed-effects 2SLS estimator are exhibited in Table 4
below. Column (1)-(4) shows the regressions relating to the FDI from China, US, EU
and the rest of Asia, respectively.
3 In order to assess the effect of the lagged GDP per capita variable on GDP per capita growth, we have to
correct the estimated coefficient of 0.812 by subtracting 1 and obtain -0,188. In a corresponding fixed-effects
regression, Busse et al., (2014:13) and Hoeffler (2002:42) find a coefficient of -0,132 and -0,230 respectively. The difference in magnitude might be due to the differences in sample size and time frame.

J.STUD.ECON.ECONOMETRICS, 2019, 43(3) 13
Table 4: Fixed-effects 2SLS estimated results
Dependent Variable: In real GDP per Capita
(1) (2) (3) (4)
Lagged Dep Var 0,715*** 0,710*** 0,719*** 0,727***
(0,084) (0,066) (0,068) (0,058)
ln Domestic Investment 0,013*** 0,012*** 0,013*** 0,013***
(0,005) (0,004) (0,005) (0,005)
ln Population Growth (-0,009 0,004 0,008 0,001
(0,015) (0,021) (0,018) (0,017)
In inflation 0,005 0,005 0,006 0,005
(0,007) (0,007) (0,008) (0,007)
ln Natural Resource Rents 0,006 0,005 -0,001 0,005
(0,015) (0,17) (0,016) (0,016)
ln FDI ROW -0,061 -0,101 -0,066* -0,070**
(0,038) (0,070) (0,039) (0,033)
ln Rule of Law 0,041* 0,040 0,031 0,035
(0,023) (0,039) (0,024) (0,027)
ln FDI China -0,182**
(0,084)
ln FDI US -0,027
(0,100)
ln FDI EU -0,019
(0,051)
In FDI ROA 0,061
(0,138)
In FDIj*TOT 0,000 0,000 0,000 0,000
(0,000) (0,000) (0,000) (0,000)
Observations 252 227 237 244
Countries 42 42 42 42
R-Squared (within) 0,803 0,794 0,789 0,800
Hausman/C test (p-value) 0,000 0,001 0,000 0,000
Hansen test (p-value) 0,874 0,238 0,271 0,340 Notes: The subscript j represents a specific source of FDI. FDIj*TOT is the interaction term between FDI from
a specific source and terms of trade. Robust standard errors are in parentheses. *significant at the 10% level; **significant at the 5% level; ***significant at the 1% level. In all regressions from column 1-4, specific FDIs
are instrumented using their first three lags and the p-values of the Hausman test are <10% implying that 2SLS
estimates are preferred to standard OLS fixed-effects estimates. All p-values of the Hansen test are >10%
implying that the instruments used are valid.
Across all specifications, the magnitude change in standard Solow model variables
is marginal relative to the result of the baseline specification presented in Table 3.
The results show that both the lagged dependent variable and domestic investment
maintained their expected signs and level of significance while the estimates of
population growth are still insignificant and small. The results also show that the

14 J.STUD.ECON.ECONOMETRICS, 2019, 43(3)
direct impact of FDI from China is negative and statistically significant at 5% while
the estimated coefficients of FDI from other sources are statistically insignificant.
Thus, a 1% increase in FDI from China can lead to a decrease in sub-Sahara Africa’s
real GDP per capita by approximately 0.18%. In terms of FDI from the rest of the
world, 1% rise in FDI from the rest of the world while separately controlling for EU
and the rest of Asia decreases Africa’s real per capita GDP with approximately 0.07%
on both cases. Rule of law coefficient enters the model with the expected sign across
all regressions albeit statistically significant only in the regression relating to Chinese
FDI. The estimated coefficients of all other variables including the interaction term
between FDI and terms of trade are statistically insignificant. Before we can turn to
the PTR estimations, we impose some restrictions in the equation (3) in order to
examine the robustness of the results obtained in Table 4.
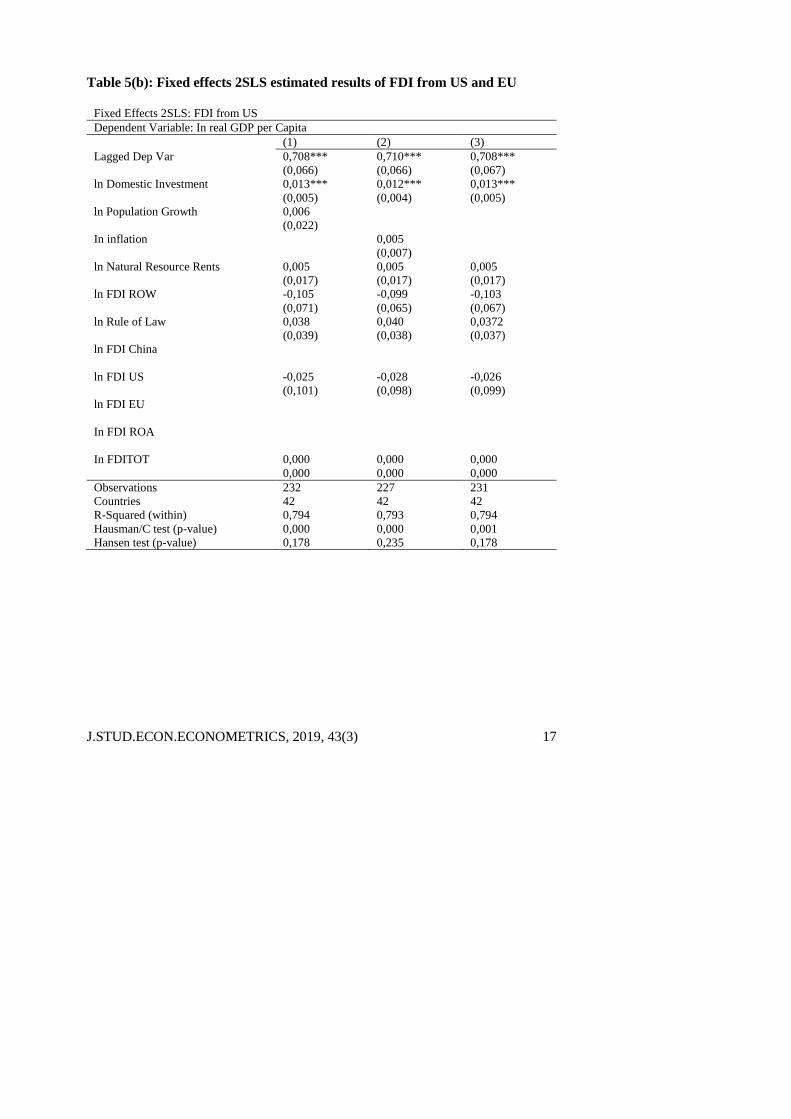
4.1 Robustness checks
Although Busse et al., (2014) show that including popuplation growth rate and
inflation rate as regressors for real GDP per capita in levels does not distort overall
results, we estimate equation (3) with restrictions to check if the same applies to our
data. First, we run equation (3) without inflation to check if there is no serial
correlation between changes in GDP deflator and real GDP per capita (column (1)).
The second restriction exclude population variable presumably population growth
might be correlated to the per capita component in the real GDP per capita (column
(2)). In column (3) we exclude both inflation rate and population growth rate. The
results are shown in the table 5(a) and 5(b) below. Table 5(a) shows the results of all
regressions with respect to FDI from China and the rest of Asia while table 5(b)
shows all estimations relating to FDI from US and EU.

J.STUD.ECON.ECONOMETRICS, 2019, 43(3) 15
Table 5 (a): Fixed effects 2SLS estimated results of FDI from China and the rest
of Asia
Fixed Effects 2SLS: FDI from China
Dependent Variable: In real GDP per Capita
(1) (2) (3)
Lagged Dep Var 0,714*** 0,717*** 0,716***
(0,016) (0,058) (0,061)
ln Domestic Investment 0,014*** 0,013*** 0,014***
(0,005) (0,005) (0,005)
ln Population Growth -0,008
(0,016)
In inflation 0,005
(0,007)
ln Natural Resource Rents 0,006 0,006 0,006
(0,015) (0,015) (0,015)
ln FDI ROW -0,063 -0,063 -0,063
(0,040) (0,038) (0,040)
ln Rule of Law 0,039* 0,039* 0,038*
(0,023) (0,023) (0,023)
ln FDI China -0,187** -0,167** -0,174**
(0,086) (0,087) (0,090)
ln FDI US
ln FDI EU
In FDI ROA
In FDITOT 0,000 0,000 0,000
(0,000) (0,000) (0,000)
Observations 256 252 256
Countries 42 42 42
R-Squared (within) 0,803 0,803 0,803
Hausman/C test (p-value) 0,000 0,000 0,000
Hansen test (p-value) 0,883 0,836 0,846

16 J.STUD.ECON.ECONOMETRICS, 2019, 43(3)
Table 5 (a): Fixed effects 2SLS estimated results of FDI from China and the rest
of Asia (continued)
Fixed Effects 2SLS: FDI from the rest of Asia
Dependent Variable: In real GDP per Capita
(1) (2) (3)
Lagged Dep Var 0,726*** 0,727*** 0,726***
(0,059) (0,058) (0,060)
ln Domestic Investment 0,013*** 0,013*** 0,013***
(0,005) (0,005) (0,005)
ln Population Growth 0,002
(0,018)
In inflation 0,005
(0,007)
ln Natural Resource Rents 0,005 0,005 0,005
(0,016) (0,016) (0,016)
ln FDI ROW -0,073** -0,070** -0,073**
(0,036) (0,033) (0,035)
ln Rule of Law 0,033 0,035 0,033
(0,027) (0,027) (0,027)
ln FDI China
ln FDI US
ln FDI EU
In FDI ROA 0,051 0,057 0,0454
(0,138) (0,132) (0,133)
In FDITOT 0,000 0,000 0,000
(0,000) (0,000) 0,000)
Observations 248 244 248
Countries 42 42 42
R-Squared (within) 0,801 0,801 0,801
Hausman/C test (p-value) 0,000 0,000 0,000
Hansen test (p-value) 0,390 0,404 0,415 Notes: The subscript j represents a specific source of FDI. FDIj*TOT is the interaction term between FDI from
a specific source and terms of trade. Robust standard errors are in parentheses. *significant at the 10% level;
**significant at the 5% level; ***significant at the 1% level. In all regressions from column 1-4, specific FDIs are instrumented using their first three lags and the p-values of the Hausman test are <10% implying that 2SLS
estimates are preferred to standard OLS fixed-effects estimates. All p-values of the Hansen test are >10%
implying that the instruments used are valid.
J.STUD.ECON.ECONOMETRICS, 2019, 43(3) 17
Table 5(b): Fixed effects 2SLS estimated results of FDI from US and EU
Fixed Effects 2SLS: FDI from US
Dependent Variable: In real GDP per Capita
(1) (2) (3)
Lagged Dep Var 0,708*** 0,710*** 0,708***
(0,066) (0,066) (0,067)
ln Domestic Investment 0,013*** 0,012*** 0,013***
(0,005) (0,004) (0,005)
ln Population Growth 0,006
(0,022)
In inflation 0,005
(0,007)
ln Natural Resource Rents 0,005 0,005 0,005
(0,017) (0,017) (0,017)
ln FDI ROW -0,105 -0,099 -0,103
(0,071) (0,065) (0,067)
ln Rule of Law 0,038 0,040 0,0372
(0,039) (0,038) (0,037)
ln FDI China
ln FDI US -0,025 -0,028 -0,026
(0,101) (0,098) (0,099)
ln FDI EU
In FDI ROA
In FDITOT 0,000 0,000 0,000
0,000 0,000 0,000
Observations 232 227 231
Countries 42 42 42
R-Squared (within) 0,794 0,793 0,794
Hausman/C test (p-value) 0,000 0,000 0,001
Hansen test (p-value) 0,178 0,235 0,178

18 J.STUD.ECON.ECONOMETRICS, 2019, 43(3)
Table 5(b): Fixed effects 2SLS estimated results of FDI from US and EU
(continued)
Fixed Effects 2SLS: FDI from EU
Dependent Variable: In real GDP per Capita
(1) (2) (3)
Lagged Dep Var 0,716*** 0,720*** 0,715***
(0,069) (0,068) (0,070)
ln Domestic Investment 0,014*** 0,013*** 0,014***
(0,006) (0,005) (0,006)
ln Population Growth 0,009
(0,019)
In inflation 0,006
(0,008)
ln Natural Resource Rents -0,0002 -0,001 0,0001
(0,016) (0,015) (0,016)
ln FDI ROW -0,068* -0,062* -0,063*
(0,041) (0,034) (0,035)
ln Rule of Law 0,029 0,032 0,030
(0,024) (0,025) (0,025)
ln FDI China
ln FDI US
ln FDI EU -0,019 -0,026 -0,028
(0,050) (0,048) (0,048)
In FDI ROA
In FDITOT 0,000 0,000 0,000
(0,000) (0,000) (0,000)
Observations 241 237 241
Countries 42 42 42
R-Squared (within) 0,789 0,789 0,789
Hausman/C test (p-value) 0,000 0,000 0,000
Hansen test (p-value) 0,281 0,278 0,290 Notes: The subscript j represents a specific source of FDI. FDIj*TOT is the interaction term between FDI from
a specific source and terms of trade. Robust standard errors are in parentheses. *significant at the 10% level;
**significant at the 5% level; ***significant at the 1% level. In all regressions from column 1-4, specific FDIs are instrumented using their first three lags and the p-values of the Hausman test are <10% implying that 2SLS
estimates are preferred to standard OLS fixed-effects estimates. All p-values of the Hansen test are >10%
implying that the instruments used are valid.

J.STUD.ECON.ECONOMETRICS, 2019, 43(3) 19
Across all the regressions, our results indicate same qualitative outcome. In addition,
the change in the estimated coefficients of all variables is marginal. Hence, we are
convinced that correlation issues are not a major problem and that our model is valid.
We can now proceed to the PTR analysis.
4.2 PTR analysis
This study uses terms-of-trade as the threshold variable. The variable is summarised
in Table 6. Row (1) exhibit terms of trade in logarithms while row (2) presents the
corresponding values in their raw form as extracted from the WID (2019). Terms-of-
trade above 1% indicate an improvement in the value of export portfolio otherwise a
worsening.
Table 6: Summary of the threshold variable
Variable Min 25% Quantile 50% Quantile 75% Quantile Max
In terms of trade (1) -0,590 -0,097 0,028 0,270 1,465
Terms of trade (2) 0,554 0,908 1,028 1,309 4,329 Notes: Authors own calculation based on terms of trade data from WID (2019).
In the context of this study, improvement in terms of trade implies increase in export
value hence export upgrading. The results reveal that on average, terms to trade in
sub-Sahara Africa does not exceed 4,33% while the minimum is 0,55%.
Table 7 presents the results of the hypothesis of no threshold effects and the tests to
determine the number of thresholds. These estimation procedures were conducted
separately for each source of FDI.

20 J.STUD.ECON.ECONOMETRICS, 2019, 43(3)
Table 7: Test for threshold effects and number of thresholds
Chinese FDI US FDI EU FDI ROA FDI
Test for Single threshold(two regimes)
F1 8,99 24,94 16,35 3.61
P-Value 0,160 0,020** 0,020* 0.680
1% critical values 14,28 38,66 17,02 15.09
5% critical values 12,41 18,78 13,72 13.09
10% critical values 10,88 13,09 12,36 10.95
Test for Double threshold(three regimes)
F2 8,86 14,67
P-Value 0,160 0,040**
1% critical values 22,33 24,94
5% critical values 16,37 11,37
10% critical values 11,65 10,15
Test for Tripple threshold(four regimes)
F3 6,82
P-Value 0,760
1% critical values 35,60
5% critical values 27,36
10% critical values 19,92 Notes: P-values and critical values are computed from 50 bootstrap simulations. F1 represents the Fisher type
statistic associated with the test of H0 of no threshold against a single threshold. F2 corresponds to the test of a single threshold against a double threshold and F3 corresponds to the test of double threshold against a triple
threshold. *significant at the 10% level; **significant at the 5% level; ***significant at the 1% level.
The test statistic 𝐹1 of the regressions relating to FDI from US and EU are both
significant at 5% with an equal corresponding bootstrap p-value of 0.02 while the
test statistics 𝐹1 of both China and the rest of Asia are statistically insignificant. These
results imply that the hypothesis of no threshold effects is rejected for the regression
relating to FDI from US and EU while accepted for China and the rest of Asia. Hence,
the estimated results in Table 4 holds for FDI from China and the rest of Asia.
For the FDIs which passed the PTR test, the test statistics 𝐹2 of the regression
relating to EU is statistically significant at 5% while that of the US is statistically
insignificant. The test statistic for a third threshold 𝐹3 of FDI from EU is however
statistically insignificant. Thus, the results imply one threshold (two regimes) for
PTR analysis of FDI from the US and two thresholds (three regimes) for FDI from
the EU. In terms of threshold parameters, the results are exhibited in Table 8 below.

J.STUD.ECON.ECONOMETRICS, 2019, 43(3) 21
Table 8: Terms of trade threshold level estimates
Point
Estimate
95% Confidence
Level
99% Confidence
Level
US FDI Single threshold 0,077 [0,057;0,084] [0,057;0,084]
EU FDI Single threshold 0,077 [0,057;0,084] [0,057;0,084]
Double threshold 0,020 [0,004;0,026] [0,001;0,026]
As shown in Table 8 above, FDI from the US is analyzed in two regimes demarcated
with a threshold point estimate of 0.077. Whilst FDI from the EU is analyzed in three
regimes separated by threshold point estimates of 0.020 and 0.077. The point
estimates of 0.020 and 0.077 correspond to the terms-of-trade threshold levels of
1.02% and 1.08%, respectively. Thus for EU FDI, the first, second and third regime
is such that; 𝑇𝑂𝑇𝑖𝑡 < 1.02, 1.02 ≤ 𝑇𝑂𝑇𝑖𝑡 < 1.08 and 𝑇𝑂𝑇𝑖𝑡 ≥ 1.08, respectively.
For US FDI, the first and second regimes are respectively separated as; 𝑇𝑂𝑇𝑖𝑡 ≤ 1.08
and 𝑇𝑂𝑇𝑖𝑡 > 1.08. The results also show that the asymptotic confidence intervals
for the thresholds are equal at 95% and 99% across all the estimations, indicating
certainty about the nature of this division.
The main results of the PTR analysis are presented in Table 9. Column (1) reports
the results relating to FDI from the US while results in column (2) relate to the FDI
from the EU. Notwithstanding uncertainty about potential correlation arising from
population growth and inflation variable, we exclude both variables in column (3)
and (4). Accordingly, column (3) and (4) are restricted regressions of column (1) and
(2), respectively.

22 J.STUD.ECON.ECONOMETRICS, 2019, 43(3)
Table 9: PTR estimated results
Dependent Variable: In real GDP per Capita
(1) (2) (3) (4)
Lagged Dep Var 0,754*** 0,791*** 0,753*** 0,789***
(0,039) (0,040) (0,040) (0,041)
ln Domestic Investment 0,012*** 0,013*** 0,013*** 0,013***
(0,004) (0,005) (0,004) (0,005)
ln Population Growth 0,009 0,010
(0,005) (0,006)
ln Natural Resource Rents 0,007 0,013 0,007 0,013
(0,009) (0,008) (0,009) (0,008)
In inflation -0,0001 -0,0001
(0,0002) (0,0002)
ln FDI ROW -0,137*** -0,094** -0,143*** -0,096**
(0,043) (0,037) (0,043) (0,037)
ln FDI US 0,062 0,060
(0,059) (0,062)
In FDI EU -0,012 -0,024
(0,050) (0,050)
ln 𝐹𝐷𝐼𝑗𝛪(,) 𝛽1 -0,073** 0,002 -0,072** 0,001
(0,032) (0,029) (0,032) (0,029)
𝛽2 0,031 -0,116*** 0,033 -0,112***
(0,025) (0,033) (0,026) (0,033)
𝛽3 0,020 0,023
(0,023) (0,023)
Observations 350 350 350 350
Countries 35 35 35 35
R-Squared (within) 0,866 0,870 0,866 0,870 Notes: The subscript 𝑗 denotes FDI from a specific source while 𝛪(.) represents the indicator/transition function.
For EU FDI, 𝛽1: (𝑇𝑂𝑇𝑖𝑡 < 0.020), 𝛽2: (0.020 ≤ 𝑇𝑂𝑇𝑖𝑡 < 0.077) and 𝛽3: (𝑇𝑂𝑇𝑖𝑡 ≥ 0.077) while for US
FDI, 𝛽1: 𝑇𝑂𝑇𝑖𝑡 ≤ 0.077 and 𝛽2: 𝑇𝑂𝑇𝑖𝑡 > 0.077. Robust standard errors are in parentheses.*significant at the 10% level; **significant at the 5% level; ***significant at the 1% level.
𝛽1, 𝛽2, and 𝛽3 respectively correspond to the first, second regime for both sources of
FDI and third regime for EU FDI only. Results in column (1) reveal that 𝛽1 is
negative and significant at 5% while 𝛽2 is positive albeit statistically insignificant. In
column (2), 𝛽1 and 𝛽3 are positive however statistically insignificant while 𝛽2 is
negative and highly insignificant. All the restricted regressions are robust to the main
results.

J.STUD.ECON.ECONOMETRICS, 2019, 43(3) 23
4.3 Discussion of the main parameters
Accepting the hypothesis of no threshold effects in regressions relating to FDI from
China and the rest of Asia serves as a confirmation that FDI from the sources does
not bear significant impact on growth of all countries in sub-Sahara Africa through
export upgrading. However, FDI from US and EU seem to have a significant impact
on growth through export upgrading only below certain thresholds of terms-of-trade.
That is, the impact of FDI from the US is negative on growth of all sub-Sahara
African countries with terms-of-trade equal to 1.08% and below. In terms of FDI
from EU, the impact on growth is statistically insignificant in all countries with
terms-of-trade less than or equal to 1.02% yet negative in all countries with terms-
of-trade ranging between 1.02% and 1.08%. As the terms-of-trade improves beyond
1.08%, the estimated coefficients of both FDI from US and US turn positive, albeit
insignificant. Table 10 classifies sub-Sahara Africa countries into regimes as
determined by the results.
Table 10: Classification of sub-Sahara Africa according to terms-of-trade
regimes
First segment: 𝑻𝑶𝑻 <𝟏. 𝟎𝟐%
Second segment:
𝟏. 𝟎𝟐% ≤ 𝑻𝑶𝑻 < 𝟏. 𝟎𝟖%
Third segment: 𝑻𝑶𝑻 ≥𝟏. 𝟎𝟖%
Botswana;
Cape Verde;
Central Africa Republic;
Comoros;
Eritea;
Guinea-Bissau;
Kenya;
Lesotho;
Madagascar;
Malawi;
Senegal;
Sychelles;
Sierra Leone;
Togo;
Zimbabwe.
Burkina Faso;
Gambia;
Mozambique;
Swaziland;
Uganda.
Angola;
Benini;
Burundi;
Cameroon;
Chad;
Congo;
Cote D'Ivoire;
DRC;
Equatorial Guinea;
Ethopia;
Gabon;
Ghana;
Guinea;
Liberia;
Mali;
Niger;
Nigeria;
Rwanda;
Sao Tome & Principe;
South Africa;
Tanzania;
Zambia.

24 J.STUD.ECON.ECONOMETRICS, 2019, 43(3)
Generally, our results indicate that sub-Sahara African countries are less
industrialized to absorb production technology embodied in either of FDI sources
analysed in this study. This is confirmed first, by statistically insignificant interaction
term between FDI and terms-of-trade across all the regressions implying that the
transmission of technology embodied in FDI towards quality and quantity
enhancement of export commodities is statistically mirage. In line with Poncet et al., (2012), it is highly possible that export upgrading is reflected only in the
sophisticated products produced by the MNCs. The latter argued that in such cases,
it is rare for FDI-induced export upgrading to contribute significantly to growth
particularly in developing countries.
Second, we develop theoretical argument to show that industrial policy heterogeneity
in sub-Sahara African countries may be one of the explanation for the results
obtained using fixed-effects 2SLS. However, the results obtained using PTR still
confirm that sub-Sahara African countries are far yet to reach a threshold at which
FDI-induced export upgrading can contribute positively to growth. We use terms-of-
trade as a threshold variable. Our assumption being that countries with worsening
(less than 1%) terms-of-trade are associated with poor industrialization as a result
they can hardly enhance quality and quantity of their products for export market. On
the other dimension, countries with improving (more than 1%) terms-of-trade are
assumed to have capacity to improve the quality and quantity of their products for
export market. What is not known however, is the threshold level at which
technology embodied in FDI from various sources can transmit to growth in sub-
Sahara Africa through export upgrading.
The first segment of Table 10 shows countries with worsening terms-of-trade
implying that their industrialization as determined by the export value is very low.
Inward stock of FDI from EU appears to be less in these countries hence, the
insignificant estimated coefficient of FDI from the source in this segment. FDI from
the latter seem to flow towards countries with potential to industrialize as indicated
by improving terms-of-trade. However, all countries falling within the second
segment are negatively affected. Although the inward stock of FDI from US is
statistically significant in both the first and second regime, the impact is negative. In
the empirical work of Wacker et al., (2016), negative effects of FDI on export
upgrading and associated terms-of-trade realized in South Asia were attributed
mainly by the shortage of skilled human capital. Likewise, separate studies
conducted by Zhu et al., (2013) and Fu & Li (2010) provide evidence that skilled
human capital is a vital element of FDI-induced-export upgrading in low-income
countries. In line with these studies, we relate our findings to scarcity of skilful labor

J.STUD.ECON.ECONOMETRICS, 2019, 43(3) 25
required to absorb technology embodied in FDI. Furthermore, it can also be argued
that less industrialized countries specialize in less-skills intensive products which are
not competitive in the export market.
Although a threshold level of 1.08% provides direction to cartel FDI-induced export
upgrading and associated terms-of-trade so as to overcome the negative growth
effects of FDI from both US and EU, the challenge still remains that sub-Sahara
African countries are less industrialized. From the list of countries provided in the
third segment of Table 10, Angola has the highest average terms-of-trade value of
approximately 2.21% and this might probable due to oil exports. Nonetheless, the
value is still very low relative to other developing nations outside Africa for instance
China, India, Russia and Brazil.
Falling within the third segment are countries rich in oil and other mineral resources
that are highly demanded in the world commodity market. This result concurs with
several studies including Chen et al., (2015) and Asiedu (2013) in that FDI from both
China and Western investors in Africa is earmarked for natural resources and
therefore the mining industry in the region is highly dominated by multinational
companies (MNCs). Could this be the case, there will be literally zero imitation of
technologies embodied in FDI (Demena et al., 2018) because domestic firms in sub-
Sahara Africa hardly invest in heavy extraction projects due to capital constraints.
This also explains why export upgrading is reflected only in the sophisticated
products produced by the MNCs. Precisely, FDI-induced export upgrading
experienced by these countries equates to oil and mineral resources imported by both
US and EU from their mining investments in sub-Sahara Africa. In addition,
absorption of knowledge and technology utilized in oil and mineral extraction
projects require highly skilled labor and such labor seem to be scarce in some sub-
Sahara African.
Quality and quantity of commodities in the host country can also be improved when
skills are transferable through physical human capital mobility from the MNCs to the
domestic firms and entrepreneurial ventures (Demena et al., 2018). However, given
the industry which foreign investors seem to be targeting, skills transfer is also
constrained due to high wage differentials. MNEs offer high wages relative to
domestic companies and the wage differentials are high in developing countries
(Aitken et al., 1996).

26 J.STUD.ECON.ECONOMETRICS, 2019, 43(3)
5 Conclusion and recommendations
The recent surge of FDI from both traditional and new emerging investors in Africa
has spawned substantial debate in particular on the growth effects of FDI from China
as a new emerging investor in Africa. Most of the studies have mainly focused on
the approach of measuring the impact of FDI from China as a capital input in the
growth model of the continent. However, literature provides ample evidence in that
FDI can serve simultaneously as a capital and technology input. This paper intends
to contribute to the literature by analyzing how production technology embodied in
FDI from China, US, EU and the rest of Asia can spillover to growth in sub-Sahara
Africa through export upgrading. We use terms-of-trade to proxy for export
upgrading because it quantifies the improvement of export value of the merchandise
in the economy. The findings of this study show that FDI from China and the rest of
Asia does not influence growth in all sub-Sahara African countries through export
upgrading. Whereas FDI from US and EU seem to have a significant impact on
growth through export upgrading only below certain thresholds of terms-of-trade.
Precisely, all less industrialized countries as reflected by terms-of-trade worse than
1.08% are negatively affected by FDI from the US. EU seem to invest only in
countries with potential to industrialize although countries with terms-of-trade
ranging between 1.02% and 1.08% are negatively affected. As the terms-of-trade
improve beyond 1.08%, the growth effects of FDI from both EU and US turns
positive albeit, insignificant.
Our results confirm that sub-Sahara African countries are less industrialized to
absorb production technology embodied in either of FDI sources analysed in this
study. The threshold level obtained is crucial for FDI-induced-export upgrading
development policies in sub-Sahara Africa because it provides direction for
mitigation procedures. Thus, a threshold level of 1.08% provides direction to cartel
FDI productivity spillover effects on export upgrading so as to overcome the negative
growth effects of FDI from the US and EU in sub-Sahara Africa. The mitigation
procedures can include but not limited to human capital development and attraction
of diversified FDI. Absorption of production know-how embodied in FDI is effective
through the streams of the skilled and educated labor force. On the other dimension,
FDI attracted towards economic sectors in which domestic firms can be able to
imitate production processes from MNCs and compete with them enhances
sophistication. Given the availability of data, further studies should be directed
towards analyzing FDI-induced-export upgrading in a specific industries of the host
economy. Future studies can also look on the possibility to combine instrumental
variables estimation techniques and the PTR model into one estimation technique

J.STUD.ECON.ECONOMETRICS, 2019, 43(3) 27
which can simultaneously account for endogeneity issues and heterogeneity among
the cross-sections.
References Aghion, P., Akcigit, U. & Howitt, P. 2015. The Schumpeterian Growth Paradigm. Annual Review
of Economics, 7, 557–575. https://www.brown.edu/Departments/Economics/Faculty/Peter_
Howitt/publication/Schumpeterian_Paradigm.pdf.
Aghion, P. & Howitt, P. 1992. ‘A model of growth through creative destruction’, Econometrica,
60(2), 323-351.
Aitken, B.J., Harrison, A.E. & Lipsey, R.E. 1996. ‘Wages and foreign ownership : A comparative
study of Mexico, Venezuela and the United States’, Journal of International Economics, 40, 345-
371.
Asiedu, E. 2013. Foreign direct investment , natural resources and institutions. Working Paper
International Growth Center, (3), 1-38. https://www.theigc.org/wp-content/uploads/2014/09/
Asiedu-2013-Working-Paper.pdf.
Bassanini, A. & Scarpetta, S., 2001. The driving forces of economic growth: panel data evidence
for the OECD countries. OECD Economic Studies, 33(33), pp.9–56. http://hal.archives-
ouvertes.fr/halshs-00168383/.
Busse, M., Erdogan, C. & Muhlen, H. 2014. China’s impact on Africa - The role of trade, FDI and
Aid. http://webcache.googleusercontent.com/search?q=cache:9f7v2mm_oBsJ:2015.essa.org.za/
fullpaper/essa_2965.pdf+&cd=6&hl=en&ct=clnk&gl=za.
Chen, W., Dollar, D. & Tang, H. 2015. Why is China investing in Africa? Evidence from the firm
level, The World Bank Economic Review, August, lhw049. https://academic.oup.com/wber/article-
lookup/doi/10.1093/wber/lhw049.
Collier, P. & Goderis, B. 2009. Structural policies for shock-prone developing countries. Munich
Personal RePEc Archive, (17311). https://ssrn.com/abstract=1473725.
Davies, R.B. 1987. ‘Hypothesis testing when a nuisance parameter is present only under the
alternative’, Biometrika, 74(1), 33-43. http://robertnz.com/pdf/nuisance2.pdf.
Demena, B.A. & Murshed, S.M. 2018. ‘Transmission channels matter: Identifying spillovers from
FDI’, Journal of International Trade and Economic Development, 27(7), 701-728.
doi.org/10.1080/09638199.2018.1439083.
Donou-Adonsou, F. & Lim, S. 2018. ‘On the importance of Chinese investment in Africa’, Review
of Development Finance, 8(1), 63-73. doi.org/10.1016/j.rdf.2018.05.003.
Fu, M. & Li, T. 2010. Human capital as a determinant of FDI technology spillovers and its
threshold effects in China : An analysis based on multiple productivity estimates, Vienna.
Hansen, B.E. 1996. ‘Inference when a nuisance parameter is not identified under the null
hypothesis’, Econometrica, 64(2),413-430.

28 J.STUD.ECON.ECONOMETRICS, 2019, 43(3)
Hansen, B.E. 1999. ‘Threshold effects in non-dynamic panels: Estimation , testing , and inference’,
Journal of Econometrics, 93, 345-368.
Harding, T. & Javorcik, B.S. 2012. ‘Foreign direct investment and export upgrading’, The Review
of Economics and Statistics, 94(4), 964-980.
Hauk, W.R. 2016. ‘Endogeneity bias and growth regressions’, Journal of Macroeconomics.
https://www.researchgate.net/publication/308517778_Endogeneity_and_Growth_ Regressions.
Hoeffler, A.E. 2002. ‘The augmented Solow model and the African growth debate’, Oxford Bulletin
of Economics and Statistics, 64(2), 135-158+84. doi.org/10.1111/1468-0084.00016
Mankiw, N., Romer, D. & Weil, D. 1992. ‘A contribution to the empirics of economic growth’,
Quarterly Journal of Economics, 107, 407-38.
Mattoo, A. & Subramanian, A. 2009. Criss-crossing globalization: Uphill flows of skill-intensive
goods and foreign direct investment. Center for Global Development Working Paper, (176).
https://www.files.ethz.ch/isn/104511/1422581_file_Mattoo_Subramania_Uphill_Skill.pdf.
Mencinger, J. 2003. Direct and indirect effects of FDI on current account. EIPF and University of
Ljubljana. https://docplayer.net/6986776-Direct-and-indirect-effects-of-fdi-on-current-
account.html
Neuhaus, M. 2006. The impact of FDI on economic growth: An analysis for the transition countries
of central and Eastern Europe M. Miller, Werner A., Bihn, ed., London NWl 9NB: Physica-Verlag
A Springer Company.
Poncet, S. & Starosta de Waldemar, F. 2012. Export upgrading and growth: The prerequisite of
domestic embeddedness. CEPII,WP, 1-40.
Romer, P. 1990. ‘Endogenous technological change’, Journal of Political Economy, 98, S71-8103.
Romer, P. 1993. ‘Idea gaps and object gaps in economic development’, Journal of Monetary
Economics, 32, 543-573.
Romer, P. 1986. ‘Increasing returns and long-run growth’, Journal of Political Economy, 94, 1002-
1037.
Solow, R. 1956. ‘A contribution to the theory of economic growth’, Quarterly Journal of
Economics, 70, 65-94.
Swan, T. 1956. ‘Economic growth and capital acumulation’, Economic Record, 32, 334-361.
Sy, A. 2014. Is Africa at a historical crossroads to convergence? Africa Growth Initiative,The
Brookings Institute, 11–21. https://www.brookings.edu/wp-content/uploads/2016/07/tt20-africa-
convergence-sy.pdf.
UNCTAD. 2005. Globalization of R & D and developing countries preface & overview. United
Nations conference on trade and development Geneva, UNCTAD/ITE(6).
Wacker, K.M., Grosskurth, P. & Lakemann, T. 2016. ‘Foreign direct investment, terms of trade,
and quality upgrading: What is so special about South Asia?’, Asian Development Review, 33(1),
28-55.

J.STUD.ECON.ECONOMETRICS, 2019, 43(3) 29
Wacker, K.M., Grosskurth, P. & Lakemann, T. 2014. Terms of trade, foreign direct investment,
and development: A case of intra-Asian “Kicking away the ladder”? ADB Working Paper Series
on Regional Economic Integration, (122).
Zhu, S. & Fu, X. 2013. ‘Drivers of export upgrading’, World Development, 51, 221-233.
dx.doi.org/10.1016/j.worlddev.2013.05.017.

30 J.STUD.ECON.ECONOMETRICS, 2019, 43(3)