Embed Size (px)
Citation preview

������#� !�!��������
�������������� ��
��������������
�������� ������
������ !�"���$%$%
&��"'((�����)����� ("�"���(�$%$%
�������������*����+���������,
-%.%+�����&�������/����
��0)��� �1+�%2-3$
4�����5�����
���������� �������������������������������� ����������������������������������������������������
������ �� ��!��"����� ����� ���������������������������������#��� ������$������������������
����������������%������!��&������������������������������������������������������������
���������'��������(����)���*������
+���������'���� ������������(�!�������������� ����$����������� ����������������&�����������&����
�!�����$�����)������,������!��������&���������)��������������������������������������$�+����������
$�����������������

���������������� ���
������������������������� ������
��������� !�"����$%$%
4�����52%%-
4����4%1�2
�������
���&�������������1���� ��������������������&��"�5���&�������������������/������1)��
���� �����������������������&��"�5���&�������������������0����������&��"�66�����7"������
�8���������)��&����������&�������������������������������������&��7�����8���� ����)����8�
�&�"�����/��88����8����������������)����5�7"������&�"�����/����������9���� ������������&�"�
�&��� ���/��88����8��������������� ����)����8������0���������������/��������������������
8��/������� ����1�&��&�7"������&��� ���/����������&�")���������������������� ���������
����0��������������9������5��88����������&��0"����8��������������� ����)����8����7"����
�&� ��� � �����9������5 /�������� �� �&� ���������9���� ��� ����������� �&��� �����9������5
��88������� �� �&� ���������9)����8 ���������&�" ��� )� �7"������ )5 "�������� 8������ :���& ��
��00����0;�&��&������0��������������������9���������������������������������� ����
�������������� �������� ������
<-%<�����8�����,��� ��"���0����8�����0���
��"���0����8�����0��� 32=��������������
����0���&����� � ,��/������/�����5
,���/��1,%3=..93.-> ��0)��� �1+�%2-3$
������ ������� ������������
)����������������?����0���&���� ������
� ������?��6�����&��/�������

2
I. Introduction
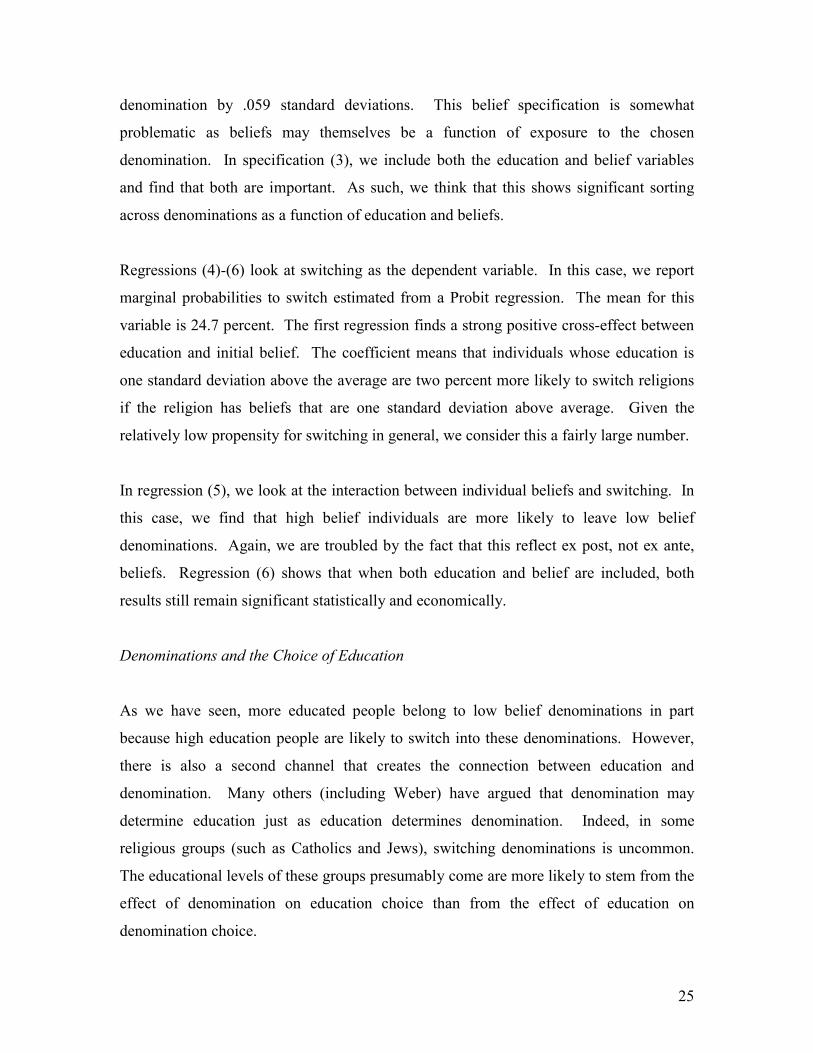
In the United States, church attendance rises with education.2 Fifty percent of college
graduates born after 1945 attend church more than �several times per year.�3 Only thirty
six percent of high school dropouts, born during the same period, attend church that
often. Figure 1 shows the mean attendance level by level of education. In a univariate
regression, which does not control for denomination, a one-standard deviation increase in
schooling raises church attendance by .12 standard deviations (see Table 1). When we
control for other factors, the relationship between education and religious attendance gets
stronger. In many multivariate regressions, education is the most statistically important
factor explaining church attendance.
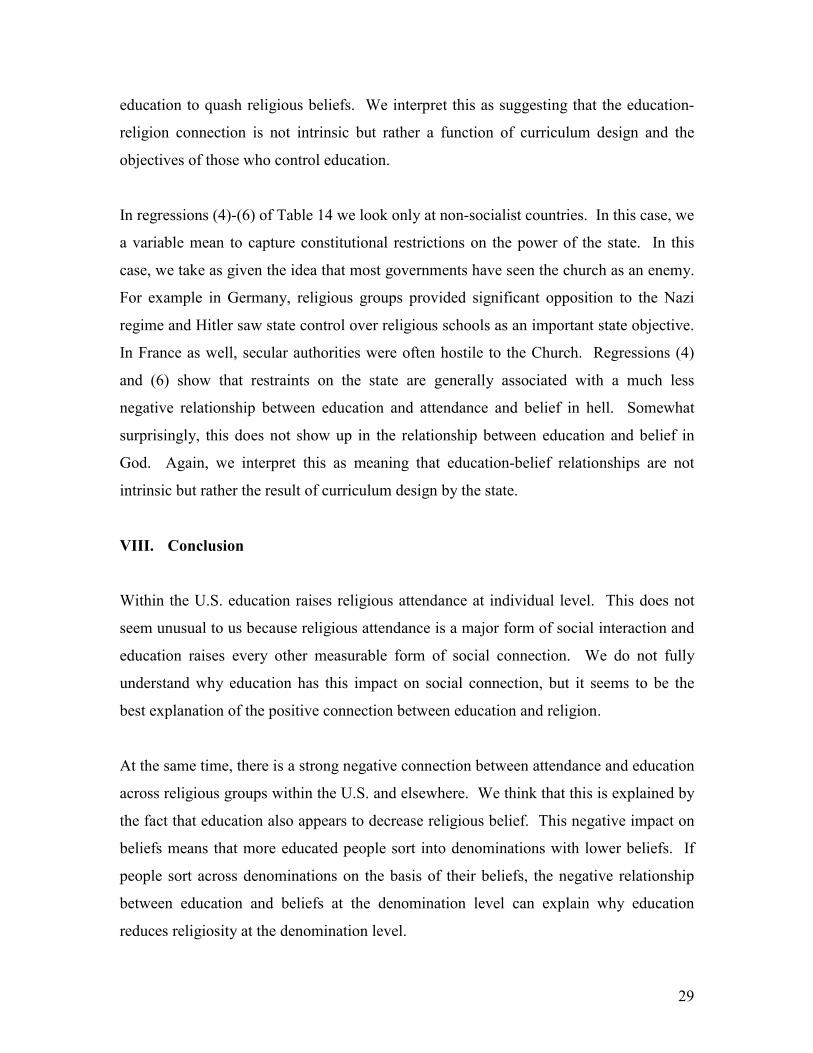
But across religious groups or denominations, church attendance declines with education.
In the most educated Christian denomination, Episcopalianism, the median person attends
church �several times per year.� In the least educated major denomination, the Baptist
groups, the median person attends church once per month. In the General Social Survey,
members of the group with the least education, "other protestants", have the most
religious attendance. (This group includes Protestants who are not members of a major
denomination such as Mormons, Pentacostalists and Jehovah�s Witnesses). Figure 2
shows the relationship between average education and average religious attendance
across denominations. The correlation between education and religious attendance across
denominations is negative 86 percent. The goal of this paper is to understand the
completely opposite relationship between education and religion at the individual and the
denomination level.
Furthering the puzzle, the relationship between education and religious attendance
fluctuates highly across countries. In many developed countries, such as England and
2 Iannaconne (1998) provides an excellent introduction to the economics of religion, and shows this fact in Table 1 of his paper. 3 Our primary evidence on religious attendance is the General Social Survey, where respondents describe their attendance by putting their attendance in categories such as attending several times per year. Mean attendance levels are calculated by averaging categorical variables as explained in the data description section.

3
France, there is the same positive relationship between education and religion as in the
U.S.4 In most countries there is no significant relationship between education and
religious attendance. In the former socialist countries, the individual-level connection
between education and attendance is generally strongly negative. Figure 3 provides a
histogram of these coefficients across 69 countries.
A switch in the sign of a coefficient between individual level and group level regressions
can occur when (1) there is sorting across groups on the basis of an unobservable variable
which negatively predicts the outcome in question, and (2) there is a negative correlation
between the observable that positively predict this outcome and these unobservables.5
We present a framework that suggests that when these conditions are met, a sign switch
between macro and micro regressions will not be uncommon. This type of sign switch is
presumably rare in practice because observable variables that positively predict outcomes
are usually positively correlated with unobservable variables that also positively predict
outcomes.
To use this logic to understand the education-religion puzzle, we need to recognize that
education has two important effects on religious attendance: education increases the
proclivity towards social group membership and decreases belief in the returns to
religious activity� the key unobservable in this case. The positive social effect of
education explains the positive education-religion relationship at the individual level.
The negative effect of education on beliefs� coupled with strong sorting by beliefs
across denominations� explains the negative denomination-level relationship between
education and attendance.
Religious attendance is a social activity; churchgoing and religious group participation
requires significant interaction with community members.6 All serious discussions of
4 For example, in England a one standard deviation increase in education raises religious attendance by .22 standard deviations. In France, a one standard deviation increase in education raises religious attendance by .12 standard deviations. 5 In many situations with social interactions, there will often exist a social multiplier which will tend to make macro-relationships stronger than micro-relationships (Glaeser and Scheinkman, 2000), but in this case there is not only no social multiplier, but we see a sign reversal. 6 Durkheim (1995) is the classic discussion of religion as a social activity.

4
social capital in the U.S., from De Tocqueville to Putnam (2000), acknowledge that
religious activity is one major form of American social interaction. Furthermore, social
group membership almost universally rises with education. The positive relationship
between education and group membership (and many other forms of socializing) is as
strong as the Beckerian (1964) connection between education and wages. It appears
within the U.S. in almost every form of group membership.7 There is a positive
connection between schooling and social group membership in almost all 69 countries
where we have micro-data on education and group membership.8
Other facts support our view that the positive effect of education on religious attendance
is just another example of the positive effect of education on almost all forms of social
interaction. First, there is no connection between education and private forms of worship,
such as prayer. Second, there is a strong positive correlation between church attendance
and other measures of social activity. Third, if we only look at relatively asocial people
(defined as individuals who are not members of any formal groups), the connection
between education and religious attendance drops by two-thirds. As such, we think that
the positive education-religion relationship can be seen as a natural result of the general
relationship between education and social group membership.
Understanding the second part of the puzzle� the negative relationship between
education and religious attendance at the denomination level� requires an understanding
of inter-denominational differences. Denominations are fundamentally defined by their
religious doctrines. While there are often significant social differences across
denominations, denominations are ultimately defined by religious beliefs. Individual
denominations appear to be able to shelter a wide range of worship styles (e.g. High vs.
Low Episcopalians) and demographic groups, but people within a denomination
generally share a core set of religious beliefs. New denominations usually form around
7 The sole exception in the General Social Survey is membership in labor unions, which declines with years of schooling. 8 This positive connection may be a real treatment effect of schooling. Perhaps, people learn social skills in school. Alternatively, the positive relationship may exist because omitted variables, such as patience, increase the returns to both schooling and the formation of social networks (as in Glaeser, Laibson and Sacerdote, 2000).

5
leaders who have beliefs that differ from the beliefs of existing denominations.9 In many
cases, such as the Baptists or the Presbyterians, denominations originate among social
groups that are quite different from the social groups that currently make up these
denominations. We should therefore think the social aspects of denominations as
developing around denomination-level beliefs.
We focus on beliefs about the temporal and spiritual returns to religious activity.
Different perceived returns to religion are a natural explanation for different levels of
religious activity, as in Azzi and Ehrenberg (1975). High attendance denominations (e.g.
Mormons, Baptists, Catholics) strongly affirm rewards to religious adherence, usually in
the afterlife. For example Evans (1975) describes the Mormon belief that ��exaltation�
(with the highest eternal opportunities) must be earned by obedience to laws, ordinances,
and commandments of the Kingdom.� Hendricks (1975) writes of Catholic theology that
�the more general belief is that unbaptized babies are forever cut off from heaven.�10
This is not surprising as the Catholic Catechism (1995) states that �the Church does not
know of any means other than Baptism that assures entry into eternal beatitude.�
The doctrines of low attendance denominations (e.g. Episcopalians, Reform Jews) often
explicitly deny any connection between religiosity and worldly success. These
denominations may even deny any explicit connection between religious activity and
rewards after death. Pittinger (1975) writes �Episcopalians do not believe in a physical
heaven or hell.� He continues �Episcopalians do not use [purgatory] in their official
teaching, because they feel that it is often associated with crude ideas of payment of
penalty and the like.� While 30 percent of Baptists believe that adversity is a punishment
for sin, only 9.7 percent of Episcopalians share that belief. Religious denominations
appear to occupy a �product� space where some denominations claim an extremely high
return to religious involvement and others think that the idea of penalties for irreligious
9 The two best count-examples are the Orthodox Church and the Church of England. In both cases, one could argue that schism occurred because of a desire for independence from Rome, not from beliefs about the nature of religion. However, even in these cases there were substantial doctrinal debates (e.g. the filioque controversy). 10 This belief has softened over the past two decades, and does not appear in the most recent Catechism.

6
behavior is �crude.� Unsurprisingly, religious attendance is higher in denominations
where religiosity is thought to have high returns.11
To close the puzzle, we document that education appears to decrease belief in the returns
to religious activity. Less educated people are more likely to believe in miracles, heaven,
devils, and that adversity is a punishment for sin (even holding denomination constant).12
Religious beliefs and education appear to be substitutes. As people select denominations
that match their beliefs, more educated people, who have weaker beliefs, switch into
denominations where beliefs are weak. If denominations are belief-based groups, then
we shouldn�t be surprised that more educated people sort into low belief denominations
with low levels of attendance. The fact that education and belief are substitutes also
shows itself in the fact that people from high belief denominations acquire less education.
Holding their education constant, parents who come from high belief denominations have
less educated children.13
However, the negative relationship between education and religious beliefs still needs an
explanation. After all, one might think that because the more educated attend church they
should have stronger beliefs. We suggest two explanations for why education and
religious belief appear to be substitutes. Many pioneers of social science thought that
science disproved religion and that knowledge dispels religious belief.14 A second view
is that secular humanism should best be thought of as a rival theology, and that public
education is often influenced by secular humanists. One piece of evidence supporting
this second theory is that the education-religious belief relationship differs strongly
across countries and these differences are related to the political systems of the country.
For example, socialist countries have the strongest negative relationship between
11 As shown in Table 3, the beliefs of adherents resemble the doctrinal beliefs of their denominations. People in denominations with high levels of attendance believe in heaven, hell and miracles. Individuals in low attendance denominations are much less likely to hold these beliefs. 12 We will interpret all of these beliefs as proxies for belief in high returns to religious activity. 13 Chiswick (1983) and Tomes (1984) also document similar facts. 14 Marx, Weber, Freud and particularly Comte all held to variants of this view. Frank Knight is perhaps the economist who was most famously hostile to religion. Interestingly, Stark, Iannacone and Fink, (1996) find that hard scientists are more likely to be religious than social scientists. These authors are extremely critical of the idea that knowledge eliminates religion. We think they are right in this view.

7
education and beliefs. Attendance also declines most sharply with education in those
countries. Within non-socialist countries, nations with more constitutional restraints on
government have a more positive relationship between education and attendance.
Following Lott (1988), we think these results suggest that governments use the education
systems to further their political objectives, when they are allowed to do so. Communist
regimes saw religion as a serious threat and therefore used education to make religion
seem ridiculous. Non-communist regimes that are more dictatorial also used educated to
damage religion, perhaps because organized religion is seen as a rival power.
In the next section, we document our basic facts about the connection between education
and religious attendance. In section III, we sketch a framework to help understand how a
positive individual-level education-religion relationship can coexist with a negative
denomination-level education-religion relationship. Section IV presents the evidence
suggesting that the education-attendance connection is driven by the general sociability
of more educated persons. In section V, we look at evidence on the relationships
between education, beliefs and attendance. We also use exposure to the teaching of
creationism as a means of looking at the connection between belief and attendance. In
section VI, we look at sorting by beliefs and education across denominations. We also
look at education as a function of parental education and beliefs. Finally, in section VII
we examine the cross-country evidence and try to explain the cross-country differences in
the education-religion connection.
II. General Facts about Education and Religion
In this section, we document our basic facts: the positive relationship between education
across people and the negative relationship across denominations.
Data Description
8
The General Social Survey 1972-1998 (GSS) provides the largest sample size and richest
set of covariates of any U.S. data set with questions on religious beliefs and attendance.
Every two years, the GSS surveys approximately 1500 randomly selected people in
metropolitan and rural areas across the US. Appendix 1 gives a detailed description of
the data including the sample sizes and format of questions.
In addition to asking questions about religious and other beliefs, the GSS also collects
standard demographic information about the respondent, the respondent's other family
members, the respondent's parents, and some historical information about the individual
himself. For both current and past religious affiliations, respondents are asked first to
characterize their religious affiliation as Jewish, Catholic, Protestant, other religion, or no
religion. Respondents who answer Protestant are then asked to identify their
denomination from the following list: Episcopal, Methodist, Lutheran, Presbyterian,
Baptist, other denomination, or no denomination.15
Our outcome variables include religious attendance, prayer, membership in church and
non-church organizations, and belief in the following concepts: miracles, the afterlife,
God, the Devil, Heaven, Hell, punishment for sins, and the literal truth of the Bible. We
use years of schooling to measure the respondent�s education.
We have standardized education and all of the outcome variables so that they are mean
zero, variance one within the relevant sample. We did not standardize the control
variables: log of income, age, city population, female, married, and region dummies. Our
variable for religious attendance originally took on values from zero to eight. The eight
categories were as follows: never attending, attending less than once per year, attending
about once or twice per year, attending several times per year, attending about once per
month, attending two to three times, attending nearly every week, attending every week,
and attending several times per week. The belief variables were originally categorized in
a similar manner.
15No further information is available about respondents who list other religion or other denomination Protestant as their affiliation.

9
We use international data from two sources: The World Values Survey and the
International Social Survey Program (ISSP). The World Values Survey provides data on
religious attendance, denomination, religious beliefs, and social memberships for
respondents in 69 countries. We have several belief measures including belief in Heaven,
Hell, the Devil, and God. We use additional data from the ISSP because this latter data
set contains information on belief in Faith Healing and the literal truth of the Bible. We
have standardized education and the outcome variables to be mean zero, variance one
within each country.
Education and Religion across People
The basic relationship between education and religious attendance is documented in
Table 1. As mentioned earlier, both education and attendance are presented as z-scores�
standardized variables with a mean of zero and variance of one. In the first regression,
we show the simplest univariate relationship between education and religion. Because
there are significant relationships between cohort and both age and attendance (people
from older cohorts attend church less and have less education), we restrict ourselves to
people born after 1945 to minimize cohort effects.16 We find similar results for older
cohortsl. In regression (1), a one standard deviation increase in education raises religious
attendance by .12 standard deviations. The t-statistic on this relationship is 15�it is
statistically a very strong relationship with a reasonably large magnitude.
To check for possible non-linearities in this relationship, Figure 1 shows the average
value of our normalized religion variable for different education levels (again only for
people after 1945). Religious attendance among people with 16 years of schooling is .5
standard deviations higher than religious attendance among individuals with ten years of
education. The relationship seems quite linear until we look at people with more than 16
years of schooling where attendance declines somewhat with education.
16 Greeley (1989) finds little secular trend in religious adherence. However, we do find substantial cohort effects in the General Social Survey, especially once we control for age.

10
In the second regression, we include denomination dummies, and examine the extent to
which attendance rises with education within denominations. The coefficient on
education rises: a one standard deviation increase in education is now associated with a
.16 standard deviation rise in religious attendance (the t-statistic on this coefficient is now
20). The coefficients on the denomination dummies are themselves also extremely
strong, and will be the subject of discussion in the next section.
In the third regression, we include other demographic controls, and in the fourth
regression we show results for our entire sample. The estimated coefficients on the
controls correspond with earlier work in this area. There is a weak positive relationship
between attendance and income. Older people are more likely to attend church (as in
Azzi and Ehrenberg, 1976). Blacks and women have much higher attendance levels.
Married people are more likely to attend, especially if they have children. Across
regions, attendance is highest in the south and lowest in the west. There is a negative
relationship between city-size and attendance. The education coefficient is quite constant
through these different specifications. In regression (3) the coefficient is.189 and in
regression (4) the coefficient is .152.
Finally, in the fifth regression we look at differences in the education coefficient across
denominations. Surprisingly, the education coefficient is weakest in the highest
education denominations. When we look at individual denominations, we find strong
positive coefficients in almost all of the denominations except for Presbyterians,
Episcopalians and Jews, which are the highest education denominations.
In Table 2, we look at these relationships across a broader set of countries using the
World Values Survey. Appendix Table 1 shows results with the ISSP.17 In many places,
the relationship continues to be positive. For example, the positive relationship seen in
the U.S. also exists in Great Britain, Spain, Sweden and France. But in many countries,
the relationship is negative. In Poland, Ukraine, Russia, and Romania, the relationship is
17 Smith, Sawkins and Seaman (1998) also present results on religious attendance using the ISSP.

11
robustly negative. Across our complete set of countries, Portugal is the only non-
communist country with a coefficient below -.1. In most countries the relationship is not
statistically significant. We will try to explain these puzzling cross-country differences
later in the paper.
Education and Religion across Denominations
While the positive relationship between education and attendance at the individual level
within the U.S. is quite strong, the negative relationship between education and
attendance at the denomination level is also impressive as seen is Tables 3 and 4 and
Figure 2. We measure attendance with the denomination specific fixed effects from
Table 1; our results would be quite similar if we just used the mean attendance level.
Table 3 shows the differences across denominations. Table 4 gives the cross-
denominational correlations. There is a -86 percent correlation across denominations
between average education and average attendance. In a regression format the
relationship across denominations is (among people born since 1945):
(1) Attendance= .002 - .505*education, N=10, R-Squared=.64
(.055) (.135)
Standard errors are in parentheses.
The lowest education denomination is the Baptists who have the second highest
attendance level, measured either as a group average or as the denomination fixed effect.
The second lowest education group is the Other Denomination Protestants. This is a
heterogenous group. It is the fastest growing group in the sample. It includes the
fundamentalist groups and the Mormons, as well as Unitarians (which are a tiny fraction
of this group). Other Denomination Protestants have a much higher level of attendance
than any group. Catholics are the next groups both measured in education and measured
in attendance.

12
The Lutherans and Methodists are next in both education and attendance. Within these
groups, the Methodists have less education and the Lutherans attend church more often,
but the differences between these two groups are small. Among Christian denominations,
Presbyterians and Episcopalians have the highest education levels and the lowest
attendance (looking at fixed effects). Jews are by far the most educated and by far the
least likely to attend services. Within Judaism, the two more educated groups (reform
and conservative) have lower attendance levels than the less educated orthodox Jews.
Two other groups, people in other religions and non-denominational Protestants, fit the
basic relationships less well. This may occur because they are unusual and
heterogeneous groups. Other religion individuals have education levels between
Episcopalians and Jews, but attendance levels that lie between Episcopalians and
Presbyterians. Non-denominational Protestants have educational levels between
Presbyterians and Methodists, but their attendance levels are almost as low as
Episcopalians. The low attendance of non-denominational Protestants is unsurprising as
this group is defined by its relatively low affiliation with any formal group.
Few other countries have the range of denominational diversity of the U.S. However,
when there is diversity, it generally follows the U.S. pattern. For example, in England the
more highly educated groups have the least attendance. In West Germany and
Switzerland where there are substantial Catholic and Protestant populations, the
Protestant groups have more education and are less likely to attend church.
This strong negative relationship does not hold when the data are aggregated by
geography. Figure 4 shows a very weak negative relationship between average education
and mean attendance across Primary Sampling Units (roughly metropolitan statistical
areas) within the U.S.

13
Other Differences across Denominations
As one investigates denominational differences with an eye towards determining
potential causes of the puzzling negative relationship, the strong differences in beliefs
across denominations stand out. Tables 3 and 4 show these differences. We have
focused on beliefs that would suggest returns to religion both temporally and in the
afterlife.
In almost all cases, the belief variables are almost perfectly negatively associated with
education and almost perfectly positively associated with attendance. Our first three
variables relate to the perceived returns to religious activity in the afterlife. The first
belief is in the existence of an afterlife. The correlation between this variable and
attendance is 75 percent. The correlation with education across denominations is �74
percent. However, the existence of an afterlife does not necessarily imply returns to good
religious behavior. Both Jews and Greeks believed in an afterlife before the common era,
but their conception of an afterlife did not imply that good behavior generated post-death
returns. Indeed, this innovation in both traditions shows up only after 500 b.c.e.
We therefore also examine belief in the existence of heaven. The correlation between this
variable and both attendance and education is even stronger (positive 82 percent in the
case of attendance and negative 80 percent in the case of education). The existence of a
devil is also connected to the idea that religious misbehavior may lead to damnation. The
correlation between belief in the devil and education is �80 percent; the correlation
between this belief and attendance and education is 80 percent.
While it is hard to think that modern education really can inform people about the post-
life returns to religion, it is easier to accept an impact on beliefs about religion�s temporal
effects. We therefore turn to beliefs about the activity of God in daily life. Our first
variable is belief in miracles. This variable has a 79 percent correlation with attendance
and �78 percent correlation with education. Our second variable is whether individuals
believe that �adversity is a punishment for sin.� This variable is also negatively

14
correlated with education at the denomination level. Our final variable is whether
respondents think that the bible is literally true. Believing that the bible is literally true is
equivalent to believing that a deity has taken a substantial, active role in determining
human history, where he has rewarded the righteous and punished sinners. So, we see
this as a further measure of believing in the returns to religious belief. There is an 84
percent correlation between this variable and religious attendance and a �81 percent
correlation between this variable and education. Overall, we are quite convinced that the
high attendance, low education denominations are marked by a much stronger belief in
the returns to religion than the low attendance, high education denominations.
The claimed returns to religion are not merely payoffs from divine intervention in the
afterlife and the temporal world, but also in the social advantages of a close religious
group. Iannacone (1992) argues that the costs involved in joining many cults are a means
of making it difficult for individuals to reap the social advantages of these groups without
contributing to them. Perhaps the denominational differences are actually driven by the
degree of their social cohesiveness. To test this hypothesis, we examine the extent to
which measures of religious social connection differ across denominations.
Our first measure of religious social connection is the extent to which respondents claim
to participate in church activities. This variable is completely orthogonal to both
attendance and education across denominations. Our second variable relies on the
General Social Survey�s questions about the individual's friends. For a subsample of the
data, we have a set of facts about respondents� five closest friends. From this
information, we form a variable measuring the share of respondents� friends that are
members of the individuals own congregation. There is a slight positive correlation
between this variable and the level of attendance in the denomination (19 percent) but no
correlation with the average level of education in the denomination.
Finally, we look at whether individuals say that they rely for help on their congregation
(as in Iannaccone, 1992). This measure tries to capture the idea that religious groups
provide a form of social insurance. This variable is significantly connected with both

15
attendance and education (23 percent and �30 percent respectively). However, it is much
less closely connected with either education or attendance than any of the belief
variables. As such, we are led to the conclusion that beliefs in the returns to religion are
the most meaningful differences across denominations that are both positively connected
with attendance and negative connected with education. In the next section, we present a
simple model that tries to explain the paradox through differences in these beliefs.
III. Why are High Education Denominations So Low in Beliefs?
In this section, we rely on the aforementioned differences across denominations in beliefs
to try to explain why more educated denominations have less attendance even though
more educated people attend church more often. This section gives conditions under
which a positive individual-level relationship can coexist with a negative denomination-
level relationship. The critical elements of the model are (1) heterogeneity across
denominations in beliefs, (2) individuals select denominations on the basis of these
beliefs, (3) education decreases beliefs, and (4) education increases the social returns to
religious activity.
In our simple framework, we assume that there are two levels of education and two levels
of belief. We assume that one-half of the population is better educated and one-half of
the population has a higher level of beliefs. The fraction of high education individuals
with strong beliefs is denoted δ , and therefore the fraction of low education individuals
with strong beliefs equals δ−1 . Lower values of δ imply that education decreases
beliefs. The effect of having higher education on religious attendance (holding beliefs
constant) is denoted Eβ -- this is meant to capture the social returns to religious activity
which are assumed to rise with schooling. The effect of having stronger beliefs on
religious attendance (holding education constant) is denoted Bβ . There is no cross effect
between education and belief.
16
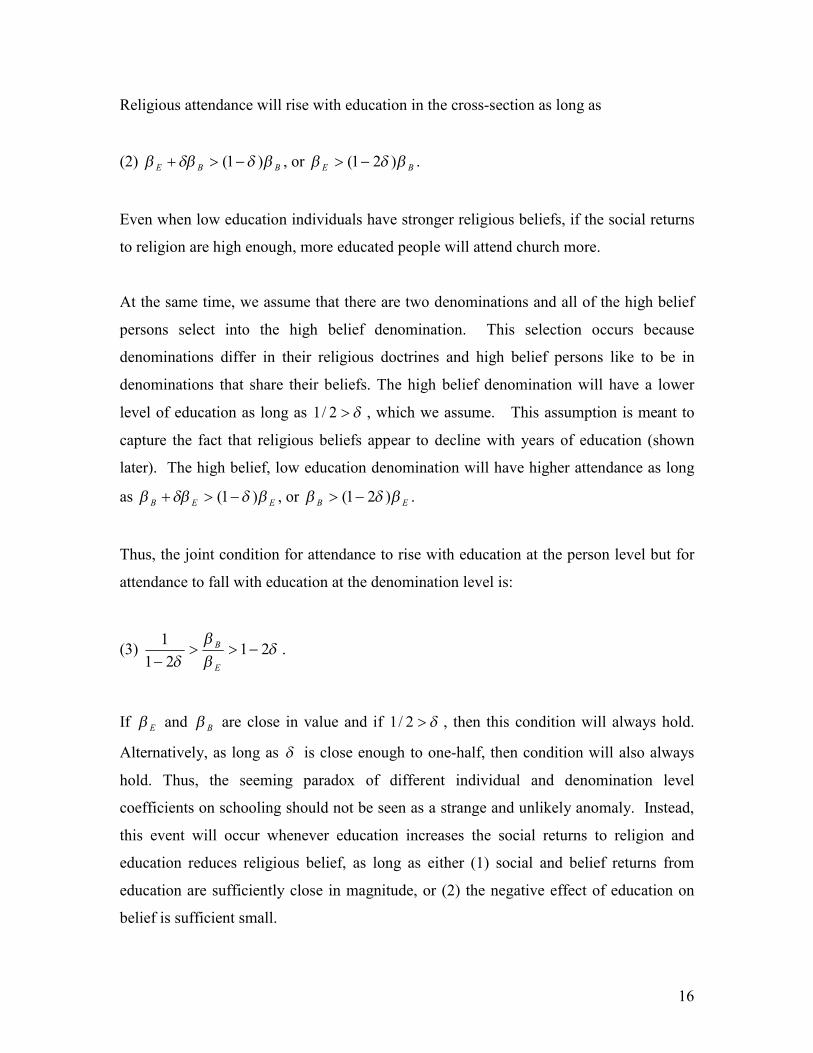
Religious attendance will rise with education in the cross-section as long as
(2) BBE βδδββ )1( −>+ , or BE βδβ )21( −> .
Even when low education individuals have stronger religious beliefs, if the social returns
to religion are high enough, more educated people will attend church more.
At the same time, we assume that there are two denominations and all of the high belief
persons select into the high belief denomination. This selection occurs because
denominations differ in their religious doctrines and high belief persons like to be in
denominations that share their beliefs. The high belief denomination will have a lower
level of education as long as δ>2/1 , which we assume. This assumption is meant to
capture the fact that religious beliefs appear to decline with years of education (shown
later). The high belief, low education denomination will have higher attendance as long
as EEB βδδββ )1( −>+ , or EB βδβ )21( −> .
Thus, the joint condition for attendance to rise with education at the person level but for
attendance to fall with education at the denomination level is:
(3) δββ
δ21
211
−>>− E
B .
If Eβ and Bβ are close in value and if δ>2/1 , then this condition will always hold.
Alternatively, as long as δ is close enough to one-half, then condition will also always
hold. Thus, the seeming paradox of different individual and denomination level
coefficients on schooling should not be seen as a strange and unlikely anomaly. Instead,
this event will occur whenever education increases the social returns to religion and
education reduces religious belief, as long as either (1) social and belief returns from
education are sufficiently close in magnitude, or (2) the negative effect of education on
belief is sufficient small.

17
We proceed with evidence supporting various aspects of the model. First, we present
evidence for social effects of education and discuss why this relationship might be so
strong. Second, we look at the education-beliefs relationship and present some evidence
suggesting that the beliefs are indeed important in driving attendance. Third, we examine
evidence on sorting across denominations as a function of education and beliefs. Finally,
we try to explain cross-country differences in the education-religion relationship.
IV. Evidence on the Social Effects of Education
We provide four pieces of evidence suggesting that the positive connection between
education and attendance comes from a general positive connection between schooling
and social connection. Schooling is strongly associated with social behavior of all forms,
both in the U.S. and throughout the world. Religious attendance is highly correlated with
other forms of social activity. Schooling is not correlated with non-social religious
behavior. Finally, among asocial individuals there is a much weaker positive connection
between schooling and social behavior.
Table 5 examines the connection between education and a variety of social activities.
While we have included all of the control variables that we use elsewhere, we only report
the coefficients for education. For every variable, except for membership in labor unions,
there is a strong positive effect of education on membership. The effect of education on
religious attendance is weaker than the effect of education on most other social activities.
Our summary variable is a normalized (to a z-score) value of membership in number of
organizations. While this variable is generally referred to as number of organizations,
more precisely it refers to the number of different types of organizations of which the
individual is a member. In other words, if an individual is a member of one literary
society and one sports organization this would count as two, but if the individual is a
member of five veterans organizations this will only count as one. The basic education
coefficient for this variable is .293�this coefficient is much higher than the education
coefficients in the religion regressions.

18
We also include other variables including the General Social Survey question on trust
�would you say that generally speaking most people can be trusted, or that you can�t be
too careful?� as an added dependent variable. This trust question is thought, by some, to
capture the degree of social engagement (see Glaeser, Laibson, Scheinkman and Soutter,
2000, though, for evidence on what this variable actually captures). We also use the
number of friends and how often individuals socialize with their friends. All of these
variables rise significantly with education.
Table 6 shows similar results using the World Values Survey for developed countries
outside of the United States. Across the world there is a strong positive relationship
between education and social membership. There are two countries in this restricted
sample where the education-attendance relationship is negative (Austria and Norway),
but in these cases the coefficient is not significant. In the full sample of 62 countries,
there are only 4 cases where there is a negative relationship between education and group
membership (Austria, Montenegro, Norway and the Philippines) and none of them are
significant. Furthermore, the connection between education and organization
membership is higher than the connection between education and religion in 4 out of 62
countries (Finland, Great Britain, Norway, and the Philippines). While far from
conclusive, this suggests that the religion-education connection may be only one example
of a pervasive education-social connection relationship.
Table 7 presents further evidence on social connection and religion. Regression (1)
shows that people who are more social along other dimensions (as measured by
membership in organizations) attend church more often. A one standard deviation
increase in membership in organizations raises religious attendance by .05 standard
deviations. Regression (2) shows that if we look only at asocial individuals (defined as
individuals who are not members of any organizations), the coefficient on education in
the basic religion regression (comparable to Table 1, Regression 4) drops by two-thirds.
This suggests that the education effect is working through the general education-social
connection relationship.

19
Regressions (3) and (4) look at non-social religious activities. In regression (3), we show
that education is not correlated with prayer, a religious activity that is presumably much
less social. In regression (4), we show that education is orthogonal to feeling the
presence of God. These more private forms of religious connection are not related to
human capital.
Discussion: Why Does Social Activity Rise with Education
Of course, this raises the question of why social connection rises with education. While
this question is far beyond the scope of this paper, we will raise a few hypothetical
answers at this juncture. Glaeser, Laibson and Sacerdote (2000) suggest that this
connection might be explained by rates of time preference. If social activity is seen as
investment in social capital then it is natural to think that the same future-oriented
individuals who invest in human capital will also invest in social capital. Of course, this
would suggest a positive interaction between education and belief that would come about
because more patient individuals would be more likely to trade off present costs for
future benefits in the hereafter. This could explain the negative relationship between
individual education and average education in the denomination.
A second hypothesis is that education trains individuals socially (see Bowles and Gintis,
1976). According to this view schooling teaches people to deal well with others. As
such, educated individuals will get more out of social relationship and will therefore be
more social.
A third hypothesis is that the returns from social activities rise with social status. This
view suggests that priests and other parishioners will treat high status individuals more
favorably and therefore they are more likely to attend services. Finally, social interaction
may just be a normal good and people consume more social interaction as they get
wealthier. This view has trouble with the fact that income effects on social engagement

20
are generally much weaker than education effects. We leave the important interaction of
education and social interaction as a subject for future research.
V. Education, Beliefs and Attendance
In this section, we present evidence on the effect of education on religious beliefs, and on
the effect of belief on attendance.18 First, we look at the beliefs-attendance connection
within the United States. Second, we look at the same relationship elsewhere. These are
both attempts to determine whether education does actually diminish religious belief.
Then, we examine our evidence for whether or not belief really drives attendance. While
there is a sense in which a belief-attendance connection seems obvious, it is actually
difficult to measure this connection because of the reverse causality problem (attendance
may increase belief, as argued by Montgomery, 1996). To get at this relationship within
the U.S., we look at the impact of statewide rules about teaching evolution on religious
belief and attendance for children raised in those states. We control for parental religious
involvement to lessen the possibility that these rules are just reflecting the religious
beliefs of parents.
Table 8 looks at the connection between education and religious beliefs within the United
States. In the first column, we look at the general connection. In the second column, we
present the education-beliefs relationships controlling for denomination specific fixed
effects. The first three regressions shows results for the beliefs capturing post-life
returns from religious activity. Our first variable is belief in the afterlife, which displays
a positive rather than a negative relationship with education, but this variable does not
directly measure the returns to religious activity. The second and third regressions show
strong negative effects of education on beliefs. Regression (2) shows belief in the
heaven. A one standard deviation increase in education causes belief in heaven to fall by
.137 standard deviations. Regression (3) shows that a one standard deviation increase in
education causes belief in the devil to decline by .055 standard deviations. When we
control for denominations, this relationship disappears statistically.
18 Greeley (1988) is a pioneering piece of social science on the correlates of belief in life after death.

21
Regressions (4)-(6) look at our variables reflecting the activity of God in the physical
world. Regression (4) shows a negative connection between education and belief in
miracles. Again, this relationship disappears when we control for denomination. Perhaps
this low correlation occurs because many respondents give a very broad interpretation to
the term �miracles.� Regression (5) looks at the connection between education and belief
that �adversity is a punishment for sin.� In this case, a one standard deviation increase in
education reduces this belief by .13 standard deviations. Finally, we look at belief in
whether the bible is literally true. Again, there is a strong negative relationship between
education and this belief.
Figures 5 and 6 show the belief-education relationship across PSUs in the General Social
Survey. Figure 5 shows that belief that the bible is literally true declines substantially
with education across geographic areas in the U.S. Figure 6 shows that belief in the devil
also declines with education across these areas.
Table 9 looks at the belief education relationships outside of the United States using the
World Values Survey. In the first column our dependent variable is belief in God. In
every one of the countries in this table there is a negative relationship between years of
education and belief in God, and in most of the countries this relationship is quite
signficant. In the 65 countries for which we have the data, only five countries have a
positive relationship between years of education and belief in God (only one, Finland, is
significant).
In the second regression, we look at belief in heaven. Again, the relationship with
education is overwhelmingly negative. In every country in the table, except Austria,
there is a negative relationship. In the bigger sample, all but four countries have this
negative relationship. In the third regression, we show belief in the devil. Again, in all
but four countries, more education reduces belief in the devil. The negative connection
between education and the returns to religion in the afterlife appears to be a persistent
feature of the data. In regressions (4) and (5), we look at results from the ISSP on belief

22
in the temporal activity of God. Our first variable is belief that the bible is literally true.
Our second variable is belief in faith healers. These variables are only available for a
subset of countries, but in every case education reduces belief.
Of course, it is not necessarily clear why education should reduce religious belief.
Indeed, there is sufficient variation in the coefficients of education on belief as to suggest
that educational systems differ in the extent to which they teach people not to believe in
the returns to religion. In section VII, we try to understand better this variation and why
there is this negative relationship between education and belief.
Does belief drive attendance?
Documenting a causal relationship between religious and attendance is extremely
difficult given the difficulties in finding plausibly exogenous determinants of belief that
are orthogonal to other determinants of religion. Our best approach is to rely on
differences across states in the teaching of evolutionary theory. While evolution itself
has little to do whether the post-life returns to religious activity, many religious figures
have argued that it challenges belief in the literal truth of the bible. As such, it seems
plausible that being part of a school system where evolution is not taught might lead to a
higher degree of belief in the material rewards to religious behavior. Of course, this
variable may just be proxying for other religious elements of the state, but it is still our
best chance at finding exogenous variation in beliefs.
Following Larson (1985), we created a data set on the 9 states where teaching evolution
was explicitly banned from the curriculum for a number of decades. We then match this
data to the General Social Survey and ask whether children who went to school in those
states during those years have higher levels of religious attendance and greater religious
beliefs.
Table 10 shows our results. In regressions (1) and (2) we look at religious attendance. In
regressions (3) and (4) we examine belief in the devil. Regressions (1) and (3) do not

23
include state fixed effects. Regressions (2) and (4) include these fixed effects and rely on
cohort differences within states for identification. There is a significant coefficient on the
creationism variable in three out of four regressions. In regression (4), there is still a
positive effect of the creationism variable, but it is insignificant. While this is fairly weak
evidence, it supports the quite plausible view that beliefs are important in driving
religious attendance.
VI. Sorting Across Denominations
In this section, we consider the vital assumption that there is strong sorting across
denominations on the basis of beliefs, and in particular that higher education individuals
tend to select into low belief denominations. While the model actually predicts perfect
sorting on the basis of beliefs, this is an extreme assumption unnecessary for the model�s
basic implications to hold. Furthermore, we assume that our measures of beliefs are
imperfect and it would be impossible for us to tell whether there is such perfect sorting.
Nevertheless, we will first proceed by trying to determine the extent to which individual
variation in beliefs is explained by denomination-specific fixed effects. After this, we
test whether there is evidence among individuals who switch denominations for sorting
by beliefs and education.
Table 11 shows the degree of sorting by beliefs across denominations. Our methodology
is to run a regression of beliefs on denomination dummies and to ask about the extent to
which variation within beliefs is across denominations or within denominations. We start
with a non-belief variable�years of education�to get a benchmark of the degree of
heterogeneity across education. Of course, it would be unreasonable to expect
denominations to completely explain the heterogeneity in beliefs. Our objective is to
determine whether denominations explain much more of the heterogeneity in beliefs than
they do the heterogeneity of other variables. In the case of education, the r-squared of the
denomination fixed effects is six percent. This means that 94 percent of the population
heterogeneity in education is within denominations.

24
In the case of most of our belief variables, denominations explain a much higher degree
of the variance. For example, the denomination-specific fixed effect explain 23 percent
of the heterogeneity in belief in heaven and 21 percent of the variation in belief that the
bible is literally true. Denomination dummies explain 14 percent of the variation in
belief in the devil and belief in miracles. While the within denomination heterogeneity is
much higher than the between denomination heterogeneity, it is still clearly true that there
is substantial sorting across denominations in beliefs for four belief variables.
For two of our belief variables, sorting across denominations is much weaker. Belief in
the afterlife and belief that adversity is punishment for sin are much less explained by the
denomination fixed effects. Overall, we find persuasive evidence for substantial sorting
across denominations, but the results are far from overwhelming.
Table 12 looks at individuals who switch religions. While we do not have a panel, we do
know individuals� denominations at age 16 and as adults. As such, individuals who list
different denominations while youths and adults are considered to be switchers. First, we
examine whether education and belief induces people who switch to switch into lower
belief denominations. Then, we examine whether education and belief determines who
switch denominations. We are specifically interested in whether higher education levels
are correlated with people leaving high belief denominations.
Our first specification regresses the average belief in chosen religion on individual
characteristics for switchers. The first regression implies that a one-standard deviation
increase in education reduces the average belief in the chosen religion by .089 standard
deviations. This does suggest that more education induces individuals to select into
lower belief denominations.
Our second regression looks at belief in the afterlife. While we believe that this is the
least powerful of the belief variables, it is the only one that is available for a large number
of years and as such it is the only variable that is usable for this regression. A one
standard deviation increase in this variable increases the average belief in the chosen
25
denomination by .059 standard deviations. This belief specification is somewhat
problematic as beliefs may themselves be a function of exposure to the chosen
denomination. In specification (3), we include both the education and belief variables
and find that both are important. As such, we think that this shows significant sorting
across denominations as a function of education and beliefs.
Regressions (4)-(6) look at switching as the dependent variable. In this case, we report
marginal probabilities to switch estimated from a Probit regression. The mean for this
variable is 24.7 percent. The first regression finds a strong positive cross-effect between
education and initial belief. The coefficient means that individuals whose education is
one standard deviation above the average are two percent more likely to switch religions
if the religion has beliefs that are one standard deviation above average. Given the
relatively low propensity for switching in general, we consider this a fairly large number.
In regression (5), we look at the interaction between individual beliefs and switching. In
this case, we find that high belief individuals are more likely to leave low belief
denominations. Again, we are troubled by the fact that this reflect ex post, not ex ante,
beliefs. Regression (6) shows that when both education and belief are included, both
results still remain significant statistically and economically.
Denominations and the Choice of Education
As we have seen, more educated people belong to low belief denominations in part
because high education people are likely to switch into these denominations. However,
there is also a second channel that creates the connection between education and
denomination. Many others (including Weber) have argued that denomination may
determine education just as education determines denomination. Indeed, in some
religious groups (such as Catholics and Jews), switching denominations is uncommon.
The educational levels of these groups presumably come are more likely to stem from the
effect of denomination on education choice than from the effect of education on
denomination choice.

26
To test this hypothesis, we examine whether the beliefs of parental denominations have
an effect on the education level of children, holding parental education constant. Our
starting point is that we expect parents to want their children to share their beliefs and
stay in their denomination. To the extent that religious beliefs and education are
substitutes, we predict parents from high belief denominations to invest less in their
children�s human capital. If education works against religious beliefs, then parents from
high belief denominations will not want their children to become too educated, because
secular education may lead to reduced beliefs and switching into lower belief
denominations.
The first column of Table 13 shows the effect of parental denomination on the education
of respondents in the General Social Survey controlling for parental education. These
regressions also control for respondents� age, race, cohort, region and gender, but we do
not report those coefficients. Education is highest among Jews (echoing Chiswick,
1983). Episcopalians and Presbyterians follow. Baptists and other denomination
Protestants acquire the least education (except for no denomination Protestants). This
pattern matches up almost perfectly with the pattern seen earlier for beliefs across
denominations.
In regression (2), we replace these denomination dummies with the mean level of belief
in the devil in the denomination (other belief variables work equally well). Even
correcting for intra-denomination correlation of error terms, the variable is powerful both
economically and statistically. In denominations where beliefs are stronger, children are
less likely to acquire human capital. There are many possible confounds in the
regression. Our controls for parent�s education may be inadequate and insufficiently
capture the quality of parents� education. Denominations may just be proxying for the
peer group of the child. Nonetheless, we think that this is at least suggestive evidence
supporting the idea that inter-denominational differences in education come about, in
part, because individuals from high belief denominations acquire less human capital. A

27
natural explanation of this phenomenon is that education and religious belief are
substitutes.
VII. Variation in the Education-Attendance Relationship across Countries
Our final goal is to try to understand why the education-attendance relationship differs
across countries. Figure 3 shows there is a considerable degree of variation in the extent
to which this relationship holds and hopefully the model should be able to explain as least
some of this variation. The model identified two variables that might determine the
education-religion relationship: the connection between years of education and social
connection and the connection between years of education and religious belief. Both of
these differ across countries.
First, we look at whether the education-social connection relationship differs enough to
plausibly explain the different education-religious attendance relationships. This seems
unlikely. While the education religion relationship ranges from -.25 to .23 with
considerable weight throughout the distribution, ninety percent of the countries have
education-social membership relationships between .1 and .2. Furthermore, if we regress
the education-attendance coefficient on the education-membership coefficient across
countries (shown in Figure 7), the relationship between these two coefficients is positive
but quite weak. The results go in the right direction. In those countries where education
is more positively associated with sociability, education is more positively associated
with religion, but little of the variation in the education-attendance relationship can be
explained.
However, when we look at the education-belief relationship the results are far more
promising. There is much more variation in the relationship between education and
religious belief than in the relationship between education and attendance. Furthermore,
as Figures 8 and 9 show there is an extraordinarily strong correlation across countries
between the coefficients of religious attendance on education and the coefficients of
religious belief on education. Of course, this is not the same as establishing any sort of a

28
causal link, but at least this finding is compatible with the idea that the religion-education
relationship differs across nations because of different things that education teaches
students about belief.
Testing political explanations for the cross-country differences
We now examine whether political variables drive the education-attendance and
education-belief relationships. We see this as testing whether education is intrinsically
hostile to beliefs or whether the education beliefs relationship is driven by choices about
the school system.
We begin by looking at the effects of communist regimes. Our variable for communism
is the La Porta et al. (1998) variable which measures whether the country has a socialist
legal origin. Because Marx decreed that religion was the opiate of the masses and
because communist regimes traditionally saw religion as a hostile ideology opposed to
communism, these regimes generally tried to fight religion through any means necessary.
As these states controlled the education process, schooling provided them with a natural
means of working against religion. Hans (1966) writes �the ideology of the eastern part
of Europe is anti-Catholic and is based not on traditional religion but on a philosophic
conception of recent origin,� and that Russian schools �had to indoctrinate all pupils in
dogmatic atheism.�
In Table 14, we test whether socialist origin can explain differences in the education
coefficient on attendance and beliefs across countries. In this specification, we pool all of
the data from the World Values Survey. We interact education (normalized within each
country) with a dummy variable for socialist legal origin. In all cases, this interaction is
quite powerful. There is no significant relationship between education attendance in non-
socialist countries, but in socialist countries a one-standard deviation increase in
education reduces attendance by .09 standard deviations. A one standard deviation in
education reduces belief in God by .12 standard deviations and belief in hell by .14
standard deviations. Socialist countries appear to use the power of the state over
29
education to quash religious beliefs. We interpret this as suggesting that the education-
religion connection is not intrinsic but rather a function of curriculum design and the
objectives of those who control education.
In regressions (4)-(6) of Table 14 we look only at non-socialist countries. In this case, we
a variable mean to capture constitutional restrictions on the power of the state. In this
case, we take as given the idea that most governments have seen the church as an enemy.
For example in Germany, religious groups provided significant opposition to the Nazi
regime and Hitler saw state control over religious schools as an important state objective.
In France as well, secular authorities were often hostile to the Church. Regressions (4)
and (6) show that restraints on the state are generally associated with a much less
negative relationship between education and attendance and belief in hell. Somewhat
surprisingly, this does not show up in the relationship between education and belief in
God. Again, we interpret this as meaning that education-belief relationships are not
intrinsic but rather the result of curriculum design by the state.
VIII. Conclusion
Within the U.S. education raises religious attendance at individual level. This does not
seem unusual to us because religious attendance is a major form of social interaction and
education raises every other measurable form of social connection. We do not fully
understand why education has this impact on social connection, but it seems to be the
best explanation of the positive connection between education and religion.
At the same time, there is a strong negative connection between attendance and education
across religious groups within the U.S. and elsewhere. We think that this is explained by
the fact that education also appears to decrease religious belief. This negative impact on
beliefs means that more educated people sort into denominations with lower beliefs. If
people sort across denominations on the basis of their beliefs, the negative relationship
between education and beliefs at the denomination level can explain why education
reduces religiosity at the denomination level.

30
Across the world there is a great deal of heterogeneity in the extent to which education
interacts with religious attendance. This seems to be best understood as differences in the
education-religious belief connection across countries. These differences can be partially
explained by political variables of different countries. Socialist regimes and governments
which face fewer constitutional constraints are more likely to use the power of the state
over education to reduce the power the church, a competing institution.

31
References
Azzi, C. and R. Ehrenberg. (1975) Household allocation of time and church attendance.
Journal of Political Economy 83(1): 27-56.
Becker, G. (1964). Human capital. Chicago: University of Chicago Press.
Bowles, S. and H. Gintis. (1976) Schooling in capitalist America : educational reform
and the contradictions of economic life. New York: Basic Books.
Catechism of the Catholic Church (1975). New York: Doubleday.
Chiswick, B.R. (1983) The earnings and human capital of American Jews. Journal of
Human Resources 18(3): 313-336.
Durkheim, E. (1995) Elementary forms of religious life. Translated by Karen E. Fields.
New York: Free Press.
Evans, R. L. (1975) �What is a Mormon?� in Leo Rosten, Ed., Religions of America.
New York: Simon and Schuster.
Glaeser, E., Laibson, D. and B. Sacerdote. (2000) �The Economic Approach to Social
Capital,� NBER Working Paper #7728.
Glaeser, E., Laibson, D., Scheinkman, J. and C. Soutter (2000) Measuring trust.
Quarterly Journal of Economics.
Glaeser, E. and J. Scheinkman (2000) �Non-market Interactions,� NBER Working paper.
Greeley, A. M. (1989) Religious change in America. Cambridge: Harvard University
Press.
Greeley, A. M. (1988) Correlates of belief in life after death. Sociology and Social
Research 73(1): 3-8.
Hans. (1966) Secularism in Eastern Europe. In Bereday, G. and J. Lauwerys eds. The
World Year Book of Education 1966: Church and State in Education. London: Evans
Brothers.
Hendricks, D. W. (1975) �What is a Catholic?� pp. 39-67 in Leo Rosten, Ed., Religions
of America. New York: Simon and Schuster.
Iannaccone, L. (1998) Introduction to the economics of religion. Journal of Economic
Literature 36(3): 1465-95.
32
Iannaccone, L. (1992) Sacrifice and stigma: Reducing free-riding in cults, communes,
and other collectives. Journal of Political Economy 100(2): 271-91.
La Porta, R., Lopez-de-Silane, F., Shleifer, A. and R. Vishny. (1998) The quality of
government. NBER Working Paper #6727.
Larson, E. (1985) Trial and error: The American controversy over creation and
evolution. Oxford: Oxford University Press.
Montgomery, J. D. (1996) Contemplations on the economic approach to religious
behavior. American Economic Review 86(2): 443-447.
Pittinger, W. N. (1975) �What is an Episcopalian?� pp. 96-111 in Leo Rosten, Ed.,
Religions of America. New York: Simon and Schuster.
Putnam, R. D. (2000) Bowling alone: The collapse and revival of American community.
New York: Simon and Schuster.
Smith, I., Sawkins, J. W. and P. T. Seaman.(1998) The economics of religious
participation: A cross-country study. Kyklos 51(1): 25-43.
Stark, R., Iannaccone, L. and R. Finke (1996) Religion, science, and rationality.
American Economic Review 86(2): 433-37.
Tomes, Nigel. (1984) The Effects of Religion and Denomination on Earnings and the
Returns to Human Capital. Journal of Human Resources 19 (4): 472-88.

33
Table I: OLS of Attendance on Education and other Controls (1)
Attendance ( if born
after 1945)
(2) Attendance
( if born after 1945)
(3) Attendance
( if born after 1945)
(4) Attendance
( Whole Sample)
(5) Attendance
( Whole Sample)
years of education 0.121 (0.008)
0.160 (0.008)
0.189 (0.008)
0.152 (0.006)
0.152 (0.006)
Education* denomination's average education
-0.081 (0.023)
dummy for jewish -1.086 (0.059)
-0.959 (0.059)
-0.890 (0.039)
-0.847 (0.040)
dummy for catholic -0.415 (0.025)
-0.327 (0.025)
-0.152 (0.018)
-0.152 (0.018)
dummy for baptist -0.344 (0.026)
-0.403 (0.027)
-0.342 (0.018)
-0.337 (0.019)
dummy for lutheran -0.557 (0.037)
-0.492 (0.036)
-0.402 (0.024)
-0.402 (0.024)
dummy for episcopal -0.687 (0.058)
-0.624 (0.056)
-0.617 (0.035)
-0.592 (0.036)
dummy for methodist -0.630 (0.034)
-0.623 (0.033)
-0.557 (0.021)
-0.558 (0.021)
dummy for presbyterian -0.598 (0.046)
-0.550 (0.045)
-0.548 (0.028)
-0.540 (0.028)
dummy for nondenominational protestant
-0.539 (0.042)
-0.470 (0.041)
-0.555 (0.030)
-0.555 (0.030)
dummy for other religion -0.639 (0.044)
-0.540 (0.044)
-0.434 (0.036)
-0.417 (0.036)
log of income
0.024 (0.019)
0.046 (0.013)
0.043 (0.013)
dummy variable =1 for income missing
0.113 (0.057)
0.082 (0.037)
0.076 (0.037)
dummy variable =1 for black 0.240 (0.024)
0.289 (0.018)
0.290 (0.018)
dummy variable =1 for female
0.169 (0.023)
0.277 (0.017)
0.276 (0.017)
birth year of respondent
2.14E-4 (0.001)
-0.009 (4.86E-4)
-0.009 (4.86E-4)
dummy variable=1 if married 0.182 (0.026)
0.161 (0.018)
0.162 (0.018)
female * married 0.012 (0.032)
-0.037 (0.022)
-0.038 (0.022)
number of children between ages of 0 and 5
0.054 (0.012)
0.028 (0.010)
0.028 (0.010)
number of children between ages of 6 and 12
0.112 (0.011)
0.069 (0.008)
0.069 (0.008)
number of children between ages of 13 and 19
0.104 (0.014)
0.034 (0.009)
0.034 (0.009)
log of population of city of residence
-0.007 (0.004)
-0.013 (0.003)
-0.013 (0.003)
dummy variable =1 for age less than 30
-0.027 (0.027)
-0.033 (0.022)
-0.036 (0.022)
dummy variable =1 for age 30-39
-0.050 (0.024)
-0.077 (0.019)
-0.078 (0.019)
dummy variable =1 for age 50-59
0.147 (0.064)
-0.013 (0.016)
-0.013 (0.016)
Notes: Attendance and education are standardized to be mean 0, variance 1. Standard errors in parentheses. Also includes region dummies

34
Table II OLS of Attendance on Education: World Values Survey
country
(1) Attendance
on Education and Age
(2) Attendance
on Education and Age w/
Controls
Description
France 0.116 (0.024)
0.094 (0.034)
63% Catholic 17% no religion
Great Britain 0.223 (0.021)
0.208 (0.032)
37% no religion 37% Anglican
West Germany
-0.024 (0.016)
0.015 (0.022)
43% Catholic 43% Lutheran
Italy -0.061 (0.018)
-0.007 (0.032)
93% Catholic
Netherlands -0.041 (0.023)
-0.01 (0.036)
55% no religion 22% Catholic, 12% other Protestant
Spain 0.034 (0.013)
0.062 (0.019)
85% Catholic
Norway 0.104 (0.018)
0.129 (0.022)
91% Protestant
Sweden 0.096 (0.021)
0.096 (0.026)
83% Lutheran
Switzerland -0.073 (0.03)
0.026 (0.041)
54% Catholic 43% Protestant
Austria -0.055 (0.032)
-0.024 (0.037)
81% Catholic
Ireland 0.044 (0.023)
0.022 (0.033)
93% Catholic
Poland -0.139 (0.025)
-0.148 (0.029)
95% Catholic
Ukraine -0.115 (0.022)
-0.086 (0.026)
58% Russian Orthodox 33% no religion
Russia -0.063
(0.017) -0.046 (0.02)
70% no religion 20% Russian Orthodox
Romania -0.153 (0.032)
-0.136 (0.037)
70% Romanian Orthodox
East German 0.004 (0.022)
0.038 (0.026)
64% no religion 27% Lutheran
Canada -0.01 (0.019)
0.003 (0.025)
58% no religion 23% Catholic
Australia -0.006 (0.021)
0.055 (0.029)
27% no religion 25% Anglican, 21% Catholic
Japan -0.003 (0.019)
-0.024 (0.024)
33% Hindu 24% Shinto
China -0.01 (0.033)
-0.033 (0.039)
97% no religion
Brazil 0.005 (0.026)
0.02 (0.049)
70% Catholic
India -0.015 (0.017)
0.052 (0.021)
84% Hindu
Notes: Attendance and education are standardized to be mean 0, variance 1 within each country. Education variable is age when finished schooling. Attendance variable is an index based on frequency of attendance (once a day, 2-3 times per week, once per week, 1-2 times per month, less than once per month, 1-2 times per year, never.) Columns (1) and (2) include dummies for 4 age categories. Column (2) includes controls for income, female, married, number of children.

35
Table III Means of Belief and Social Measures By Denomination
(1) Baptist
(2) Other
protest-ant
(3) Cath-
olic
(4) Meth-
odist
(5) Luth-
eran
(6) Non-
denom protest-
ant
(7) Presby-
terian
(8) Other
religion
(9) Epis-copal
(10) Jew
Mean of...
Education -0.728 -0.504 -0.300 -0.296 -0.279 -0.198 0.073 0.237 0.354 0.566
Attendance Fixed Effect 0.260 0.522 0.236 -0.012 0.050 -0.19 -0.087 -0.188 -0.185 -0.565
Belief in afterlife 0.092 0.148 -0.071 0.023 0.030 0.018 0.008 -0.125 -0.097 -0.962
Belief in Heaven 0.326 0.221 -0.093 -0.036 -0.053 -0.108 -0.064 -0.55 -0.213 -1.677
Belief in Devil 0.332 0.302 -0.193 -0.177 -0.022 0.018 0.025 -0.556 -0.125 -1.285
Belief in Miracles 0.253 0.129 -0.034 -0.133 -0.045 -0.009 -0.059 -0.162 -0.256 -1.279
Adversity is punishment for sins 0.033 0.043 0.041 -0.174 0.132 -0.024 -0.208 0.182 -0.343 -0.313
Bible is literal truth 0.353 0.366 -0.226 -0.067 0.045 -0.078 -0.189 -0.462 -0.154 -1.327
Participate in church activities -0.008 0.44 -0.143 -0.087 -0.202 0.105 -0.245 0.231 -0.498 0.44
Number friends in congregation -0.023 0.04 0.03 0.004 -0.067 -0.046 -0.076 0.141 -0.071 -0.027
Rely on help from congregation 0.124 0.312 -0.388 0.226 -0.016 0.353 -0.030 0.311 -0.040 -0.304
Notes: All variables are standardized to mean 0, variance 1 within the sample. GSS data.

36
Table IV Correlation of Beliefs with
Attendance Fixed Effect and Mean Education Correlation with
Attendance FE by Denomination
Correlation with Average
Education by Denomination
Mean (by denomination) of... Attendance Fixed Effect 1.00 Education -0.86 1.00 Belief in afterlife 0.75 -0.74 Belief in Heaven 0.82 -0.80 Belief in Devil 0.80 -0.80 Belief in Miracles 0.79 -0.78 Adversity is punishment for sins 0.53 -0.52 Bible is literal truth 0.84 -0.81 Participate in church activities -0.02 0.02 Number friends in congregation 0.19 -0.04 Rely on help from congregation 0.23 -0.30
Notes: We take means by denomination of each variable and correlate with attendance fixed effect and education. Attendance fixed effect refers to coefficient in regression of attendance on denominational dummy.

37
Table V GSS
OLS of Membership on Education
Coefficient on Education
Total Number of Memberships
0.293 (0.006)
Member of Church Group 0.130 (0.006)
Member of Fraternal Group 0.117 (0.006)
Member of Service Club 0.158 (0.007)
Member of Veteran's Group 0.023 (0.007)
Member of Political Club 0.117 (0.007)
Member of Labor union -0.056 (0.006)
Member of a Sports Group 0.098 (0.006)
Member of Youth Group 0.085 (0.007)
Member of School Service Group
0.149 (0.006)
Member of Hobby or Garden Club
0.089 (0.007)
Member of School Fraternity/Sorority
0.212 (0.007)
Member of Nationality Group
0.082 (0.007)
Member of Farm Organization
0.031 (0.007)
Member of Literary or Art Discussion or Study Group
.195 ( 0.007)
Member of Professional or Academic Society
0.362 (0.006)
Member of Any Other Group 0.080 (0.007)
Trust Index 0.162 (0.006)
Number Close Friends 0.06 (0.019)
Notes: GSS data. Each row is a separate regression. Value reported is coefficient of membership on education with standard errors in parentheses. Regressions include controls for age, income, married, female, number of children, and region.

38
Table VI World Values Survey
OLS of Membership on Education
country
Number of Social
Memberships
France 0.249 (0.035)
Great Britain 0.207 (0.028)
West Germany
0.167 (0.019)
Italy 0.085 (0.028)
Netherlands 0.145 (0.034)
Spain 0.187 (0.017)
Norway -0.005 (0.021)
Switzerland 0.166 (0.034)
Austria -0.021 (0.037)
Ireland 0.179 (0.034)
Ukraine 0.12 (0.022)
Russia 0.184 (0.017)
Romania 0.201 (0.032)
East German 0.168 (0.022)
USA 0.262 (0.021)
Canada 0.148 (0.026)
Australia 0.2 (0.025)
Japan 0.148 (0.026)
China 0.176 (0.033)
Brazil 0.25 (0.02)
India 0.127 (0.025)
Notes: Membership and education are standardized to be mean 0, variance 1 within each country. Education variable is age when finished schooling. Regressions include dummies for 4 age categories. Membership is number of memberships in voluntary organizations for sports, arts, professional organizations, social organizations, charity organizations, and environmental organizations.

39
Table VII GSS
OLS of Attend, Pray, Feel God on Education and Sociability (1)
Attend (2)
Attend For people
with memberships
=0
(3) Pray
(4) Feel
God's Presence
Education
0.134 (0.008)
0.064 (0.012)
-0.005 (0.007)
-0.028 (0.025)
Number of Memberships (excl. church related)
0.053 (0.007)
R-squared .10 .09 .16 .10
N 18495 7176 14359 1344
Notes: GSS data. Each column is a separate regression. Regressions include controls for age, income, married, female, number of children, and region.

40
Table VIII GSS
OLS of Beliefs on Education and other Controls
(1) Belief in afterlife
(2) Belief in Heaven
(3) Belief in
devil
(4) Belief in miracles
(5) Belief that
adversity is punishment
(6) Belief that
Bible is literal truth
Coefficient on education (no denom fixed effect)
0.021 (0.006)
-0.137 (0.018)
-0.055 (0.026)
-0.050 (0.019)
-0.132 (0.025)
-0.139 (0.018)
Coefficient on education (w/ denom fixed effect)
0.061 (0.006)
-0.105 (0.019)
-0.001 (0.027)
-0.009 (0.020)
-0.120 (0.027)
-0.122 (0.019)
N 22,195 2131 1,118 2117 1158 2117
Notes: GSS data. Each coefficient is from a separate regression. Regressions include controls for age, income, married, female, number of children, and region.

41
Table IX World Values Survey / ISSP OLS of Beliefs on Education
country
(1) Belief
in God
(2) Belief in Heaven
(3) Belief in
Devil
(4) Belief that
Bible is literal truth
(5) Belief in
Faith Healers
France -0.045 (0.025)
-0.05 (0.025)
0.048 (0.025)
Great Britain -0.052 (0.022)
-0.144 (0.022)
-0.04 (0.023)
-0.138 (0.030)
-0.069 (0.030)
West Germany
-0.056 (0.017)
-0.146 (0.017)
-0.061 (0.017)
-0.131 (0.028)
-0.067 (0.028)
Italy -0.081 (0.019)
-0.152 (0.019)
-0.101 (0.02)
-0.184 (0.034)
Netherlands -0.079 (0.024)
-0.129 (0.025)
-0.033 (0.025)
-0.129 (0.025)
Spain -0.079 (0.014)
-0.058 (0.014)
-0.02 (0.014)
Norway -0.033 (0.018)
-0.05 (0.018)
-0.043 (0.018)
-0.148 (0.027)
Switzerland -0.015 (0.032)
-0.103 (0.034)
-0.031 (0.034)
Austria 0 (0.037)
0.021 (0.035)
0.033 (0.034)
-0.126 (0.032)
-0.063 (0.032)
Ireland -0.022 (0.023)
-0.022 (0.024)
0.08 (0.024)
-0.203 (0.033)
-0.068 (0.035)
Poland -0.169 (0.041)
-0.197 (0.042)
-0.071 (0.041)
-0.177 (0.031)
Ukraine -0.095 (0.023)
-0.144 (0.026)
-0.094 (0.025)
Russia -0.11 (0.019)
-0.117 (0.02)
-0.069 (0.02)
-0.087 (0.022)
Romania -0.109 (0.033)
-0.308 (0.033)
-0.152 (0.034)
East German -0.024 (0.023)
-0.074 (0.023)
-0.01 (0.023)
-0.023 (0.027)
-0.115 (0.027)
USA -0.079 (0.014)
-0.147 (0.015)
-0.093 (0.015)
Canada -0.084 (0.02)
-0.108 (0.02)
-0.006 (0.021)
Australia -0.083 (0.022)
-0.163 (0.022)
-0.097 (0.023)
-0.100 (0.022)
Japan -0.091 (0.024)
-0.111 (0.025)
-0.081 (0.025)
Brazil -0.036 (0.03)
-0.103 (0.027)
0.017 (0.026)
India -0.061 (0.018)
-0.176 (0.017)
-0.132 (0.017)
Notes: Reported values are coefficients of beliefs on education in OLS regression. Standard errors are in parentheses. Belief measures and education are standardized to be mean 0, variance 1 within each country. Raw belief measures are yes-no (0-1) responses in columns (1)-(3). Columns (1)-(3) are from World Values Survey. Columns (4)-(5) are from 1991 ISSP. Education variable is age when finished schooling. Regressions include dummies for 4 age categories.

42
Table X OLS of Attendance and Beliefs on Dummy for Creationism in Schools
(1)
Attend
(2) Attend
(3) Belief
in Devil
(4) Belief
in Devil Creation taught in schools (0-1)
0.236 (0.020)
0.088 (0.031)
0.510 (0.096)
0.171 (0.158)
dummy for age less than 30
-0.201 (0.020)
-0.218 (0.020)
-0.034 (0.090)
-0.046 (0.093)
dummy for age 30-39
-0.074 (0.020)
-0.078 (0.020)
-0.005 (0.088)
0.011 (0.088)
dummy for age 50-59
0.115 (0.023)
0.108 (0.022)
-0.039 (0.112)
-0.071 (0.111)
dummy for age 60+
0.214 (0.022)
0.207 (0.022)
0.007 (0.093)
-0.032 (0.092)
constant -0.011 (0.015)
0.013 (0.016)
-0.051 (0.069)
-0.006 (0.071)
State fixed effects? no yes no yes R-squared .02 .05 .02 .11 N 26,871 26,871 1158 1158

43
Table XI R-squareds from OLS of Education and
Beliefs on Denomination Dummies
R-squared
Education
.06
Belief in After Life
.06
Belief in Heaven
.23
Belief in Devil
.14
Belief in Miracles
.14
Adversity is Punishment
.01
Bible is Literal Truth
.21
Notes: GSS data. There are the r-squareds from OLS regressions of education and belief variables on denomination fixed effects.

44
Table XII: Beliefs and Education for Switchers (1)
Denom Belief Index
switchers
(2) Denom Belief Index
switchers
(3) Denom Belief Index
switchers
(4) Switch
(0-1)
(5) Switch
(0-1)
(6) Switch
(0-1)
Education -0.089 (0.008)
-0.09 (0.01)
0.017 (0.003)
0.015 (0.003)
Belief in Afterlife 0.059 (0.01)
0.06 (0.01)
0.022 (0.003)
0.021 (0.003)
Education*(Initial denomination belief index) 0.02 (0.003)
0.021 (0.003)
Belief in Afterlife*(Initial denomination belief index)
-0.011 (0.003)
-0.012 (0.003)
Log income -0.041 (0.018)
-0.1 (0.022)
-0.047 (0.022)
0.002 (0.006)
0.018 (0.007)
0.006 (0.007)
Income missing -0.081 (0.053)
-0.155 (0.063)
-0.069 (0.063)
-0.011 (0.017)
0.024 (0.022)
0.005 (0.021)
Black 0.156 (0.024)
0.189 (0.029)
0.166 (0.029)
-0.052 (0.007)
-0.052 (0.009)
-0.048 (0.009)
Female 0.096 (0.026)
0.099 (0.032)
0.102 (0.031)
0.038 (0.008)
0.029 (0.01)
0.027 (0.01)
Birth year -0.002 (0.001)
-0.003 (0.001)
-0.002 (0.001)
Married 0.104 (0.027)
0.116 (0.032)
0.118 (0.032)
0.055 (0.008)
0.055 (0.01)
0.054 (0.01)
Female*married -0.082 (0.032)
-0.073 (0.039)
-0.087 (0.038)
-0.018 (0.01)
-0.021 (0.012)
-0.018 (0.012)
Number of children between ages of 0 and 5 0.033 (0.014)
0.044 (0.018)
0.039 (0.017)
0.006 (0.005)
0.001 (0.006)
0.002 (0.006)
Number of children between ages of 6 and 12 0.037 (0.011)
0.039 (0.014)
0.033 (0.014)
0.006 (0.004)
0.005 (0.005)
0.006 (0.005)
Number of children between ages of 13 and 19
0.023 (0.013)
0.037 (0.016)
0.027 (0.016)
0.001 (0.004)
-0.004 (0.005)
-0.002 (0.005)
Dummy for residence in the South 0.111 (0.018)
0.134 (0.022)
0.125 (0.022)
-0.036 (0.006)
-0.034 (0.007)
-0.032 (0.007)
Dummy for residence in the East -0.091 (0.022)
-0.074 (0.027)
-0.079 (0.027)
-0.045 (0.007)
-0.026 (0.009)
-0.026 (0.009)
Dummy for residence in the West 0.014 (0.021)
-0.005 (0.025)
0.004 (0.025)
0.023 (0.008)
0.034 (0.009)
0.032 (0.009)
Log of population of city of residence -0.013 (0.004)
-0.016 (0.004)
-0.013 (0.004)
0.003 (0.001)
0.006 (0.001)
0.005 (0.001)
Dummy for age less than 30 0.019 (0.03)
0.017 (0.037)
-0.004 (0.036)
-0.091 (0.009)
-0.082 (0.01)
-0.081 (0.01)
Dummy for age 30-39 -0.004 (0.025)
0.013 (0.03)
0.012 (0.03)
-0.036 (0.008)
-0.03 (0.01)
-0.03 (0.01)
Dummy for age 60+ 0.036 (0.027)
0.056 (0.032)
0.049 (0.032)
-0.002 (0.009)
-0.007 (0.011)
-0.004 (0.011)
Dummy for age 50-60 -0.009 (0.033)
0.036 (0.04)
0.015 (0.039)
0.003 (0.011)
-0.002 (0.014)
0.003 (0.014)
Constant 3.717 (1.676)
5.794 (2.006)
3.534 (2.006)
R-squared .06 .06 .07 .07 .07 .07 N 7609 5321 5321 30,942 21,669 21,669
Notes: GSS data. Columns (1)-(3) include switchers only. Columns (4)-(6) are probits with partial derivatives shown. Education, attendance, and beliefs are standardized to mean 0, variance 1.

45
Table XIII OLS of Education on Parents' Education and Beliefs
(1) Education
(2) Education
father's years of education 0.328 (0.009)
0.339 (0.019)
mother's years of education 0.299 (0.009)
0.296 (0.022)
Age 16 religion: mean belief in Devil
-0.452 (0.066)
dummy variable for jew at age 16
0.69 (0.046)
dummy variable for catholic 0.101 (0.022)
dummy variable for baptist -0.113 (0.024)
dummy variable for lutheran 0.066 (0.03)
dummy variable for episcopal
0.278 (0.045)
dummy variable for methodist
0.096 (0.026)
dummy variable for presbyterian
0.200 (0.034)
dummy for nondenominational protestant
-0.067 (0.049)
dummy for other religion 0.502 (0.052)
R-squared .32 .32
N 23,335 23,211
Notes: In regression (1), ommitted category is "other protestant." Regressions include controls for age, cohort, race, gender, and region. Education and beliefs variables are standardized to be mean 0, variance 1 at the individual person level. Standard errors in column (2) are clustered at the denomination level.

46
Table XIV Interaction of Political Variables with Education
(1)
Attend (2)
Belief in God
(3) Belief in
Hell
(4) Attend
(5) Belief in
God
(6) Belief in
Hell Education -0.002
(0.004)
-0.064 (0.004)
-0.053 (0.004)
-0.067 (0.008)
-0.045 (0.009)
-0.07 (0.009)
Education* dummy for socialist country
-0.091 (0.007)
-0.058 (0.007)
-0.061 (0.008)
Education* political constraints index
0.113 (0.013)
-0.033 (0.013)
0.03 (0.013)
R-squared
.03 .02 .01 .04 .02 .01
N
122,977 107,453 102,124 88,208 79,215 76,846
Notes: World Values Survey data. All regressions are OLS and include age dummies and country fixed effects. Education, attendance, and beliefs are standardized to mean 0, variance 1 at country level. Columns (4)-(6) are for non-Socialist countries.

47
Appendix I Attend church Ranges from zero to one indicating the frequency with which the respondent attends religious
services. A one indicates respondent attends more than once a week while a zero means they attend never (original variable ranged from 0 to 8 e.g. a 2 indicated that respondent attended a couple times a year, 4 once a month, and 6 nearly every week and so on).
Belief in afterlife Equals one if the respondent believes there is life after death and zero if respondent does not believe there is life after death.
Birth year Represents the respondent�s year of birth. Ranges from 0 to 93. The oldest person was born in 1883.
Education Years of education.
Health Ranges from zero to one with one indicating that the respondent believes their health to be excellent and zero indicating poor health (original variable ranged from one to four).
Join Religion A dummy variable equal to 1 if the respondent reports a current religious affiliation and "No religion" at age 16.
Leave Religion A dummy variable equal to 1 if the respondent's current religious affiliation is "No religion" and age 16 religious affiliation is a religious group.
Log of city population
Logarithm of the population of the respondent�s city.
Log of income Logarithm of family real income in 1986 dollars for the previous year. Set to 0 when missing ( (dummy variable for income missing controls for this).
Mother/Father attend church
Ranges from zero to one with one being mother/father attended religious services more than once a week and zero being she/he attended religious services never.
Near God Ranges from zero to one with one indicating respondent feels �extremely close to god� and zero being �does not believe in god� (original variable ranged from one to five).
Non-religious
membership
Ranges from one to fifteen indicating the number on non-religious groups the respondent is a
member of.
Pray often Ranges from zero to one with one being prays several times a day and zero never (original
variable ranged from one to six).
Religion size The proportion of the GSS respondents in the respondent�s home state who are members of the their religious group at age 16.
School group membership
A dummy variable equal to 1 if the respondent is a member of a school related group.
Stay in state A dummy variable equal to 1 if the respondent's current state of residence is the same as his or her age 16 state of residence
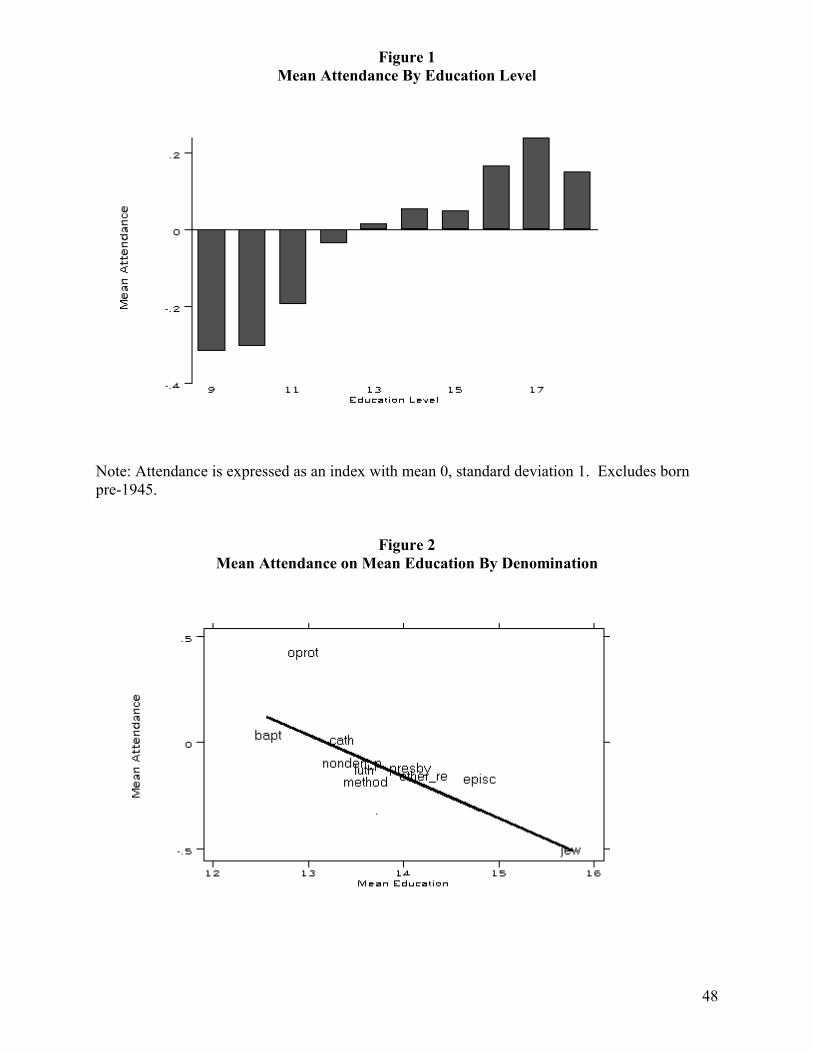
48
Figure 1 Mean Attendance By Education Level
Note: Attendance is expressed as an index with mean 0, standard deviation 1. Excludes born pre-1945.
Figure 2 Mean Attendance on Mean Education By Denomination
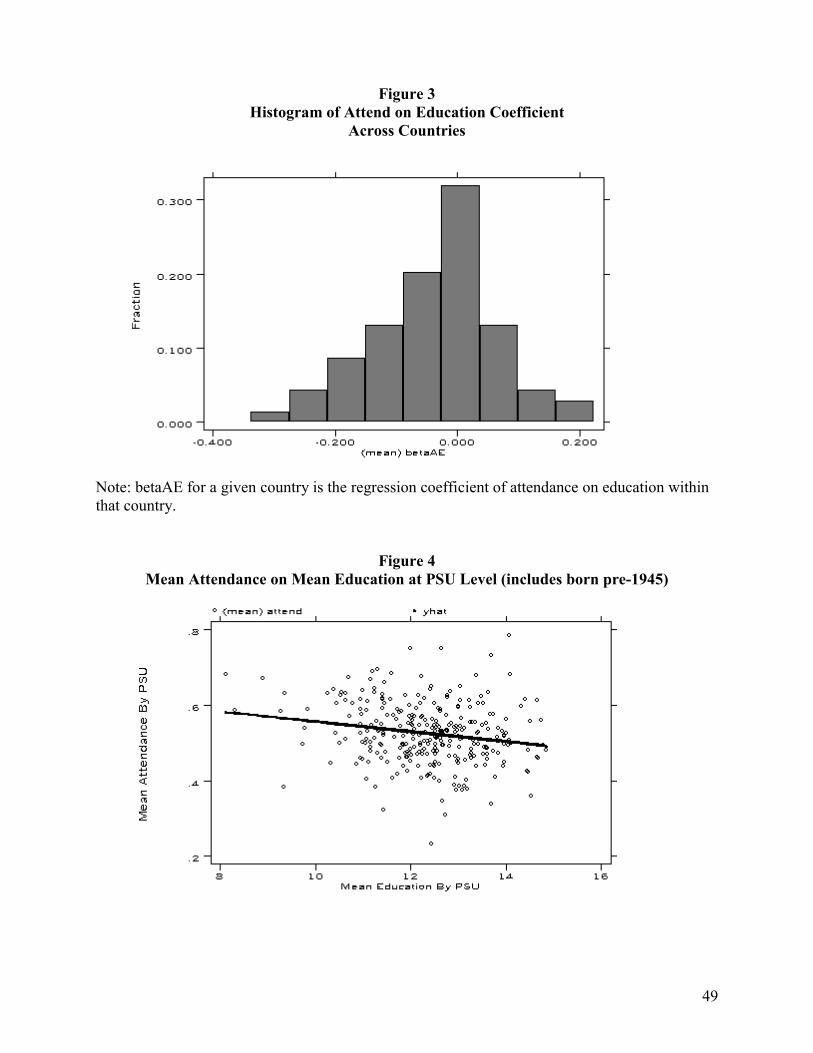
49
Figure 3 Histogram of Attend on Education Coefficient
Across Countries
Note: betaAE for a given country is the regression coefficient of attendance on education within that country.
Figure 4 Mean Attendance on Mean Education at PSU Level (includes born pre-1945)

50
Figure 5 Education Versus Belief that Bible is Literal Truth
Across PSUs
Figure 6 Education Versus Belief in Devil
Across PSUs

51
Figure 7 Attendance on Education Coefficient
Versus Membership on Education Coefficient Cross Country Data
Figure 8 Attendance on Education Coefficient
Versus Belief in Devil on Education Coefficient Cross Country Data

52
Figure 9 Attendance on Education Coefficient
Versus Belief in God on Education Coefficient Cross Country Data