Embed Size (px)
Citation preview

NBER WORKING PAPER SERIES
MARKET POWER VERSUS EFFICIENCY EFFECTSOF MERGERS AND RESEARCH JOINT VENTURES:
EVIDENCE FROM THE SEMICONDUCTOR INDUSTRY
Klaus Gugler Ralph Siebert
Working Paper 10323http://www.nber.org/papers/w10323
NATIONAL BUREAU OF ECONOMIC RESEARCH1050 Massachusetts Avenue
Cambridge, MA 02138February 2004
We would like to thank Paul Geroski, Stephen Martin, Dennis C. Mueller, Lars-Hendrik Roeller, participantsat the NBER and ZEW workshops as well as the EARIE conference in Helsinki and the IIOC in Boston forhelpful comments and suggestions. We also thank Andrea Gaunersdorfer. We are very grateful to the"VolkswagenStiftung" and the OeNB Jubilaeumsfond project No. 8861 for financial support. We would alsolike to thank Harvard University and the NBER for the hospitality, while working on this study. Allremaining errors are our own. The views expressed herein are those of the authors and not necessarily thoseof the National Bureau of Economic Research.
©2004 by Klaus Gugler and Ralph Siebert. All rights reserved. Short sections of text, not to exceed twoparagraphs, may be quoted without explicit permission provided that full credit, including © notice, is givento the source.

Market Power versus Efficiency Effects of Mergers and Research Joint Ventures: Evidence fromthe Semiconductor IndustryKlaus Gugler and Ralph SiebertNBER Working Paper No. 10323February 2004JEL No. L13, L49, L63
ABSTRACT
Merger control authorities may approve a merger based on a so-called "efficiency defence". An
important aspect in clearing mergers is that the efficiencies need to be merger-specific. Joint
ventures, and in particular research joint ventures (RJVs), may achieve comparable efficiencies
possibly without the anti-competitive (market power) effects of mergers. We present evidence for
the semiconductor industry that RJVs indeed represent viable alternatives to mergers. We
empirically account for the endogenous formation of mergers and RJVs.
Klaus GuglerUniversity of ViennaDepartment of EconomicsBruennerstrasse 721210 [email protected]
Ralph SiebertPurdue UniversityDepartment of EconomicsKrannert School of Management403 West State StreetWest Lafayette, IN [email protected]

1 Introduction
Many economists argue that competition authorities should take efficiency gains into ac-
count when examining merger cases. For example, Williamson (1968) highlighted the
trade off between market power and efficiency effects. The US Department of Justice
and Federal Trade Commission Horizontal Merger Guidelines’ revisions (1992 and 1997)
clarify the approval of mergers based on the “efficiency defence”. If firms can convince
merger control authorities that the efficiencies generated by the merger more than out-
weigh the market power effects (and the former are passed-on to consumers), the merger
may be cleared.1 Under these circumstances, price may decrease and consumer welfare
may increase, see also Farrell and Shapiro (1990). A further aspect in clearing mergers
is that the efficiencies need to be merger-specific. That is, the efficiencies are “unlikely
to be accomplished in the absence of either the proposed merger or another means hav-
ing comparable anticompetitive effects.” The Guidelines explicitly mention joint ventures
that may achieve comparable efficiencies possibly without the anti-competitive effects of
mergers. However, very little is known about the extent to which the different types of
cooperations achieve efficiency and/or market power, and there are no studies comparing
the different modes of cooperation and assess their substitutability. This study provides
insights to what extent mergers generate (net) efficiency effects, and whether these could
possibly be achieved by viable alternatives, such as research joint ventures (RJVs).
Mergers and RJVs can achieve a number of remedies to the shortcomings of the inno-
vation process.2 Most notably, participating firms can internalize the positive externalities
of R&D through coordinating their R&D investments. Other motives are e.g. avoiding
wasteful duplication through information sharing, exploiting scale and scope effects in
1Similar regulations are currently discussed by the European Commission (see Draft Commission No-
tice on the appraisal of horizontal mergers under the Council Regulation on the control of concentrations
between undertakings, 11 December, 2002).2A priori, one would expect that most efficiency effects can be attributed to RJVs. Indeed, antitrust
treatment is more strict in the case of production joint ventures than in the case of RJVs, see the
discussion in Jorde and Teece (1990) and Shapiro and Willig (1990).
1

R&D, sharing risks associated with uncertain technologies as well as sharing large sunk
set-up costs.3 This may increase R&D investment and hence improve efficiency, which
causes market shares to increase and prices to decrease (efficiency effect). Not surpris-
ingly then, the theoretical as well as the empirical literature on RJVs conclude that RJVs
can be seen as an instrument to achieve efficiency gains and are beneficial to consumer
welfare.4 Moreover, RJVs - in contrast to full mergers - do not reduce the number of
firms in the industry. Thus, the danger for market power increases appears to be much
less for RJVs than for mergers. Competition authorities are well aware of this fact and
view RJVs with benevolence. For example, the US Department of Justice enacted the
National Cooperative Research Act of 1984 in order to enforce RJVs. This act protects
registered RJVs under the antitrust laws, such that they cannot be considered per se
illegal, and must be judged by the antitrust rule of reason. Moreover, the act reduces the
damage penalty in case of a violation of the antitrust laws.5
The crucial difference between mergers and RJVs consists in the behavior of firms in
the product market. Whereas in RJVs firms make their production decisions indepen-
dently, by definition firms act cooperatively in mergers.6 A merger enables insiders to
3See further Katz and Ordover (1990), and Jacquemin (1988).4Widely cited theoretical contributions are Brander and Spence (1983), Spence (1984), Katz (1986),
d’Aspremont and Jacquemin (1988) and Kamien, Muller and Zang (1992). See DeBondt (1996) for a
survey on the literature on spillovers and innovative activity. Empirical studies predominantly analyzed
the determinants of RJV formation, as well as their impact on R&D investment, and profitability. For the
determinants of RJVs see Cassiman and Veugelers (1999), Roller, Siebert and Tombak (2000) or Kaiser
(2002) among others, and for the effects on R&D spending or patenting activity, see Irwin and Klenow
(1996) and Branstetter and Sakakibara (2002) among others.5In the European Union, treatment of RJVs is also generally favorable. Under certain restrictions,
there is a block exemption for R&D cooperation if the combined market shares of the cooperating firms are
no greater than 25%. Even if a proposed R&D cooperation does not fall under the block exemption, it may
nonetheless be permitted under Article 81(3) of the EU Treaty. There are also a number of government
sponsored R&D projects worldwide, e.g. Sematech (Semiconductor Manufacturing Technology) in the
USA, VLSI (Very Large Scale Integrated Circuits) in Japan or the Fifth Framework Programme in the
EU.6Note, however that RJVs may increase the possibility of collusion in the product market (see Martin,
2

internalize the competitive externality in the product market and insiders reduce their
production inducing market price to increase (market power effect).
Prominent contributions on the effects on mergers are primarily based on numerical
methods, see e.g. Berry and Pakes (1993), Gowrisankaran (1999), Dockner and Gauners-
dorfer (2001) and Werden and Froeb (1994). However, empirical evidence on the effects
of mergers or RJVs on cost efficiencies or market power is rather scant.7 Up to date,
there are only four studies that estimate the effects of mergers by using market shares.8
Goldberg (1973) finds no significant change in market shares of 44 companies acquired in
the 50ies and 60ies in the (median three and a half) years following the merger. Bald-
win and Gorecki (1990) find significant declines in market shares for plants acquired in
horizontal mergers. Mueller (1985), the most ambituous study of mergers and market
share, uses FTC market share data for the 1,000 largest companies in 1950 and 1972. His
results indicate that while control-group firms (selected on the basis of industry and size)
retained 55% of their 1950 market share in 1972, firms undertaking horizontal mergers
retained only 14% of their 1950 market share. Pesendorfer (2003) found that 74.1 % of
merging firms lost on market shares. One difficult, but important aspect in analyzing
mergers is to account for endogeneity problems in merger formation. We are not aware
of any study analyzing the effects of RJVs on market shares.
Our theoretical framework in analyzing the net effects of mergers and RJVs follows
1995).7For more empirical studies analyzing the effects of mergers on profitability or sales growth, see,
among others, Mueller (1980), Ravenscraft and Scherer (1987) and Gugler et al. (2003). For an overview
of contemporary empirical merger analysis, see Baker (1997).8The evaluation of market shares has several significant advantages. Among others, they allow to
implicitly derive the efficiency and market power effects without using cost data. Cost data, e.g. fixed or
sunk costs, are difficult to disentangle or to explicitly refer to a certain industry, like the semiconductor
industry. For example, many semiconductor firms like IBM, Siemens and Toshiba are prevalent in many
industries. Therefore, it is rather difficult to refer part of their fixed costs to the semiconductor industry.
Another advantage from inferring the efficiencies from the reallocation of pre- and post-merger equilibrium
market shares is that we avoid solving for equilibrium quantities in closed-form solutions, which is a
difficult task, even for very simple oligopoly models.
3

Farrell and Shapiro (1990). Most commonly used models of oligopoly predict that if the
market power effect outweighs any efficiency gains due to a merger, the market share of
the merged firm drops relative to the sum of the market shares of acquiring and target firm
before the merger, and market price increases. In contrast, if a merger generates sufficient
cost synergies to outweigh the market power effect, the merging firms’ market share will
increase, inducing price to decline and consumer welfare to increase. For example, in a
Cournot model with homogenous products, Farrell and Shapiro (1990) implicitly derive
the cost efficiencies, which are necessary for price to decline, from the change of merging
firms’ market shares. In the Appendix we show that results hold up when allowing for
differentiated products.9
We empirically analyze the efficiency versus market power effects of mergers and RJVs
in one of the most important high-technology industries, the semiconductor industry,
during the period 1989 to 1999. This industry is characterized by a high degree of process
and product innovation as well as high capital intensity. For example, the semiconductor
companies rank highest in spending R&D as a percentage of sales (13%), outranking the
drug, computer and other industries. The number of US-patent applications increases by
approximately 16% every year, from 2,196 in 1989 to 6,036 in 1996 (see Hall, Jaffe and
Trajtenberg, 2001). The worldwide total revenues of the semiconductor industry reached
168.9 Billion USD in 1999, compared to 52.7 Billion USD in 1989.
The empirical analysis proceeds in three steps. First, we follow previous studies and
estimate a standard OLS merger/RJV effects regression by the introduction of dummy
variables. Second, to account for the endogeneity of the merger/RJV formation, we esti-
mate an endogenous switching model. In its first step, this model isolates the exogenous
determinants of mergers/RJVs, e.g. the size and innovativeness of the firm etc., as well
as endogenous factors, i.e. the predicted market shares under the different regimes. Its
second step, the effects regression, provides consistent estimates of the net effects of the
mergers/RJVs on market shares, while accounting for endogenous selection. We apply
9Other merger studies investigating differentiated product markets in combination with price compe-
tition are e.g. Deneckere and Davidson (1985) and Werden and Froeb (1994).
4
these estimation procedures to the 4-digit (3344 NAICS) semiconductor industry, as well
as to the 6-digit (334418 NAICS) memory and the 6-digit (334413 NAICS) microcompo-
nents industry.
We find for all three industry-levels that mergers raise the market share of participating
firms as do RJVs, providing evidence that efficiency effects dominate market power effects
for both forms of cooperation. However, we also find that the efficiency gains caused by
mergers may have been achieved by RJVs as well. Therefore, RJVs often represent viable
alternatives to mergers from the consumer welfare point of view.
The paper is structured as follows. Section 2 describes our dataset on mergers and
RJVs in the semiconductor industry. In Section 3, we apply the empirical analysis, and
we conclude in Section 4. The Appendix presents an extension of the theoretical model
by Farrell and Shapiro (1990), which allows for product differentiation and provides the
basis for our empirical part.
2 The Industry Description and Data
Firms’ annual market shares in the semiconductor industry are provided by Gartner
Group. This company collects production data for each firm operating in the semiconduc-
tor industry on an annual basis. Thus, we do not need to rely on accounting information
to infer market shares. The data source for research joint ventures and mergers is the
Thompson Financial Securities Database. This database includes alliances with a deal
value of more than 1 Mio. USD ensuring that the overwhelming majority of mergers and
research joint ventures is covered.
The semiconductor industry is one of the most important high-technology industries.
According to Jorgenson (2001), the semiconductor markets are especially important as
their prices have significant impact on many other downstream industries, such as the
computer, automobiles, and communications industry. Semiconductors are mainly used
as inputs for the computer industry (45% of its sales), consumer electronics (23%), and
communications equipment (13%). The semiconductor market consists of memory chips,
5
micro components, and other components such as logic devices. The industry is charac-
terized by worldwide selling companies mainly from the United States, Japan, Europe,
and other countries in the Asian-Pacific region, with a 39.6%, 40.1%, 8.5%, and 11.8%
market share, respectively (Dataquest, 1999). The international production rates vary
drastically depending on the type of semiconductor component (see Table 1a).10
Tables 1b-d display statistics on industry revenues and number of firms in the semi-
conductor industry as a whole, as well as the memory and the microcomponents segments,
of all firms producing for at least one year in the semiconductor industry worldwide from
1989 to 1999. In the 1990s, competition in the semiconductor industry increased dramat-
ically, brought on by the larger number of firms, which rose from 132 in 1989 to 188 in
1998 (see Table 1b). The semiconductor industry generated annually 107,402 Mio. US-$
on average from 1989 to 1999. The Herfindahl index is around 400, with the HHI being
much larger in the microcomponents (more than 2000 in the last two years) than in the
memory segment.11
The memory and the microcomponents markets make up for 50% of the sales in the
semiconductor industry, with each generating between 25 and 30 billion US-$, on average.
The microcomponents segment grew much faster than the memory segment over the
period of investigation: While the share of the memory segment in total semiconductors
fell from 27.5% in 1989 to 20.4% in 1999, the share of the microcomponents segment
increased from 14.8% to 33.7% during the same time period.
On average, 54 firms operated in the memory and 75 firms in the microcomponents
segment in a given year during the 1989-1999 period. Again time trends are interesting:
while the number of firms stayed nearly constant in the memory segment, the microcom-
ponents segment is characterized by positive net entry over the 1989-1999 period (the
10For more industry descriptions, see Irwin and Klenow (1994 and 1996), Flamm (1996) and Gruber
(1992 and 1996).11According to the US Merger Guidelines mergers are generally not challenged when the HHI is smaller
than 1000, when the HHI is between 1000 and 1800 and the merger
will increase the HHI by less than 100 points, or when the HHI is larger than 1800 and the merger will
increase the HHI by less than 50 points. All other mergers might be challenged.
6

number of firms increased from 51 in 1989 to 88 in 1999).
A higher competitive pressure increased the technological pace resulting in shorter
life cycles over time, see Jorgenson (2001). As the semiconductor industry is heavily
capital-intensive, strategic alliances like mergers and RJVs became increasingly important
during the 90’s. Prominent examples are SEMATECH, MITI and ESPRIT, consortia
established by the U.S., Japan and Europe in order to promote the technological pace
and the development of semiconductor chips, see also Song (2003). Table 2 presents
statistics on the number of completed deals. There are 111 horizontal mergers and 244
RJVs (actually RJV years) during the 1989-1999 period. A research joint venture is
defined to operate in the semiconductor industry if the main objective of the research
refers to the NAICS 3344. On average 2.92 firms participate in an RJV.12 A similar
number of RJVs have been formed in the memory and the microcomponents industry (57
and 63, respectively), while the number of mergers taken place in the microcomponents
industry is much higher with 53 than in the memory industry with 34.
Tables 3a-c present summary statistics on market shares of firms participating in merg-
ers and RJVs for the semiconductor, memory and microcomponents industry. As shown
in Table 3a, acquiring firms in a merger have a mean market share in the semiconductor
industry of 2.5% in the year before the merger, while their targets are considerably smaller
(mean 0.3%). The average (median) market share of RJV firms is 3.15%.13 Both groups
of firms are able to expand their market shares until t+ 3. Tables 3b-c reveal that RJV
firms experience increases in market shares in both sub-segments, while merging firms’
market shares increase only in the microcomponents segment post merger.
12This is consistent with the notion that the potential beneficial effects of RJVs increase with the
number of participating firms, since technological spillovers increase (see Baumol, 2001).13This is consistent with the notion by Irwin and Klenow (1996), that larger firms gain more from
RJVs and from R&D knowledge spillovers.
7
3 The Empirics
In line with Farrell and Shapiro (1990) one way to quantify the market power versus
efficiency effects of mergers and RJVs, is to compare pre-merger with post-merger market
shares, see also our extension in the Appendix. More precisely, if the sum of the market
shares of merger or RJV insiders increase following a merger or the formation of an RJV,
the efficiency gains created by the merger/RJV overcompensate the (potential) market
power effects, and price will necessarily decline. This holds for any degree of product
differentiation in the market. Therefore, in what follows we establish the desirability of
mergers or RJVs by analyzing their effects on market shares.
3.1 A Dummy Variable Approach
In a first step, we estimate the following dummy variable model:
sci,t = ac + b · sci,t−x−1 +xX
y=0
my ·Mergeri,t−y +xX
y=0
ry ·RJVi,t−y + i,t (1)
for i = 1 . . . 263 and t = 1989 . . . 1999. If there is no merger, sci,t is simply the market
share of firm i in period t. If there is a merger, sci,t is the sum of the market shares of
the acquiring and acquired company, i.e. the combined market share, before the merger,
and the market share of the acquiring firm after merger. The parameters ac are coun-
try/country group dummies for the USA, Europe, Japan and South Korea. In order to test
for market power and efficiency effects of mergers and RJVs, we investigate the change
of insiders’ and outsiders’ market shares by using a dummy variable approach: we define
Mergeri,t−y = 1, if firm i took over another firm in period t− y, and zero elsewise, or by
analogy, RJVi,t−y = 1, if firm i participated in a research joint venture in period t−y, and
zero elsewise.14 The inclusion of the lagged dependent variable sci,t−x−1 effectuates that
the coefficients on the dummy variables measure changes in market shares. Equation (1)
14It should be noted, that there are only two firm years where there is both a merger and an RJV.
Thus, multicollinearity among the merger and RJV dummies is no problem.
8

is estimated separately for the different lag parameters x = 0, 1, 2, 3. Thus, we determine
the impact of mergers and RJVs up to three years after the deals. For example, the
total effect of a merger on market share undertaken in period t three years later is3P
y=0my.
A positive sum of coefficients on the dummy variables indicate that the efficiency effect
dominates the market power effect.
Unit root tests indicate that the stochastic market share data generating process is
stationary. Dickey-Fuller as well as augmented Dickey-Fuller tests reject the null hypoth-
esis that market share contains a unit root. The t-values for the coefficient of the lagged
dependent variable in regressions of the first difference of market share on market share
lagged by one period range from −5.45 (pooled OLS), −6.12 (OLS fixed effects) to −6.26
(IV method of Anderson and Hsiao, 1982).15 Thus, these values are above the 1% critical
values as e.g. tabulated by Fuller (1976). Since market shares are I(0), least squares
provides√T consistent estimates for the parameters of interest, however these estimators
will be biased for small T . In particular, the coefficient on the lagged dependent variable
will be biased downwards, towards zero. Therefore, we instrument sci,t−x−1 by the stock of
patents in the semiconductor industry by firm i as of year t−1−x and estimate by 2SLS.
The firm’s patents stock is supposed to capture efficiency differences between firms and
appears to be a suitable instrument, since the simple correlation coefficient with market
share is 0.61 (p = 0.001) and the correlation coefficient with the residuals of equation (1)
is near zero.
Table 4 reports the regression results for equation (1). As shown, mergers significantly
increase the market share of the combined entity relative to pre-merger levels in the semi-
conductor industry. The cumulative effect of mergers on market shares is +1.0 percentage
points (t = 7.22) three years after the merger (x = 3). The results also indicate that RJVs
significantly increase the market shares of participating firms. RJVs significantly affect
15The method of Anderson and Hsiao (1982) involves first differencing to account for unobserved firm
level heterogeneity and then instrumenting ∆yi,t−1 by ∆yi,t−2 and/or yi,t−2, which are valid instruments
since they are correlated with ∆yi,t−1 but uncorrelated with ∆µit. The Anderson and Hsiao (1982)
estimator is consistent when N −→∞ or T −→∞ or both.
9
market share in the second and third years after formation (see columns for x = 3). The
cumulative effects of RJVs on market share of the participating firms is 0.52 percentage
points with a t-value of 3.33. As 2.92 firms form an RJV on average, the cumulative
increase in market share is 1.5 percentage points three years after the formation. While
we cannot assure that RJVs do not lead to collusion in the product market, we can state
that the efficiency effects of RJVs more than outweigh any potential anti-competitive ef-
fects. Our results imply that mergers and RJVs raise the market shares of participating
firms. This points to an efficiency increasing role of mergers and RJVs. However, RJVs
raise market shares of participants by 0.5 percentage points more, collectively. Moreover,
from Table 4 and x = 3, mergers have a negative (albeit insignificant) effect in year three
after the merger, while RJVs still positively and significantly influence market shares of
insiders. This suggests that the beneficial effects of RJVs are longer-lasting than those of
mergers.
The country dummy variables (jointly significant beyond the 1% level) indicate that
Japanese semiconductor firms significantly lost market shares relative to all other countries
depicted during the 90ies (they lost on average 0.14% per annum), while South Korean
semiconductor firms significantly improved their relative market position (on average they
gained 0.13% per annum). US and European semiconductor firms were about equally
successful in retaining their market share. This is consistent with popular opinion.
Equation (1) is robust to the following modifications. (1) Our dummy variable method-
ology treats each RJV-year symmetrically, however some firms form more than one joint
venture in a given year. If we include the number of RJVs formed in a given year as
a count variable, the results are virtually identical to the ones obtained by introducing
dummies. (2) Results are also nearly identical if we estimate equation (1) by OLS instead
of 2SLS or in first-difference form instead of including a lagged dependent variable. (3)
Finally, the results are qualitatively identical if we include firm fixed effects and estimate
the dynamic panel by the IV method of Anderson and Hsiao (1982). RJVs and mergers
continue to significantly increase the market shares of firms in the semiconductor industry.
10

3.2 Endogenous Switching
The main criticism of mergers or RJV studies is that the endogeneity of the merger/RJV
formation is not accounted for. If the errors in the selection equation and the market
share equations are correlated we get a simultaneity bias in our parameters of interest. For
example, it may happen that mergers or RJVs are formed among more productive firms,
which will - even without merger/RJV - gain on market share in the future. A comparison
with outsider firms may indicate increasing market shares due to the merger/RJV, which is
in fact due to the higher productivity, not being related to the merger. In other words, the
within firm variation in merger or joint venture activity may be (partially) endogenously
determined, and merger or RJV years are a self-selected sample of observations. We
account for endogeneity by estimating the following endogenous switching model, which
asks to what extent the firms were able to retain their pre-merger (pre-RJV) market
shares (see Mueller (1985), the endogenous switching model is in line with Lee, 1978):
I∗i,t = b0 + b1(scm,i,t − scnm,i,t) + b2 ·Xi,t − vi,t
scm,i,t = am,0 + am,1 · scm,i,t−x−1 + εm,i,t (2)
scnm,i,t = anm,0 + anm,1 · scnm,i,t−x−1 + εnm,i,t (3)
Equation (2) is a selection equation that determines whether or not the firm takes
over another firm in year t (forms an RJV). Note, that firm i’s decision to merge/form
an RJV depends on the comparison of the expected market shares when it cooperates
(merges) versus when it does not cooperate (merge). Variable X is a set of exogenous
variables determining merger/RJV formation. Variables are defined as before, with the
subscript m referring to merging observations and subscript nm referring to non-merging
observations. Variables for the RJV estimations are determined by analogy.
If I∗i,t > 0, the firm forms a merger (RJV), and the market share is determined by
equation (2), otherwise its market share is determined by equation (3). There are two
problems with estimating the set of equations. First, we have a missing data problem. We
only observe the market share given the chosen regime, that is, we observe scm,i,t if I∗i,t > 0,
11

or scnm,i,t otherwise, but never both. Secondly, we have a simultaneity problem, and OLS
estimation of equations (2) and (3) gives inconsistent estimates, because E(εm,i,t|I∗i,t >
0)6= 0 and E(εnm,i,t|I∗i,t ≤ 0)6= 0. Thus, we substitute equations (2) and (3) into equation
(2), and estimate the “reduced form” probit by ML. From this estimation, we retrieve
the inverse Mills ratio and estimate equations (2) and (3) consistently with 2SLS.16 Using
these estimates to calculate the predicted difference in market shares for the two regimes,
plugging those into the “structural” probit equation (2), and estimating the whole system
by ML, one gets consistent estimates of the a0s and b0s. The parameters of main interest
are am,1 and anm,1, i.e. the percentage of market share retained of merging versus non-
merging firms (RJV forming versus non-RJV forming firms) after x years, taking into
account the endogenous nature of merger/RJV formation.
The set of exogenous drivers of merger/RJV formation include the following variables,
which we group into firm (1-3), time (4) and country specific (5). All of them are proxies
in one form or the other of the costs and benefits of undertaking a merger or being member
in an RJV.
(1) The number of accumulated patents of firm i until period t (Patents): The effi-
ciency with which firms innovate is likely to be a significant determinant of merger or RJV
formation. For example, absorptive capacity plays an important role in the R&D process
(see Cohen and Levinthal, 1989). In an RJV (the ”make” decision) firms may better cap-
ture spillovers from the other participating firms, the more patents they possess, if these
proxy for absorptive capacity. Thus complementary aspects of the innovation process
may prevail in RJVs (positive sign prediction). In a merger (the “buy” decision), on the
other hand, R&D capacity may actually be brougth “in house” to rectify own shortcom-
ings (negative sign prediction). See Blonigen and Taylor (2000) for recent evidence on a
negative relation between R&D and acquisition activity in high-tech industries.
(2) The size of the firm (Size): Nearly all studies on mergers or RJVs as well as our
summary statistics indicate that the size of the firm is a major determinant of its M&A
16We again use the accumulated number of patents in the semiconductor industry of firm i in year
t− x− 1 as instrument for market shares in t− x− 1.
12

and other cooperative activity. For example, larger firms are much more likely to be
the aquirers in merger deals, and larger firms potentially benefit more from innovation,
e.g. because they can apply a given marginal cost reduction to a larger number of units.
We therefore include an absolute size measure, total assets of firm i in period t, into the
determinants specification, and expect a positive sign for both the merger and the RJV
equation.
(3) The ”scope” of the firm (Multi): The propensity to merge/form an RJV may
depend on the ”scope” of the firm, that is whether a firm operates in more than one
segment of the semiconductor industry (Multi=1) or whether it is focused in one segment
(Multi=0). We distinguish between the ”memory”, ”microcomponents” and ”other” seg-
ments of the semiconductor industry, the mean Multi is 33.0%. Multi-market firms are
expected to both have a higher propensity to take over another firm, e.g. because there
are more synergies to be achieved, and form more RJVs, e.g. because spillovers can be
better appropriated, than more focused firms.
(4) Year effects: Several time-specific factors in the semiconductor industry may influ-
ence the propensity to merge/form an RJV. For example, one stylized fact in the merger
literature is that mergers come in waves (see e.g. Shleifer and Vishny, 2001, or Gugler
et al., 2003). The concentration in the industry may influence takeover activity and may
change over time. Likewise, the number of firms and the turbulence in the industry (entry
and exit) affect mergers and RJVs. Since we would have only (at most) eleven indepen-
dent observations on these variables, and since there are endogeneity problems with some
of them (e.g. concentration), we chose to include a full set of yearly time dummies in-
stead. These account for any time-specific factors driving merger and RJV activity and
are exogenous.
(5) The costs and benefits of merging or forming an RJV may also depend on the
country/country group the firms stem from. For example, the legal environment or public
policy may differ. Thus, we include the country(-group) dummies USA, Europe, Japan
and South Korea.
The selection of the determinants variables 1-5 are very much in line with previous
13

studies. Table 5 presents the switching estimation results for x = 3, i.e. until three
years after formation. The merger and RJV selection estimations from the “structural”
probit equation show that merger/RJV formation indeed is significantly determined by
the expected gains in market shares. Thus, firms expecting that a merger/RJV will
increase their market shares are significantly more likely to actually take over another
firm/form an RJV.
Turning to the exogenous determinants X, we find the following results: While own
patents significantly negatively influence the decision to merge, they significantly pos-
itively influence the decision to form an RJV. This is consistent with RJVs being the
“make” decision, where complementary aspects of the innovation process prevail, and
mergers, the “buy” decision, are used to acquire external knowledge to substitute for own
deficiencies. As expected, the size of the firm as well as its multi-market nature positively
affect the probability to merge and to form an RJV. The year dummies are significant
determinants of both the decision to merge as well as to be member in an RJV, while
the country dummies are only significant in the determinants of merger equation. This
is consistent with time varying industry factors affecting the optimality to cooperate. It
appears that regulation and/or public policy differs more for mergers than for RJVs across
countries/county groups.
Having accounted for the endogenous formation, we are able to consistently estimate
the quantitative effects of the mergers or RJVs. As we see from the effects regressions
merging firms are able to expand their market share by 19% three years after a merger as
compared to non-merging firms loosing nearly 14% during that period, on average. RJV
participating firms are able to expand their market share by nearly 10% three years after
the formation of an RJV as compared to non-RJV firms loosing more than 12% during
that period, on average. These numbers are very much in line with the estimates from
section 3.1 using a dummy variable technique and ignoring endogenous switching. In sum,
while mergers and RJVs are to some extent endogenously determined, our main results
are not altered by explicitly considering and correcting for this endogeneity.
14
3.3 Level of Aggregation
So far we have analyzed mergers and RJVs at the 4-digit NAICS level of aggregation,
the semiconductor industry. One may argue that the kinds of efficiency effects that firms
achieve via cooperation should manifest themselves much more clearly at much lower
levels of aggregation, e.g. the 6-digit level.17 Thus, in this section we test for robustness
of our findings at the 6-digit level of aggregation, i.e. the memory and microcomponents
markets.
For these two cleanly delineated markets, we re-estimate system (2) to (4). This proce-
dure implies that the degree of horizontality of our mergers and RJVs is now even tighter,
since now a horizontal merger or RJV is between firms e.g. in the microcomponents
market. By analogy, market shares, patents etc. are re-defined.
Table 6 presents the estimates for system (2) to (4) for the microcomponents, and Table
7 for the memory segment. The results for the determinants equations are similar to the
semiconductor industry as a whole. For example, the size and multi-market variables
again carry a positive sign, indicating that scale and scope effects are important factors
determining the formation of a merger/RJV at the lower level of aggregation. However,
these effects are at lower significance levels than in the total semiconductor industry,
which is not surprising given the lower number of observations.
Mergers and RJVs are particularly beneficial in the microcomponents segment. Here,
merging firms can raise their market share by 25%, RJV participating firms by 15.3%.
Results for the memory market differ from those for the microcomponents market in so
far that mergers do not raise market shares for merging firms, while RJVs continue to
have positive net efficiencies.
In summary, these results show that our findings of positive net efficiencies of mergers
and RJVs for the semiconductor industry are robust and continue to hold for the micro-
17However, some efficiency or market power effects are realized at rather higher levels of aggregation.
For example, reductions of fixed costs or economies of scope may be realized at the firm level. Similarly,
market power can stem from multi-market conduct or vertical relationships. Thus a too narrow scope
may underestimate these effects.
15
components and memory markets. Our results for mergers apply most significantly for
the microcomponents market.18
4 Conclusion
Our study contributes to merger and RJV control policy. A merger may be approved
based on a so-called “efficiency defence”: If firms can convince merger control authorities
that the efficiencies generated by the merger more than outweigh the anti-competitive
effects, the merger may be cleared. An important aspect in clearing mergers is that the
efficiencies are merger-specific. That is, that the efficiencies cannot be achieved by any
other means with comparable or lower anti-competitive effects, such as RJVs.
This study finds that mergers increase the market shares of participating firms. This
points to an efficiency enhancing role of mergers. However, we also find that RJVs are
indeed viable alternatives to mergers. Cumulatively, RJVs raise insiders’ market shares
by more than a merger and achieve higher efficiency gains and consumer welfare. This
result is robust to endogenous merger or RJV formation. We conclude that efficiency
gains are frequently not merger-specific, given the possibility of a research joint venture.
At least two important caveats must be mentioned, however. First, we did not analyze
other forms of joint ventures such as pure production joint ventures. It may well be that
these forms of cooperation increase collusion in the product market without offsetting
efficiency advantages. Second, our analysis is restricted to the semiconductor industry,
one of the most R&D intensive and innovative industries. Moreover, results for the mi-
crocomponents segment are much clearer than for the memory segment, which was in
relative decline during the period of investigation. Future research is needed to confirm
our main result - RJVs are often viable alternatives to mergers - for other industries, as
to establish more insight for antitrust control authorities and the evaluation of consumer
18This shows that a rigid application of a market share or Herfrindahl criterion to determine the
likely anti-competitive effects of mergers is not warranted. This is recognized in the US and EU Merger
Guidelines.
16

welfare.
5 Appendix
In this section, we show that the results by Farrell and Shapiro (1990) are robust to product
differentiation. We consider N firms, each producing a single good. The goods are differentiated
and the inverse demand function for firm i is
Pi = a− bqi − gNXj=1j 6=i
qj, i = 1, . . . , N
where Pi denotes the price of firm i, and qi the quantity it produces. The substitutability
parameter is g with 0 ≤ g ≤ b. When g = 0 goods are totally differentiated and become closer
substitutes the larger g, when g = b products are perfect substitutes. We allow production
being profitable, hence a > c, and assume that no entry or exit occurs.
We consider two different types of coalitions. (1) Research Joint Ventures, where firms
cooperate in R&D but not in the product market, and (2) mergers, where firms combine their
assets and cooperate in the R&D and the product market. In every type there are two groups
of firms, the M ≤ N insiders, which participate in the coalition, and the N −M outsiders.
Through efficiency gains the insiders (I) may achieve lower ex post marginal costs than the
outsiders (O), cI < cO.
Following Farrell and Shapiro (1990), we assume that cooperations occur only when they are
profitable. Thus, we do not endogenize the coalition process and do not investigate the effect on
insiders’ profits. In the product market, firms simultaneously choose their quantities. We first
analyze the maximization problem for the outsiders, which is identical under merger and RJV,
before we turn to the objectives for insiders in a merger and RJV, respectively.
17

5.1 The Outsiders
The N −M outsiders (noncooperatively) maximize own profits:
maxqOi
πOi = maxqOi
⎧⎪⎨⎪⎩⎡⎢⎣a− g
⎛⎜⎝ MXj=1
qIj +NX
j=M+1j 6=i
qOj
⎞⎟⎠− bqOi
⎤⎥⎦ qOi − cOqOi
⎫⎪⎬⎪⎭ , i =M + 1, . . . , N
where qOi and qIj , j = 1, . . . ,M , are the outputs of an outsider and insider firm, respectively.
5.2 The Insiders in a Merger
Assuming symmetry among the M insiders in a merger (m), they maximize joint profits, given
by (nm are the outsiders of the merger):19
maxqm
Mπm = maxqm
⎧⎨⎩M⎧⎨⎩⎡⎣a− g
⎡⎣ NXj=M+1
qnmj + (M − 1)qm⎤⎦− bqm
⎤⎦ qm − cmqm
⎫⎬⎭⎫⎬⎭ .
Solving for the equilibrium quantities and rearranging yields the following relation
2b+ g (M − 2)2b− g
q∗m − q∗nm =cnm − cm
2b− g. (4)
Let us suppose that the merger generates no efficiency gains (cm = cnm), such that only the
market power effect is present. When products are perfect substitutes (g = b), Mq∗m = q∗nm,
and we can confirm the results established by Salant, Switzer and Reynolds (1983), that the
insiders reduce their production by so much that Cournot symmetry is again established in the
post-merger equilibrium. Outsiders react by increasing their output, but by less than insiders
reduced their output, and industry output declines and market price increases.
As products become more differentiated (g declines), insiders impose fewer negative exter-
nalities on each other and reduce their output less (see equation (4) with∂( 2b+g(M−2)2b−g )
∂g> 0).
It follows that insiders gain less on market power inducing a lower increase in industry price.
When products are totally differentiated (g = 0), insider and outsider firms do not change
output (q∗m = q∗nm). This is intuitive, since firms already behaved like monopolists before the
19Note, that an aquiror may have an incentive to increase its product portfeuille by taking
over another firm. The assumption of jointly maximizing profits would meet this incentive.
18

merger and did not impose any externalities in the product market on each other. Hence, there
is no further gain of market power and the industry price remains the same.
In case the merger creates efficiency gains (cm < cnm), and considering perfect substitutes
(g = b), equation (4) results in Mq∗m = cnm−cmb
+ q∗nm. If the efficiency gains due to the
merger are sufficiently high, they may outweigh the market power effect, such that insiders
increase output and prices decline. When products become more differentiated (g declines), the
same argument as above holds and insiders decrease their output by less.
We can impose the following result: When the efficiency effect induced by the merger is
sufficiently large, such that it dominates the market power effect, a single insider firm will
produce a higher quantity than an outsider and industry price declines compared to the pre-
merger price. Moreover, the more the products are differentiated, the lower efficiency gains are
needed to overcompensate the market power effect. We have thus shown that the predictions
by Farrell and Shapiro (1990) on market shares and prices are robust to any degree of product
differentiation.
5.3 The Insiders in an RJV
The M insiders forming an RJV (R) maximize their profits noncooperatively, as shown by
maxqRi
πRi = maxqRi
⎧⎪⎨⎪⎩⎡⎢⎣a− g
⎛⎜⎝ MXj=1j 6=i
qRj +NX
j=M+1
qnRj
⎞⎟⎠− bqRi
⎤⎥⎦ qRi − cRqRi
⎫⎪⎬⎪⎭where nR denote non-RJV firms (outsiders). Solving for the corresponding equilibrium quanti-
ties and rearranging, gives the following relation:
q∗R − q∗nR =cnR − cR
2b− g. (5)
The higher the efficiency gains³cR < cnR
´generated by the RJV, the more the insiders will
increase their output compared to outsiders³q∗R > q∗nR
´. Insiders will increase their output
less, the more the products are differentiated. The outsiders respond by decreasing their output,
but by less, resulting in a decline in industry price. Note that this argument holds under the
assumption that firms do not collude in the product market. If RJV firms do collude in the
product market, an RJV behaves like a merger and the same logic as above applies.
19

Summarizing, we can infer the extent to which mergers or RJVs generate efficiency effects by
analyzing the change of pre- to post merger (RJV) market shares. If the insiders’ post-merger
(RJV) shares increase compared to pre-merger (RJV) shares, the efficiency gains overcompensate
the (potential) market power effects, and price will necessarily decline.20 This holds for any
degree of product differentiation.
20The likely consequences of allowing for entry and exit are the following: Market shares of
insiders would increase by more if the efficiency effect dominates the market power effect, since
some outsiders would exit. Market shares of insiders would decrease by more if the market power
effect dominates the efficiency effect, since other firms may enter. Thus, the assumption of no
entry and exit in our study makes the analysis even more conservative. See Werden and Froeb
(1998) for an analysis of the entry-inducing effects of mergers. See also Roller and Stahl (2002)
for the welfare effects of mergers and joint ventures.
20

6 References
Anderson, T.W. and C. Hsiao, 1982, “Estimation of Dynamic Models with Error Com-
ponents”, Journal of the American Statistical Association 76, 598—606.
Baker, J.B., 1997, “Contemporary Empirical Merger Analysis”, speech published in
George Mason University Law Review, vol. 5, pp. 347-61.
Baldwin, J. and P.A. Gorecki, 1990, “Mergers Placed in the Context of Firm Turnover”,
in Bureau of the Census, 1990 Annual Research Conference, Proceedings, Washing-
ton D.C.: U.S. Department of Commerce, 53—73.
Baumol, W.J., 2001, “When is inter-firm coordination beneficial? The case of innova-
tion”, International Journal of Industrial Organization 19, 727—737.
Berry, S. and A. Pakes, 1993, “Some Applications and Limitations of Recent Advances in
Empirical Industrial Organization: Merger Analysis”, American Economic Review,
Vol. 83, No. 2, 247—252.
Blonigen, B.A. and C.T. Taylor, 2000, “R&D Intensity and Acquisition in High-Technology
Industries: Evidence from the US Electronic and Electrical Equipment Industries,
Journal of Industrial Economics, Vol. XLVIII, No. 1, 47—70.
Brander, J.A. and B. Spencer, 1983, “Strategic Commitment with R&D: the Symmetric
Case”, Bell Journal of Economics 14, 225—235.
Branstetter, L. G. and M. Sakakibara, 2002, “When Do Research Consortia Work Well
and Why? Evidence from Japanese Panel Data”, American Economic Review,
Vol. 92, No. 1, 143—159.
Cassiman, B. and R. Veugelers, 1999, “R&D Cooperation and Spillovers: Some Empirical
Evidence”, CEPR discussion paper 2330.
Cohen, W.M. and D.A. Levinthal, 1989, “Innovation and Learning: The Two Faces of
R&D”, The Economic Journal 99, 569—596.
21

D’Aspremont, C. and A. Jacquemin, 1988, “Cooperative and Non-Cooperative R&D in
Duopoly with Spillovers”, The American Economic Review 78, 1133—1137.
Dataquest, 1999, Semiconductor Data partly provided by Dataquest.
DeBondt, R., 1997, “Spillovers and Innovative Activities”, International Journal of In-
dustrial Organization 15, 1—28.
Deneckere, R. and C. Davidson, 1985, “Incentives to Form Coalitions with Bertrand
Competition,” Rand Journal of Economics, 16, 473—486.
Dockner, E.J. and A. Gaunersdorfer, 2001, “On the Profitability of Horizontal ‘ Mergers
in Industries with Dynamic Competition,” Japan and the World Economy, 13, 195—
216.
Farrell, J. and C. Shapiro, 1990, “Horizontal Merger: An Equilibrium Analysis”, Amer-
ican Economic Review, Vol. 80, No. 1, 107—126.
Flamm, K., 1996, “Mismanaged Trade?”, Brookings Institution Press, Washington, D.C.
Fuller, W.A., 1976, “Introduction to Statistical Time Series”, J. Wiley & Sons, Inc., New
York.
Goldberg, L., 1973, “The Effect of Conglomerate Mergers on Competition”, Journal of
Law and Economics, 16, 137—158.
Gowrisankaran, G., 1999, “A Dynamic Model of Endogenous Horizontal Mergers” RAND
Journal of Economics, Spring, Vol. 30(1), 56-83.
Gruber, H., 1992, “The Learning Curve in the Production of Semiconductors Memory
Chips”, Applied Economics, 24, pp. 885-894.
Gruber, H., 1996, “Trade Policy and Learning by Doing: The Case of Semiconductors”,
Research Policy, 25, pp. 723-739.
22

Gugler, K., Mueller, D. C. and Yurtoglu, B.B., 2003, ”The Determinants of Merger
Waves”, University of Vienna, presented at the EARIE 2003 meeting in Helsinki.
Gugler, K., D.C. Mueller, B.B. Yurtoglu and C. Zulehner, 2003, “The Effects of Mergers:
An International Comparison”, International Journal of Industrial Organization,
Vol. 21 (5), 625-653.
Hall, B.H., A.B. Jaffe and M. Trajtenberg, 2001, “The NBER Patent Citation Data File:
Lessons, Insights and Methodological Tools” NBER Working Paper No. 8498.
Irwin, D. and P. Klenow, 1994, “Learning by Doing Spillovers in the Semiconductor
Industry”, Journal of Political Economy, 102, pp. 1200-1227.
Irwin, D.A. and P.J. Klenow, 1996, “High-tech R&D Subsidies: Estimating the Effects
of Sematech”, Journal of International Economics 40, 323—344.
Jacquemin, A., 1988, “Cooperative Agreements in R&D and European Antitrust Policy”,
European Economic Review 32, 551—569.
Jorgenson, D.W., 2001, “Information Technology and the U.S. Economy”, American
Economic Review, Vol. 91, no. 1, pp. 1-32.
Jorde, T.M. and D.J. Teece, 1990, “Innovation and Cooperation: Implications for An-
titrust”, Journal of Economic Perspectives 4, 75—96.
Kaiser, U., 2002, “An empirical test of models explaining research expenditures and re-
search cooperation : evidence for the German Service sector”, International Journal
of Industrial Organization 20, 747—774.
Kamien, M.I., E. Muller and I. Zang, 1992, “Research Joint Ventures and R&D Cartels”,
American Economic Review 82, 1293—1306.
Katz, M., 1986, “An Analysis of Cooperative Research and Development”, Rand Journal
of Economics 17, 527—543.
23
Katz, M. and J. Ordover, 1990, “R&D Cooperation and Competition”, Brookings Papers
on Economic Activity, Microeconomics, 137—191.
Lee, L.F., 1978, “Unionism and Wage Rates: A Simultaneous Equations Model with
Qualitative and Limited Dependent Variables”, International Economic Review, 19,
No. 2, 415—433.
Martin, S., 1995, “R&D Joint Ventures and Tacit Product Market Collusion”, European
Journal of Political Economy 11, 733—741.
Mueller D.C., ed., “The Determinants and Effects of Mergers: An International Com-
parison”, Cambridge, Mass.: Oelgeschlager, Gunn & Hain, 1980.
Mueller, D.C., 1985, “Mergers and Market Share”, Review of Economics and Statistics,
67(2), 259—267.
Pesendorfer, M., 2003, ”Horizontal Mergers in the Paper Industry”, Rand Journal of
Economics, 34(3), pp. 495-515.
Ravenscraft, D.J. and F.M. Scherer, 1987, “Mergers, Sell-Offs and Economic Efficiency”,
The Brookings Institution, Washington, D.C.
Roller, L.H., R. Siebert and M.M. Tombak, 2000, “Strategic Choice of Partners: Research
Joint Ventures and Market Power”, Wissenschaftszentrum Berlin.
Roller, L.H. and K. Stahl, 2002, “Merger vs. Research Joint Venture under R&D Effi-
ciencies”, Wissenschaftszentrum Berlin and University of Mannheim.
Salant, S.W., S. Switzer and R.J. Reynolds, 1983, “Losses from Horizontal Merger: The
Effects of an Exogenous Change in Industry Structure on Cournot-Nash Equilib-
rium”, Quarterly Journal of Economics, Vol. XCVIII, No. 2, 185—199.
Shapiro, C. and R.D. Willig, 1990, “On the Antitrust Treatment of Production Joint
Ventures”, Journal of Economic Perspectives 4 (3), 113—130.
24
Shleifer, A. and R. Vishny, 2001, Stock Market Driven Acquisitions, NBER WP No.
8439.
Song, M., 2003, “A Dynamic Model of Cooperative Research in the Semiconductor
Industry”, Ph.D. Thesis, Harvard University.
Spence, M., 1984, “Cost Reduction, Competition and Industry Performance”, Econo-
metrica 52 (1), 101—121.
Werden, G.J., and L.M. Froeb, 1994, “The Effects of Mergers in Differentiated Products
Industries: Logit Demand and Merger Policy”, Journal of Law, Economics, and
Organization, 10 (2), 407—426.
Werden, G.J., and L.M. Froeb, 1998, “The Entry-Inducing Effects of Horizontal Mergers:
An Exploratory Analysis”, Journal of Industrial Economics, 46 (4), 525—543.
Williamson, O.E., 1968, “Economies as an Antitrust Defense: The Welfare Tradeoffs”,
American Economic Review, 58, 18—36.
25

Table 1a: International production rates in the semiconductor industry
U.S. Japan Europe Other
Semiconductor 39.6% 40.1% 8.5% 11.8%
Memory 24.6% 43.5% 3.7% 28.2%
Microcomponents 70.1% 23.5% 4.1% 2.2%
Table 1b: Revenues and market shares in the semiconductor industry
Years Revenues (Mio $-US) Herfindahl Index No. of active firms
1989 52,751 404 132
1990 54,578 383 140
1991 59,341 391 132
1992 64,774 386 157
1993 85,328 395 153
1994 109,402 402 154
1995 152,875 365 172
1996 143,402 430 158
1997 150,911 401 172
1998 138,747 475 188
1999 169,311 454 167
Average 107,402 408 157
26
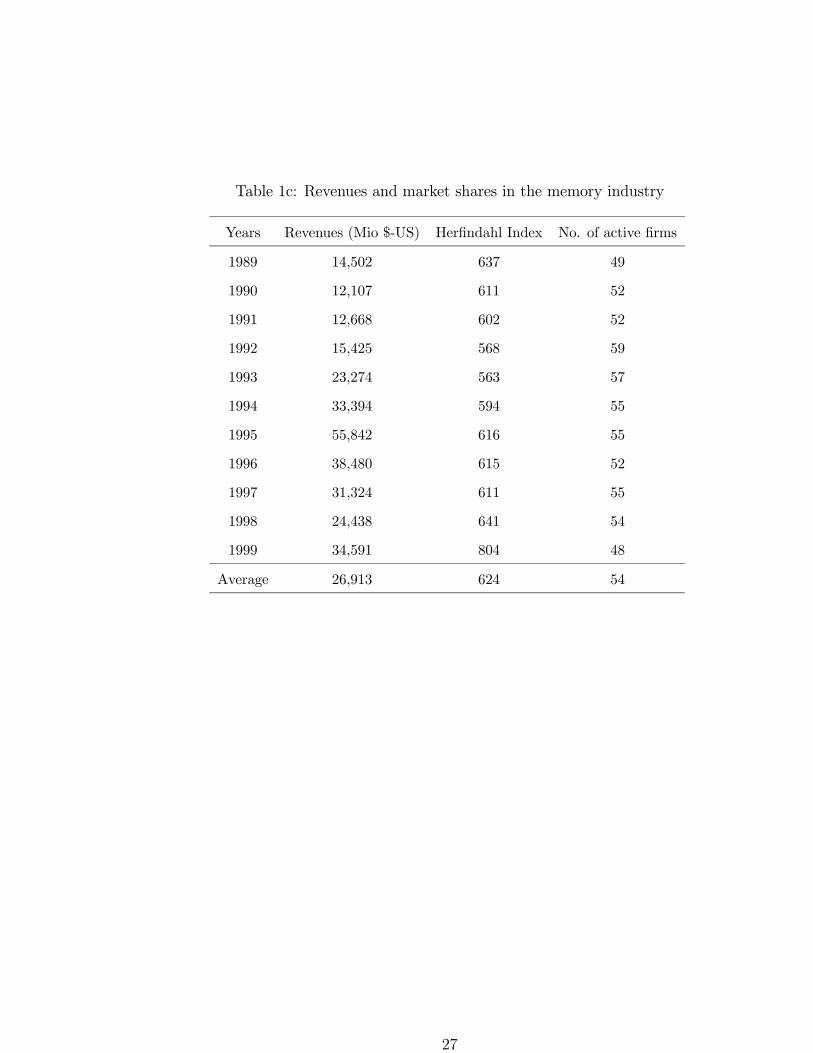
Table 1c: Revenues and market shares in the memory industry
Years Revenues (Mio $-US) Herfindahl Index No. of active firms
1989 14,502 637 49
1990 12,107 611 52
1991 12,668 602 52
1992 15,425 568 59
1993 23,274 563 57
1994 33,394 594 55
1995 55,842 616 55
1996 38,480 615 52
1997 31,324 611 55
1998 24,438 641 54
1999 34,591 804 48
Average 26,913 624 54
27
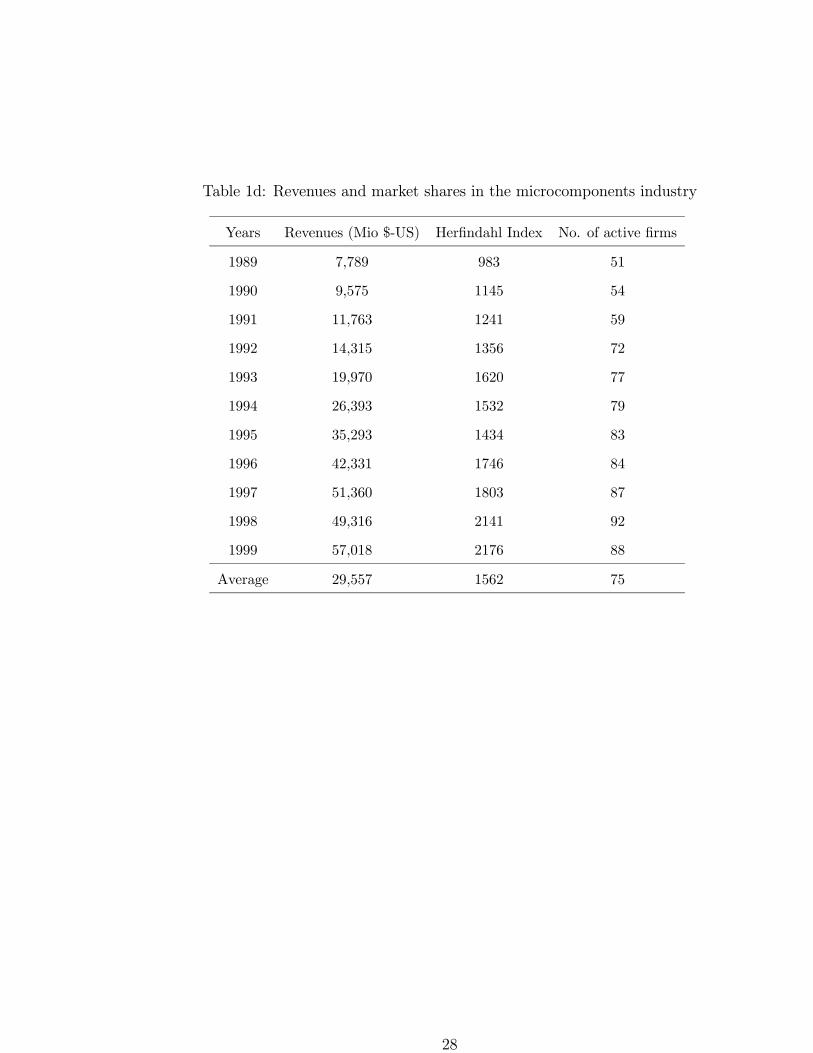
Table 1d: Revenues and market shares in the microcomponents industry
Years Revenues (Mio $-US) Herfindahl Index No. of active firms
1989 7,789 983 51
1990 9,575 1145 54
1991 11,763 1241 59
1992 14,315 1356 72
1993 19,970 1620 77
1994 26,393 1532 79
1995 35,293 1434 83
1996 42,331 1746 84
1997 51,360 1803 87
1998 49,316 2141 92
1999 57,018 2176 88
Average 29,557 1562 75
28

Table 2: : Research joint ventures and mergers: number of deals
Semiconductor Memory Microcomponents
Years RJVs Mergers RJVs Mergers RJVs Mergers
1989 13 4 2 2 7 0
1990 20 5 6 2 8 3
1991 35 4 5 0 5 2
1992 29 10 7 3 15 3
1993 36 4 8 2 11 2
1994 39 7 11 5 10 5
1995 24 12 10 4 0 6
1996 17 7 3 0 2 2
1997 18 11 3 1 1 7
1998 13 19 2 5 4 10
1999 0 28 0 10 0 13
1989-1999 244 111 57 34 63 53
29

Table 3a: Mean semiconductor market shares of different groups of firms from t− 1 until
t+ 3
t− 1 t t+ 1 t+ 2 t+ 3
RJV firms 3.15 3.09 3.25 3.46 3.58
Mergers:
Acquiring firms 2.46 2.82 3.34 3.75 3.71
Target firms 0.30 - - - -
Table 3b: Mean memory market shares of different groups of firms from t− 1 until t+ 3
t− 1 t t+ 1 t+ 2 t+ 3
RJV firms 4.10 4.16 4.22 4.37 4.48
Mergers:
Acquiring firms 1.51 2.22 2.28 2.33 2.29
Target firms 0.90 - - - -
Table 3c: Mean microcomponents market shares of different groups of firms from t− 1
until t+ 3
t− 1 t t+ 1 t+ 2 t+ 3
RJV firms 5.37 5.51 5.57 5.62 5.98
Mergers:
Acquiring firms 5.30 6.03 6.22 6.43 6.67
Target firms 0.70 - - - -
30

Table 4: Results for equation (1)
Dependent variable: sci,t
Equation 1 2 3 4
x = 0 x = 1 x = 2 x = 3
Coef t-value Coef t-value Coef t-value Coef t-value
USA 0.00013 0.92 0.00027 1.06 0.00046 1.27 0.00068 1.27
Europe 0.00007 0.29 0.00007 0.06 −0.00003 −0.03 −0.00003 −0.03
Japan −0.00138 −6.24 −0.00302 −7.75 −0.00592 −7.34 −0.00595 −7.34
South Korea 0.00125 3.31 0.00216 3.30 0.00357 3.65 0.00547 4.18
sci,t−x−1 0.93022 19.76 0.91129 12.47 0.90007 8.16 0.88813 7.47
Mergeri,t 0.00028 0.56 0.00384 5.31 0.00522 7.06 0.00505 5.17
Mergeri,t−1 0.00169 2.34 0.00326 5.15 0.00439 6.46
Mergeri,t−2 −0.00014 −0.13 0.00191 2.72
Mergeri,t−3 −0.00098 −0.66
RJVi,t 0.00009 0.27 −0.00020 −0.38 −0.00085 −1.04 0.00069 0.64
RJVi,t−1 0.00076 1.45 0.00117 1.53 0.00087 0.86
RJVi,t−2 0.00114 1.46 0.00240 2.39
RJVi,t−3 0.00124 2.23
Constant −0.00010 −0.45 −0.00037 −1.00 0.00003 0.06 0.00059 0.87
R2-adjusted 0.850 0.862 0.884 0.891
No. Obs. 1,433 1,185 985 807
Tests:
Sum Merger coefs 0.00028 0.56 0.00553 5.58 0.00834 7.25 0.01037 7.31
Sum RJV coefs 0.00009 0.27 0.00056 0.74 0.00146 1.47 0.00520 3.33
Note: Estimation method is 2SLS with market share instrumented by patents accumulated in the
semiconductor industry.
31
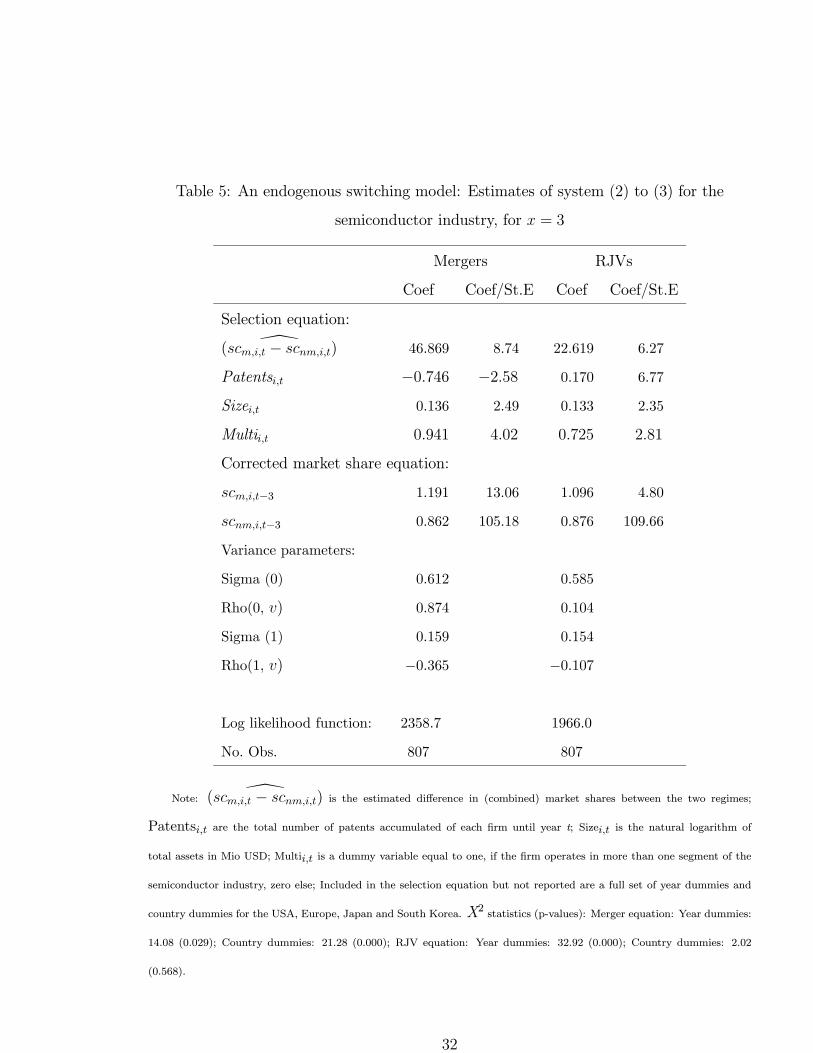
Table 5: An endogenous switching model: Estimates of system (2) to (3) for the
semiconductor industry, for x = 3
Mergers RJVs
Coef Coef/St.E Coef Coef/St.E
Selection equation:
\(scm,i,t − scnm,i,t) 46.869 8.74 22.619 6.27
Patentsi,t −0.746 −2.58 0.170 6.77
Sizei,t 0.136 2.49 0.133 2.35
Multii,t 0.941 4.02 0.725 2.81
Corrected market share equation:
scm,i,t−3 1.191 13.06 1.096 4.80
scnm,i,t−3 0.862 105.18 0.876 109.66
Variance parameters:
Sigma (0) 0.612 0.585
Rho(0, v) 0.874 0.104
Sigma (1) 0.159 0.154
Rho(1, v) −0.365 −0.107
Log likelihood function: 2358.7 1966.0
No. Obs. 807 807
Note: \(scm,i,t − scnm,i,t) is the estimated difference in (combined) market shares between the two regimes;
Patentsi,t are the total number of patents accumulated of each firm until year t; Sizei,t is the natural logarithm of
total assets in Mio USD; Multii,t is a dummy variable equal to one, if the firm operates in more than one segment of the
semiconductor industry, zero else; Included in the selection equation but not reported are a full set of year dummies and
country dummies for the USA, Europe, Japan and South Korea. X2 statistics (p-values): Merger equation: Year dummies:
14.08 (0.029); Country dummies: 21.28 (0.000); RJV equation: Year dummies: 32.92 (0.000); Country dummies: 2.02
(0.568).
32

Table 6: Estimates of system (2) to (3) for the microcomponents market, for x = 3
Mergers RJVs
Coef Coef/St.E Coef Coef/St.E
Selection equation:
\(scm,i,t − scnm,i,t) 19.370 3.64 12.334 2.27
Patentsi,t −0.046 −0.58 0.220 2.77
Sizei,t 0.103 2.19 0.093 1.35
Multii,t 0.741 2.32 0.425 1.81
Corrected market share equation:
scm,i,t−3 1.253 9.16 1.153 3.76
scnm,i,t−3 0.822 44.22 0.876 32.63
Variance parameters:
Sigma (0) 0.244 0.354
Rho(0, v) 0.842 0.481
Sigma (1) 0.511 0.423
Rho(1, v) −0.366 −0.076
Log likelihood function: 1128.7 926.0
No. Obs. 312 312
Note: Variables are defined in analogy to Table 5. Included in the selection equation but not reported are a full set
of year dummies and country dummies for the USA, Europe, Japan and South Korea. X2 statistics (p-values): Merger
equation: Year dummies: 3.23 (0.779); Country dummies: 64.76 (0.000); RJV equation: Year dummies: 4.59 (0.205);
Country dummies: 0.47 (0.494).
33

Table 7: Estimates of system (2) to (3) for the memory market, for x = 3
Mergers RJVs
Coef Coef/St.E Coef Coef/St.E
Selection equation:
\(scm,i,t − scnm,i,t) 8.223 0.64 22.334 1.27
Patentsi,t −0.146 −2.58 0.120 0.77
Sizei,t 0.173 2.23 0.193 1.98
Multii,t 0.980 1.12 0.625 1.41
Corrected market share equation:
scm,i,t−3 1.021 5.23 1.113 2.32
scnm,i,t−3 0.987 32.12 0.854 21.19
Variance parameters:
Sigma (0) 0.283 0.387
Rho(0, v) 0.375 0.902
Sigma (1) 0.096 0.473
Rho(1, v) −0.274 −0.036
Log likelihood function: 993.7 832.0
No. Obs. 212 212
Note: Variables are defined in analogy to Table 5. Included in the selection equation but not reported are a full set
of year dummies and country dummies for the USA, Europe, Japan and South Korea. X2 statistics (p-values): Merger
equation: Year dummies: 0.65 (0.420); Country dummies: 1.51 (0.823); RJV equation: Year dummies: 6.89 (0.076);
Country dummies: 5.38 (0.020).
34
![University of Nebraska–Lincoln Extension EC173 (Revised ...Spotted knapweed (Centaurea stoebe L. ssp. micranthos [Gugler] Hayek – Centaurea maculosa Lam. = C. Biebersteinii DC.)](https://img.pdfslide.net/doc/110x75/5e70dc8cdc57a67cee558638/university-of-nebraskaalincoln-extension-ec173-revised-spotted-knapweed-centaurea.jpg)