Embed Size (px)
Citation preview
NEW HAMPSHIRE February 2013
i
NEW HAMPSHIRE
NCCI’s Medical Data Report and its content are intended to be used as a reference tool and for informational purposes only. No further use, dissemination, sale, assignment, reproduction, preparation of derivative works, or other disposition of this report or any part thereof may be made without the prior written consent of NCCI.
NCCI’s Medical Data Report is provided “as is” and includes data and information available at the time of publication only. NCCI makes no representations or warranties relating to this report, including any express, statutory, or implied warranties including the implied warranty of merchantability and fitness for a particular purpose. Additionally, NCCI does not assume any responsibility for your use of, and for any and all results derived or obtained through, the report. No employee or agent of NCCI or its affiliates is authorized to make any warranties of any kind regarding this report. Any and all results, conclusions, analyses, or decisions developed or derived from, on account of, or through your use of the report are yours; NCCI does not endorse, approve, or otherwise acquiesce in your actions, results, analyses, or decisions, nor shall NCCI or other contributors to the Medical Data Report have any liability thereto.
ii
NEW HAMPSHIRE
Introduction
Medical costs have consistently been on the rise over the last 30 years. Today, in many states,
close to 60% of workers compensation benefits are attributed to medical costs. The rising cost of medical care is the major issue facing workers compensation stakeholders now and in the
foreseeable future. The availability of medical data on workers compensation claims is essential for analyses of issues such as the pricing of proposed state legislation, impacts to medical fee
schedules, and research.
This publication is a data source for regulators and others who may be interested in the
increasing medical costs in workers compensation claims. The information in this report provides important benchmarks against which cost containment strategies may be measured and gives valuable insight into the medical cost drivers that threaten the financial soundness of the
workers compensation system.
Knowing how payments for different services contribute to workers compensation medical benefit costs provides insight into the growth of medical benefits. This report illustrates the breakdown of services by category, namely:
Physician
Hospital Ambulatory Surgical Centers Drugs
Durable Medical Equipment (DME), Supplies, and Implants Other
Next, the report drills down into these categories to demonstrate which particular procedures represent the greatest share of payments and which are performed the most.
Additionally, this report provides detail on payments for prescription drugs including which drugs are being prescribed the most and which ones represent the greatest share of drug payments,
as well as information on repackaged drugs.
One important caveat: information in this report may not coincide with an analysis of a medical fee schedule change performed in the future. An analysis of a medical fee schedule change requires evaluation of the specific procedures covered by the fee schedule, which may be
different from how payments are categorized in this report.
Additional information regarding the data underlying this report is described in more detail in the appendix.
iii
NEW HAMPSHIRE
Table of Contents
Medical Share of Total Benefit Costs ................................................................................................................. 1
Overall Medical Average Cost per Case ............................................................................................................. 2
Percentage of Medical Paid by Claim Maturity .................................................................................................... 3
Distribution of Medical Payments ...................................................................................................................... 4
Distribution of Physician Payments by AMA Service Category ............................................................................... 6
Top 10 Surgery Procedure Codes by Amount Paid for New Hampshire ................................................................... 8
Top 10 Surgery Procedure Codes by Transaction Counts for New Hampshire ......................................................... 9
Top 10 Radiology Procedure Codes by Amount Paid for New Hampshire ............................................................... 10
Top 10 Radiology Procedure Codes by Transaction Counts for New Hampshire ...................................................... 11
Top 10 Medicine Procedure Codes by Amount Paid for New Hampshire ................................................................ 12
Top 10 Medicine Procedure Codes by Transaction Counts for New Hampshire ....................................................... 13
Top 10 Evaluation and Management Procedure Codes by Amount Paid for New Hampshire ..................................... 14
Top 10 Evaluation and Management Procedure Codes by Transaction Counts for New Hampshire ............................ 16
Distribution of Payments by Facility Type ......................................................................................................... 18
Top 10 Procedure Codes by Amount Paid for Inpatient Hospital Services for New Hampshire .................................. 20
Top 10 Procedure Codes by Amount Paid for Outpatient Hospital Services for New Hampshire ................................ 21
Top 10 Procedure Codes by Amount Paid for Ambulatory Surgical Center Services for New Hampshire .................... 22
Top 10 Drugs by Amount Paid for New Hampshire ............................................................................................. 23
Top 10 Drugs by Amount Paid for Countrywide ................................................................................................. 23
Top 10 Drugs by Prescription Counts for New Hampshire ................................................................................... 24
Top 10 Drugs by Prescription Counts for Countrywide ........................................................................................ 24
Distribution of Drugs by Brand Name and Generic ............................................................................................. 25
Distribution of Drug Payments ........................................................................................................................ 26
Distribution of Payments by DME, Supplies, and Implants .................................................................................. 28
Glossary ...................................................................................................................................................... 30
APPENDIX .................................................................................................................................................... 31
1
NEW HAMPSHIRE
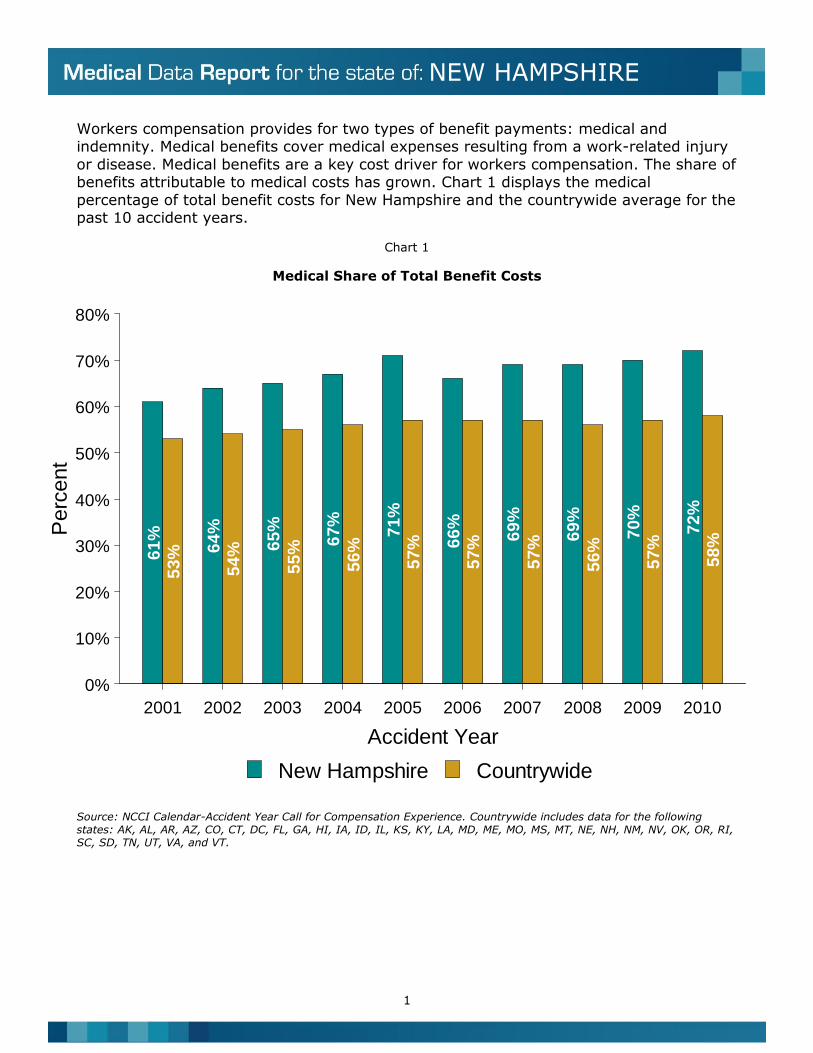
Workers compensation provides for two types of benefit payments: medical and indemnity. Medical benefits cover medical expenses resulting from a work-related injury
or disease. Medical benefits are a key cost driver for workers compensation. The share of benefits attributable to medical costs has grown. Chart 1 displays the medical
percentage of total benefit costs for New Hampshire and the countrywide average for the past 10 accident years.
Chart 1
Medical Share of Total Benefit Costs
Source: NCCI Calendar-Accident Year Call for Compensation Experience. Countrywide includes data for the following states: AK, AL, AR, AZ, CO, CT, DC, FL, GA, HI, IA, ID, IL, KS, KY, LA, MD, ME, MO, MS, MT, NE, NH, NM, NV, OK, OR, RI, SC, SD, TN, UT, VA, and VT.
Accident Year
Perc
ent
2001 2002 2003 2004 2005 2006 2007 2008 2009 2010
0%
10%
20%
30%
40%
50%
60%
70%
80%
61
%5
3% 6
4%
54
% 65
%
55
%
67
%
56
%
71
%5
7% 6
6%
57
%
69
%
57
%
69
%
56
%
70
%5
7%
72
%5
8%
New Hampshire Countrywide
2
NEW HAMPSHIRE
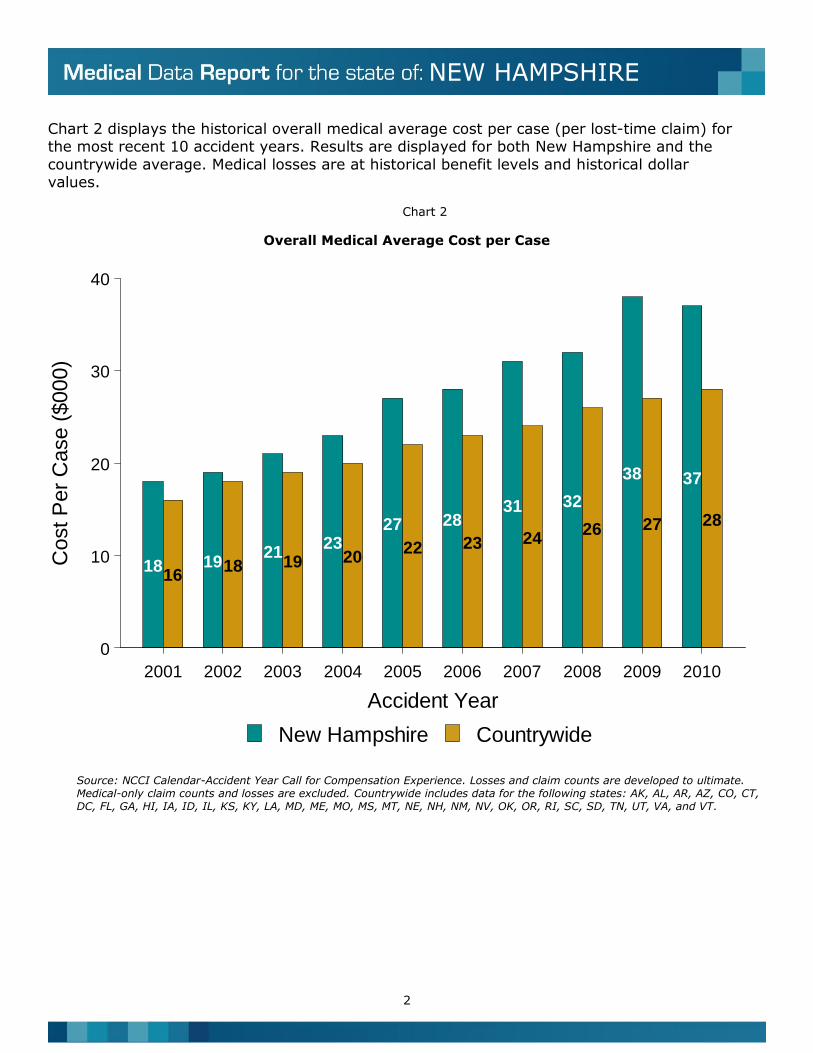
Chart 2 displays the historical overall medical average cost per case (per lost-time claim) for the most recent 10 accident years. Results are displayed for both New Hampshire and the
countrywide average. Medical losses are at historical benefit levels and historical dollar values.
Chart 2
Overall Medical Average Cost per Case
Source: NCCI Calendar-Accident Year Call for Compensation Experience. Losses and claim counts are developed to ultimate. Medical-only claim counts and losses are excluded. Countrywide includes data for the following states: AK, AL, AR, AZ, CO, CT, DC, FL, GA, HI, IA, ID, IL, KS, KY, LA, MD, ME, MO, MS, MT, NE, NH, NM, NV, OK, OR, RI, SC, SD, TN, UT, VA, and VT.
Accident Year
Cost P
er
Case (
$000)
2001 2002 2003 2004 2005 2006 2007 2008 2009 2010
0
10
20
30
40
1816
191821
1923
20
27
22
28
23
31
24
32
26
38
27
37
28
New Hampshire Countrywide
3
NEW HAMPSHIRE
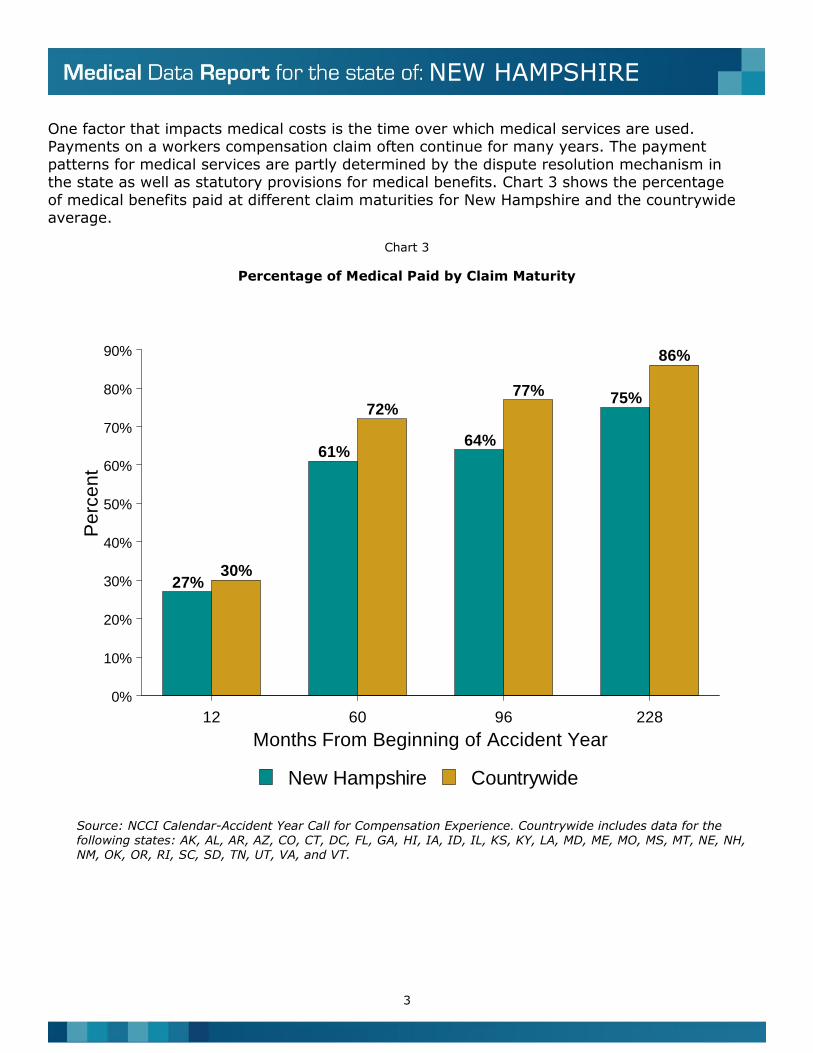
One factor that impacts medical costs is the time over which medical services are used. Payments on a workers compensation claim often continue for many years. The payment
patterns for medical services are partly determined by the dispute resolution mechanism in the state as well as statutory provisions for medical benefits. Chart 3 shows the percentage
of medical benefits paid at different claim maturities for New Hampshire and the countrywide average.
Chart 3
Percentage of Medical Paid by Claim Maturity
Source: NCCI Calendar-Accident Year Call for Compensation Experience. Countrywide includes data for the following states: AK, AL, AR, AZ, CO, CT, DC, FL, GA, HI, IA, ID, IL, KS, KY, LA, MD, ME, MO, MS, MT, NE, NH, NM, OK, OR, RI, SC, SD, TN, UT, VA, and VT.
Months From Beginning of Accident Year
Pe
rce
nt
12 60 96 228
0%
10%
20%
30%
40%
50%
60%
70%
80%
90%
27%30%
61%
72%
64%
77% 75%
86%
New Hampshire Countrywide
4
NEW HAMPSHIRE
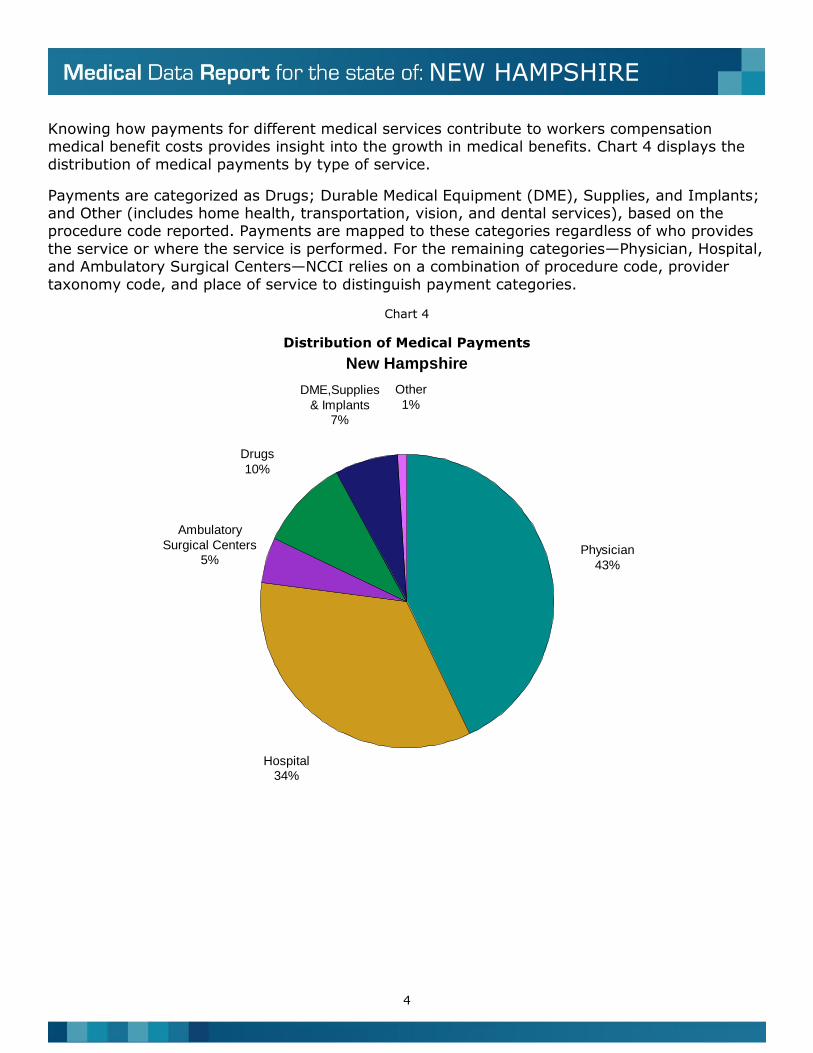
Knowing how payments for different medical services contribute to workers compensation medical benefit costs provides insight into the growth in medical benefits. Chart 4 displays the
distribution of medical payments by type of service.
Payments are categorized as Drugs; Durable Medical Equipment (DME), Supplies, and Implants; and Other (includes home health, transportation, vision, and dental services), based on the procedure code reported. Payments are mapped to these categories regardless of who provides
the service or where the service is performed. For the remaining categories—Physician, Hospital, and Ambulatory Surgical Centers—NCCI relies on a combination of procedure code, provider
taxonomy code, and place of service to distinguish payment categories.
Chart 4
Distribution of Medical Payments
Physician
43%
Hospital34%
Ambulatory
Surgical Centers
5%
Drugs
10%
DME,Supplies
& Implants7%
Other
1%
New Hampshire
5
NEW HAMPSHIRE
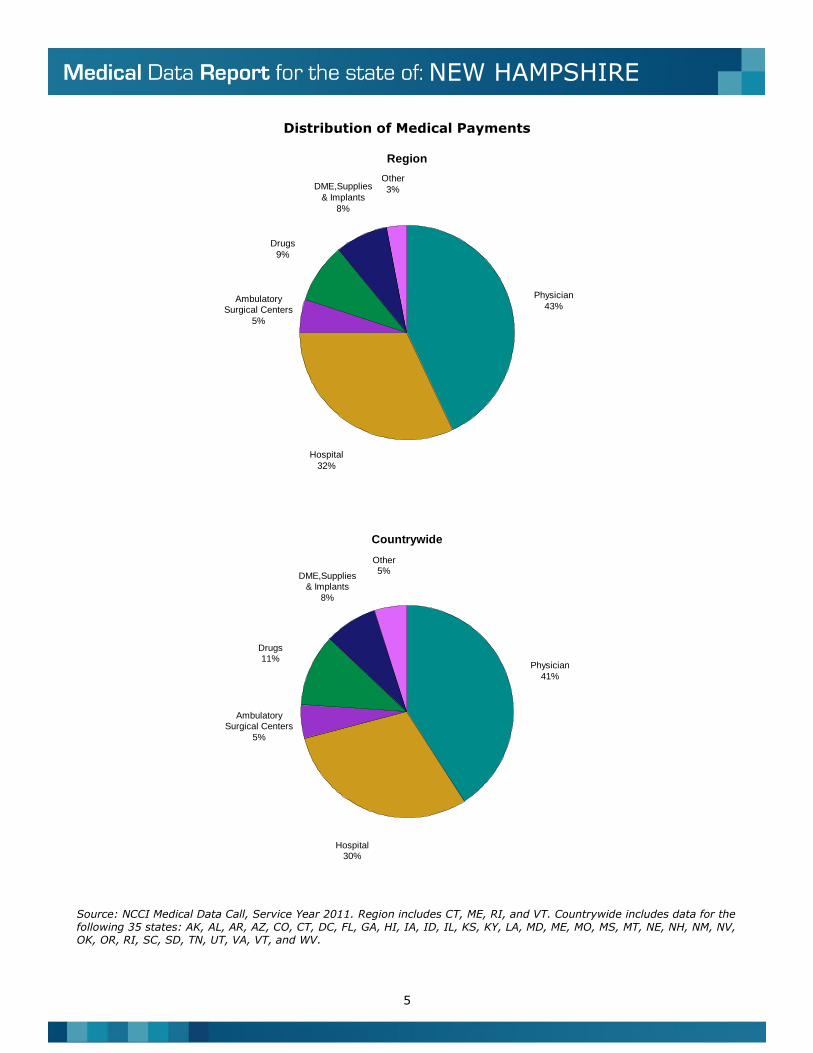
Distribution of Medical Payments
Source: NCCI Medical Data Call, Service Year 2011. Region includes CT, ME, RI, and VT. Countrywide includes data for the following 35 states: AK, AL, AR, AZ, CO, CT, DC, FL, GA, HI, IA, ID, IL, KS, KY, LA, MD, ME, MO, MS, MT, NE, NH, NM, NV, OK, OR, RI, SC, SD, TN, UT, VA, VT, and WV.
Physician
43%
Hospital
32%
AmbulatorySurgical Centers
5%
Drugs
9%
DME,Supplies
& Implants
8%
Other
3%
Region
Physician
41%
Hospital30%
Ambulatory
Surgical Centers
5%
Drugs11%
DME,Supplies& Implants
8%
Other5%
Countrywide
6
NEW HAMPSHIRE
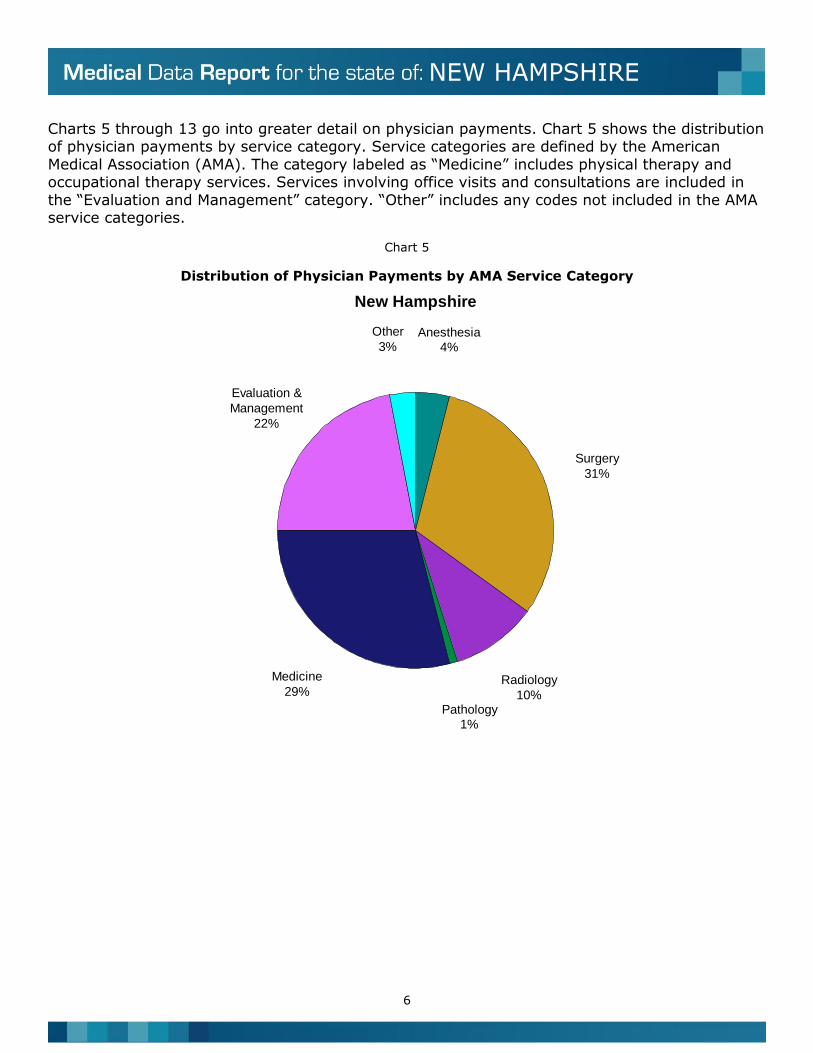
Charts 5 through 13 go into greater detail on physician payments. Chart 5 shows the distribution of physician payments by service category. Service categories are defined by the American
Medical Association (AMA). The category labeled as “Medicine” includes physical therapy and occupational therapy services. Services involving office visits and consultations are included in
the “Evaluation and Management” category. “Other” includes any codes not included in the AMA service categories.
Chart 5
Distribution of Physician Payments by AMA Service Category
Anesthesia
4%
Surgery
31%
Radiology
10%Pathology
1%
Medicine
29%
Evaluation &
Management
22%
Other
3%
New Hampshire
7
NEW HAMPSHIRE
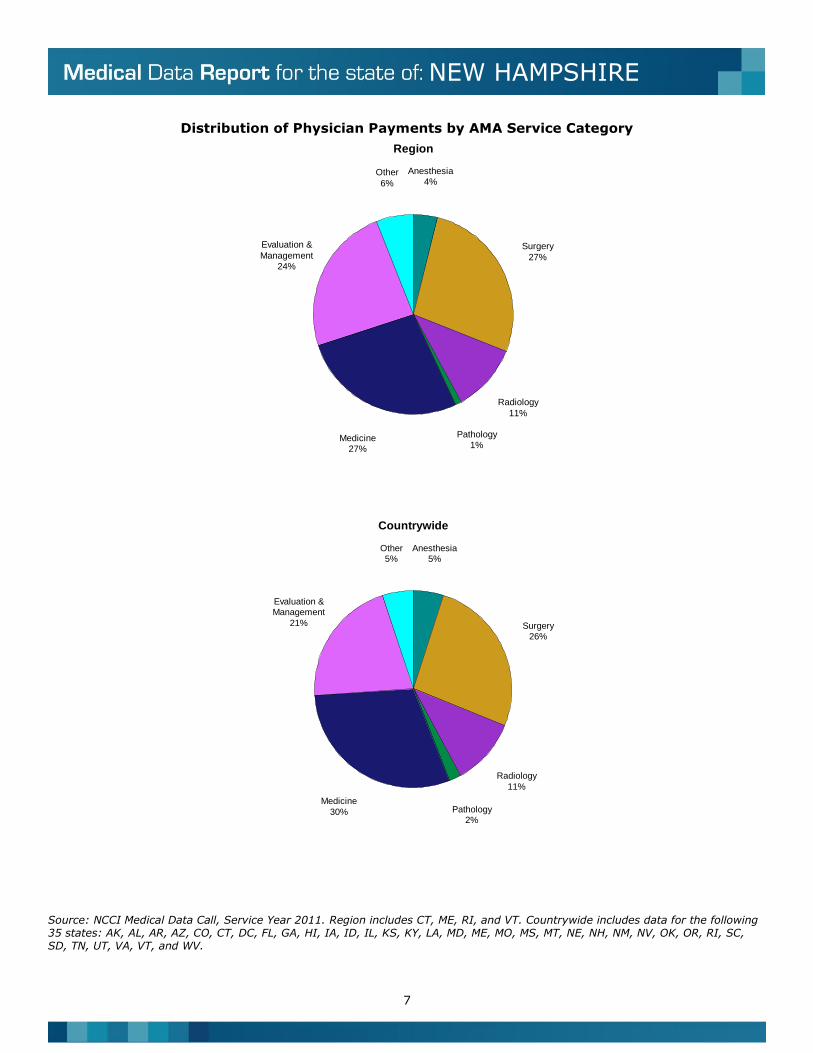
Distribution of Physician Payments by AMA Service Category
Source: NCCI Medical Data Call, Service Year 2011. Region includes CT, ME, RI, and VT. Countrywide includes data for the following 35 states: AK, AL, AR, AZ, CO, CT, DC, FL, GA, HI, IA, ID, IL, KS, KY, LA, MD, ME, MO, MS, MT, NE, NH, NM, NV, OK, OR, RI, SC, SD, TN, UT, VA, VT, and WV.
Anesthesia
4%
Surgery
27%
Radiology
11%
Pathology1%
Medicine27%
Evaluation &
Management24%
Other
6%
Region
Anesthesia
5%
Surgery
26%
Radiology
11%
Pathology
2%
Medicine
30%
Evaluation &Management
21%
Other
5%
Countrywide
8
NEW HAMPSHIRE
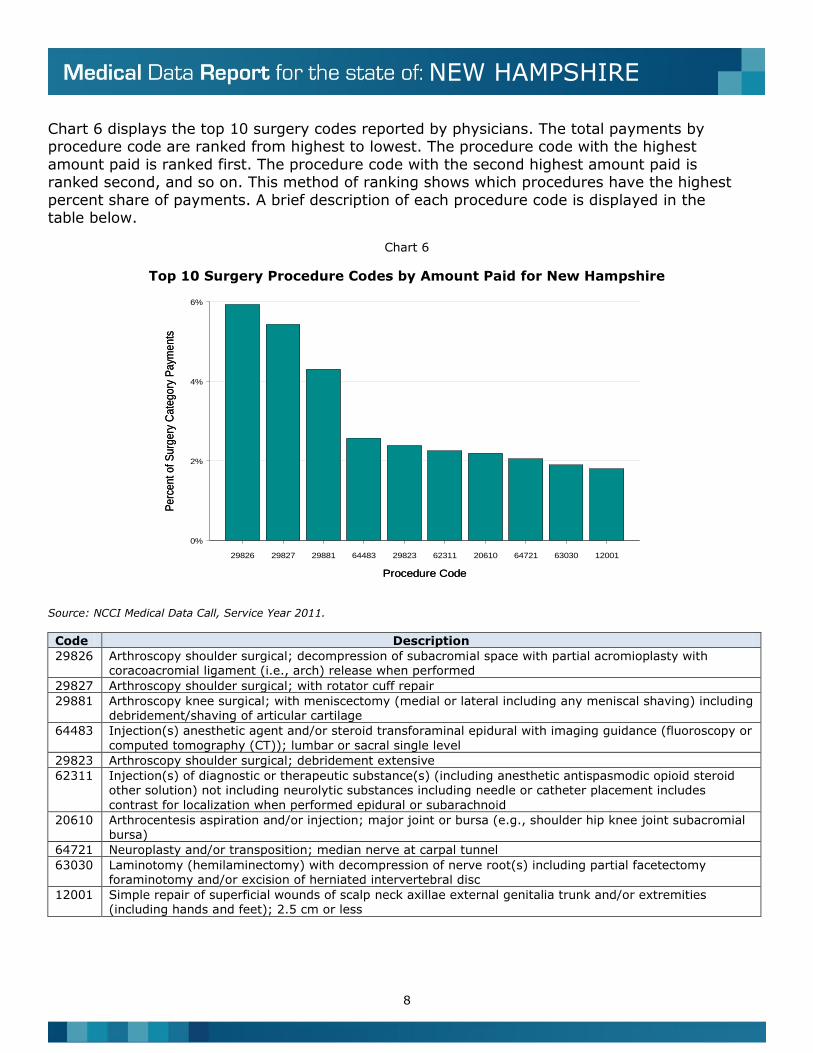
Chart 6 displays the top 10 surgery codes reported by physicians. The total payments by procedure code are ranked from highest to lowest. The procedure code with the highest
amount paid is ranked first. The procedure code with the second highest amount paid is ranked second, and so on. This method of ranking shows which procedures have the highest
percent share of payments. A brief description of each procedure code is displayed in the table below.
Chart 6
Top 10 Surgery Procedure Codes by Amount Paid for New Hampshire
Source: NCCI Medical Data Call, Service Year 2011.
Code Description
29826 Arthroscopy shoulder surgical; decompression of subacromial space with partial acromioplasty with coracoacromial ligament (i.e., arch) release when performed
29827 Arthroscopy shoulder surgical; with rotator cuff repair
29881 Arthroscopy knee surgical; with meniscectomy (medial or lateral including any meniscal shaving) including debridement/shaving of articular cartilage
64483 Injection(s) anesthetic agent and/or steroid transforaminal epidural with imaging guidance (fluoroscopy or
computed tomography (CT)); lumbar or sacral single level
29823 Arthroscopy shoulder surgical; debridement extensive
62311 Injection(s) of diagnostic or therapeutic substance(s) (including anesthetic antispasmodic opioid steroid other solution) not including neurolytic substances including needle or catheter placement includes
contrast for localization when performed epidural or subarachnoid
20610 Arthrocentesis aspiration and/or injection; major joint or bursa (e.g., shoulder hip knee joint subacromial bursa)
64721 Neuroplasty and/or transposition; median nerve at carpal tunnel
63030 Laminotomy (hemilaminectomy) with decompression of nerve root(s) including partial facetectomy foraminotomy and/or excision of herniated intervertebral disc
12001 Simple repair of superficial wounds of scalp neck axillae external genitalia trunk and/or extremities (including hands and feet); 2.5 cm or less
Procedure Code
Pe
rce
nt
of
Su
rge
ry C
ate
go
ry P
aym
en
ts
29826 29827 29881 64483 29823 62311 20610 64721 63030 12001
0%
2%
4%
6%
Procedure Code
Pe
rce
nt
of
Su
rge
ry C
ate
go
ry P
aym
en
ts
9
NEW HAMPSHIRE
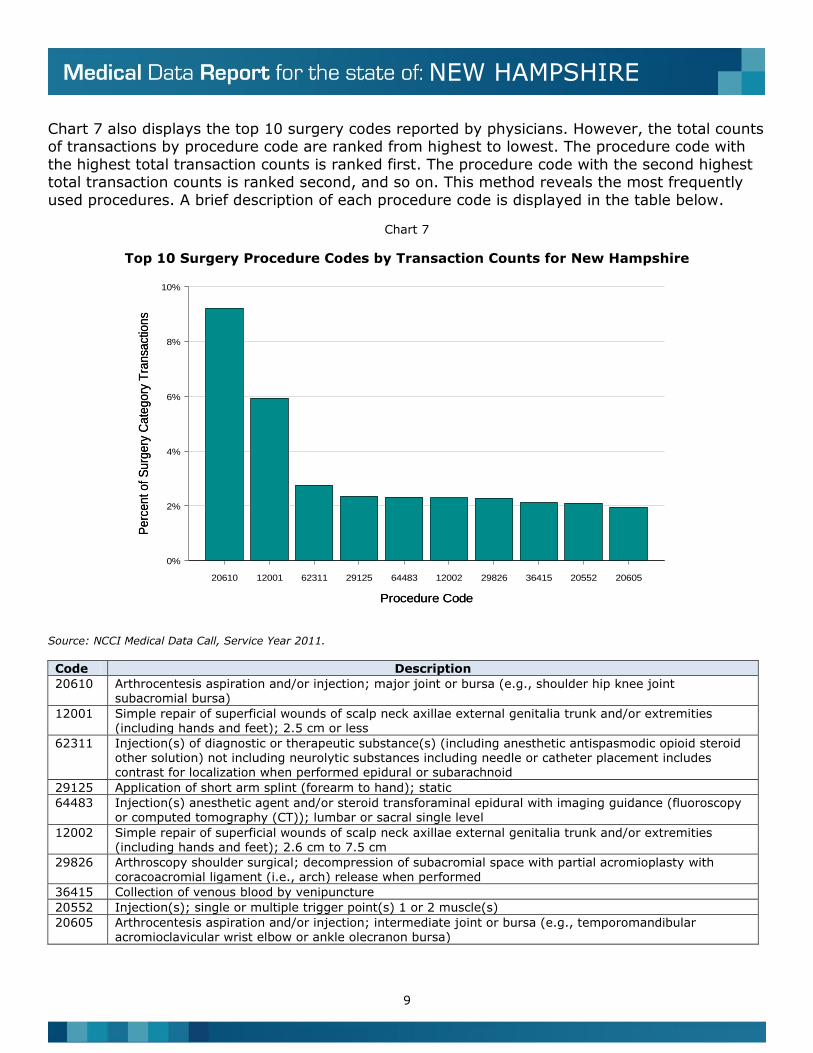
Chart 7 also displays the top 10 surgery codes reported by physicians. However, the total counts of transactions by procedure code are ranked from highest to lowest. The procedure code with
the highest total transaction counts is ranked first. The procedure code with the second highest total transaction counts is ranked second, and so on. This method reveals the most frequently
used procedures. A brief description of each procedure code is displayed in the table below.
Chart 7
Top 10 Surgery Procedure Codes by Transaction Counts for New Hampshire
Source: NCCI Medical Data Call, Service Year 2011.
Code Description
20610 Arthrocentesis aspiration and/or injection; major joint or bursa (e.g., shoulder hip knee joint subacromial bursa)
12001 Simple repair of superficial wounds of scalp neck axillae external genitalia trunk and/or extremities (including hands and feet); 2.5 cm or less
62311 Injection(s) of diagnostic or therapeutic substance(s) (including anesthetic antispasmodic opioid steroid other solution) not including neurolytic substances including needle or catheter placement includes contrast for localization when performed epidural or subarachnoid
29125 Application of short arm splint (forearm to hand); static
64483 Injection(s) anesthetic agent and/or steroid transforaminal epidural with imaging guidance (fluoroscopy or computed tomography (CT)); lumbar or sacral single level
12002 Simple repair of superficial wounds of scalp neck axillae external genitalia trunk and/or extremities (including hands and feet); 2.6 cm to 7.5 cm
29826 Arthroscopy shoulder surgical; decompression of subacromial space with partial acromioplasty with coracoacromial ligament (i.e., arch) release when performed
36415 Collection of venous blood by venipuncture
20552 Injection(s); single or multiple trigger point(s) 1 or 2 muscle(s)
20605 Arthrocentesis aspiration and/or injection; intermediate joint or bursa (e.g., temporomandibular acromioclavicular wrist elbow or ankle olecranon bursa)
Procedure Code
Pe
rce
nt
of
Su
rge
ry C
ate
go
ry T
ran
sact
ion
s
20610 12001 62311 29125 64483 12002 29826 36415 20552 20605
0%
2%
4%
6%
8%
10%
Procedure Code
Pe
rce
nt
of
Su
rge
ry C
ate
go
ry T
ran
sact
ion
s
10
NEW HAMPSHIRE
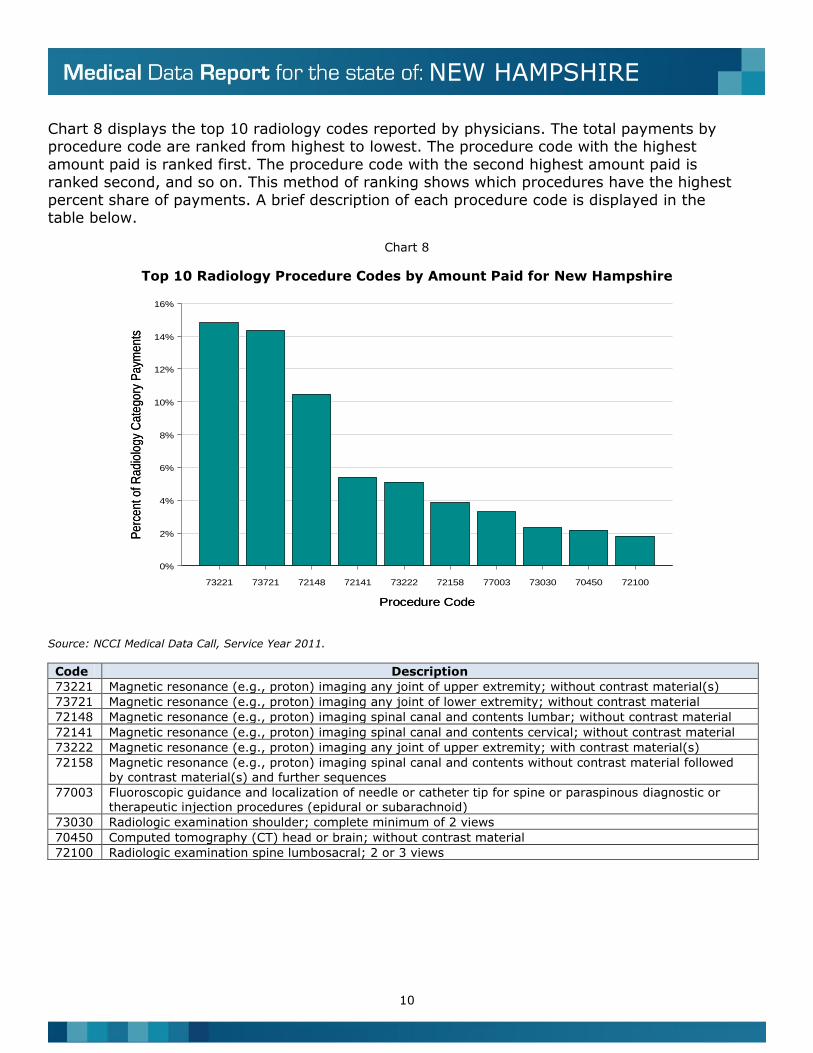
Chart 8 displays the top 10 radiology codes reported by physicians. The total payments by procedure code are ranked from highest to lowest. The procedure code with the highest
amount paid is ranked first. The procedure code with the second highest amount paid is ranked second, and so on. This method of ranking shows which procedures have the highest
percent share of payments. A brief description of each procedure code is displayed in the table below.
Chart 8
Top 10 Radiology Procedure Codes by Amount Paid for New Hampshire
Source: NCCI Medical Data Call, Service Year 2011.
Code Description
73221 Magnetic resonance (e.g., proton) imaging any joint of upper extremity; without contrast material(s)
73721 Magnetic resonance (e.g., proton) imaging any joint of lower extremity; without contrast material
72148 Magnetic resonance (e.g., proton) imaging spinal canal and contents lumbar; without contrast material
72141 Magnetic resonance (e.g., proton) imaging spinal canal and contents cervical; without contrast material
73222 Magnetic resonance (e.g., proton) imaging any joint of upper extremity; with contrast material(s)
72158 Magnetic resonance (e.g., proton) imaging spinal canal and contents without contrast material followed
by contrast material(s) and further sequences
77003 Fluoroscopic guidance and localization of needle or catheter tip for spine or paraspinous diagnostic or
therapeutic injection procedures (epidural or subarachnoid)
73030 Radiologic examination shoulder; complete minimum of 2 views
70450 Computed tomography (CT) head or brain; without contrast material
72100 Radiologic examination spine lumbosacral; 2 or 3 views
Procedure Code
Pe
rce
nt
of
Ra
dio
log
y C
ate
go
ry P
aym
en
ts
73221 73721 72148 72141 73222 72158 77003 73030 70450 72100
0%
2%
4%
6%
8%
10%
12%
14%
16%
Procedure Code
Pe
rce
nt
of
Ra
dio
log
y C
ate
go
ry P
aym
en
ts
11
NEW HAMPSHIRE
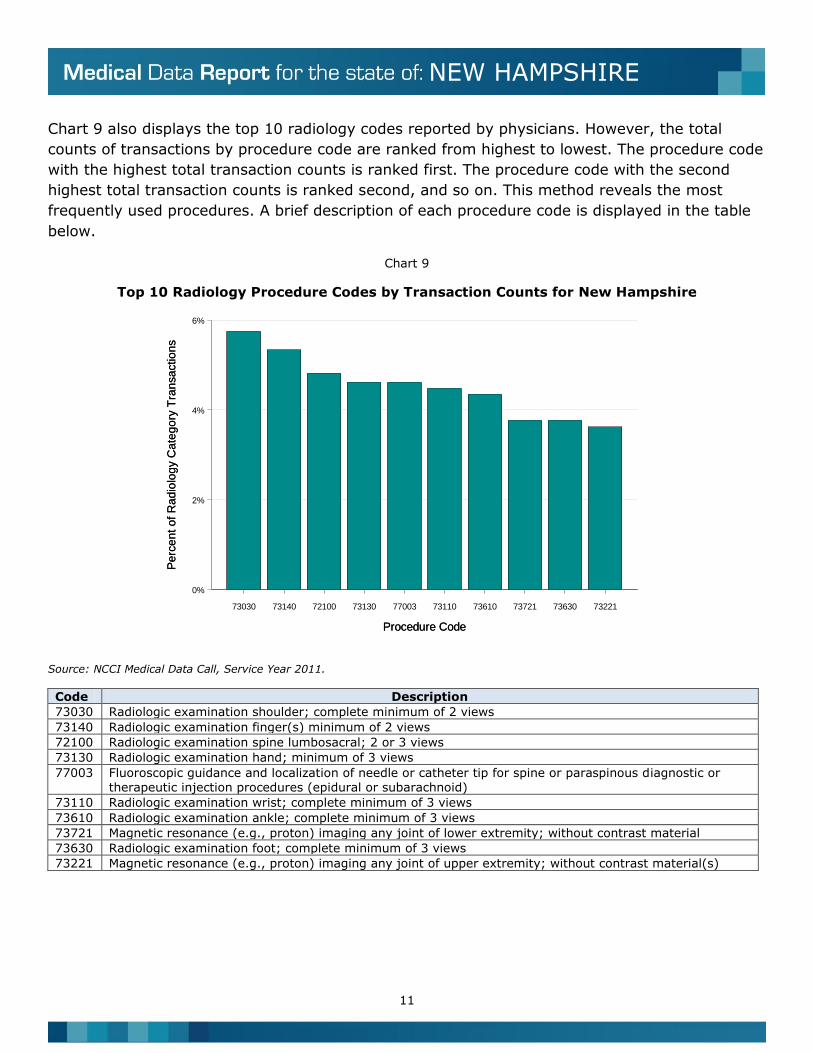
Chart 9 also displays the top 10 radiology codes reported by physicians. However, the total
counts of transactions by procedure code are ranked from highest to lowest. The procedure code
with the highest total transaction counts is ranked first. The procedure code with the second
highest total transaction counts is ranked second, and so on. This method reveals the most
frequently used procedures. A brief description of each procedure code is displayed in the table
below.
Chart 9
Top 10 Radiology Procedure Codes by Transaction Counts for New Hampshire
Source: NCCI Medical Data Call, Service Year 2011.
Code Description
73030 Radiologic examination shoulder; complete minimum of 2 views
73140 Radiologic examination finger(s) minimum of 2 views
72100 Radiologic examination spine lumbosacral; 2 or 3 views
73130 Radiologic examination hand; minimum of 3 views
77003 Fluoroscopic guidance and localization of needle or catheter tip for spine or paraspinous diagnostic or therapeutic injection procedures (epidural or subarachnoid)
73110 Radiologic examination wrist; complete minimum of 3 views
73610 Radiologic examination ankle; complete minimum of 3 views
73721 Magnetic resonance (e.g., proton) imaging any joint of lower extremity; without contrast material
73630 Radiologic examination foot; complete minimum of 3 views
73221 Magnetic resonance (e.g., proton) imaging any joint of upper extremity; without contrast material(s)
Procedure Code
Pe
rce
nt
of
Ra
dio
log
y C
ate
go
ry T
ran
sa
ctio
ns
73030 73140 72100 73130 77003 73110 73610 73721 73630 73221
0%
2%
4%
6%
Procedure Code
Pe
rce
nt
of
Ra
dio
log
y C
ate
go
ry T
ran
sa
ctio
ns
12
NEW HAMPSHIRE
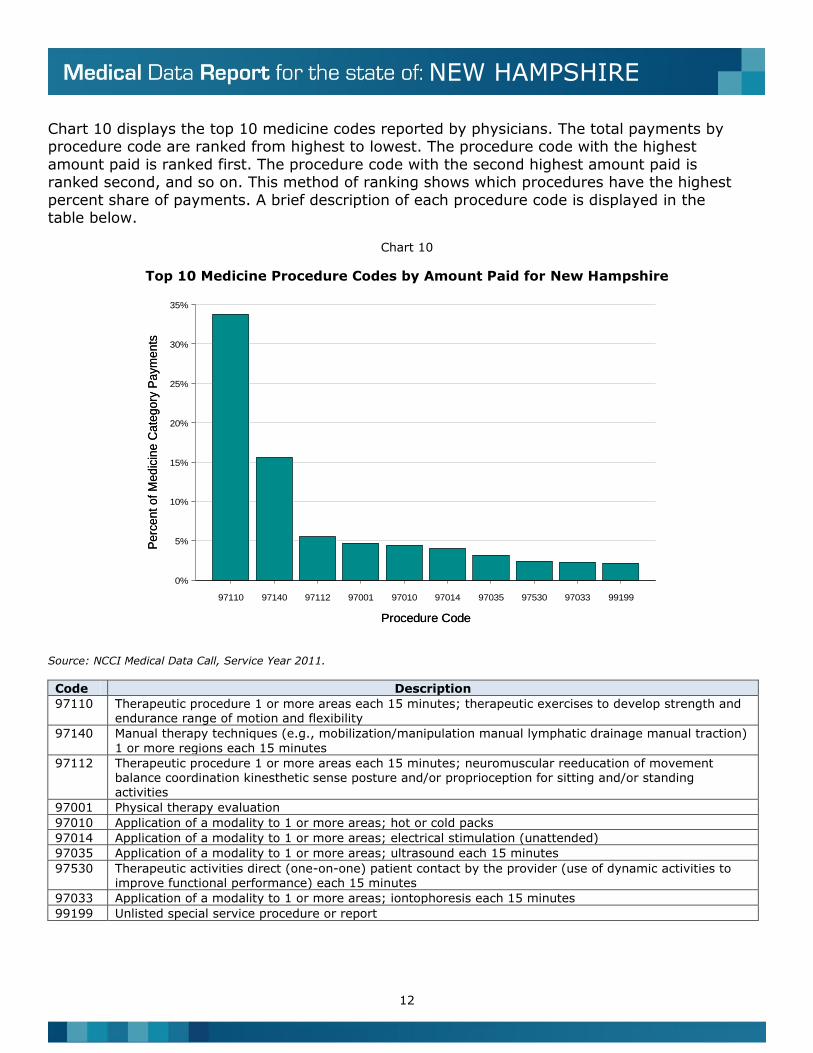
Chart 10 displays the top 10 medicine codes reported by physicians. The total payments by procedure code are ranked from highest to lowest. The procedure code with the highest
amount paid is ranked first. The procedure code with the second highest amount paid is ranked second, and so on. This method of ranking shows which procedures have the highest
percent share of payments. A brief description of each procedure code is displayed in the table below.
Chart 10
Top 10 Medicine Procedure Codes by Amount Paid for New Hampshire
Source: NCCI Medical Data Call, Service Year 2011.
Code Description
97110 Therapeutic procedure 1 or more areas each 15 minutes; therapeutic exercises to develop strength and endurance range of motion and flexibility
97140 Manual therapy techniques (e.g., mobilization/manipulation manual lymphatic drainage manual traction)
1 or more regions each 15 minutes
97112 Therapeutic procedure 1 or more areas each 15 minutes; neuromuscular reeducation of movement balance coordination kinesthetic sense posture and/or proprioception for sitting and/or standing activities
97001 Physical therapy evaluation
97010 Application of a modality to 1 or more areas; hot or cold packs
97014 Application of a modality to 1 or more areas; electrical stimulation (unattended)
97035 Application of a modality to 1 or more areas; ultrasound each 15 minutes
97530 Therapeutic activities direct (one-on-one) patient contact by the provider (use of dynamic activities to improve functional performance) each 15 minutes
97033 Application of a modality to 1 or more areas; iontophoresis each 15 minutes
99199 Unlisted special service procedure or report
Procedure Code
Pe
rce
nt
of
Me
dic
ine
Ca
teg
ory
Pa
ym
en
ts
97110 97140 97112 97001 97010 97014 97035 97530 97033 99199
0%
5%
10%
15%
20%
25%
30%
35%
Procedure Code
Pe
rce
nt
of
Me
dic
ine
Ca
teg
ory
Pa
ym
en
ts
13
NEW HAMPSHIRE
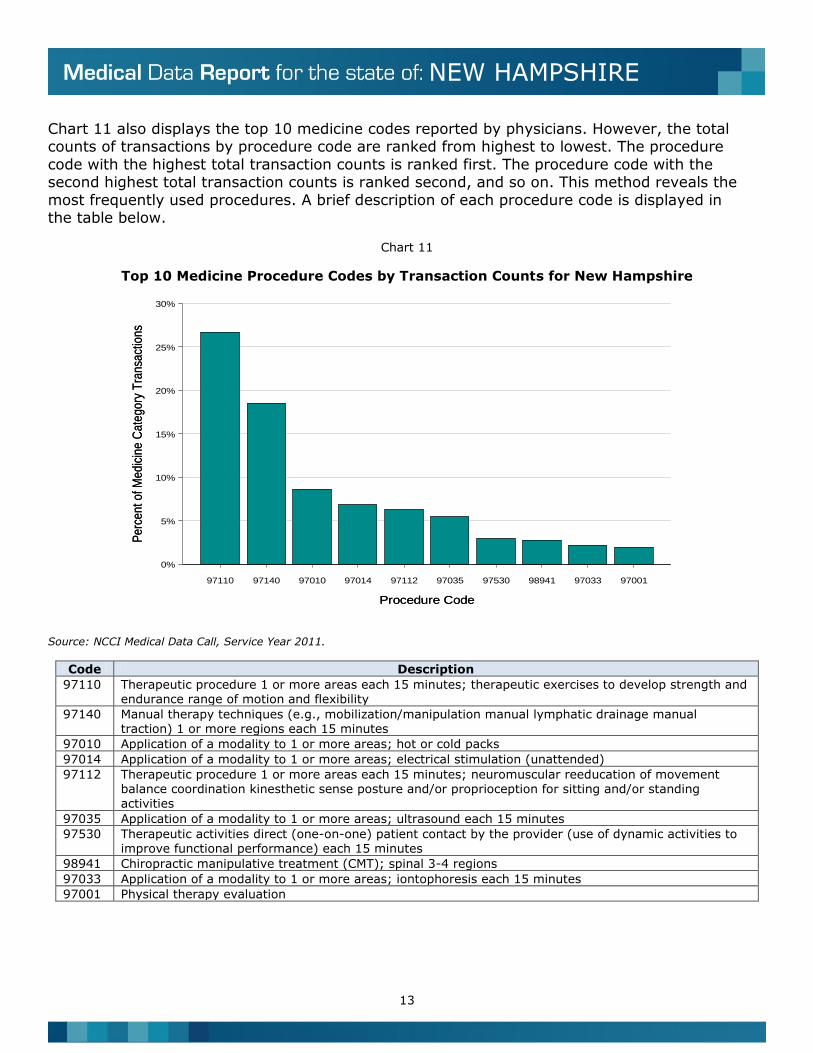
Chart 11 also displays the top 10 medicine codes reported by physicians. However, the total counts of transactions by procedure code are ranked from highest to lowest. The procedure
code with the highest total transaction counts is ranked first. The procedure code with the second highest total transaction counts is ranked second, and so on. This method reveals the
most frequently used procedures. A brief description of each procedure code is displayed in the table below.
Chart 11
Top 10 Medicine Procedure Codes by Transaction Counts for New Hampshire
Source: NCCI Medical Data Call, Service Year 2011.
Code Description
97110 Therapeutic procedure 1 or more areas each 15 minutes; therapeutic exercises to develop strength and endurance range of motion and flexibility
97140 Manual therapy techniques (e.g., mobilization/manipulation manual lymphatic drainage manual traction) 1 or more regions each 15 minutes
97010 Application of a modality to 1 or more areas; hot or cold packs
97014 Application of a modality to 1 or more areas; electrical stimulation (unattended)
97112 Therapeutic procedure 1 or more areas each 15 minutes; neuromuscular reeducation of movement balance coordination kinesthetic sense posture and/or proprioception for sitting and/or standing
activities
97035 Application of a modality to 1 or more areas; ultrasound each 15 minutes
97530 Therapeutic activities direct (one-on-one) patient contact by the provider (use of dynamic activities to improve functional performance) each 15 minutes
98941 Chiropractic manipulative treatment (CMT); spinal 3-4 regions
97033 Application of a modality to 1 or more areas; iontophoresis each 15 minutes
97001 Physical therapy evaluation
Procedure Code
Pe
rce
nt
of
Me
dic
ine
Ca
teg
ory
Tra
nsa
ctio
ns
97110 97140 97010 97014 97112 97035 97530 98941 97033 97001
0%
5%
10%
15%
20%
25%
30%
Procedure Code
Pe
rce
nt
of
Me
dic
ine
Ca
teg
ory
Tra
nsa
ctio
ns
14
NEW HAMPSHIRE
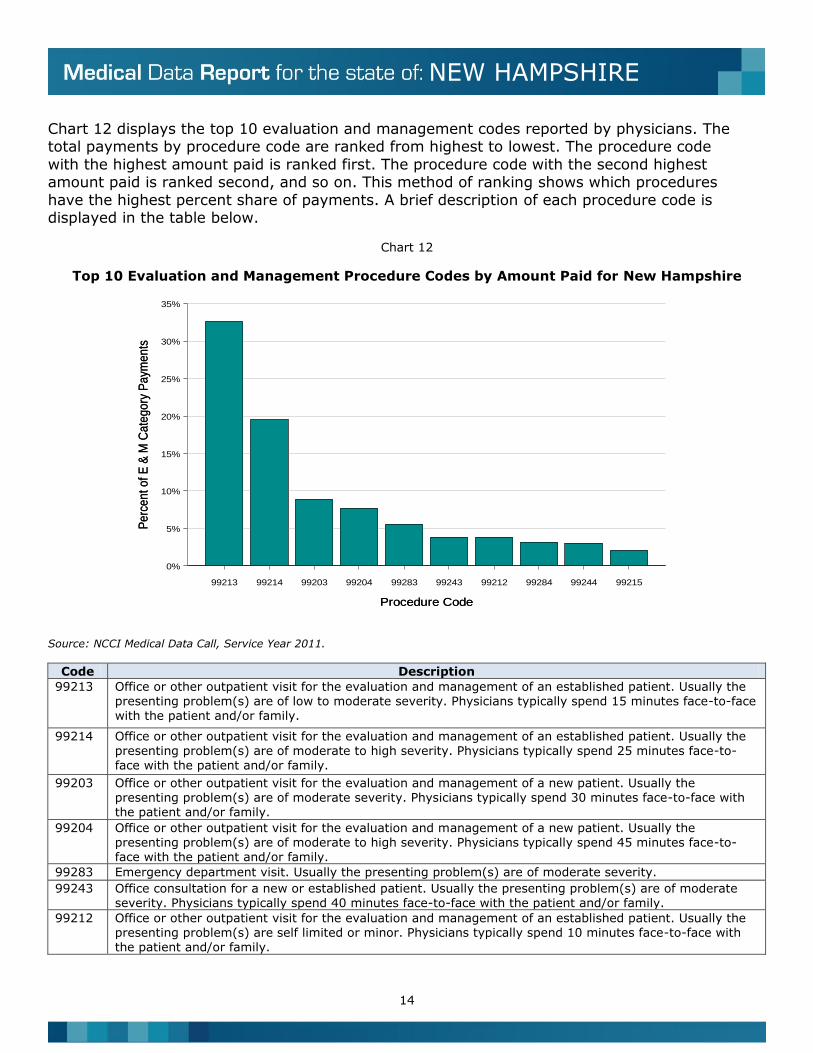
Chart 12 displays the top 10 evaluation and management codes reported by physicians. The total payments by procedure code are ranked from highest to lowest. The procedure code
with the highest amount paid is ranked first. The procedure code with the second highest amount paid is ranked second, and so on. This method of ranking shows which procedures
have the highest percent share of payments. A brief description of each procedure code is displayed in the table below.
Chart 12
Top 10 Evaluation and Management Procedure Codes by Amount Paid for New Hampshire
Source: NCCI Medical Data Call, Service Year 2011.
Code Description
99213 Office or other outpatient visit for the evaluation and management of an established patient. Usually the presenting problem(s) are of low to moderate severity. Physicians typically spend 15 minutes face-to-face with the patient and/or family.
99214 Office or other outpatient visit for the evaluation and management of an established patient. Usually the presenting problem(s) are of moderate to high severity. Physicians typically spend 25 minutes face-to-face with the patient and/or family.
99203 Office or other outpatient visit for the evaluation and management of a new patient. Usually the presenting problem(s) are of moderate severity. Physicians typically spend 30 minutes face-to-face with
the patient and/or family.
99204 Office or other outpatient visit for the evaluation and management of a new patient. Usually the presenting problem(s) are of moderate to high severity. Physicians typically spend 45 minutes face-to-face with the patient and/or family.
99283 Emergency department visit. Usually the presenting problem(s) are of moderate severity.
99243 Office consultation for a new or established patient. Usually the presenting problem(s) are of moderate severity. Physicians typically spend 40 minutes face-to-face with the patient and/or family.
99212 Office or other outpatient visit for the evaluation and management of an established patient. Usually the presenting problem(s) are self limited or minor. Physicians typically spend 10 minutes face-to-face with the patient and/or family.
Procedure Code
Pe
rce
nt
of
E &
M C
ate
go
ry P
aym
en
ts
99213 99214 99203 99204 99283 99243 99212 99284 99244 99215
0%
5%
10%
15%
20%
25%
30%
35%
Procedure Code
Pe
rce
nt
of
E &
M C
ate
go
ry P
aym
en
ts
15
NEW HAMPSHIRE
99284 Emergency department visit. Usually the presenting problem(s) are of high severity and require urgent evaluation by the physician but do not pose an immediate significant threat to life or physiologic function.
99244 Office consultation for a new or established patient. Usually the presenting problem(s) are of moderate to high severity. Physicians typically spend 60 minutes face-to-face with the patient and/or family.
99215 Office or other outpatient visit for the evaluation and management of an established patient. Usually the presenting problem(s) are of moderate to high severity. Physicians typically spend 40 minutes face-to-face with the patient and/or family.
16
NEW HAMPSHIRE
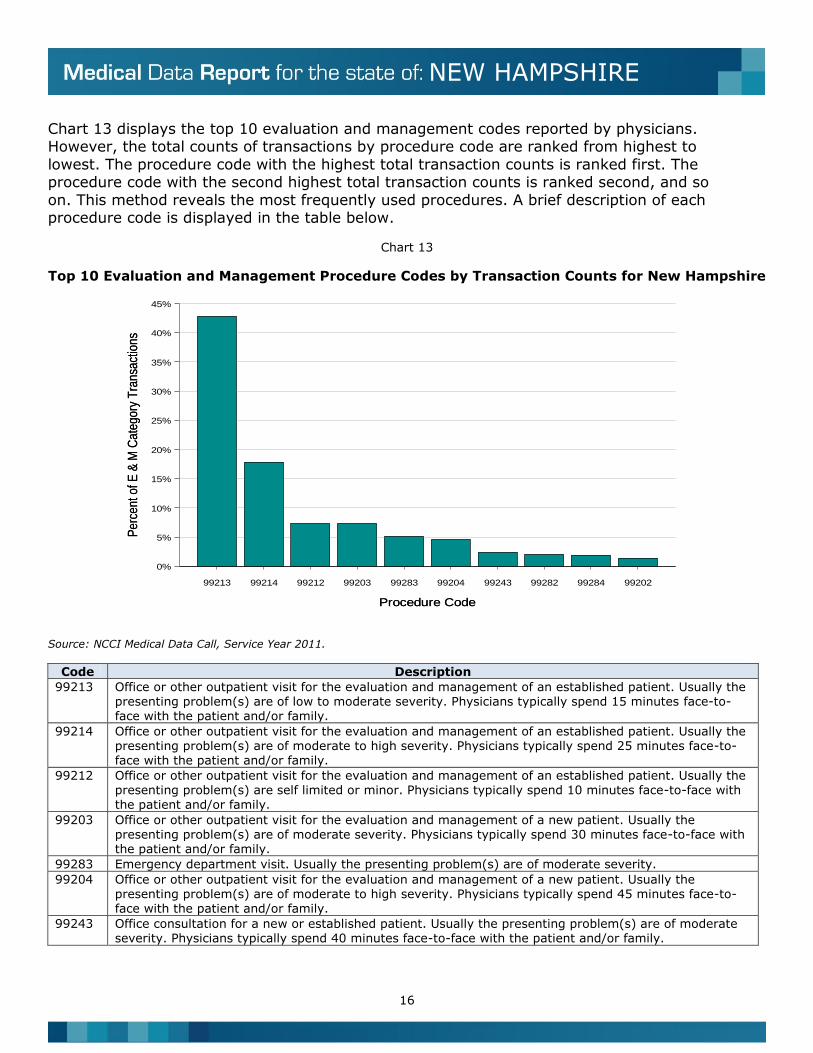
Chart 13 displays the top 10 evaluation and management codes reported by physicians. However, the total counts of transactions by procedure code are ranked from highest to
lowest. The procedure code with the highest total transaction counts is ranked first. The procedure code with the second highest total transaction counts is ranked second, and so
on. This method reveals the most frequently used procedures. A brief description of each procedure code is displayed in the table below.
Chart 13
Top 10 Evaluation and Management Procedure Codes by Transaction Counts for New Hampshire
Source: NCCI Medical Data Call, Service Year 2011.
Code Description
99213 Office or other outpatient visit for the evaluation and management of an established patient. Usually the presenting problem(s) are of low to moderate severity. Physicians typically spend 15 minutes face-to-face with the patient and/or family.
99214 Office or other outpatient visit for the evaluation and management of an established patient. Usually the presenting problem(s) are of moderate to high severity. Physicians typically spend 25 minutes face-to-face with the patient and/or family.
99212 Office or other outpatient visit for the evaluation and management of an established patient. Usually the presenting problem(s) are self limited or minor. Physicians typically spend 10 minutes face-to-face with
the patient and/or family.
99203 Office or other outpatient visit for the evaluation and management of a new patient. Usually the presenting problem(s) are of moderate severity. Physicians typically spend 30 minutes face-to-face with the patient and/or family.
99283 Emergency department visit. Usually the presenting problem(s) are of moderate severity.
99204 Office or other outpatient visit for the evaluation and management of a new patient. Usually the presenting problem(s) are of moderate to high severity. Physicians typically spend 45 minutes face-to-face with the patient and/or family.
99243 Office consultation for a new or established patient. Usually the presenting problem(s) are of moderate severity. Physicians typically spend 40 minutes face-to-face with the patient and/or family.
Procedure Code
Pe
rce
nt o
f E &
M C
ate
go
ry T
ran
sact
ion
s
99213 99214 99212 99203 99283 99204 99243 99282 99284 99202
0%
5%
10%
15%
20%
25%
30%
35%
40%
45%
Procedure Code
Pe
rce
nt o
f E &
M C
ate
go
ry T
ran
sact
ion
s
17
NEW HAMPSHIRE
99282 Emergency department visit. Usually the presenting problem(s) are of low to moderate severity.
99284 Emergency department visit. Usually the presenting problem(s) are of high severity and require urgent
evaluation by the physician but do not pose an immediate significant threat to life or physiologic function.
99202 Office or other outpatient visit for the evaluation and management of a new patient. Usually the presenting problem(s) are of low to moderate severity. Physicians typically spend 20 minutes face-to-face with the patient and/or family.
18
NEW HAMPSHIRE
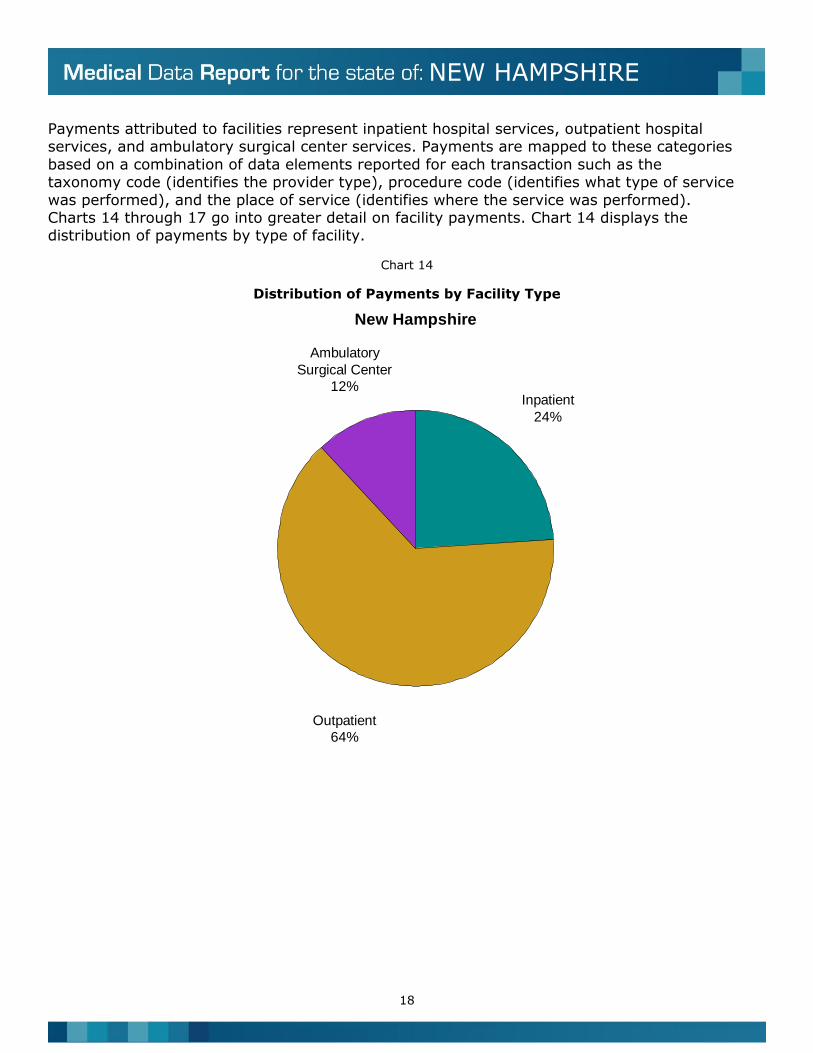
Payments attributed to facilities represent inpatient hospital services, outpatient hospital services, and ambulatory surgical center services. Payments are mapped to these categories
based on a combination of data elements reported for each transaction such as the taxonomy code (identifies the provider type), procedure code (identifies what type of service
was performed), and the place of service (identifies where the service was performed). Charts 14 through 17 go into greater detail on facility payments. Chart 14 displays the distribution of payments by type of facility.
Chart 14
Distribution of Payments by Facility Type
Inpatient
24%
Outpatient
64%
Ambulatory
Surgical Center
12%
New Hampshire
19
NEW HAMPSHIRE
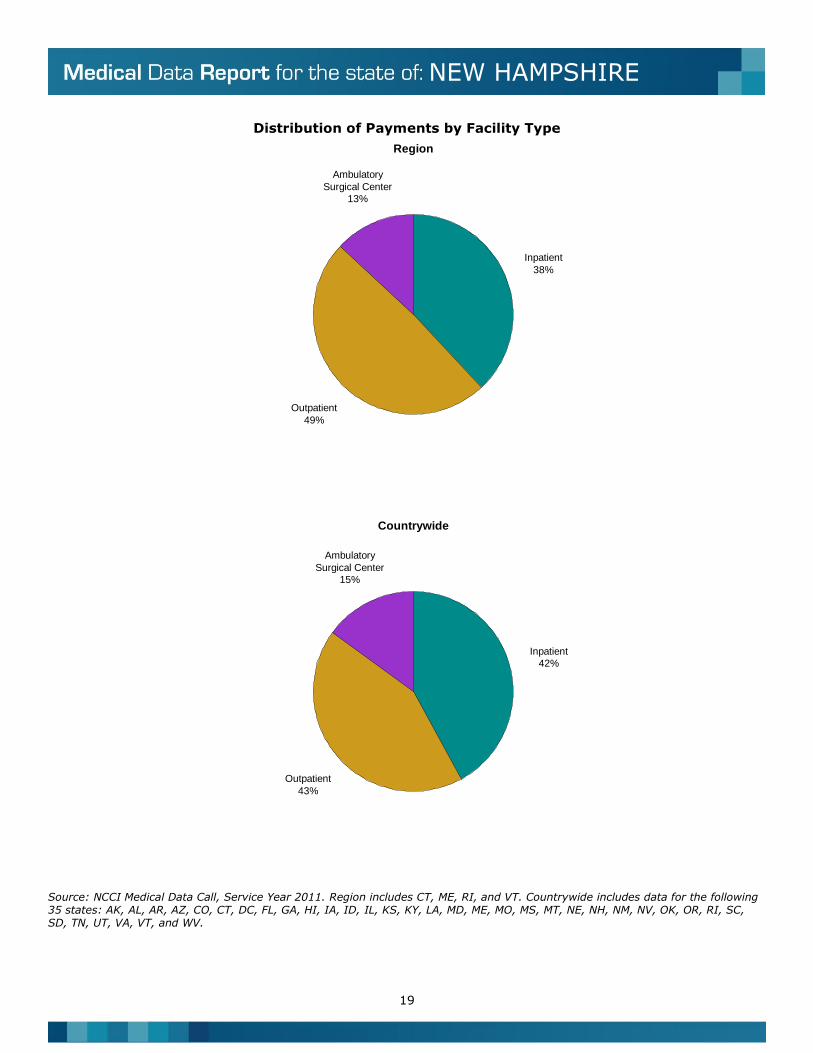
Distribution of Payments by Facility Type
Source: NCCI Medical Data Call, Service Year 2011. Region includes CT, ME, RI, and VT. Countrywide includes data for the following 35 states: AK, AL, AR, AZ, CO, CT, DC, FL, GA, HI, IA, ID, IL, KS, KY, LA, MD, ME, MO, MS, MT, NE, NH, NM, NV, OK, OR, RI, SC, SD, TN, UT, VA, VT, and WV.
Inpatient
38%
Outpatient
49%
Ambulatory
Surgical Center
13%
Region
Inpatient
42%
Outpatient
43%
Ambulatory
Surgical Center
15%
Countrywide
20
NEW HAMPSHIRE
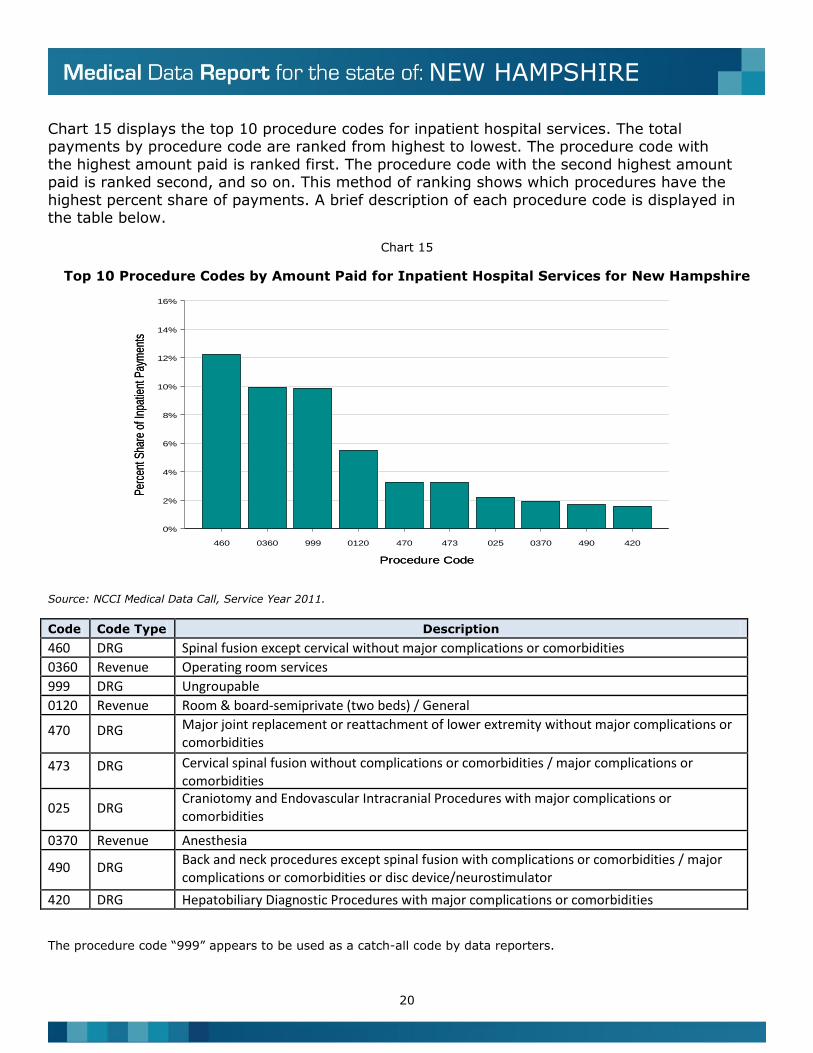
Chart 15 displays the top 10 procedure codes for inpatient hospital services. The total payments by procedure code are ranked from highest to lowest. The procedure code with
the highest amount paid is ranked first. The procedure code with the second highest amount paid is ranked second, and so on. This method of ranking shows which procedures have the
highest percent share of payments. A brief description of each procedure code is displayed in the table below.
Chart 15
Top 10 Procedure Codes by Amount Paid for Inpatient Hospital Services for New Hampshire
Source: NCCI Medical Data Call, Service Year 2011.
Code Code Type Description
460 DRG Spinal fusion except cervical without major complications or comorbidities
0360 Revenue Operating room services
999 DRG Ungroupable
0120 Revenue Room & board-semiprivate (two beds) / General
470 DRG Major joint replacement or reattachment of lower extremity without major complications or comorbidities
473 DRG Cervical spinal fusion without complications or comorbidities / major complications or comorbidities
025 DRG Craniotomy and Endovascular Intracranial Procedures with major complications or comorbidities
0370 Revenue Anesthesia
490 DRG Back and neck procedures except spinal fusion with complications or comorbidities / major complications or comorbidities or disc device/neurostimulator
420 DRG Hepatobiliary Diagnostic Procedures with major complications or comorbidities
The procedure code “999” appears to be used as a catch-all code by data reporters.
Procedure Code
Per
cent
Sha
re o
f Inp
atie
nt P
aym
ents
460 0360 999 0120 470 473 025 0370 490 420
0%
2%
4%
6%
8%
10%
12%
14%
16%
Procedure Code
Per
cent
Sha
re o
f Inp
atie
nt P
aym
ents
21
NEW HAMPSHIRE
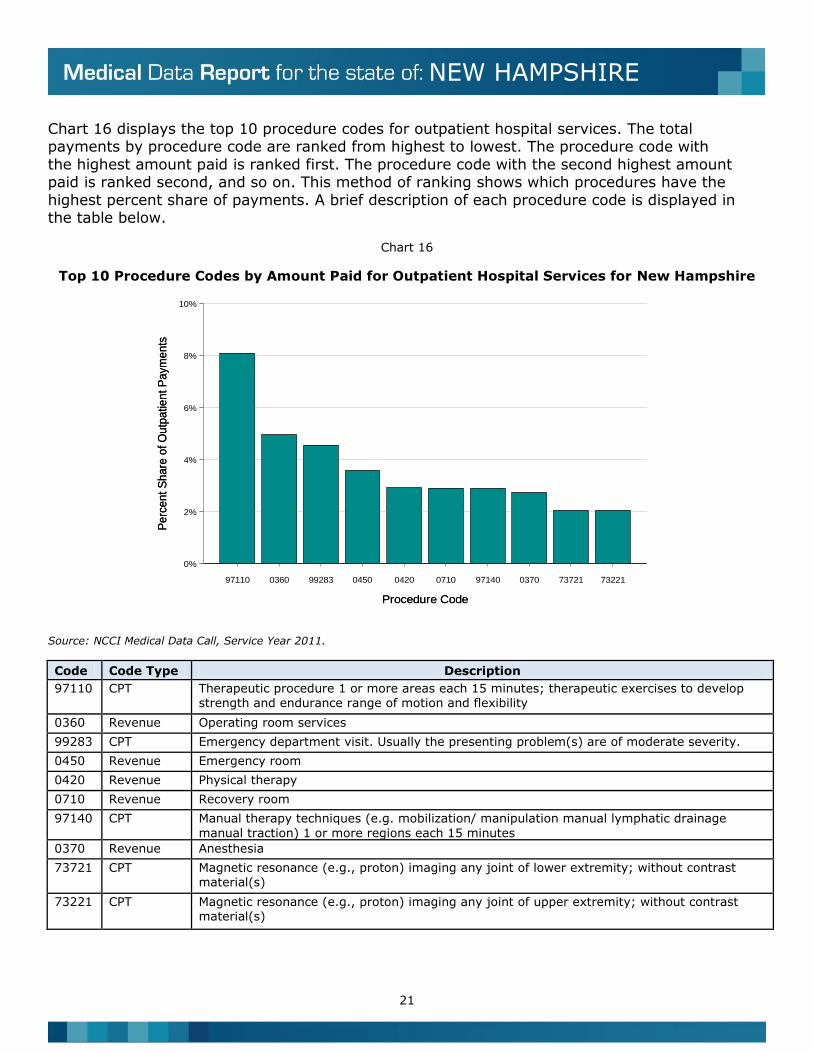
Chart 16 displays the top 10 procedure codes for outpatient hospital services. The total payments by procedure code are ranked from highest to lowest. The procedure code with
the highest amount paid is ranked first. The procedure code with the second highest amount paid is ranked second, and so on. This method of ranking shows which procedures have the
highest percent share of payments. A brief description of each procedure code is displayed in the table below.
Chart 16
Top 10 Procedure Codes by Amount Paid for Outpatient Hospital Services for New Hampshire
Source: NCCI Medical Data Call, Service Year 2011.
Code Code Type Description
97110 CPT Therapeutic procedure 1 or more areas each 15 minutes; therapeutic exercises to develop strength and endurance range of motion and flexibility
0360 Revenue Operating room services
99283 CPT Emergency department visit. Usually the presenting problem(s) are of moderate severity.
0450 Revenue Emergency room
0420 Revenue Physical therapy
0710 Revenue Recovery room
97140 CPT Manual therapy techniques (e.g. mobilization/ manipulation manual lymphatic drainage
manual traction) 1 or more regions each 15 minutes
0370 Revenue Anesthesia
73721 CPT Magnetic resonance (e.g., proton) imaging any joint of lower extremity; without contrast material(s)
73221 CPT Magnetic resonance (e.g., proton) imaging any joint of upper extremity; without contrast material(s)
Procedure Code
Pe
rce
nt
Sh
are
of
Ou
tpa
tien
t P
aym
en
ts
97110 0360 99283 0450 0420 0710 97140 0370 73721 73221
0%
2%
4%
6%
8%
10%
Procedure Code
Pe
rce
nt
Sh
are
of
Ou
tpa
tien
t P
aym
en
ts
22
NEW HAMPSHIRE
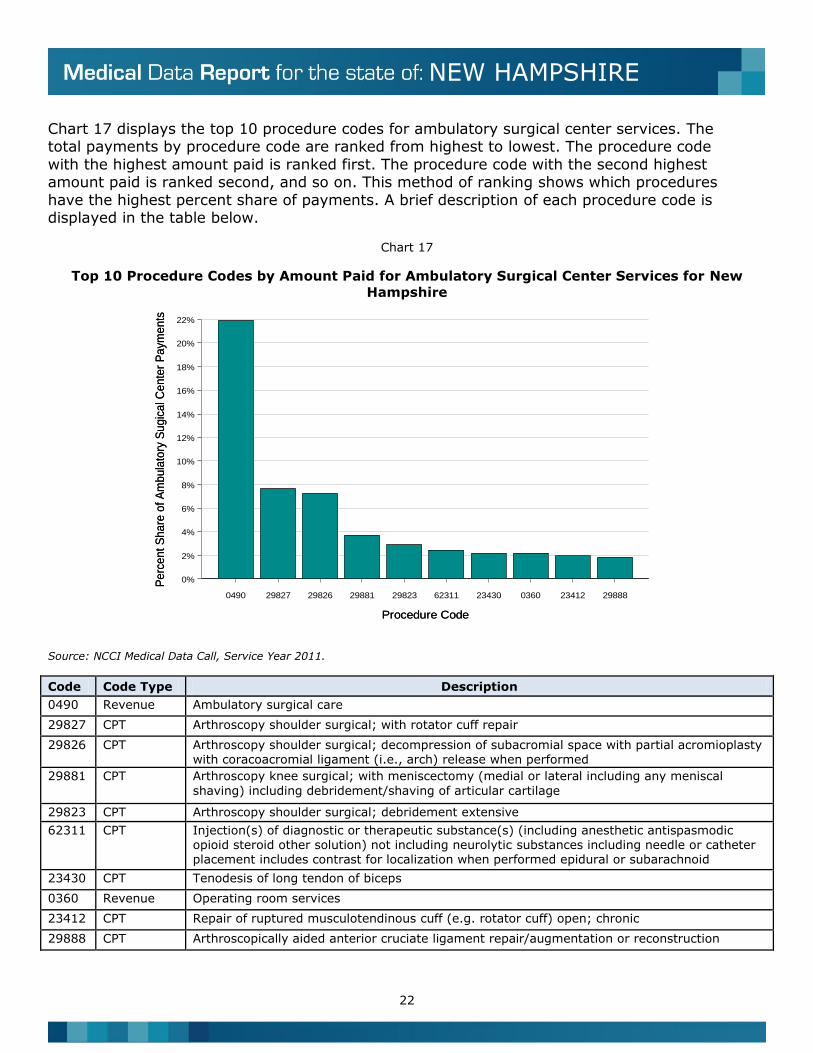
Chart 17 displays the top 10 procedure codes for ambulatory surgical center services. The total payments by procedure code are ranked from highest to lowest. The procedure code
with the highest amount paid is ranked first. The procedure code with the second highest amount paid is ranked second, and so on. This method of ranking shows which procedures
have the highest percent share of payments. A brief description of each procedure code is displayed in the table below.
Chart 17
Top 10 Procedure Codes by Amount Paid for Ambulatory Surgical Center Services for New
Hampshire
Source: NCCI Medical Data Call, Service Year 2011.
Code Code Type Description
0490 Revenue Ambulatory surgical care
29827 CPT Arthroscopy shoulder surgical; with rotator cuff repair
29826 CPT Arthroscopy shoulder surgical; decompression of subacromial space with partial acromioplasty with coracoacromial ligament (i.e., arch) release when performed
29881 CPT Arthroscopy knee surgical; with meniscectomy (medial or lateral including any meniscal
shaving) including debridement/shaving of articular cartilage
29823 CPT Arthroscopy shoulder surgical; debridement extensive
62311 CPT Injection(s) of diagnostic or therapeutic substance(s) (including anesthetic antispasmodic opioid steroid other solution) not including neurolytic substances including needle or catheter placement includes contrast for localization when performed epidural or subarachnoid
23430 CPT Tenodesis of long tendon of biceps
0360 Revenue Operating room services
23412 CPT Repair of ruptured musculotendinous cuff (e.g. rotator cuff) open; chronic
29888 CPT Arthroscopically aided anterior cruciate ligament repair/augmentation or reconstruction
Procedure Code
Pe
rce
nt
Sh
are
of
Am
bu
lato
ry S
ug
ica
l Ce
nte
r P
aym
en
ts
0490 29827 29826 29881 29823 62311 23430 0360 23412 29888
0%
2%
4%
6%
8%
10%
12%
14%
16%
18%
20%
22%
Procedure Code
Pe
rce
nt
Sh
are
of
Am
bu
lato
ry S
ug
ica
l Ce
nte
r P
aym
en
ts
23
NEW HAMPSHIRE
Charts 18 through 21 go into greater detail on payments for prescription drugs reported with a national drug code (NDC). Payments are categorized as drugs if the procedure code
reported on the transaction is an NDC. Payments for drugs can also be reported using procedure codes other than NDC codes, such as revenue codes, healthcare common
procedure coding system (HCPCS), and other state-specific procedure codes. The results in these charts are based only on payments reported with an NDC code.
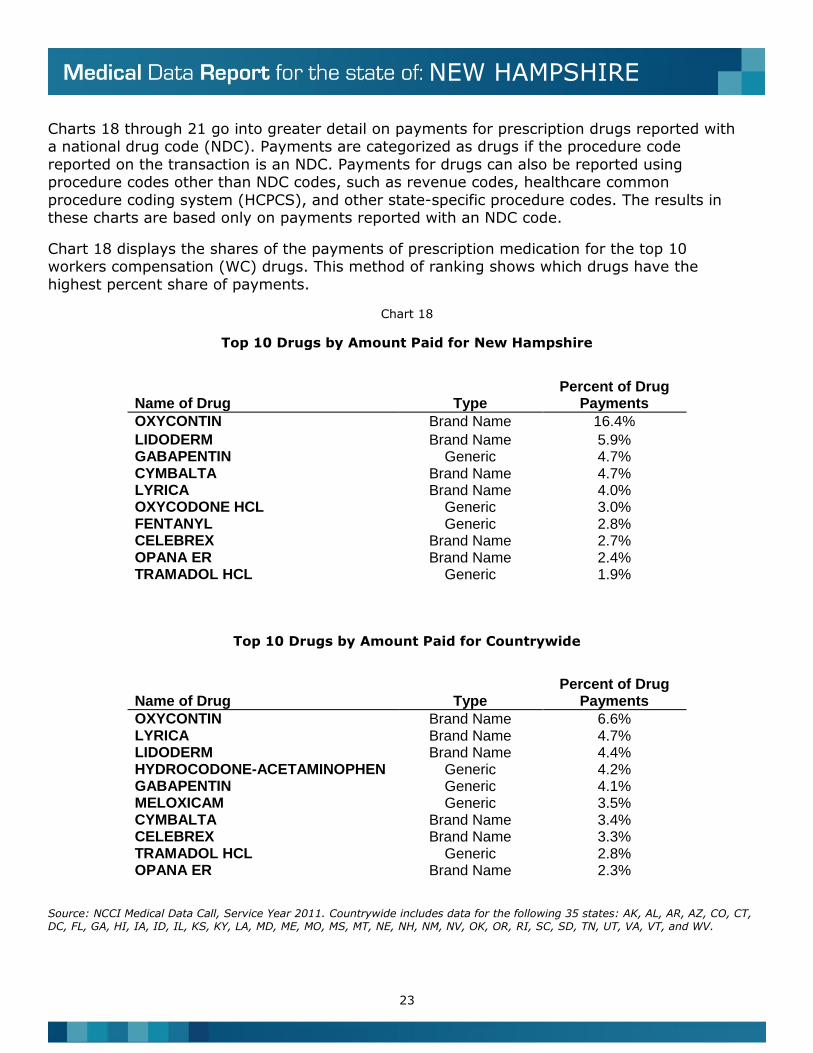
Chart 18 displays the shares of the payments of prescription medication for the top 10 workers compensation (WC) drugs. This method of ranking shows which drugs have the
highest percent share of payments.
Chart 18
Top 10 Drugs by Amount Paid for New Hampshire
Name of Drug Type Percent of Drug
Payments
OXYCONTIN Brand Name 16.4%
LIDODERM Brand Name 5.9% GABAPENTIN Generic 4.7% CYMBALTA Brand Name 4.7% LYRICA Brand Name 4.0% OXYCODONE HCL Generic 3.0% FENTANYL Generic 2.8% CELEBREX Brand Name 2.7% OPANA ER Brand Name 2.4% TRAMADOL HCL Generic 1.9%
Top 10 Drugs by Amount Paid for Countrywide
Name of Drug Type Percent of Drug
Payments
OXYCONTIN Brand Name 6.6% LYRICA Brand Name 4.7% LIDODERM Brand Name 4.4% HYDROCODONE-ACETAMINOPHEN Generic 4.2% GABAPENTIN Generic 4.1% MELOXICAM Generic 3.5% CYMBALTA Brand Name 3.4% CELEBREX Brand Name 3.3% TRAMADOL HCL Generic 2.8% OPANA ER Brand Name 2.3%
Source: NCCI Medical Data Call, Service Year 2011. Countrywide includes data for the following 35 states: AK, AL, AR, AZ, CO, CT, DC, FL, GA, HI, IA, ID, IL, KS, KY, LA, MD, ME, MO, MS, MT, NE, NH, NM, NV, OK, OR, RI, SC, SD, TN, UT, VA, VT, and WV.
24
NEW HAMPSHIRE
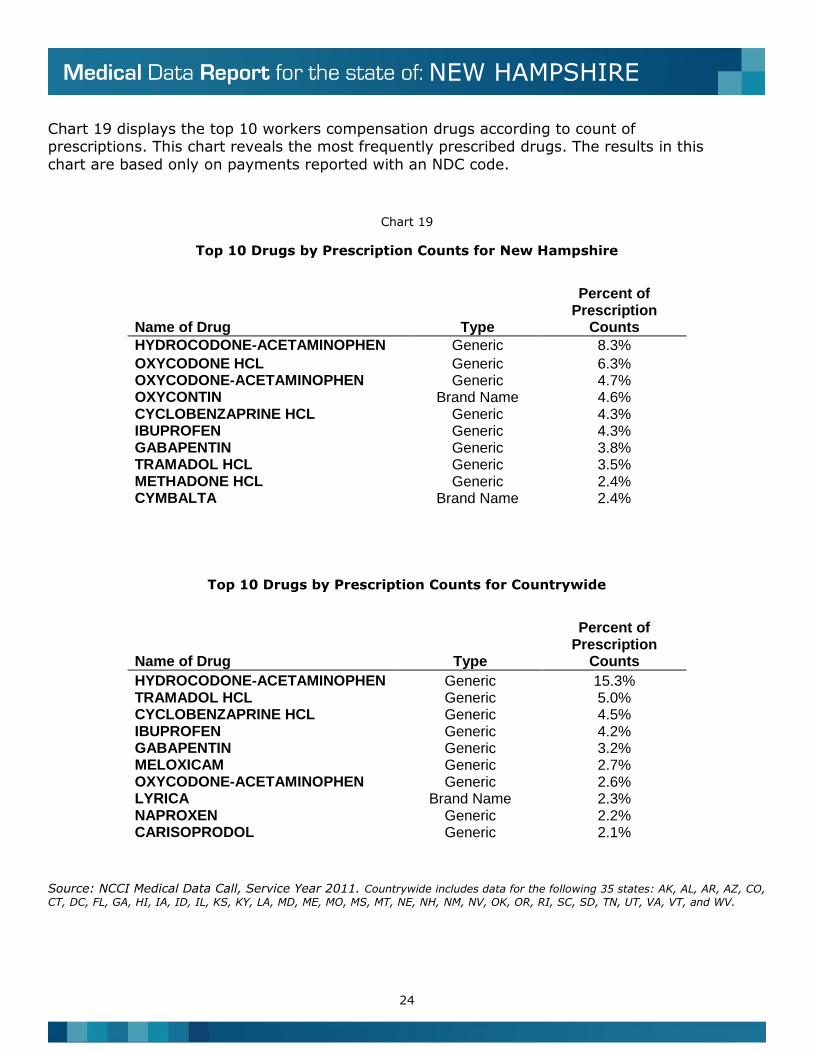
Chart 19 displays the top 10 workers compensation drugs according to count of prescriptions. This chart reveals the most frequently prescribed drugs. The results in this
chart are based only on payments reported with an NDC code.
Chart 19
Top 10 Drugs by Prescription Counts for New Hampshire
Name of Drug Type
Percent of Prescription
Counts
HYDROCODONE-ACETAMINOPHEN Generic 8.3%
OXYCODONE HCL Generic 6.3% OXYCODONE-ACETAMINOPHEN Generic 4.7% OXYCONTIN Brand Name 4.6% CYCLOBENZAPRINE HCL Generic 4.3% IBUPROFEN Generic 4.3% GABAPENTIN Generic 3.8% TRAMADOL HCL Generic 3.5% METHADONE HCL Generic 2.4% CYMBALTA Brand Name 2.4%
Top 10 Drugs by Prescription Counts for Countrywide
Name of Drug Type
Percent of Prescription
Counts
HYDROCODONE-ACETAMINOPHEN Generic 15.3% TRAMADOL HCL Generic 5.0% CYCLOBENZAPRINE HCL Generic 4.5% IBUPROFEN Generic 4.2% GABAPENTIN Generic 3.2% MELOXICAM Generic 2.7% OXYCODONE-ACETAMINOPHEN Generic 2.6% LYRICA Brand Name 2.3% NAPROXEN Generic 2.2% CARISOPRODOL Generic 2.1%
Source: NCCI Medical Data Call, Service Year 2011. Countrywide includes data for the following 35 states: AK, AL, AR, AZ, CO,
CT, DC, FL, GA, HI, IA, ID, IL, KS, KY, LA, MD, ME, MO, MS, MT, NE, NH, NM, NV, OK, OR, RI, SC, SD, TN, UT, VA, VT, and WV.
25
NEW HAMPSHIRE
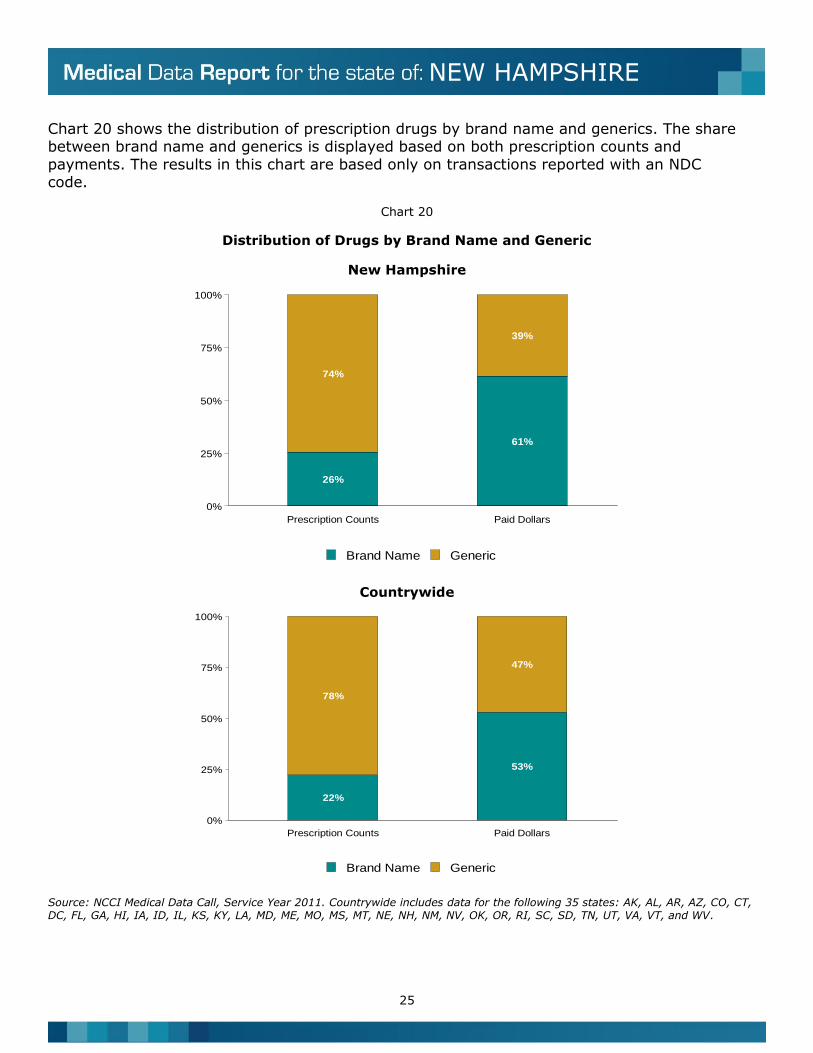
Chart 20 shows the distribution of prescription drugs by brand name and generics. The share between brand name and generics is displayed based on both prescription counts and
payments. The results in this chart are based only on transactions reported with an NDC code.
Chart 20
Distribution of Drugs by Brand Name and Generic
New Hampshire
Countrywide
Source: NCCI Medical Data Call, Service Year 2011. Countrywide includes data for the following 35 states: AK, AL, AR, AZ, CO, CT, DC, FL, GA, HI, IA, ID, IL, KS, KY, LA, MD, ME, MO, MS, MT, NE, NH, NM, NV, OK, OR, RI, SC, SD, TN, UT, VA, VT, and WV.
Prescription Counts Paid Dollars
0%
25%
50%
75%
100%
26%
74%
61%
39%
Brand Name Generic
Prescription Counts Paid Dollars
0%
25%
50%
75%
100%
22%
78%
53%
47%
Brand Name Generic
26
NEW HAMPSHIRE
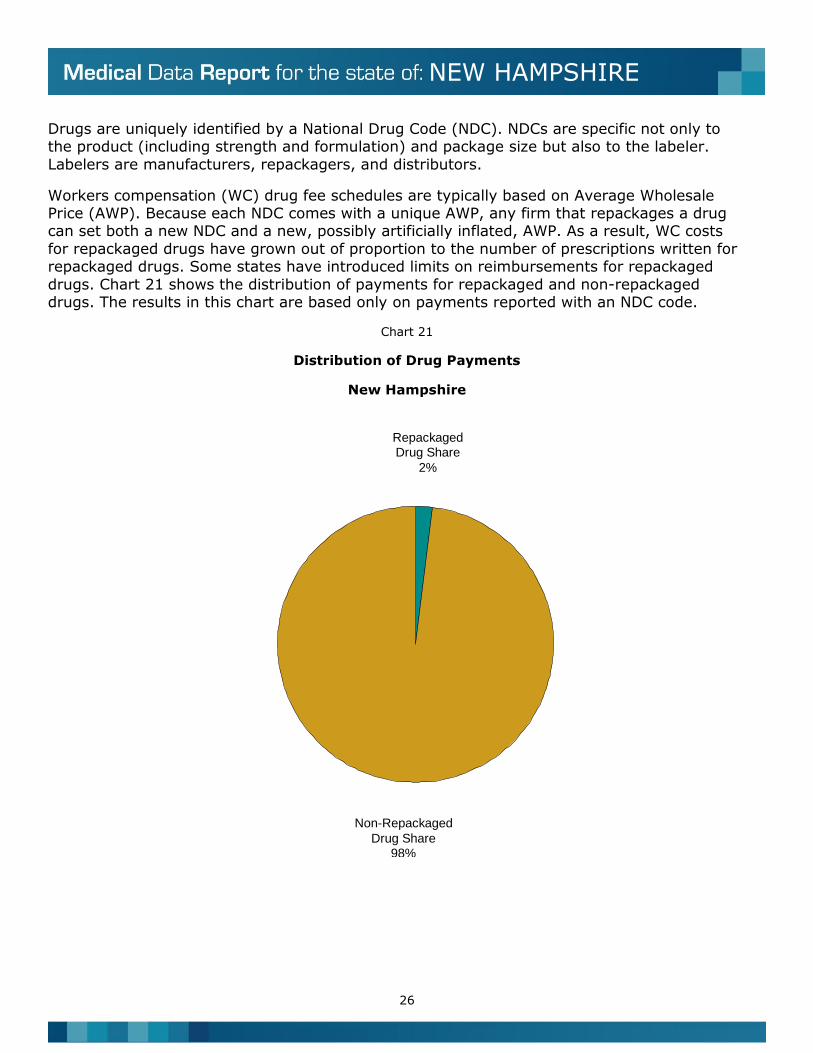
Drugs are uniquely identified by a National Drug Code (NDC). NDCs are specific not only to the product (including strength and formulation) and package size but also to the labeler.
Labelers are manufacturers, repackagers, and distributors.
Workers compensation (WC) drug fee schedules are typically based on Average Wholesale Price (AWP). Because each NDC comes with a unique AWP, any firm that repackages a drug can set both a new NDC and a new, possibly artificially inflated, AWP. As a result, WC costs
for repackaged drugs have grown out of proportion to the number of prescriptions written for repackaged drugs. Some states have introduced limits on reimbursements for repackaged
drugs. Chart 21 shows the distribution of payments for repackaged and non-repackaged drugs. The results in this chart are based only on payments reported with an NDC code.
Chart 21
Distribution of Drug Payments
New Hampshire
RepackagedDrug Share
2%
Non-Repackaged
Drug Share
98%
27
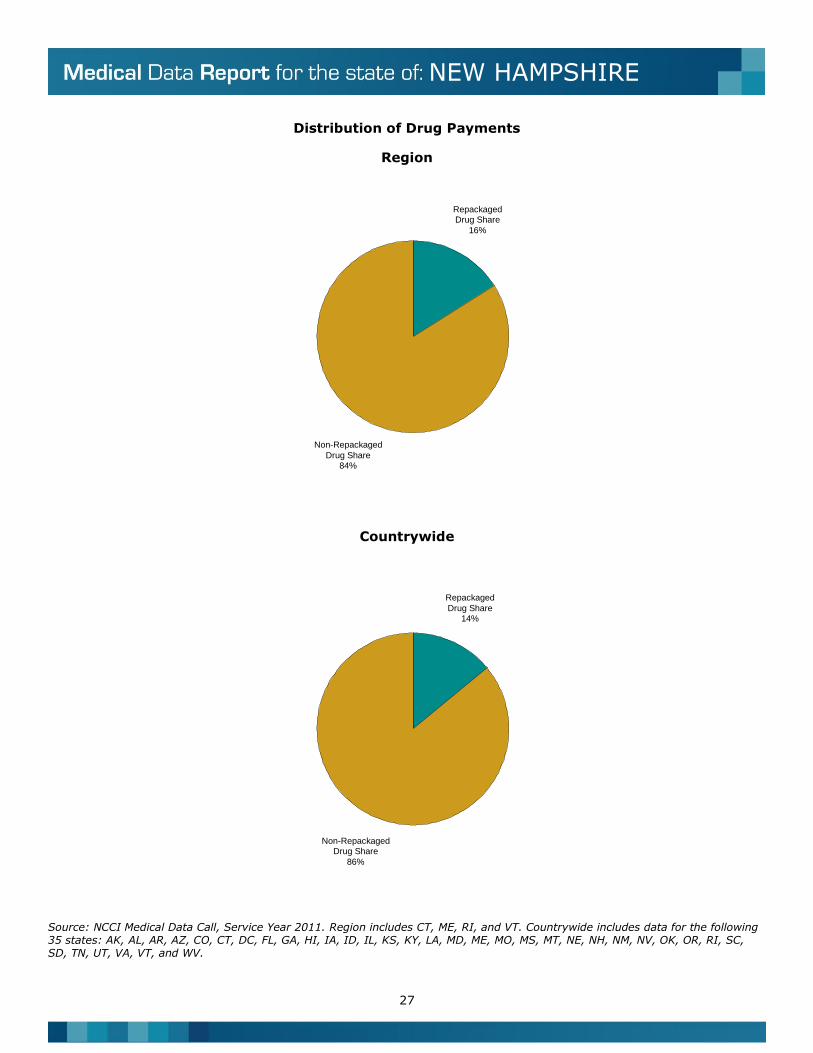
NEW HAMPSHIRE
Distribution of Drug Payments
Region
Countrywide
Source: NCCI Medical Data Call, Service Year 2011. Region includes CT, ME, RI, and VT. Countrywide includes data for the following 35 states: AK, AL, AR, AZ, CO, CT, DC, FL, GA, HI, IA, ID, IL, KS, KY, LA, MD, ME, MO, MS, MT, NE, NH, NM, NV, OK, OR, RI, SC, SD, TN, UT, VA, VT, and WV.
RepackagedDrug Share
16%
Non-Repackaged
Drug Share84%
Repackaged
Drug Share
14%
Non-RepackagedDrug Share
86%
28
NEW HAMPSHIRE
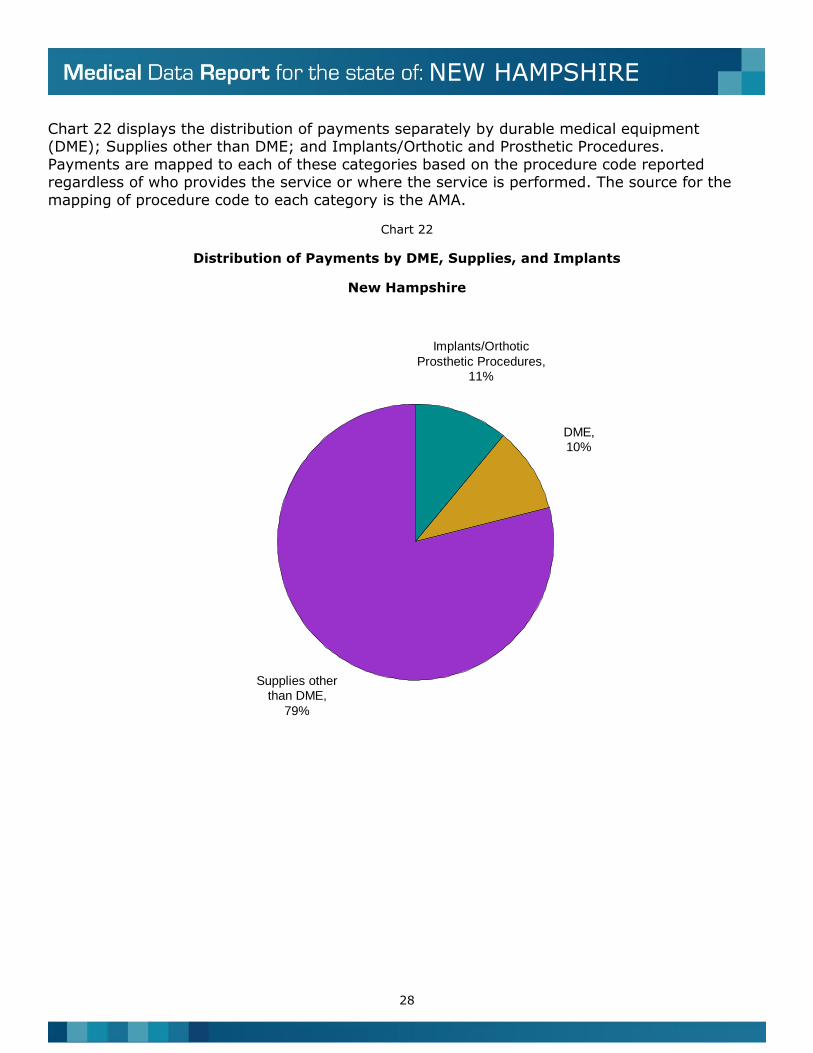
Chart 22 displays the distribution of payments separately by durable medical equipment (DME); Supplies other than DME; and Implants/Orthotic and Prosthetic Procedures.
Payments are mapped to each of these categories based on the procedure code reported regardless of who provides the service or where the service is performed. The source for the
mapping of procedure code to each category is the AMA.
Chart 22
Distribution of Payments by DME, Supplies, and Implants
New Hampshire
Implants/Orthotic
Prosthetic Procedures,11%
DME,10%
Supplies otherthan DME,
79%
29
NEW HAMPSHIRE
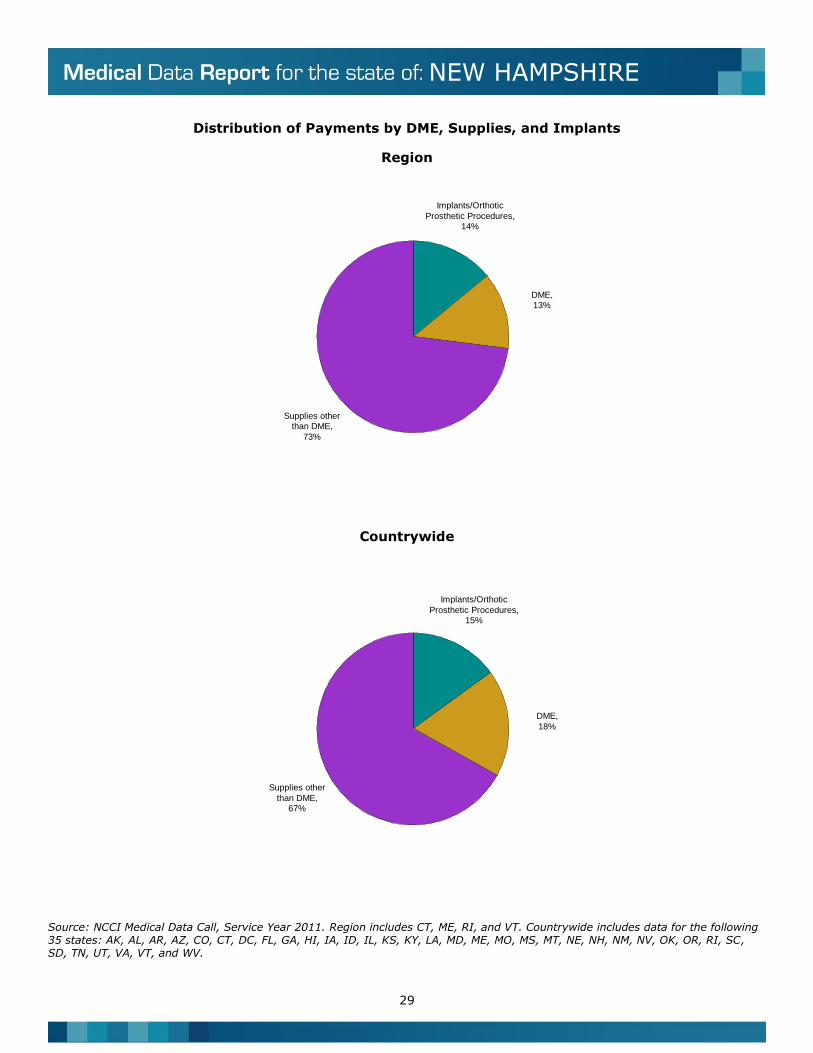
Distribution of Payments by DME, Supplies, and Implants
Region
Countrywide
Source: NCCI Medical Data Call, Service Year 2011. Region includes CT, ME, RI, and VT. Countrywide includes data for the following 35 states: AK, AL, AR, AZ, CO, CT, DC, FL, GA, HI, IA, ID, IL, KS, KY, LA, MD, ME, MO, MS, MT, NE, NH, NM, NV, OK, OR, RI, SC, SD, TN, UT, VA, VT, and WV.
Implants/Orthotic
Prosthetic Procedures,
14%
DME,13%
Supplies otherthan DME,
73%
Implants/Orthotic
Prosthetic Procedures,15%
DME,
18%
Supplies other
than DME,67%
30
NEW HAMPSHIRE
Glossary
Accident Year: A loss accounting definition in which experience is summarized by the calendar year in which an
accident occurred.
Ambulatory Payment Classification (APC): Unit of payment under Medicare’s Outpatient Prospective Payment System (OPPS) for hospital outpatient services where individual services are grouped based on similar characteristics
and similar costs.
Ambulatory Surgical Center (ASC): A state-licensed facility that is used mainly to perform outpatient surgery, has a staff of physicians, has continuous physician and nursing care, and does not provide for overnight stays. An ambulatory surgical center can bill for facility fees much like a hospital, but generally has a separate fee schedule.
Current Procedure Terminology (CPT): A numeric coding system maintained by the American Medical Association (AMA). The CPT coding system consists of 5 digit codes that are primarily used to identify medical services and
procedures performed by physicians and other healthcare professionals.
Diagnosis Related Groups (DRG): A system of hospital payment classification which groups patients with similar clinical problems that are expected to require similar amounts of hospital resources.
Drugs: Includes any data reported by a National Drug Code (NDC). Also included are data for revenue codes, Healthcare Common Procedure Code System (HCPCS), and other state-specific codes that represent drugs.
Durable Medical Equipment (DME): Equipment that is primarily and customarily used to serve a medical purpose, can withstand repeated use, could normally be rented and used by successive patients, is appropriate for use in the home, and not generally useful to a person in the absence of an illness or injury.
Inpatient Hospital Service: Services for a patient who is admitted to a hospital for treatment that requires at least one overnight stay (more than 24 hours in a hospital).
Medical Data Call: Captures transaction level detail for medical billings that were processed on or after July 1, 2010. All medical transactions with the jurisdiction state in any applicable Medical Data Call state are reportable. This
includes all workers compensation claims, including medical-only claims.
Outpatient Hospital Service: Any type of medical or surgical care performed at a hospital that is not expected to result in an overnight hospital stay (less than 24 hours in a hospital).
Revenue Code: A numeric coding system used in hospital billings that provides broad classifications of the type of service that was provided. Some examples are emergency room, operating room, recovery room, room and board, supplies, etc.
Service Year: A loss accounting definition in which experience is summarized by the calendar year in which the
medical service was provided.
Transaction: A line item of a medical bill.
31
NEW HAMPSHIRE
APPENDIX
The data contained in this report represents medical transactions for Service Year 2011 (medical services delivered from January 1, 2011 to December 31, 2011). Insurance carriers must report
paid medical transactions if they write at least 1% of the market share in any one state for which NCCI is the advisory organization. Once a carrier meets the eligibility criteria, the carrier
will be required to report for all applicable states in which it writes, even if an individual state’s market share is below the threshold. All carriers within a group are required to report, regardless if they write less than 1% of the market share in the state.
The data is reported under the jurisdiction state; this is the state under whose Workers
Compensation Act the claimant's benefits are being paid. Medical transactions must continue to be reported until the transactions no longer occur (i.e., the claim is closed) or 30 years from the accident date. There are nearly 30 data elements reported.
Wherever possible, standard industry codes are used because they provide a clear definition of
the data, increase efficiency of computer systems, and improve the accuracy and quality of the data.
Carriers differ in their handling of medical data reporting. Some carriers retain all medical claims handling internally and submit the data themselves. Others use business partners for various
aspects of medical claim handling, such as third party administrators, medical bill review vendors, etc. It is possible for a carrier to authorize its vendor to report the data on its behalf. Some carriers may use a combination of direct reporting and using vendors. Although data may
have been provided by an authorized vendor on behalf of a carrier, the quality, timeliness, and completeness of the data is the responsibility of the carrier.
Before a medical data provider can send files, each submitter’s electronic data file must pass certification testing. This ensures that all connections, data files, and systems are functioning
and processing correctly. Each medical data provider within a reporting group is required to pass certification testing. If a medical data provider reports data for more than one reporting group, that data must be certified for each group.
For more information about the Medical Data Call, please refer to the Medical Data Call
Reporting Guidebook on ncci.com.
© 2013 National Council on Compensation Insurance, Inc. All Rights Reserved.
This report may be used on a noncommercial basis for reference and informational purposes.