Embed Size (px)
Citation preview

0
Indiana Department of Environmental Management
2017 Recycling Activity Summary
Overview of 2017 data reported by municipal solid waste recyclers required
to report recycling activities to meet the 50 percent recycling goal mandated
by the Indiana legislature.
Office of Program Support INDIANA DEPARTMENT OF ENVIRONMENTAL MANAGEMENT
November 1, 2018

1
Table of Contents
Terms and reporting requirements………………………………….….2
Reporting method/data collection……….………………….………….3
Reporting results................................................................................3
Reviewing recycling numbers and MSW recycling rate……………..5
Discussion of results………………………………………….…………8
Reporting challenges …………………………………………………..10
Conclusion….……………………………………………………………11
Appendix………………………………………………………………..……12

2
2017 Recycling Activity Summary
The Recycling Activity Summary provides information collected from municipal solid waste (MSW)
recyclers. The recyclers are legislatively required to report recycling activities under IC 13-20-25.
The Indiana Department of Environmental Management (IDEM) provides the report to fulfill its
requirement to report and provide an overview of 2017 state recycling data results. In the report,
IDEM also evaluates Indiana’s progress in achieving a 50 percent recycling goal.
The recycling rate for Indiana in 2017 increased slightly to 16.8%. The total MSW recovered for
recycling and compost was 1,379,619 tons, which was up by 107,174 tons from 2016. Waste
disposal also increased by 481,395 tons for a total of 6.8 million tons. Specifically, total reported
shipments of recyclables from Recycling Activity Reports were 933,524 tons, a slight increase
from last year as summarized in TABLE 6, on page 8.
Terms and reporting requirements
The MSW stream results from the operation of residential, municipal, commercial, or industrial
establishments and community activities.
IC 13-11-2-133 states:
“…municipal waste means any garbage, refuse, industrial lunchroom or office waste, and other similar material resulting from the operation of residential, municipal, commercial, or institutional establishments and community activities.”
Therefore, recycling is the recovery of recyclable materials from the MSW stream (garbage,
refuse, industrial lunchroom waste, office waste, or other similar material) for use or reuse,
conversion into raw materials, or for use in the production of new products.
A recycler is defined as the owner or operator of a facility where recycling may occur, including a
landfill, an incinerator, a material recovery facility (MRF) or a solid waste management district. A
recycler is also defined as a recyclable materials broker who arranges the collection,
transportation, delivery, recycling or reuse of recyclable materials.
Recyclers must report, in tons, the types of recyclable material from Indiana origins that it ships
to in-state recycler facilities, in-state manufacturers/end users, or out-of-state destinations. IC
13-20-25 requires reporting the following types of recyclable materials:
1) Glass
2) Metal, including white goods (ferrous)
3) Metal (non-ferrous)
4) Paper and cardboard (all grades)
5) Plastic and plastic products
6) Single stream recyclable materials, and
7) Any other distinct type of recyclable material not specified in 1) through 6).
Recycling activities are required to be reported to IDEM during a calendar year (January 1 –
December 31), either on an annual basis or on a quarterly basis. Recyclers must submit reports

3
for each facility owned or operated by the recycler where they conduct recycling activities.
Persons managing wastes not defined as municipal, such as those involved in automotive scrap
metal processing, automotive salvage, or industrial wastes, are not required to report recycling of
these wastes but may do so voluntarily. IDEM has included in this summary a review of all
materials reported, but does not count recycling of non-MSW materials towards the 50 percent
recycling goal.
The next section discusses the collection method of the information and the data reported.
Reporting method/data collection
The information recyclers are required to report includes:
1) Name and location of the recycler's establishment
2) Principal business activity conducted
3) Type of operation
4) Type of materials, including: glass, metal, paper, plastic, single stream (mixed), and other
5) Quantity, in tons, for each type of recyclable that was transported from the reporting
recycler’s establishment, or in the case of a recycler who is a broker, the amount of
materials transported or delivered by arrangement of the recycler, and
6) Where the material was transported, which would include shipments to other in-state
recycler facilities, or persons in Indiana that use the raw materials or reuse the product
without further recycling, and out-of-state shipments.
Recyclers submit reports through IDEM’s Solid Waste and Recycling Data Reporting Program, a
web-based materials management system for aggregating data. Facility registrations are
categorized by organization type for IDEM administration purposes. Organization types include
landfill, transfer station, waste-to-energy plant, composting facility, processing facility, waste tire
facility or recycler facility. The latter organization type is for facilities not included in the other
categories.
Reporting results
IDEM received recycling activity reports from 140 Indiana facilities who handled shipments of
recyclables. The facilities are grouped by registration type and principal business activity, as
shown in TABLE 1 and TABLE 2, respectively. The report tracked shipments of recyclables sent
to destination categories, as defined:
1) Recycler Facility - This refers to a recycling facility such as a MRF with intermediate
consolidating, sorting, shredding, or baling operations. The reporting included the
location of the receiving recycler facility (name/city/state).
2) Broker - This refers to shipments transported through a broker to final destinations. The
reporting included the principal address of the broker (name/city/state).
3) Manufacturer/end user - This refers to a production facility of basic products that used
the recyclables as a raw material without further offsite recycling. Examples included
glass container mills, foundries, steel mini-mills, smelting and refining operations, plastic
processors for flake and pellets, and pulp and paper mills. Reporting included the
location of the receiving manufacturer/end user (state or foreign country).

4
TABLE 1: Number of Indiana Facilities Submitting Recycling Activity Reports by
Registration Type
Registration Type Number of Facilities Submitting Reports
Recycler Facility 76
Transfer Station 37
Compost Facility 14
Landfill 8
Waste-to-Energy Plant (Incinerator) 1
Processing Facility 2
Waste Tire Facility 2
Total 140
TABLE 2: Number of Indiana Facilities Submitting Recycling Activity
Reports by Principal Business Activity
Principal Business Activity Number of Facilities Submitting Reports Solid Waste Management Company 49
Solid Waste Management District / Government
74
Business 15
Not-for-Profit 1
College / University 1
Brokers 0
Total 140
The shipments of recyclables (tons) by material type and destination are given in TABLE 3.
Compost and e-waste are not listed since their recycling amounts are given in separate reports
(see TABLE 5). The category of “Other” measures any other distinct type of recyclable material
from MSW. The largest portion of this category was made up of wood waste, which may be used
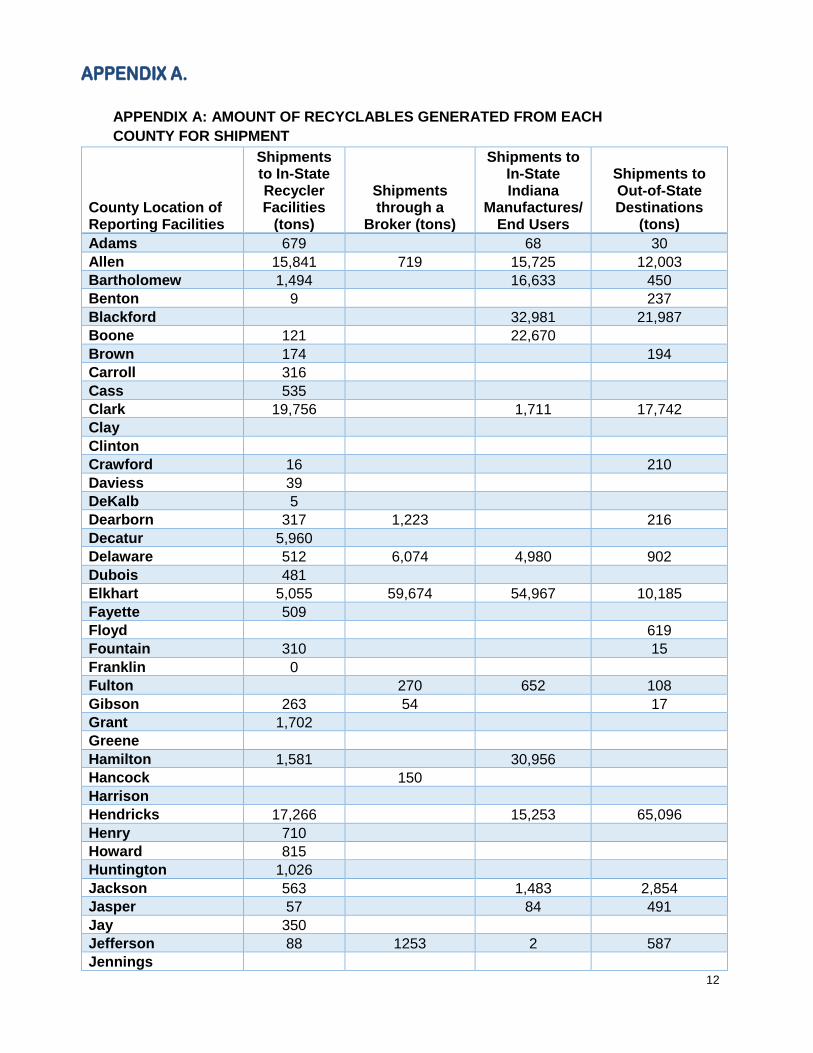
for mulch or animal bedding. Appendix A provides a detailed breakdown of the amount of MSW
recyclables generated for shipment.
TABLE 3: Shipments of Recyclables by Material Type and Destination
MATERIAL TYPE
SHIPMENTS OF RECYCLABLES BY DESTINATION In-State Recycler Facilities (Tons)
Broker Arranged Shipments (Tons)
In-State Manufacturers / End Users (Tons)
Out-of-State Destinations (Tons)
Glass 5,921 9,973 34,612 25,950
Metal, including white goods (ferrous) 26,651 339 357 905
Metal (non-ferrous) 2,413 123 150 2,484
Paper and cardboard (all grades) 30,590 147,597 214,462 123,549
Plastic 4,274 3,421 5,054 11,605
Single Stream/Mixed 78,358 8,927 7,483 119,637
Other 56,413 388 187,519 28,989
Total 204,620 170,768 449,637 313,119
Non-MSW Materials 31,587 1,625 33,154 4,362
Grand Total 236,207 172,393 482,791 317,481
An additional category of recycling from non-MSW (per statute) is listed as “Non-MSW Materials,”

5
in TABLE 3. It allows registrants to voluntarily record amounts of other recyclable materials from
non-municipal solid waste, such as scrap metal and aggregate from construction and demolition
(C&D) debris, auto bodies, and non-hazardous industrial materials. The reported amounts
consist mainly of aggregates.
The next section analyzes only the MSW recycling data to determine compliance with Indiana’s
50 percent recycling goal. Reported shipments of recyclables to in-state recycler facilities in
TABLE 3 are excluded from the recycling rate measurement since the tonnage amounts also are
required to be reported by the receiving facilities that sorts and bales the recyclables for
shipment to end use markets. However, they help IDEM understand community collection efforts
for curbside and drop-off sites.
Reviewing recycling numbers and MSW recycling rate Double counting of recyclables is avoided by only including recyclables with shipment
destinations as shown in TABLE 4. In 2017, the total amount of MSW recyclables reported was
933,524 tons.
TABLE 4: Shipments of Recyclables by Material Type and Destination
MATERIAL TYPE (MSW only)
SHIPMENTS OF RECYCLABLES BY DESTINATION
Broker Arranged Shipments (Tons)
In-State Manufacturers / End Users (Tons)
Out-of-State Destinations (Tons)
Total (Tons)
Glass 9,973 34,612
969
25,950 70,535
Metal, including white goods (ferrous) 339 357 905 1,601
Metal (non-ferrous) 123 150 2,484 2,757
Paper and cardboard (all grades) 147,597 214,462 123,549 485,608
Plastic and plastic products 3,421 5,054 11,605 20,080
Single Stream/Mixed 8,927 7,483 119,637 136,047
Other 388 187,519 28,989 216,896
Total 170,768 449,637 313,119 933,524
Specifically:
The Broker Arranged Shipments category allows recycler facilities to report
transactions with a broker.
Shipments of recyclables to in-state manufacturers/end users helps to discern
circular economy benefits and recycling markets.
Out-of-state destinations only include shipments sent to recycler facilities and/or
manufacturers/end users.

6
Shipments by material types alone are shown in Figure 1 and Figure 2 for recyclables recovered from the MSW stream.
Figure 1: Shipments of Recyclables by Material Type (Tons)
485,608
216,896
136,047
70,535
20,080
2,757
1,601
0 100,000 200,000 300,000 400,000 500,000 600,000
Paper and cardboard
Other
Single Stream/Mixed
Glass
Plastic
Metal (non-ferrous)
Metal (ferrous)
Tons
2017 Shipments of Recyclables by Material Type (MSW only)
Looking at the MSW recycling data from the Recycling Activity Reports, 52 percent of the tonnage consisted of paper/cardboard, 23 percent was other, including wood waste, and 15 percent was single stream (mixed) recyclables. The least amount of tonnage included metal (both ferrous and non-ferrous), plastic, and glass, which accounted for about ten percent of the recyclable materials shipped. Figure 2: Percentage of Recyclables Shipments by Material Type

7
A recycling rate can be calculated to determine how Indiana is meeting its recycling goal by
estimating the overall MSW generated against the materials reported as recyclable.1 The
measurement standard established by the U.S. Environmental Protection Agency (U.S. EPA)
is:
Recycling Rate (%) = MSW Recovered for Recycling and Composting (tons) / MSW
Generation (tons) x 100
The MSW generation is the sum of tonnage amounts as reported in TABLE 5 for each of the
waste management classifications. Tonnage estimates from Indiana origins are given with
supporting data references.
TABLE 5: Indiana MSW Generation and Classification (2017)
Classification Tons Data Reference
Disposal through Landfilling (in-state) 5,941,080
The data are aggregated from IDEM Solid Waste Land Disposal Facility reports. This is the total amount of MSW from Indiana origins received at in-state landfills for disposal. It does not include non- hazardous industrial process wastes, and construction and demolition (C&D) debris.
Disposal through Landfilling (out-of-state) 499,967
This amount was estimated from Indiana exports of MSW as reported by neighboring states. Other supporting data included Solid Waste Processing Facility reports of waste sent for disposal at out-of-state landfills from Indiana transfer stations as well as direct haul reports for solid waste to out-of-state destinations.
Energy from Waste 398,196
The data are aggregated from Solid Waste Processing Facility reports. This is the total amount of MSW from Indiana origins received at the Indianapolis Resource Recovery facility for disposal. It does not include non-hazardous industrial process wastes, and C&D debris.
Recycling 933,524
The data are aggregated from Recycling Activity Reports. This is the total amount of recyclables from MSW as reported by shipments to (a) in-state manufactures/end users, (b) out-of-state destinations, and (c) arranged through brokers.
Composting 412,446
The data are aggregated from Registered Composting Facility Reports. This is the total estimated amount of waste received at Indiana compost facilities including yard trimmings, food waste, and other organic materials. It does not include wood waste processed into mulch.
E-waste Recycling 33,649
The data are aggregated from IDEM, Electronics Recycling Annual Report and E-Cycle Collector/Recycler Registration reports. The data is for all types of e-waste including covered electronic devices for Indiana’s E-Cycle program. Total shipments are tracked by destination categories.
Total 8,218,862
1 Standardized definitions for determining a recycling rate are described in the U.S. EPA publication, “Measuring Recycling: A Guide for State
and Local Governments (http://nepis.epa.gov/Exe/ZyPURL.cgi?Dockey=100011CF.txt) or (http://infohouse.p2ric.org/ref/01/00801/). Also, EPA’s
most recent report, “Advancing Sustainable Materials Management: 2015 Fact Sheet,” gives national statistics for MSW generation, recycling,
and disposal (https://www.epa.gov/sites/production/files/2018-07/documents/2015_smm_msw_factsheet_07242018_fnl_508_002.pdf).

8
In addition to the Recycling Activity Reports, information was reviewed from other IDEM reports as submitted through IDEM’s Solid Waste and Recycling Data Reporting Program to calculate the MSW generation. These include:
1) Solid Waste Land Disposal Facility Report
2) Solid Waste Processing Facility Report
3) Registered Composting Facility Report
4) Electronics Recycling Annual Report and E-cycle Collector / Recycler Registration (E-waste)
5) Annual Tire Report
The total recycled is the sum of recycling, compost, and e-waste amounts listed in TABLE 5. With this in mind, the calculation is made accordingly:
MSW Recovered for Recycling and Composting
= 933,524 + 412,446 + 33,649 = 1,379,619 tons
The 2017 Indiana Recycling Rate then is calculated as:
(1,379,619 tons / 8,218,862 tons) x 100 = 16.8%
Discussion of results
Indiana’s 2017 recycling rate was 16.8 percent, slightly higher than last year. The total of MSW recovered for recycling and compost was 1,379,619 tons, up by 107,174 tons but waste disposal was higher by 481,395 tons for a total of 6.8 million tons. Specifically, total reported shipments of recyclables from Recycling Activity Reports were 933,524 tons, a slight increase from last year as summarized in TABLE 6 and Figures 3 and 4. TABLE 6: Shipments of Recyclables by Material Type and Year
Material Type (MSW only) 2015 (Tons)
2016 (Tons)
2017 (Tons)
Glass 6,432 16,936 70,535
Metal, including white goods (ferrous) 3,379 1,518 1,601
Metal (non-ferrous) 3,479 2,794 2,757
Paper and cardboard (all grades) 192,838 628,494 485,608
Plastic and plastic products 15,002 18,552 20,080
Single Stream/Mixed 84,968 69,510 136,047
Other 161,220 161,924 216,896
Total 467,318 899,728 933,524

9
Figure 3: Shipments of Recyclables by Material Type and Year
Figure 4: Total Amount of Recyclables by Year (2015-2017)

10
Reporting highlights include:
Glass shipments were up by 53,599 tons from 2016. This is mainly as a result of new first-time reporting by glass recycler facilities.
Paper and cardboard tonnage was down by 142,886 tons from 2016. Part of the decrease was due to non-reporting from facilities that had shipments last year.
The number of reporting facilities was 140, which included four first-time reports from facilities. Reporting facilities with no shipments of recyclables are excluded.
Single stream/Mixed amounts are up from 2016 with higher shipments to out-of-state destinations for processing. It also reflects an increase of community curb-side collection.
The “Other” category of Recycling Activity Reports consists mainly of wood waste for mulch and animal bedding markets. It does not include compost shipments. The increase of 54,972 tons includes new first-time reporting by facilities.
Recycled metal amounts from MSW are low. Additional outreach is needed for scrap metal processors to report tonnages of scrap from MSW. Per statute, these type of facilities are not required to submit recycling reports.
Out-of-state waste disposal of MSW was higher than 2016. Tonnage amounts from direct hauls were included this year.
Reporting challenges
The most difficult step of determining the success of recycling is identifying the universe of
companies and materials. IDEM began building a user friendly data system for customers in
2015. Challenges included getting familiar with the on-line reporting system and getting the word
out to recyclers, communities, and the solid waste management industry as a whole about
Indiana’s measurement approach and mandatory reporting requirements for recyclables.
While waste disposal is a one-stop solution for materials management, recycling offers circular
economy benefits with more jobs, conservation of resources, and less pollution. Recycling rate
measurements are integral to solid waste planning and are supported by the solid waste industry 2.
Important parameters include:
The reporting methodology needs to be clearly defined and transparent. It serves as a
basis for a more detailed analysis of the data.
Continued efforts are needed to highlight Indiana’s strong manufacturing base for use of
recyclables and economic benefits. This includes steel production, pulp and paper mills,
glass container mills, fiberglass production, and plastic processors.
IDEM messaging and education, policy directives, and incentives are supportive of
recycling activities and require baseline metrics to track progress.
Business and community leaders should encourage recyclers to be compliant with the
reporting requirements. The recycling data will help identify where materials are available
or where more work with recyclers needs to be done to keep commodities separate from
trash.
2 The Solid Waste Association of North America (SWANA) supports the measuring of recycling as a part of an integrated solid waste
management program. They are developing a technical policy on measuring recycling rates that follows EPA’s definitions and methodology
for a weight-based approach.

11
Conclusion
IDEM strives to provide accurate data regarding recycling and waste material management. The
reporting of actual recycling numbers by recyclers provides credibility in achieving recycling goals
and helps to determine long term infrastructure needs for sustainable materials management. The
information provided is a conservative account and as the agency continues to better understand the
recycling community, the numbers should not only increase, but help recognize recycling efforts
throughout the state.
12
APPENDIX A.
APPENDIX A: AMOUNT OF RECYCLABLES GENERATED FROM EACH
COUNTY FOR SHIPMENT
County Location of Reporting Facilities
Shipments to In-State Recycler Facilities
(tons)
Shipments through a
Broker (tons)
Shipments to In-State Indiana
Manufactures/End Users
Shipments to Out-of-State Destinations
(tons)
Adams 679 68 30
Allen 15,841 719 15,725 12,003
Bartholomew 1,494 16,633 450
Benton 9 237
Blackford 32,981 21,987
Boone 121 22,670
Brown 174 194
Carroll 316
Cass 535
Clark 19,756 1,711 17,742
Clay
Clinton
Crawford 16 210
Daviess 39
DeKalb 5
Dearborn 317 1,223 216
Decatur 5,960
Delaware 512 6,074 4,980 902
Dubois 481
Elkhart 5,055 59,674 54,967 10,185
Fayette 509
Floyd 619
Fountain 310 15
Franklin 0
Fulton 270 652 108
Gibson 263 54 17
Grant 1,702
Greene
Hamilton 1,581 30,956
Hancock 150
Harrison
Hendricks 17,266 15,253 65,096
Henry 710
Howard 815
Huntington 1,026
Jackson 563 1,483 2,854
Jasper 57 84 491
Jay 350
Jefferson 88 1253 2 587
Jennings

13
Johnson 2,410
Knox 1,094 85
Kosciusko 2,594
La Porte 8,936
Lagrange
Lake 33,079 8,548 71,006 73,067
Lawrence 234 607
Madison 3,100 7,761 207
Marion 17,772 42,883 47,111 57,123
Marshall 326
Martin 2,098
Miami 1,587
Monroe 6,740 4,360
Montgomery 9,672 13 985
Morgan 902
Newton 285
Noble
Ohio
Orange 7
Owen
Parke
Perry 103 445
Pike 108
Porter 3,756 108 120,768 24,535
Posey 73 785 101
Pulaski 122 593 199
Putnam 832
Randolph 841
Ripley
Rush 121
Scott
Shelby 1,350 2,250 3,703
Spencer 135 562 53 288
St. Joseph 14,721 2,703 5,160 2,576
Starke
Steuben 3,544
Sullivan
Switzerland
Tippecanoe 9,723 6,076
Tipton 323
Union
Vanderburgh 39 25,402 6,642 362
Vermillion
Vigo 1,567 816
Wabash 5,430
Warren 433
Warrick 886 670 25
Washington 362
Wayne 703 404

14
Wells 34 308
White 346 229 301 712
Whitley 3,149
Total 204,620 170,768 449,637 313,119
Note: The data are aggregated from Re-TRAC 2017 Recycling Activity Reports for Recyclables from municipal
solid waste (MSW). The data are aggregated by county location of each reporting facility. The amount of
recyclables is blank if the county was part of a multiple solid waste management district, had no reporting
facilities, or submitted no data.