Embed Size (px)
Citation preview
NEAR EAST UNIVERSITY
GRADUATE SCHOOL OF APPLIED SCIENCES
IDENTIFICATION OF LEUKEMIA FORMS USING
MORPHOLOGICAL FEATURES EXTRACTION AND
CELL SEGMENTATION
ESAM A. S. ALZQHOUL
MASTER THESIS
DEPARTMENT OF ELECTRICAL AND
ELECTRONIC ENGINEERING
NICOSIA 2009

ACKNOWLEDGMENT
i
ACKNOWLEDGMENT
Foremost, I would like to express my sincere gratitude to my advisor Prof. Dr. Adnan
Khashman for the continuous support of my Master’s study, for his patience, motivation,
enthusiasm, and immense knowledge. His guidance helped me in all the time of research
and writing of this thesis, and who offered me the opportunity to work in the Department
of Electrical Engineering at NEU; being a member of the ISRG Research Group (I could
not have imagined having a better advisor and mentor for my Master’s study).
In addition, I would like to thank Assist. Prof. Dr. Ozgur Ozerdem who gave me untiring
help during my study. I am also grateful to my thesis committee: Prof. Dr. Doğan İbrahim,
Prof. Dr. Rahib Abiyev, Assoc. Prof. Dr. Hasan Demirel, and Assist. Prof. Dr. Boran
Sekeroglu for their encouragement, insightful comments.
I am indebted to my many of my colleagues and friends in Jordan and Cyprus to support
me in critical times, and for all the lovely times we have had in the last two years.
I would like to show my gratitude to Mr. Kamal Almomany and my uncle Mohammad
Alzqhoul who offered me the scholarship opportunity to accomplish the Master’s Degree.
Finally, I owe special thanks to my dearest family: my parents Ali Alzqhoul and Sameerah
Alzqhoul, and my brothers Noor-Aldeen, Bayan and Aya; since without their
encouragement it would have been impossible for me to finish my work, they helped me a
lot to pass many tides during this thesis.
DEDICATION
ii
DEDICATION
This Research is dedicated to the memories of his Majesty King Hussein of the Hashemite
Kingdom of Jordan who passed away fighting against the cancer of blood leukemia. For all
patients struggling against this disease; we hope them all fast recovery and to join their
families back very soon.
DECLARATION
iii
DECLARATION
I hereby declare that all information in this document has been obtained and presented in
accordance with academic rules and ethical conduct. I also declare that, as required by
these rules and conduct, I have fully cited and referenced all material and results that are
not original to this work.
Name, Last name: Esam Alzqhoul
Signature: Esam Alzqhoul
Date: 20/12/2009
ABSTRACT
iv
ABSTRACT
The early identification of leukemia form in patients can greatly increase the likelihood of
recovery. Amongst the existing diagnostic methods are immune-phenotype and cytogenetic
abnormality, and morphological analysis which could be made by an experienced
pathologist observing blood or marrow microscope images. Diagnostic methods such as
cytogenetics and immune-phenotype require very well equipped laboratories provided with
high end technologies. Moreover, cytogenetics suffer from the long term process since
leukemic cells must grow in laboratory dishes for several weeks before their chromosomes
are ready to be viewed under the microscope. The morphological analysis based on the
manual observations of blood smears under the microscope have also undesirable
drawbacks, such as high time cost and incoherent performance accuracy since it depends
on the operator’s capabilities. However, Morphological analysis methods still have the
advantage of only requiring images not blood or marrow smears, thus making them suitable
for low-cost, fast processing, coherent performance.
This research presents an automated leukemia identification system that is morphologically
based and composed of three phases. The first phase is the segmentation of infected cell
images which provides two enhanced images for each leukemic blood cell; containing the
cytoplasm and the nuclei regions. The second phase is the morphological features
extraction module that will yield numerical quantities representing the unique extracted
features. The last phase is the identification or classification module, which involves
establishing a set of rules that will be used to achieve an efficient identification of the exact
form of leukemia with. The proposed leukemia form identification system will help and aid
the pathologist to identify the leukemia type.
v
TABLE OF CONTENTS
ACKNOWLEDGMENT…………………………………………….…..i
DEDICATION………………………………….…………………….…ii
DECLARATION………………………………………………………..iii
ABSTRACT…………….……………………………………………….iv
LIST OF TABLES……………………………………………………...ix
LIST OF FIGURES…………………………………………………......x
LIST OF SYMBOLS AND ABBREVIATIONS……………………..xii
INTRODUCTION…….…………………………………………………1
CHAPTER 1: REVIEW OF LEUKEMIA TYPES............................. 3
1.1 Overview .............................................................................................................3
1.2 Blood Cells Types in the Bone Marrow................................................................3
1.3 Main Types of leukemia.......................................................................................6
1.3.1 Acute lymphoblastic leukemia (ALL) ...........................................................6
1.3.2 Acute myeloid leukemia (AML) ...................................................................6
1.3.3 Chronic lymphocytic leukemia (CLL)...........................................................7
1.3.4 Chronic myelogenous leukemia (CML) ........................................................7
1.4 Morphological Features of Leukemia Cells ..........................................................8
1.4.1 List of the Main Morphological Features ......................................................9
1.5 Summary ...........................................................................................................13
vi
CHAPTER 2: LEUKEMIA DIAGNOSIS METHODS .....................14
2.1 Overview ...........................................................................................................14
2.2 Immune-phenotype ............................................................................................14
2.3 Cytogenetic Abnormalities.................................................................................16
2.4 Morphological Diagnosis ...................................................................................19
2.4.1 Stains..........................................................................................................20
2.4.2 Previous Works Based on Morphological Features......................................21
2.5 Summary ...........................................................................................................26
CHAPTER 3: LEUKEMIC-CELL SEGMENTATION....................27
3.1 Overview ...........................................................................................................27
3.2 General Description of the Proposed Leukemia Identifying System ...................28
3.3 Mutli Membrane Processing of a Leukemic Cell ................................................32
3.3.1 Bimodal-Threshold Selection......................................................................32
3.3.2 Cytoplasm and Nuclei Membranes Boundary Tracing.................................34
3.3.3 Eliminating Unwanted Objects and Particles...............................................39
3.3.4 Image Reconstruction of Cytoplasm and Nuclei Regions ............................40
3.4 Summary ...........................................................................................................41
CHAPTER 4: MORPHOLOGICAL FEATURE EXTRACTION ...42
4.1 Overview ...........................................................................................................42
4.2 General Description of the Morphological Feature Extraction Process. ..............43
4.2.1 Cell Diameter (DC,N ) ..................................................................................44
vii
4.2.2 Nuclei to Cytoplasm Ratio (�).....................................................................46
4.2.3 Cytoplasm Amount (Ac) .............................................................................46
4.2.4 Nuclear Shape & Regularity (α, β) ..............................................................47
4.2.5 Cytoplasmic vacuolation (VC) .....................................................................49
4.2.6 Cytoplasmic Basophilia and Coalescent (Cβ, Cα).........................................52
4.2.7 Number of Visible Nucleolus (Nγ)..............................................................55
4.3 Summary ...........................................................................................................57
CHAPTER 5: RESULTS AND THE RULES OF CLASSIFICATION..58
5.1 Overview ...........................................................................................................58
5.2 Leukemia’s Type Identifier and the Rules of Classification................................58
5.2.1 Rule One: Cell diameter (DC)......................................................................59
5.2.2 Rule Two: Nuclei to Cytoplasm ratio (�) ....................................................61
5.2.3 Rule Three: Amount of Cytoplasm (AC)......................................................62
5.2.4 Rule Four: Shape and Regularity of the Nuclei Region (β)..........................64
5.2.5 Rule Five: Ovality (α).................................................................................64
5.2.6 Rule Six: Cytoplasmic Vacuolations (VC) ...................................................65
5.2.7 Rule Seven: Cytoplasmic Basophilia (Cβ) ...................................................66
5.2.8 Rule Eight: Coalescent Existence (Cα)........................................................66
5.2.9 Rule Nine: Number of visible Nucleolus (Nγ).............................................67
5.3 The Identification Rule ......................................................................................68
5.4 Results and Discussion.......................................................................................68

viii
5.5 Comparison to the Previous Identification Systems............................................72
5.6 Summary ...........................................................................................................73
CONCLUSIONS ..................................................................................74
REFERENCES.....................................................................................77
ix
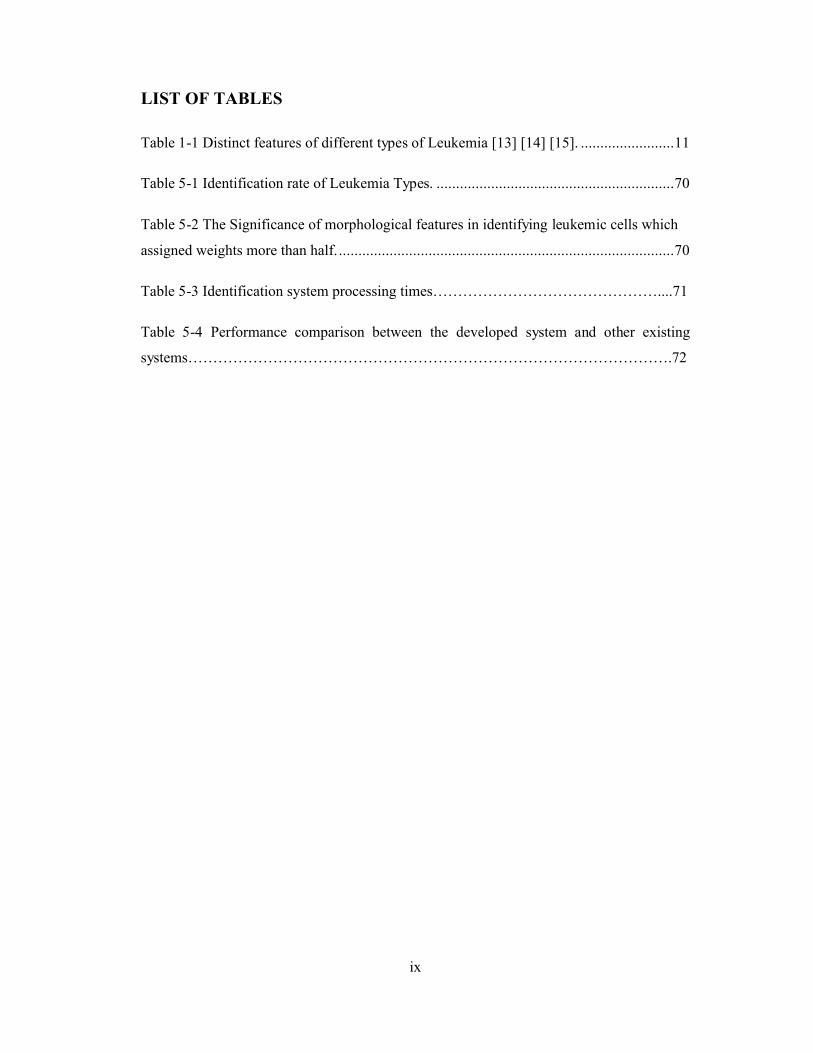
LIST OF TABLES
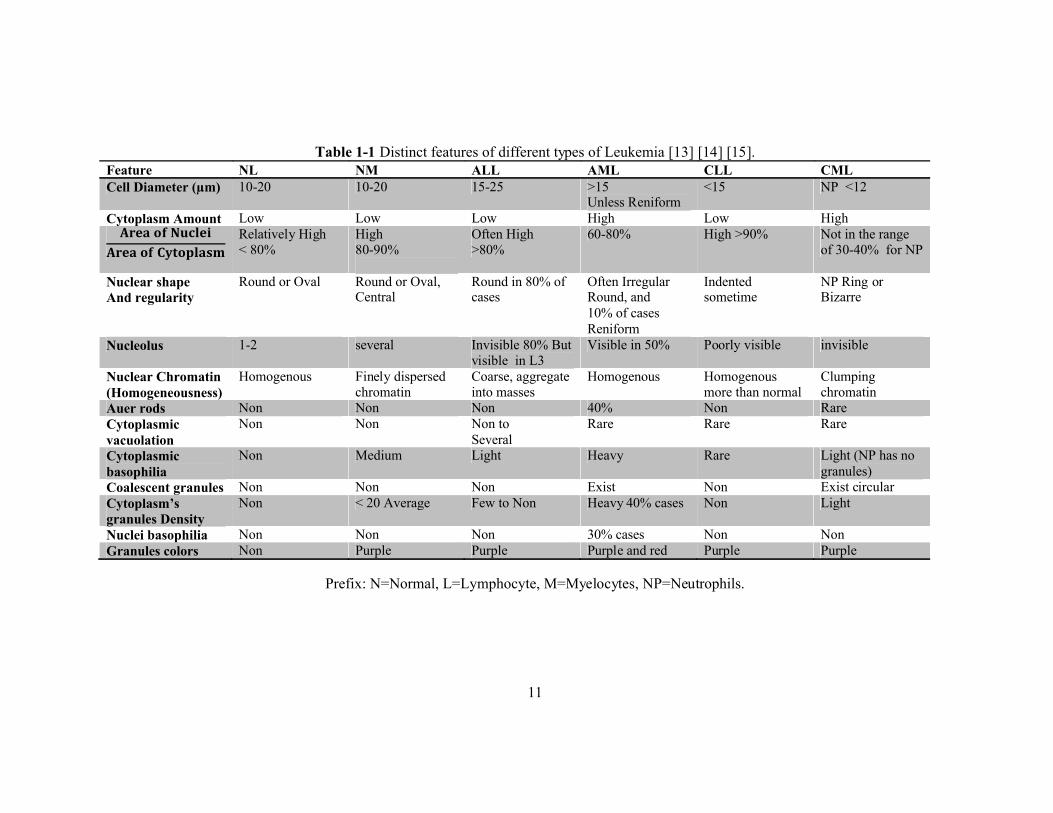
Table 1-1 Distinct features of different types of Leukemia [13] [14] [15]. ........................11
Table 5-1 Identification rate of Leukemia Types. .............................................................70
Table 5-2 The Significance of morphological features in identifying leukemic cells which
assigned weights more than half. ......................................................................................70
Table 5-3 Identification system processing times………………………………………....71
Table 5-4 Performance comparison between the developed system and other existing
systems…………………………………………………………………………………….72

x
LIST OF FIGURES
Figure 1-1 Different types of blood cells production in the bone marrow [3]. .....................4
Figure 1-2 The first two types from left are the Agranulocytes which include both
lymphocytes and monocytes, the remaining cells are the granulocytes include Eosinophils,
basophils, and the neutrophils, it can be seen how the nuclei is segmented in the
neutrophill cells [4]. ...........................................................................................................5
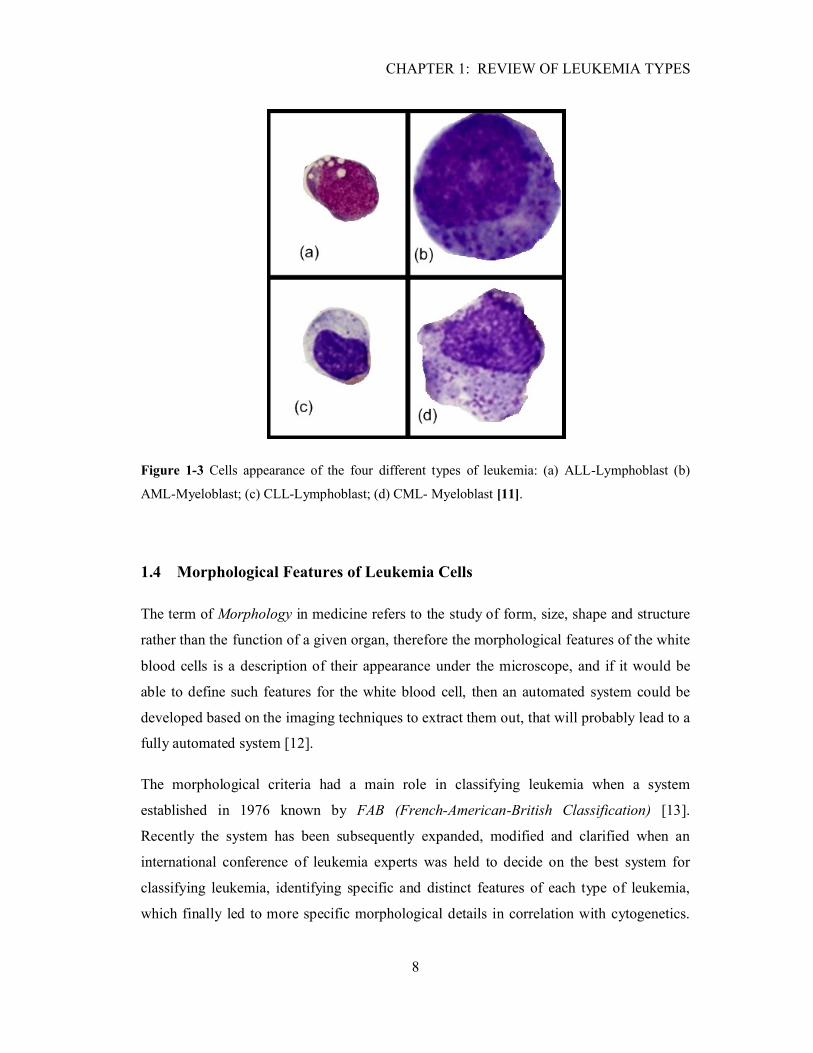
Figure 1-3 Cells appearance of the four different types of leukemia: (a) ALL-Lymphoblast
(b) AML-Myeloblast; (c) CLL-Lymphoblast; (d) CML- Myeloblast [11]. ..........................8
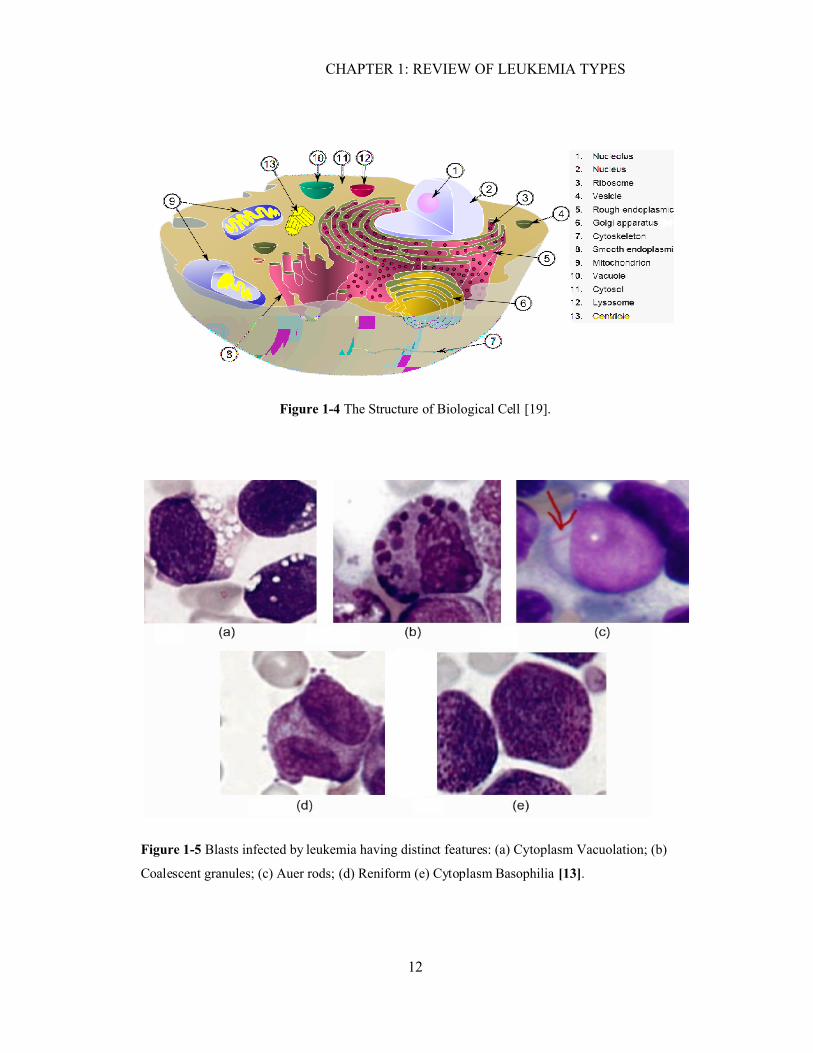
Figure 1-4 The Structure of Biological Cell [19]. .............................................................12
Figure 1-5 blasts infected by leukemia having distinct features: (a) Cytoplasm Vacuolation;
(b) Coalescent granules; (c) Auer rods; (d) Reniform (e) Cytoplasm Basophilia [13]........12
Figure 2-1 The structure of flow cytometer [20]. ..............................................................16
Figure 2-2 Karyogram of a normal male [26]. ..................................................................18
Figure 2-3 Different “Stains and Dyes” stains different and unveil distinct features: (a)
Wright-Giemsa; (b) Myeloperoxidase (MPO); (c) Non-specific Esterase (NSE); (d) Sudan
Black [32]. .......................................................................................................................22
Figure 2-4 Structure of the feature extraction and the classifier module at this paper [34].25
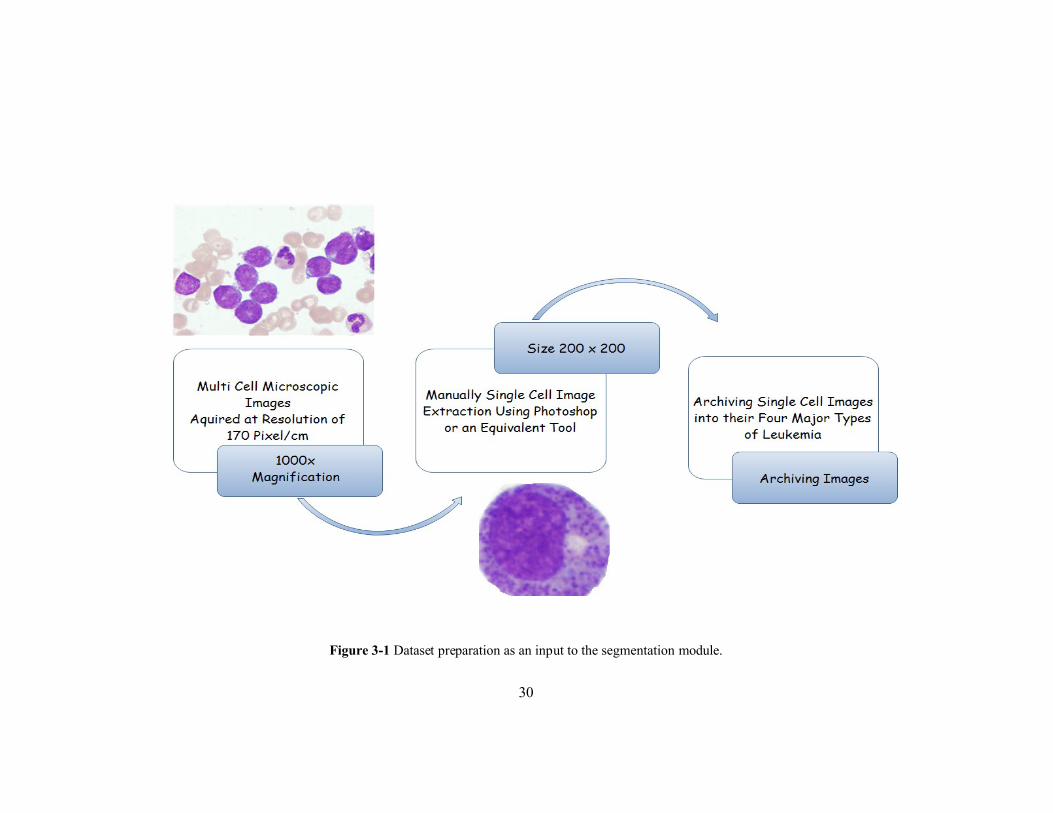
Figure 3-1 Dataset preparation as an input to the segmentation module. ...........................30
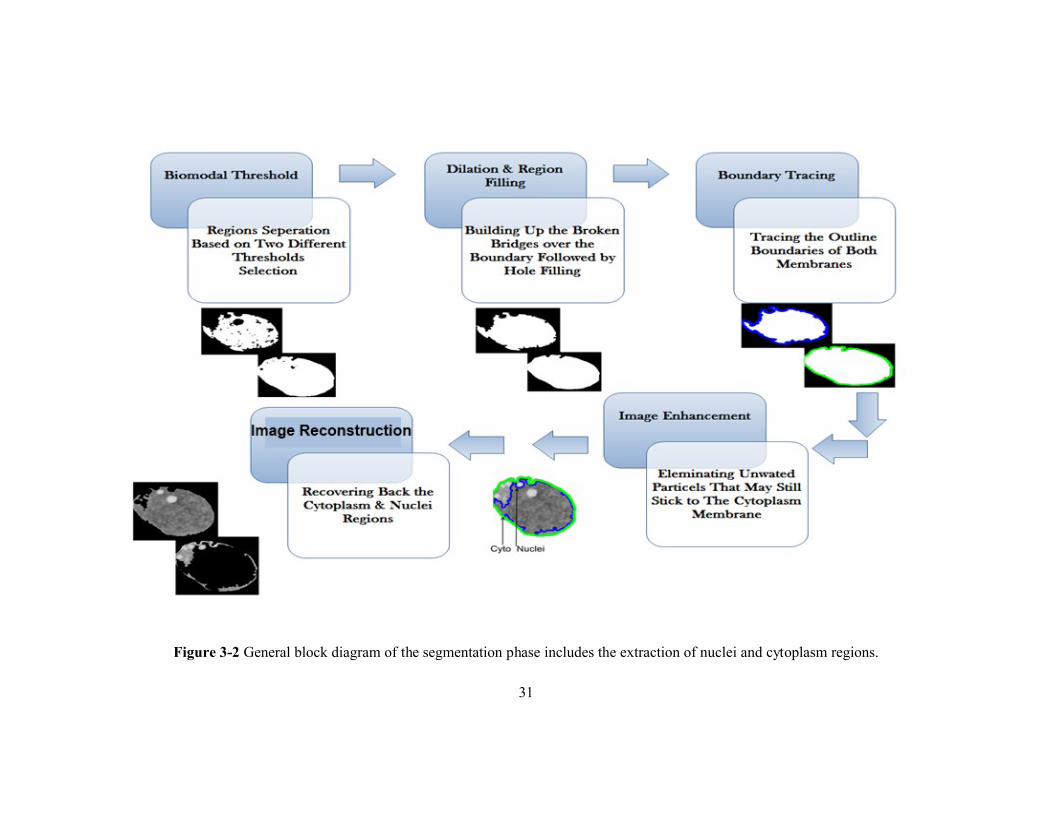
Figure 3-2 General block diagram of the segmentation phase ..........................................31
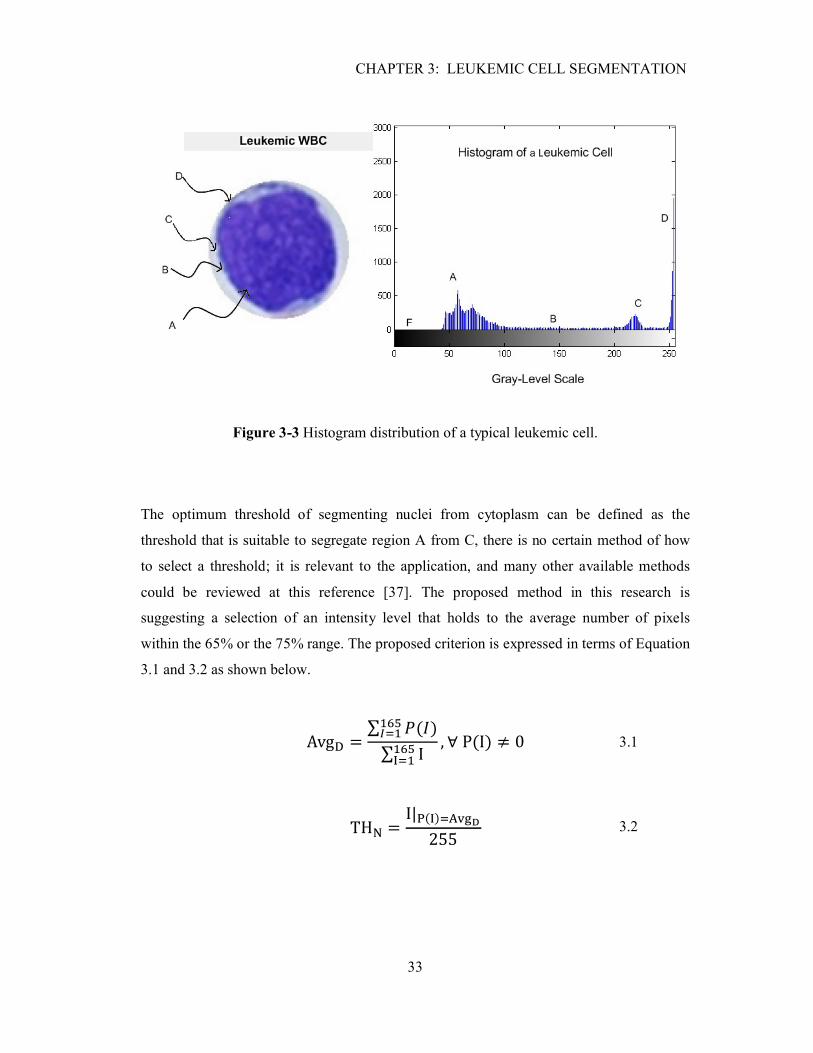
Figure 3-3 Histogram Distribution of a typical leukemic cell............................................33
Figure 3-4 Compliance of Bimodal-thresholds method with all four types of leukemia. ...35
Figure 3-5 Boundary representation of the chain mode [37]. ............................................36
Figure 3-6 (a) sample text of poor resolution with broken characters; (b) Structuring el
Elements; (c) Dilation output [39]. ...................................................................................37

xi
Figure 3-7 Hole filling principle [39]. .............................................................................38
Figure 3-8 Several stages of membranes processing. ........................................................39
Figure 3-9 Regions restoration process.............................................................................41
Figure 4-1 General description of the identification process. ............................................44
Figure 4-2 Shifting the central point of a typical leukemic cell to the zero-origin showing
regularity of its nuclei boundary. ......................................................................................48
Figure 4-3 3-D Topographical Representation of a typical leukemic cell, shows the
difference in elevation of vacuolation from other neighborhood objects. ..........................50
Figure 4-4 Processing stages to extract vacuolations. .......................................................52
Figure 4-5 The Concept of valleys is shown in a 3-D plot of AML leukemic Cell. ...........54
Figure 4-6 Granules detection in AML leukemic cell. ......................................................55
Figure 4-7 Several stages of nucleolus detection. .............................................................56
Figure 5-1 Symbolic representation and weights allocation. .............................................60
Figure 5-2 Identification code based on the cell diameter. ................................................61
Figure 5-3 Flow chart represents the Main and auxiliary rules for identifying Leukemia
based on nuclei to cytoplasm ratio....................................................................................63
Figure 5-4 Flow chart presents the concept of identification based on cytoplasm amount. 63
Figure 5-5 The identification respective algorithm based on the regularity factor β. .........65
Figure 5-6 Vacuolations-based algorithm. ........................................................................66
Figure 5-7 main and auxiliary rules of leukemia identification based on coalescent. .........67
Figure 5-8 Numerical example shows the identification of a random ALL leukemic cell. .69
xii
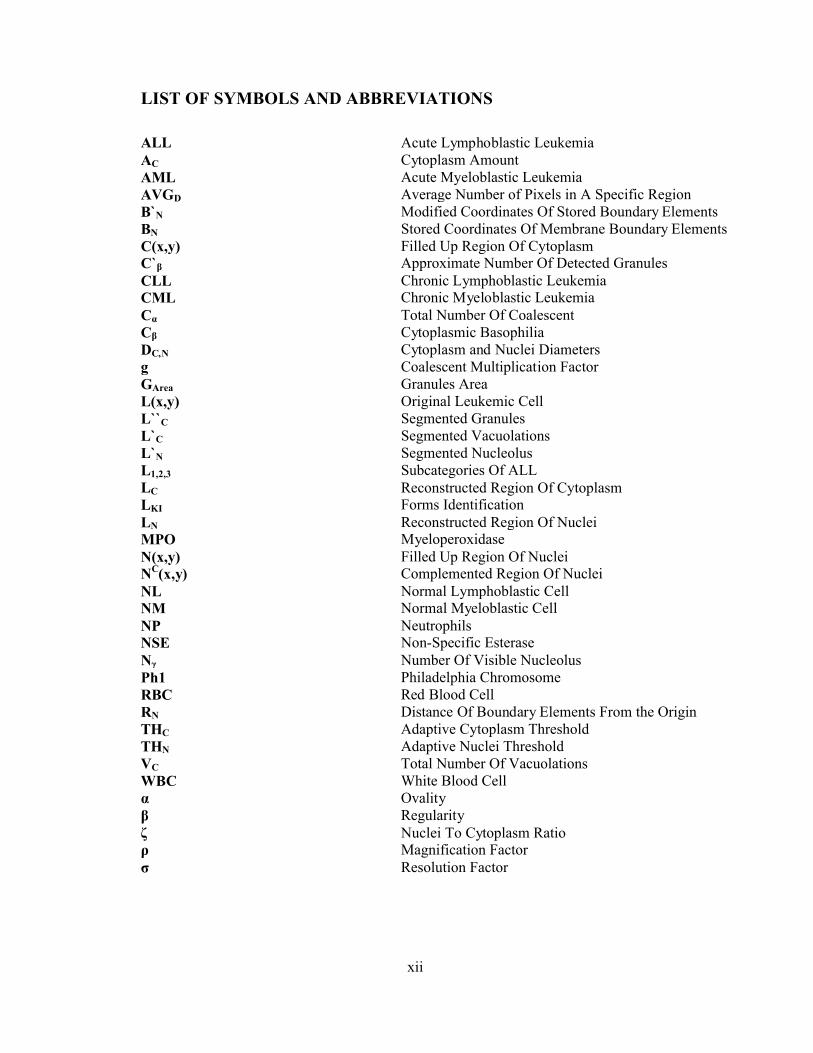
LIST OF SYMBOLS AND ABBREVIATIONS
ALL Acute Lymphoblastic LeukemiaAC Cytoplasm AmountAML Acute Myeloblastic LeukemiaAVGD Average Number of Pixels in A Specific RegionB`N Modified Coordinates Of Stored Boundary ElementsBN Stored Coordinates Of Membrane Boundary ElementsC(x,y) Filled Up Region Of CytoplasmC`β Approximate Number Of Detected GranulesCLL Chronic Lymphoblastic LeukemiaCML Chronic Myeloblastic LeukemiaCα Total Number Of CoalescentCβ Cytoplasmic BasophiliaDC,N Cytoplasm and Nuclei Diametersg Coalescent Multiplication FactorGArea Granules AreaL(x,y) Original Leukemic CellL``C Segmented GranulesL`C Segmented VacuolationsL`N Segmented NucleolusL1,2,3 Subcategories Of ALLLC Reconstructed Region Of CytoplasmLKI Forms IdentificationLN Reconstructed Region Of NucleiMPO MyeloperoxidaseN(x,y) Filled Up Region Of NucleiNC(x,y) Complemented Region Of NucleiNL Normal Lymphoblastic CellNM Normal Myeloblastic CellNP NeutrophilsNSE Non-Specific EsteraseNγ Number Of Visible NucleolusPh1 Philadelphia Chromosome RBC Red Blood CellRN Distance Of Boundary Elements From the OriginTHC Adaptive Cytoplasm ThresholdTHN Adaptive Nuclei ThresholdVC Total Number Of VacuolationsWBC White Blood Cellα Ovalityβ Regularityζ Nuclei To Cytoplasm Ratioρ Magnification Factorσ Resolution Factor
INTRODUCTION
1
INTRODUCTION
Leukemia is not just a name for a single disease; there are mainly four different types
which are classified from an aspect of the infected cells type, in addition to the growth
speed and the improper overproduction of leukemic cells. Leukemia is a cancer of white
blood cells, where the disease basically develops in the bone marrow which is the spongy
tissue fills within the inside region of the bones. The cancer is generally detected by
overproduction of the white blood cells in the bone marrow where they remain immature
and start to function improperly.
The early identification of leukemia type can greatly increase the likelihood of recovery. In
fact several diagnostic methods are available to identify leukemia type on basis of immune-
phenotype; cytogenetic abnormality, morphology, cytochemistry, and molecular genetic
abnormalities, and these diagnostic methods vary in the level of complexity, speed of the
process, and the accuracy of leukemia classification. The most advanced labs rely on as
many as a dozen different, labor-intensive technologies, all of which require highly trained
specialists. Even so, patients are often misdiagnosed in regard to subtype.
Therefore, it can be suggested that using morphological analysis methods for identifying
the different leukemia types; based mainly on images, can greatly reduce the cost of
performing type identification tests. This research aims to develop an automated leukemia
form identification system based on the morphological analysis. The proposed system is
mainly composed of three phases: single cell segmentation, followed by features extraction
and then classification.
Chapter one reviews the major different forms or types of leukemia in addition to the basis
of classification whether a chronic or acute leukemia. The morphological variations
amongst different leukemic forms and how leukemic cells appear under the microscope are
also described in this chapter. Moreover, a table summarizes the morphological features of
each form of leukemia based on reviewing several medical resources.
INTRODUCTION
2
Chapter two defines the latest available diagnostic method in identifying leukemia types
including each of immune-phenotype; cytogenetic abnormality, and morphological
analysis, where several research works on these methods are reviewed. Justification is
provided for why this research has selected the morphological diagnostic method.
Chapter three presents the first phase of the proposed system; namely cell segmentation
where novel method is developed to achieve an efficient segmentation of both: nuclei and
cytoplasm regions, which provide two enhanced images for each input cell image. The
enhanced result images contain valuable information on the cell features and shall then be
used as the input images in the next two stages of the identification system. The proposed
method involves several image processing techniques which include the utilization of
morphological operators, image enhancement, restoration, elimination of unwanted objects,
intersection, and union.
Chapter four presents the features extraction phase, where different respective algorithms
are developed to extract efficiently nine unique and distinct features out of each single
leukemic cell; applying different methodologies, and utilizing different concepts. The nine
features are: Cell Diameter, Nuclei to Cytoplasm ratio, Amount of Cytoplasm, Shape and
Regularity of the Nuclei Region, Cytoplasmic Vacuolations, Cytoplasmic Basophilia or
Granules, Coalescent Existence, Ovality, and the Nucleolus Visibility.
Chapter five presents the classification phase, where a list of rules is defined based on the
morphological variations amongst different types of leukemia. The created rules form a
translation of the morphological variations, and the resultant quantities of the previous
features extraction will be used. However, the numerical quantities of the extracted
features will be significant and medically meaningful; that will definitely help and aid the
pathologist to provide a fast decision in synchronization with the leukemia form
identification system’s output. At the end of this chapter; results and performance of the
proposed system are discussed. The dataset of leukemic single cell images which are
already archived will be all tested with the new developed module. The results will verify
the performance and the efficiency of the proposed leukemia identification system.

CHAPTER 1: REVIEW OF LEUKEMIA TYPES
3
CHAPTER 1
CHAPTER 1: REVIEW OF LEUKEMIA TYPES
1.1 Overview
Leukemia is a cancer of white blood cells, where the disease basically develops in the bone
marrow which is the spongy tissue fills within the inside region of the bones. The cancer is
generally detected by overproduction of the white blood cells in the bone marrow where
they remain immature and start to function improperly.
This chapter describes the different types of blood cells which develop in the bone marrow,
and indicate which one of these cells are most likely tend to be infected with a certain type
of leukemia. Moreover, sections will be discussing the major different types of leukemia
and the basis of classification whether chronic or acute leukemia. The last section describes
the morphological features of leukemic cells, along with a table summarizes the
morphological variations amongst leukemia forms.
1.2 Blood Cells Types in the Bone Marrow
The blood material forms 40 percent of the blood volume, the remaining 60 percent of it is
known by plasma which is the liquid part of the blood. All types of blood cells are made up
in the bone marrow by the “Stem Cells” which then differentiate into three different types
of blood cells as listed below [1]. The three blood cell types can be differentiated from
each other by their different sizes and different morphological features[2]. Figure 1.1
shows the blood cells production in the bone marrow:
Red blood cells (erythrocytes): Millions of RBCs are released into the bloodstream
from the bone marrow each day; they give the blood its red color, handling the task
of picking up the oxygen and carry it to all tissues of the body.
CHAPTER 1: REVIEW OF LEUKEMIA TYPES
4
Platelets (thrombocytes): They help stop bleeding and help the blood to clot if
there is injury.
White blood cells (leukocytes): The WBCs fight infections; they also produce,
transport, and distribute antibodies as part of the body's immune response.
Leukemia usually develops in these blood cells. Generally leukocytes are classified
into five different types as illustrated in Figure 1.1. Moreover, they are all can be
broken into two major forms as following:
Granulocytes: which include three types of WBCs, (neutrophils,
eosinophils, and basophils) have granules in the area surrounds the nuclei
which known by the cytoplasm. They have also a multi nucleus. As a result
they are also called polymorph nuclear leukocytes or "polys." It can be
noticed that the nuclei of neutrophils appears to be segmented of multi
parts.
Non-granulocytes (Agranulocytes): theses WBCs include (lymphocytes
and monocytes) they have no granules and their nuclei is none segmented.
They are sometimes referred to as mononuclear leukocytes.
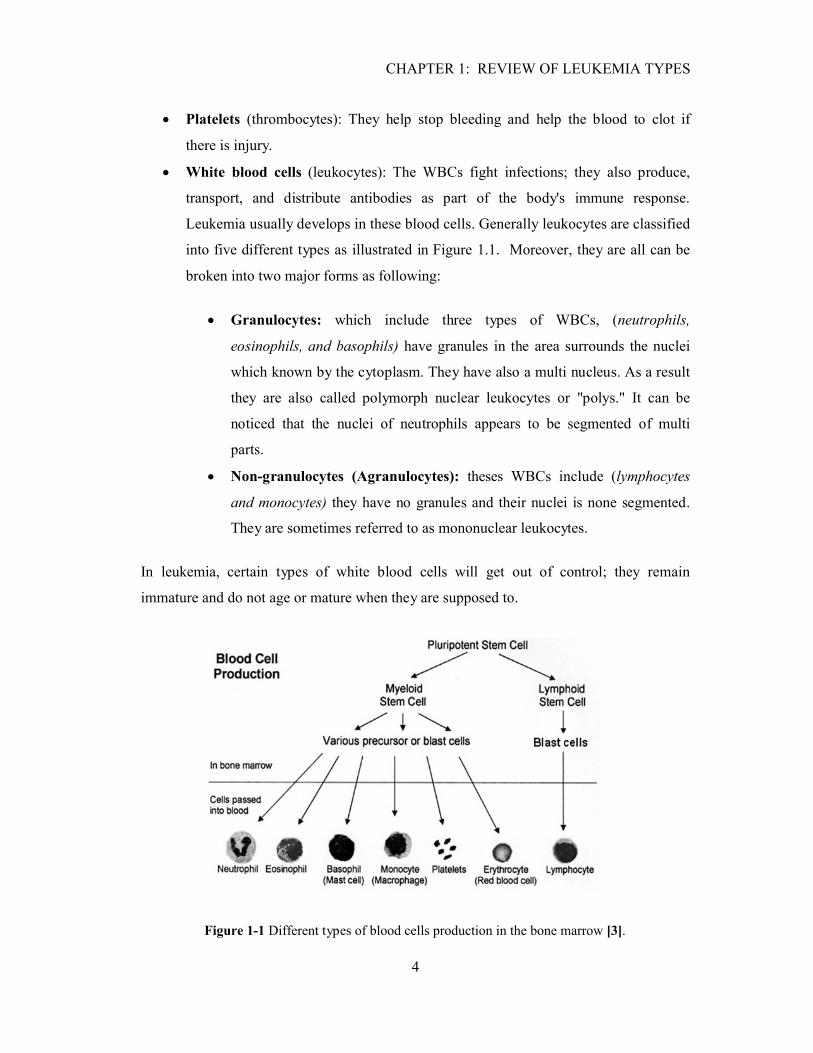
In leukemia, certain types of white blood cells will get out of control; they remain
immature and do not age or mature when they are supposed to.
Figure 1-1 Different types of blood cells production in the bone marrow [3].
CHAPTER 1: REVIEW OF LEUKEMIA TYPES
5
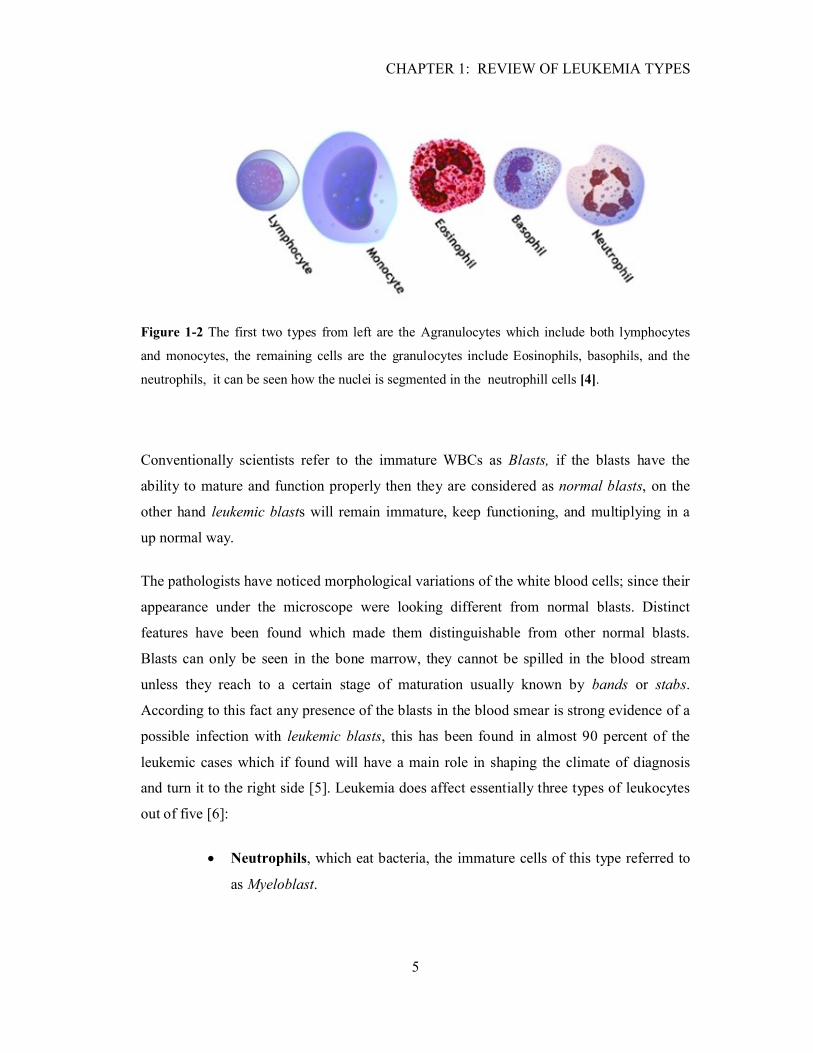
Figure 1-2 The first two types from left are the Agranulocytes which include both lymphocytes
and monocytes, the remaining cells are the granulocytes include Eosinophils, basophils, and the
neutrophils, it can be seen how the nuclei is segmented in the neutrophill cells [4].
Conventionally scientists refer to the immature WBCs as Blasts, if the blasts have the
ability to mature and function properly then they are considered as normal blasts, on the
other hand leukemic blasts will remain immature, keep functioning, and multiplying in a
up normal way.
The pathologists have noticed morphological variations of the white blood cells; since their
appearance under the microscope were looking different from normal blasts. Distinct
features have been found which made them distinguishable from other normal blasts.
Blasts can only be seen in the bone marrow, they cannot be spilled in the blood stream
unless they reach to a certain stage of maturation usually known by bands or stabs.
According to this fact any presence of the blasts in the blood smear is strong evidence of a
possible infection with leukemic blasts, this has been found in almost 90 percent of the
leukemic cases which if found will have a main role in shaping the climate of diagnosis
and turn it to the right side [5]. Leukemia does affect essentially three types of leukocytes
out of five [6]:
Neutrophils, which eat bacteria, the immature cells of this type referred to
as Myeloblast.
CHAPTER 1: REVIEW OF LEUKEMIA TYPES
6
Lymphocytes, which make substances to fight bacteria, the immature cells
of this type referred to as Lymphoblast.
Monocytes, which destroy foreign materials, the immature cells of this type
referred to as Monoblast.
1.3 Main Types of leukemia
Leukemia is not just a name for a single disease, there are mainly four different types
which classified carefully based on two factors: first one is the exact type of the infected
cells, and second one is the growth speed of the leukemic cells [7], the four different types
of leukemia as shown in Figure 1.3 are classified as following [8] [9][10]:
1.3.1 Acute lymphoblastic leukemia (ALL)
The word acute in acute lymphocytic leukemia comes from the fact that the disease
progresses rapidly and it can be fatal in weeks to months if left untreated, the
lymphoblastic word referred to the infected type of the white blood cells at this type which
is the lymphoblasts or the immature lymphocytes. ALL is most commonly seen in
childhood with a peak incidence at 4-5 years of age, and another peak in old age. The
overall cure rate if the exact type of the leukemia is successfully determined in children is
about 85 percent, and about 50 percent in adults [8] [9].
1.3.2 Acute myeloid leukemia (AML)
It is known as well by other different names; acute myelogenous leukemia, acute
myeloblastic leukemia, acute granulocytic leukemia or acute nonlymphocytic leukemia.
This type of cancer does not affect the lymphoblasts but the Myeloblast which is the
immature stage of the granulocytes. The leukemic Myeloblast keeps accumulating in the
bone marrow and interfere with the production of normal white blood cells and crowd it
out, most of the time these leukemic blasts can be seen in the blood stream spilled out from
the bone marrow, according to the statistics most commonly affects adults of about 40
CHAPTER 1: REVIEW OF LEUKEMIA TYPES
7
years of age, as well as children less than 1 year of age, and it is rare in older children [8]
[9].
1.3.3 Chronic lymphocytic leukemia (CLL)
The term chronic comes from the fact that the disease progresses more slowly than other
types of leukemia, where again lymphocytic word refers to the type of infected white blood
cells. Leukemic cells at this type do mature but they remain in the bloodstream much
longer than normal white blood cells, they are unable to combat infection as well, and they
are less in size than normal ones. Chronic lymphocytic leukemia can occur at any age, but
it is most common after the age of 45 years and older adults. In CLL the DNA of the
lymphocyte cell gets damaged, so the cell cannot fight the infections anymore, on top of
that it grows out of control and crowds out the healthy blood cells that can fight infection
[8] [10].
1.3.4 Chronic myelogenous leukemia (CML)
This type of leukemia is considered to be uncommon type of the blood cancer. The word
chronic in chronic myelogenous leukemia indicates that this cancer tends to progress more
slowly than the acute forms of leukemia, as a result of the disease the abnormal mature
myelocytes will start accumulating in the bone marrow slowly, and the infected leukemic.
Myelocytes most of the time can be seen in the blood smear and look different from the
normal Myelocytes. The disease incidence rate is uncommon and very rare in children, it
does not go more than 5 percent, and half of the patients are over 60. Besides, the diagnosis
has shown that patients of CML usually tend to have increased number of granulocytes
than usual during their complete blood count [8].
This research proposes novel method in identifying leukemia using one of the available
diagnostic methods, namely, morphological analysis that will help and aid pathologist to
determine the exact type of leukemia. The task is a challenge itself since the fact of
different types of leukemia are subjected to different types of chemotherapies, which can
greatly increase the probability of recovery.
CHAPTER 1: REVIEW OF LEUKEMIA TYPES
8
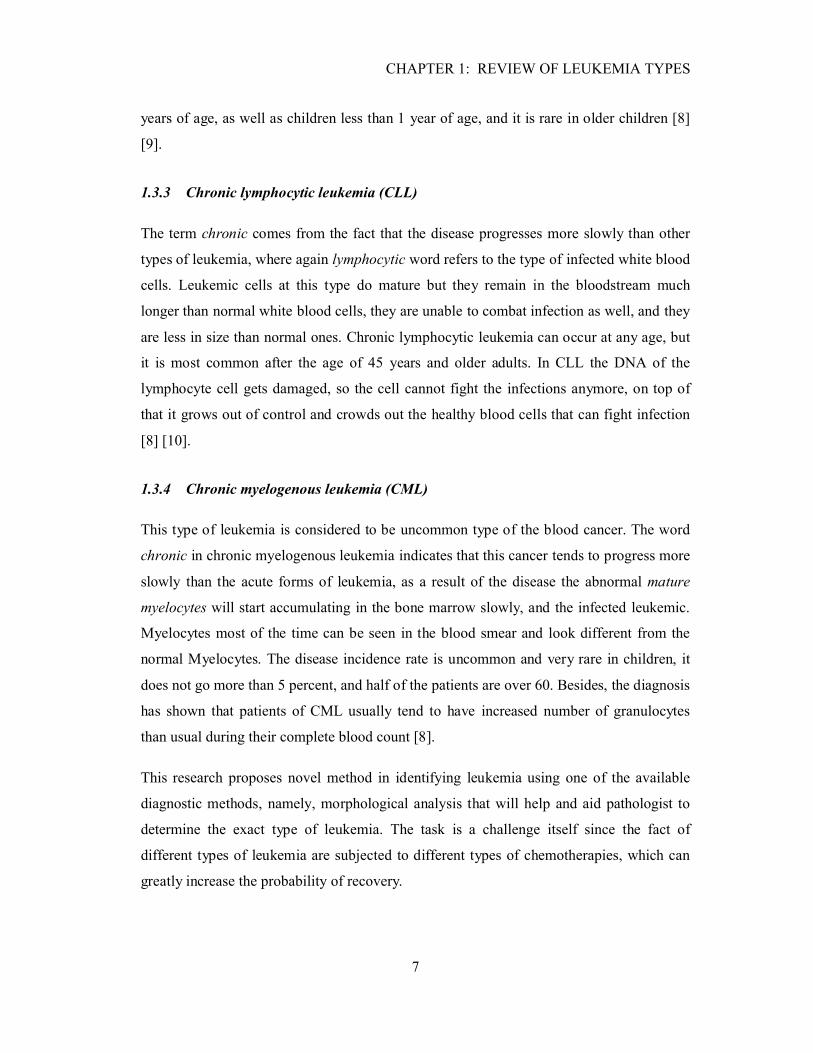
Figure 1-3 Cells appearance of the four different types of leukemia: (a) ALL-Lymphoblast (b)
AML-Myeloblast; (c) CLL-Lymphoblast; (d) CML- Myeloblast [11].
1.4 Morphological Features of Leukemia Cells
The term of Morphology in medicine refers to the study of form, size, shape and structure
rather than the function of a given organ, therefore the morphological features of the white
blood cells is a description of their appearance under the microscope, and if it would be
able to define such features for the white blood cell, then an automated system could be
developed based on the imaging techniques to extract them out, that will probably lead to a
fully automated system [12].
The morphological criteria had a main role in classifying leukemia when a system
established in 1976 known by FAB (French-American-British Classification) [13].
Recently the system has been subsequently expanded, modified and clarified when an
international conference of leukemia experts was held to decide on the best system for
classifying leukemia, identifying specific and distinct features of each type of leukemia,
which finally led to more specific morphological details in correlation with cytogenetics.
CHAPTER 1: REVIEW OF LEUKEMIA TYPES
9
Table 1.1 was a research try to summarize the cell’s distinct features of each type of
leukemia and their appearance under the microscope throughout reviewing different
medical references [14][15][16].
This research will get the light focus on the WBCs which most likely tends to be infected
by different types of leukemia, as being illustrated before during the review of main
leukemia types, the infected cells of ALL and CLL are the lymphoblasts while it is the
Myeloblast in case of the AML and CML. Fully understanding of the listed features is
essential, since that will definitely help and contribute in developing a reliable system.
The FAB system has assigned different categories for each type of leukemia, hence ALL is
being categorized into three different groups which recently known by L1, L2, and L3. The
features relevant to these subcategories are even different from each other; for e.g. L2 cells
looks larger than L1 cells, where it is not the case in L3, they usually look smaller and
vacuolated. With reference to several statistics, the subtype L1 occupied the majority cases
of ALL; in childhood 70–80 percent of cases fall into this category [16]. This research
proposes a system that is useful to subdivide, classify different types of leukemia and split
them into their major forms.
1.4.1 List of the Main Morphological Features
As illustrated before fully understanding of the listed features as it shown in Table 1.1
below will be essential in order to develop a well identification system. Figure 1.5 shows
the relevance of these features to the four major types of leukemia, it is obvious that each
type of leukemia has unique characteristics that result of features combinations. Lists of the
main distinct features are briefly described below:
Cytoplasm Amount: Cytoplasm is basically the substance that fills the cell, it is a
jelly-like material that is eighty percent water and usually clears in color,
surrounding the nuclear envelope and the cytoplasmic organelles, and therefore the
surface area of the cytoplasm represents the area of the cell itself.

CHAPTER 1: REVIEW OF LEUKEMIA TYPES
10
Nuclei and Nucleolus: Nucleolus is contained within the cell nucleus (Nuclei), the
nuclei area is almost uniform with respect to it is gray color intensity scale.
Nuclear shape: which usually varies from round, oval to Bizarre and reniform
(Having the form or shape of a kidney or leaf) [17]. Figure 1.4 is showing the
internal structure of biological cell which includes each of cytoplasm, nuclei and
other little organs.
Auer rods: They are clumps of granular material that form elongated needles seen
in the cytoplasm of leukemic blasts, which could be strong evidence on having an
infection with AML, and it is rare to occur in the other types of leukemia.
Vacuolation: Which is a small cavity inside the cytoplasm region, bounded by a
single membrane and containing water, food, or metabolic waste [18]. Vacuolation
if found will give a sign on an infection relevant to ALL. Most of the time this
feature seems to be associated with the visibility of the nucleus.
Cytoplasmic Basophilia:The term of basophilia refers to the existence of granules
in the cytoplasm area, since normal basophilic is a granulic white blood cell, and
the average number of granules in the immature Myeloblast ranging of less than 20
[15].
Coalescent Granules: This feature commonly found when the granules start
accumulating over each other, and it is usually caused by the improper functioning
of that cell.
It has to be pointed here at CML leukemia, cytogenetics play a main role in enhancing
the diagnosis of this type along with its morphological features. One of the most
common cytogenetic variations occur when a patient having a genetic translocation
between chromosomes 9 and 22 in his leukemic cells, this abnormality is referred to
the cytogenetic and is more detailed at chapter two, this abnormality is usually known
by Philadelphia chromosome (Ph1) which if found will increase the accuracy of
diagnosis to 95 percent.
11
Table 1-1 Distinct features of different types of Leukemia [13] [14] [15].Feature NL NM ALL AML CLL CMLCell Diameter (µm) 10-20 10-20 15-25 >15
Unless Reniform<15 NP <12
Cytoplasm Amount Low Low Low High Low High���� �� ������
���� �� ���������Relatively High< 80%
High80-90%
Often High>80%
60-80% High >90% Not in the range of 30-40% for NP
Nuclear shapeAnd regularity
Round or Oval Round or Oval, Central
Round in 80% of cases
Often Irregular Round, and10% of cases Reniform
Indented sometime
NP Ring or Bizarre
Nucleolus 1-2 several Invisible 80% But visible in L3
Visible in 50% Poorly visible invisible
Nuclear Chromatin(Homogeneousness)
Homogenous Finely dispersed chromatin
Coarse, aggregate into masses
Homogenous Homogenous more than normal
Clumping chromatin
Auer rods Non Non Non 40% Non RareCytoplasmic vacuolation
Non Non Non toSeveral
Rare Rare Rare
Cytoplasmic basophilia
Non Medium Light Heavy Rare Light (NP has no granules)
Coalescent granules Non Non Non Exist Non Exist circularCytoplasm’s granules Density
Non < 20 Average Few to Non Heavy 40% cases Non Light
Nuclei basophilia Non Non Non 30% cases Non NonGranules colors Non Purple Purple Purple and red Purple Purple
Prefix: N=Normal, L=Lymphocyte, M=Myelocytes, NP=Neutrophils.
CHAPTER 1: REVIEW OF LEUKEMIA TYPES
12
Figure 1-4 The Structure of Biological Cell [19].
Figure 1-5 Blasts infected by leukemia having distinct features: (a) Cytoplasm Vacuolation; (b)
Coalescent granules; (c) Auer rods; (d) Reniform (e) Cytoplasm Basophilia [13].
CHAPTER 1: REVIEW OF LEUKEMIA TYPES
13
A quick review of the above Table 1.1 will illustrate how features are often overlapping
amongst different types of leukemia; therefore nobody can claim that a single feature
would be useful to identify the leukemia form, as well as it is scientifically unacceptable.
Hence the proposed automated diagnostic system represents an integration of several
extracted features which suggests an efficient reliability and accuracy for such a diagnostic
method.
1.5 Summary
This chapter described different types of blood cells, illustrating that the infection by
leukemia will only affect white blood cells. Generally lymphocytes and the myelocytes are
the cells targeted by leukemia. Moreover, Leukemia is a broad term covering a spectrum of
diseases and subdivided into two major forms, Acute Leukemia which includes ALL and
AML; they are both characterized by the rapid growth of infected leukocytes, spreading
quickly which makes the disease fatal in weeks to months of not treated. The second
major form is known as chronic includes both of CLL and CML, where the progress of
overproduction is much slower than in acute leukemia. Different morphological features
are being summarized; those morphological features vary in their significance to identify
leukemia forms.
CHAPTER 2: LEUKEMIA DIAGNOSIS METHODS
14
CHAPTER 2
CHAPTER 2: LEUKEMIA DIAGNOSIS METHODS
2.1 Overview
Leukemia could be diagnosed and classified on the basis of immune-phenotype;
cytogenetic abnormality, and morphology. These diagnostic methods have shown
successful results. However, they have drawbacks related to cost, time expense, and correct
diagnostic rates. The following sections will review the available diagnostic methods
individually.
This chapter reviews the most common methods in diagnosing leukemia. The following
sections discuss and review previous research works have used one of these methods to
identify leukemia. Firstly, immune-phenotype and the use of flow cytometers to analyze
the antibiotic features of WBCs, the following section will discuss the cytogenetic methods
and the study of genes, and finally reviewing several research works have utilized the
morphological analysis. Furthermore, justification is provided of why this research has
selected the morphological analysis as the diagnostic method that well suited for
identifying leukemia considering, the low cost, fast and accurate identification rates.
2.2 Immune-phenotype
Immune-phenotype analysis is a technique used to study the protein expressed by cells, it
is one of the basic diagnosis of leukemia involves the labeling of white blood cells with
antibodies directed against surface proteins on their membrane. By choosing appropriate
antibodies, the differentiation of leukemic cells can be accurately determined. The labeled
cells are processed in a flow cytometer, a laser-based instrument has the ability to measure
the properties of individual particles and analyzing thousands of cells per second usually
10,000 at once, which yields to reliable results. The major clinical application of flow
cytometer is the diagnosis of hematologic malignancy which an essential step to
CHAPTER 2: LEUKEMIA DIAGNOSIS METHODS
15
discriminate mature cells, which characterizes the chronic form of leukemia, from the
immature ones which is relevant to the acute leukemia.
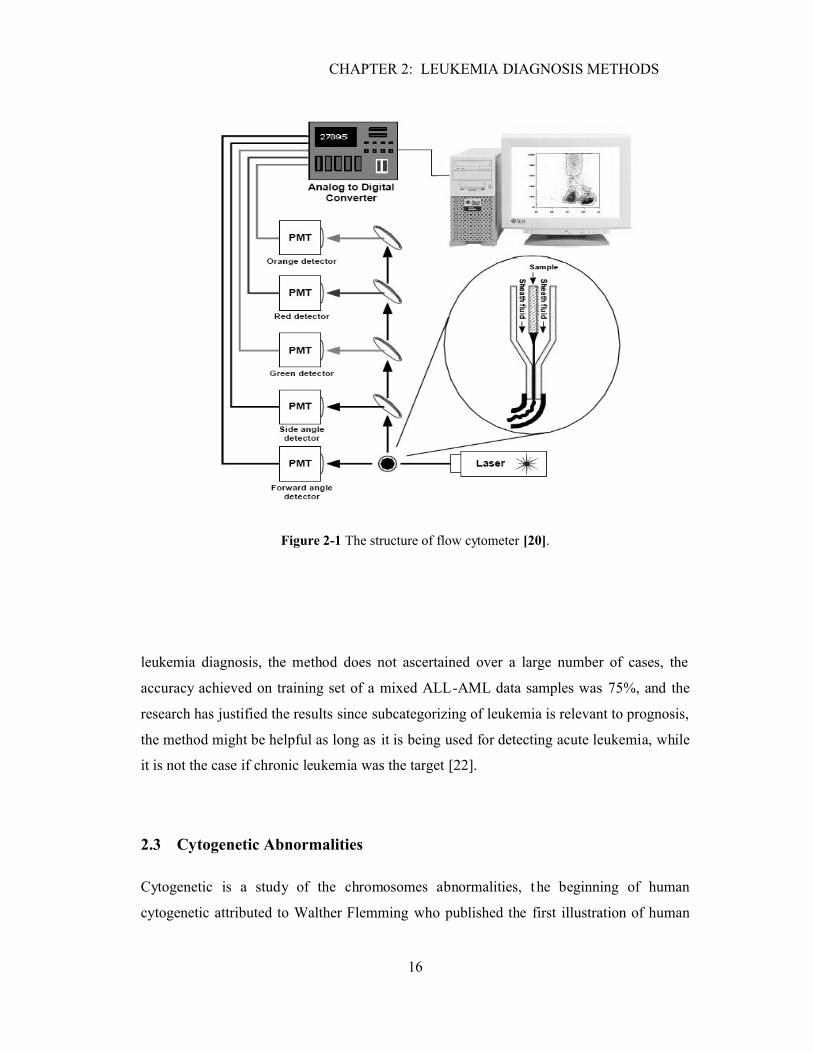
Flow cytometer functions by firstly adding monoclonal antibody solutions to the cells in
order to label them, passing each cell individually through a highly focused laser beam of
the flow cytometer; the fluorochrome of each labeled monoclonal antibody attached to the
cell is excited by the laser light and emits light of a certain wavelength based on the shape
of the surface as well. The cells will scatter the light at multiple angles, photo detectors
placed a forward angle and at right angles to the axis of the laser beam collect the emitted
or scattered light, and then a Dot Plot is produced where each dot represents a single cell
could be analyzed by the flow cytometer, Figure 2.1 shows the basic structure of a typical
flow cytometer [20].
The first flow cytometer was developed in 1970’s, and the first commercial flow
cytometers were large, complex, expensive, and difficult to operate and maintain, even
now days these commercial cytometers still relatively expensive but less than those in the
past, typically costs several tens of thousands of dollars.
One of the approaches has been published in 1996 entitled by “Neural Network Analysis of
Flow Cytometery Immunophenotype Data” [21], aimed to analyze the immunophenotype
characteristics using the flow cytometery data based on lineage and differentiation antigen
expression, since acute leukemia is classified into two major lineage categories: 1) acute
lymphoblastic leukemia (ALL), originating from immature and differentiating
lymphocytes and 2) acute myeloblastic leukemia (AML), originating from immature and
differentiating myelocytes, Phenotypes describe a set of cellular antigens expressed by the
leukemic clone that defines whether the leukemia is of myeloid or lymphoid origin, and the
stage of maturation. The data collected out of the flow cytometer is being analyzed using a
neural network and further, the results has shown that the network were able to recognize
the ALL and categorize it into three subtypes instantaneously with an accuracy of 92.6%,
consequently it could be considered as a useful tool to aid the pathologist within the
CHAPTER 2: LEUKEMIA DIAGNOSIS METHODS
16
Figure 2-1 The structure of flow cytometer [20].
leukemia diagnosis, the method does not ascertained over a large number of cases, the
accuracy achieved on training set of a mixed ALL-AML data samples was 75%, and the
research has justified the results since subcategorizing of leukemia is relevant to prognosis,
the method might be helpful as long as it is being used for detecting acute leukemia, while
it is not the case if chronic leukemia was the target [22].
2.3 Cytogenetic Abnormalities
Cytogenetic is a study of the chromosomes abnormalities, t he beginning of human
cytogenetic attributed to Walther Flemming who published the first illustration of human
CHAPTER 2: LEUKEMIA DIAGNOSIS METHODS
17
chromosome in 1882[23]. Normally the human cells contain 46 chromosomes, pieces of
DNA and protein that control cell’s growth and metabolism, cytogenetic testing looks at
chromosomal abnormalities. What happens is at a certain type of leukemia part of the
chromosome is affected, or a certain chromosome may be attached to part of a different
chromosome, this change is known by translocation, can usually be seen under a
microscope. From the point view of automation, that would be a privilege, because end of
the way it is just an image to be processed, from which the system could be automated
involving multiple image processing techniques. Recognizing these translocations helps in
identifying certain types of CLL and CML and considered to be essential in determining
the patient's prognosis (the outlook for chances of survival) and in choosing the most
suitable treatment.
Over 90% of CML patients have a translocation between chromosomes 9 and 22 present in
their leukemic cells. This chromosome change is called the Philadelphia chromosome and
was named by the doctors from that city who first noticed the translocation. This was the
first translocation discovered that is consistently found in a specific type of cancer. This
translocation is not only a useful feature to aid and help in identifying this type of cancer, it
has an important role in making the cells cancerous, and studies of the regions of DNA
affected by the translocation have provided much information about genes that cause
cancer.
The process of diagnosing based on the cytogenetic abnormality has a disadvantage of
being long term process, which usually takes around three weeks, because of the leukemic
cells must grow in laboratory dishes for a couple of weeks before their chromosomes are
ready to be viewed under the microscope. The most common finding abnormalities are:
firstly the Translocation of chromosomes, such as the translocation between chromosome
9 and 22, which means a part of chromosome 9 is now located on chromosome 22, and
part of chromosome 22 is now attached to chromosome 9, clinically written in form of
t(9,22). Another abnormality is denoted by the Inversion, written as inv followed by the
chromosome number. One more is the Deletion, written as “–“followed by the
chromosome number indicating that part of the chromosome has been lost. The last one is
the Addition, which written as “+“followed by the chromosome number, which occurs
CHAPTER 2: LEUKEMIA DIAGNOSIS METHODS
18
when all or part of a chromosome has been duplicated, or too many copies of it are found
within the cell [24].
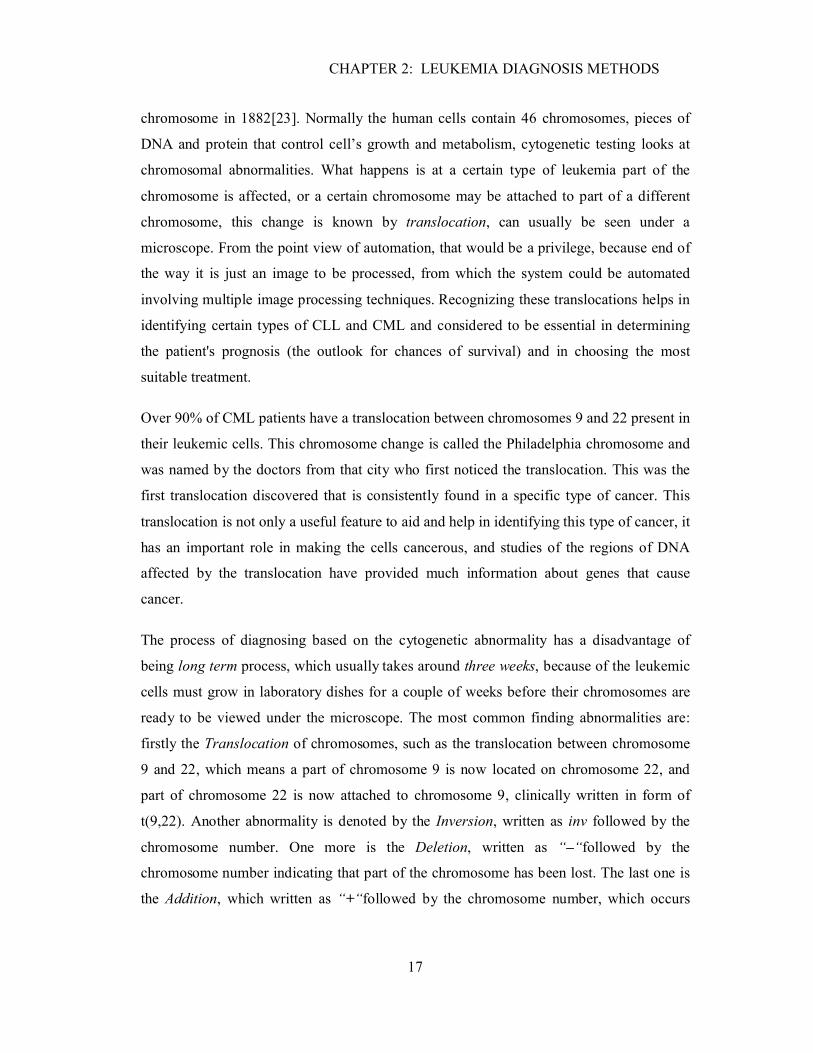
Tracing out the abnormalities during the diagnosis procedure of a genetic disease such as
leukemia requires specific criteria known by karyotyping, which end up in a visual
representation of the 46 chromosomes (named by the karyogram) see Figure 2.2. In fact
images containing human chromosomes have been a favorite target for computer image
processing since the earliest days. The challenge has been sufficient that the first clinically
successful system was installed as recently as 1982 .That one was a semi-automated
system providing fully automated location of dividing cells on the specimen slide,
followed by machine counting, segmentation, measurement and classification of
chromosomes. But the operator interaction was still required to resolve the short comings
of the image processing algorithms. The system has got acceptance among the clinical staff
arose largely from the nature of the interaction required. The user model was designed
around the production of a clinical report. All actions could be seen as advancing the
operators understanding of the image towards generating a report. System development in
parallel with clinical use has resulted in modes of operations in which human input is
optimized [25].
Rapid automatic counting is very difficult to achieve due to the presence of clus ters of
touching an overlapping chromosomes in even the best prepared specimens.
Figure 2-2 Karyogram of a normal male [26].

CHAPTER 2: LEUKEMIA DIAGNOSIS METHODS
19
Current activity in automated cytogenetic involves the use of multilayer perceptron neural
networks in chromosome classifications. To realize the abnormalities in cytogenetics, a
procedure known by pairing criterion has to be implemented aims to identify all pairs of
homologous chromosomes, as it shown in Figure 2.2 above the normal male has 22 pairs
plus the X Y pair, so totally 46 chromosomes. The pairing criterion is based on
dimensional, morphological, and textural features similarity. This process is time
consuming when performed manually; therefore an automatic pairing algorithm would thus
bring benefits. One of the approaches was an attempt to develop a pairing algorithm, heart
of the process, in order to find out any translocations, inversion, deletion, or addition. The
proposed algorithm is based on the traditional features extracted from the karyogram, such
as, dimensions and banding profile, the last mentioned specifically can be obtained using a
special indexing structure a along with the axis are then used to classify a chromosome
based on a subsequence matching technique, another important feature is the mutual
information (MI), at this point a measure of the mutual dependence of two features is
introduced to improve the discriminative power of the automatic pairing algorithm, the
overall performance of the algorithm was 70.10% pairing accuracy[27].
2.4 Morphological Diagnosis
Morphological analyses still the most conventional method in diagnosing leukemia, since
the beginnings of FAB system which basically developed on morphological basis.
Morphology is the study of form, size, shape and structure rather than the function of a
given organ, it is a discretion of how white blood cells appears under the microscope,
consequently in order to classify the leukemic cells properly under the microscope special
Stains or Dyes has to be involved in the process by applying it directly to the blood smear,
and to discriminate variant types of blood cells that basically composed of red cells,
several types of the white cells, and platelets.

CHAPTER 2: LEUKEMIA DIAGNOSIS METHODS
20
2.4.1 Stains
The blood films are made by placing a drop of blood on one end of a slide, and using a
spreader slide to disperse the blood over the slide's length. The aim is to get a region where
the cells are spaced far enough apart to be counted and differentiated, then the blood smear
is treated with a specific Stains to unveil some hidden features. Stains are caused by the
chemical or physical interaction of two dissimilar materials; hence the White blood cells
are classified according to their propensity to certain types of stains with particular
substances, the shape of the nuclei and the granular inclusions.
Generally there are two methods of staining primary and secondary methods. At the
primary method the material that is trapped coats the underlying material, and the stain
reflects back light according to its own color, the secondary method involves a chemical or
molecular reaction between the material and the staining material. Many types of natural
stains fall into this category [28].
Cells are responding positively or negatively to the chemical reaction with respect to the
stain’s type. Most of the time stains come with a pair of colors Blue-Red or Black-
Blue...etc, therefore the term stain positive indicates that the cell has stained by the dark
color term of the stain, and negatively stains is a denotation of getting stained by the bright
color term of a that stain. The most commonly used stains in revealing distinct features of
the leukemic cells are as following, Figure 2.4 shows different leukemia stains:
2.4.1.1 Wright-Giemsa
It is a common type of stains since the ability of it to distinguish easily between the
variance types of blood cells. It became widely used for performing differential white
blood cell counts, which are routinely ordered when infections are expected. Giemsa stain
is used to differentiate nuclear and/or cytoplasmic morphology of platelets, RBCs, and
WBCs. This type of stains colors “Blue-Red to Pink” purple color is part of the color range
as well. It stains the Lymphocyte’s cytoplasm by blue and the nuclear varies from red to
purple[29].

CHAPTER 2: LEUKEMIA DIAGNOSIS METHODS
21
2.4.1.2 Myeloperoxidase (MPO)
The Myeloperoxidase stain distinguishes between the immature cells in acute or chronic
myeloblastic leukemia (cells stain positive) and those in acute and chronic lymphoblastic
leukemia (cells stain negative) [30].
2.4.1.3 Non-specific Esterase (NSE)
It colors Red/Brown, the non-specific esterase stain is most commonly used to confirm a
diagnosis of acute myelogenous leukemia. It is useful to be used in revealing features
pertained to monocytes leukemia which stains positively red if infected, applicable for
Megakaryocytic series as well. Lymphocytes may stain focally and negatively, and
occasionally myeloid cells other than monocytes will stain very weakly[31].
2.4.1.4 Sudan Black
It is a dye stains the fatty components of sebaceous secretions and sensitive to grease, oils
and sticky substances, and stains Blue-Black has the ability to distinguish between acute
lymphoblastic leukemia which stain positively Black, and acute myeloblastic leukemia
which stain negatively blue.
In this research all of the images downloaded from the University of Virginia, Health
System Department [32], were stained by the Wright-Giemsa since the familiarity of this
type, and the ability of it to reveal most of the distinct features characterizing each type of
white blood cells. That could be an advantage to set up a common ground from where all
of the images have been acquired and treated similarly under the same circumstances.
2.4.2 Previous Works Based on Morphological Features
In fact images obtained by microscopes coupled with a digital camera are simple to be
obtained, and can be more simply transmitted to clinical centers than liquid blood samples.
Furthermore images still a favorite target for computer based methods applying different
CHAPTER 2: LEUKEMIA DIAGNOSIS METHODS
22
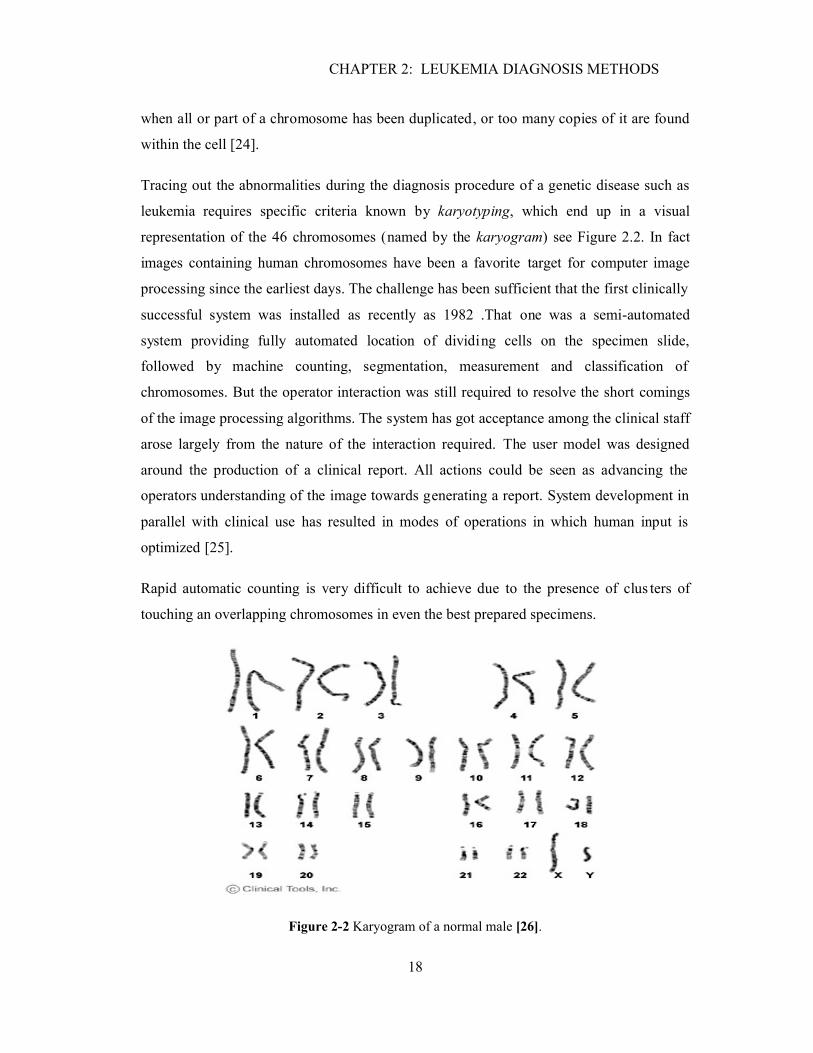
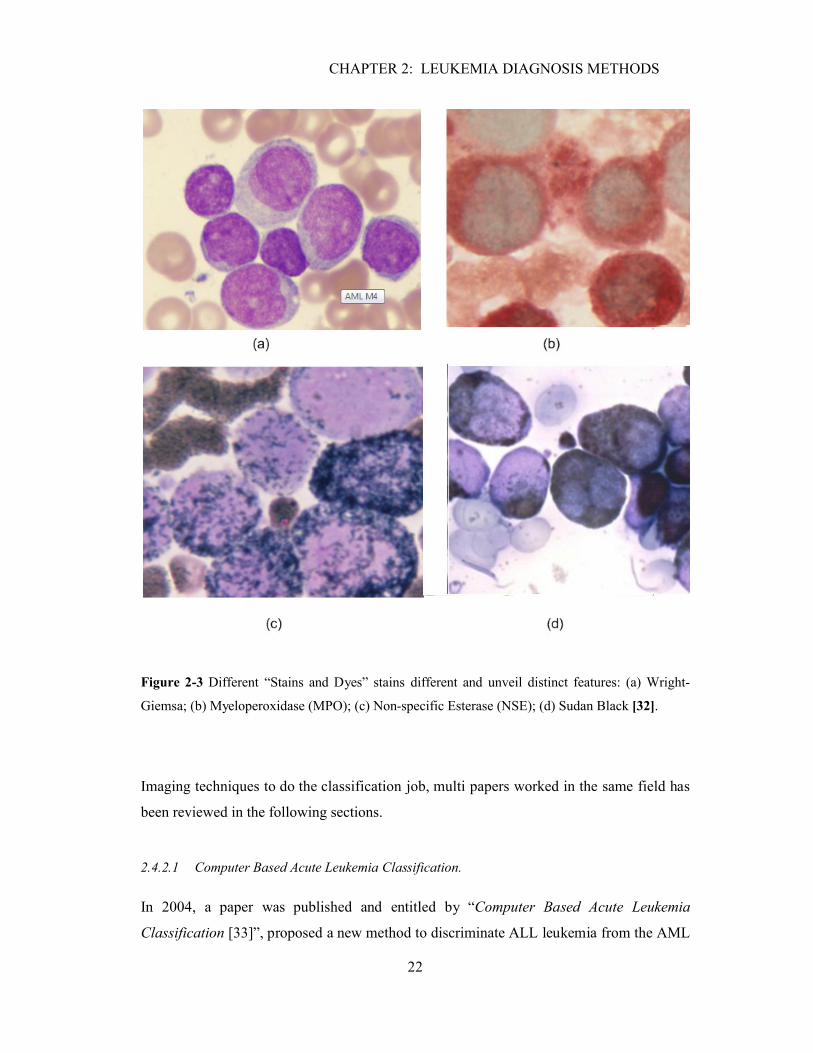
Figure 2-3 Different “Stains and Dyes” stains different and unveil distinct features: (a) Wright-
Giemsa; (b) Myeloperoxidase (MPO); (c) Non-specific Esterase (NSE); (d) Sudan Black [32].
Imaging techniques to do the classification job, multi papers worked in the same field has
been reviewed in the following sections.
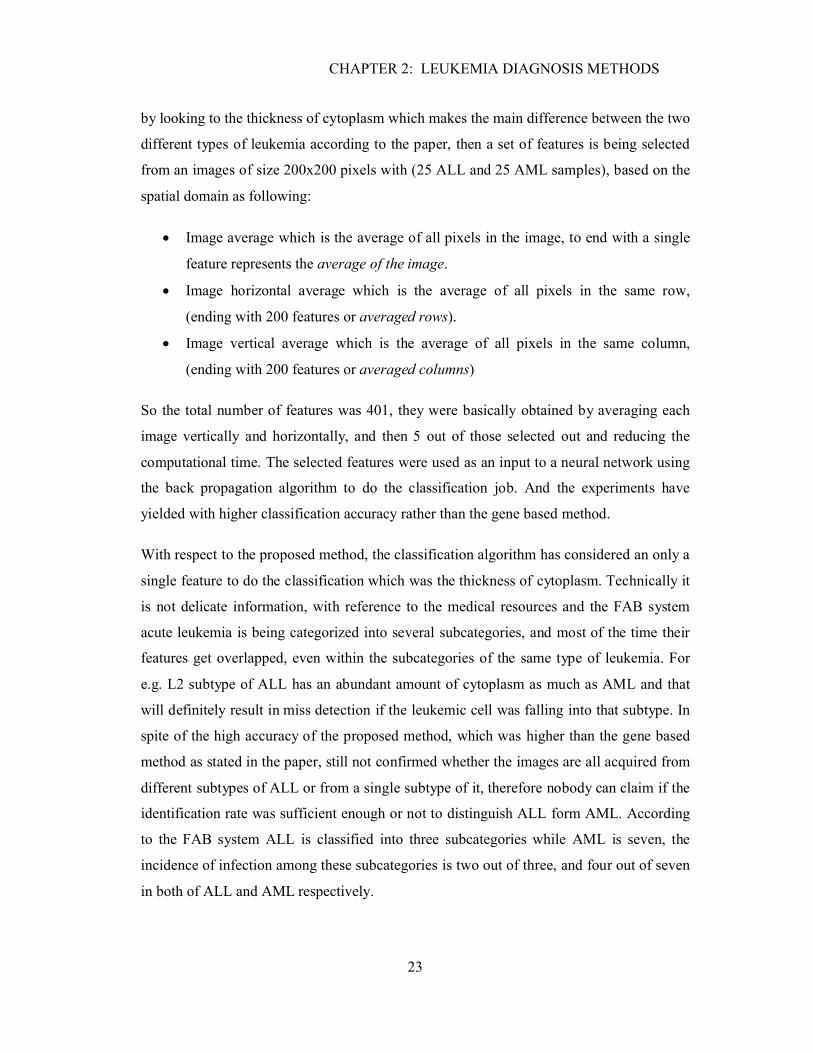
2.4.2.1 Computer Based Acute Leukemia Classification.
In 2004, a paper was published and entitled by “Computer Based Acute Leukemia
Classification [33]”, proposed a new method to discriminate ALL leukemia from the AML
CHAPTER 2: LEUKEMIA DIAGNOSIS METHODS
23
by looking to the thickness of cytoplasm which makes the main difference between the two
different types of leukemia according to the paper, then a set of features is being selected
from an images of size 200x200 pixels with (25 ALL and 25 AML samples), based on the
spatial domain as following:
Image average which is the average of all pixels in the image, to end with a single
feature represents the average of the image.
Image horizontal average which is the average of all pixels in the same row,
(ending with 200 features or averaged rows).
Image vertical average which is the average of all pixels in the same column,
(ending with 200 features or averaged columns)
So the total number of features was 401, they were basically obtained by averaging each
image vertically and horizontally, and then 5 out of those selected out and reducing the
computational time. The selected features were used as an input to a neural network using
the back propagation algorithm to do the classification job. And the experiments have
yielded with higher classification accuracy rather than the gene based method.
With respect to the proposed method, the classification algorithm has considered an only a
single feature to do the classification which was the thickness of cytoplasm. Technically it
is not delicate information, with reference to the medical resources and the FAB system
acute leukemia is being categorized into several subcategories, and most of the time their
features get overlapped, even within the subcategories of the same type of leukemia. For
e.g. L2 subtype of ALL has an abundant amount of cytoplasm as much as AML and that
will definitely result in miss detection if the leukemic cell was falling into that subtype. In
spite of the high accuracy of the proposed method, which was higher than the gene based
method as stated in the paper, still not confirmed whether the images are all acquired from
different subtypes of ALL or from a single subtype of it, therefore nobody can claim if the
identification rate was sufficient enough or not to distinguish ALL form AML. According
to the FAB system ALL is classified into three subcategories while AML is seven, the
incidence of infection among these subcategories is two out of three, and four out of seven
in both of ALL and AML respectively.
CHAPTER 2: LEUKEMIA DIAGNOSIS METHODS
24
2.4.2.2 Automatic Morphological Analysis for Acute Leukemia Identification in Peripheral Blood
Microscope Images.
Another paper was published in 2005 entitled by “Automatic Morphological Analysis for
Acute Leukemia Identification in Peripheral Blood Microscope Images” [34], the proposed
system was a sub-system considered to be final stage and part of fully integrated classifier.
The sub system handled the task to recognize weather the lymphocyte is blast or normal.
The paper has given attention to the three subtypes of ALL, but to detect without
subcategorizing, reconsidering the presence of any of the three types of blasts in the blood
film, the goal is achieved by a sequence of phases, and the work aimed to demonstrate that
the peripheral blood film observation can be fully automated.
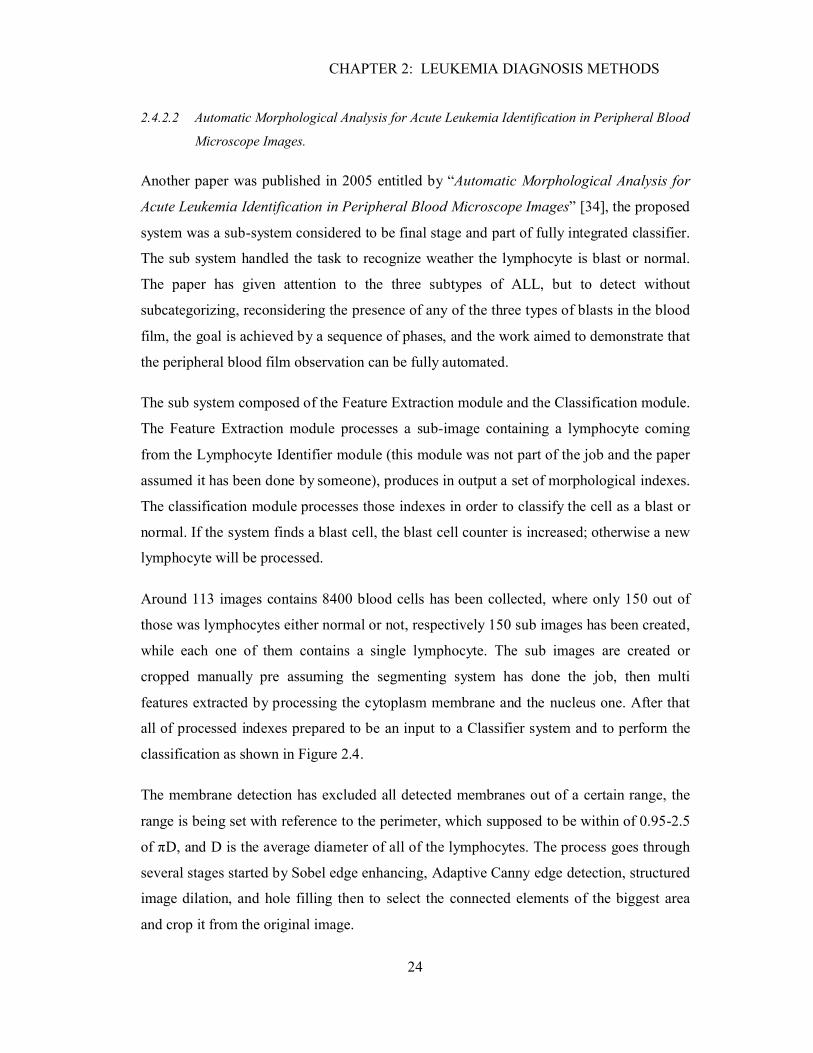
The sub system composed of the Feature Extraction module and the Classification module.
The Feature Extraction module processes a sub-image containing a lymphocyte coming
from the Lymphocyte Identifier module (this module was not part of the job and the paper
assumed it has been done by someone), produces in output a set of morphological indexes.
The classification module processes those indexes in order to classify the cell as a blast or
normal. If the system finds a blast cell, the blast cell counter is increased; otherwise a new
lymphocyte will be processed.
Around 113 images contains 8400 blood cells has been collected, where only 150 out of
those was lymphocytes either normal or not, respectively 150 sub images has been created,
while each one of them contains a single lymphocyte. The sub images are created or
cropped manually pre assuming the segmenting system has done the job, then multi
features extracted by processing the cytoplasm membrane and the nucleus one. After that
all of processed indexes prepared to be an input to a Classifier system and to perform the
classification as shown in Figure 2.4.
The membrane detection has excluded all detected membranes out of a certain range, the
range is being set with reference to the perimeter, which supposed to be within of 0.95-2.5
of πD, and D is the average diameter of all of the lymphocytes. The process goes through
several stages started by Sobel edge enhancing, Adaptive Canny edge detection, structured
image dilation, and hole filling then to select the connected elements of the biggest area
and crop it from the original image.

CHAPTER 2: LEUKEMIA DIAGNOSIS METHODS
25
Figure 2-4 Structure of the feature extraction and the classifier module at this research work [34].
The next step was to separate the cytoplasm region from the nuclear using the threshold
level to segment both of them in the cell image one of many techniques was being chosen
but in this paper was the Otsu's method.
Even though the system has difficulties in separating the membrane of all of the
lymphocytes since the presence of compact stacks of cells around the lymphocyte, and the
algorithms were not able to segment such cells as reported in that research work.
The extracted features had a pure mathematical style; all of the features have been
extracted throughout processing the membrane of both Cytoplasm, and the Nuclear.
Parameters like Area, Perimeter, Convex Area, Solidity, Major Axis Length, Orientation,
Filled Area and Eccentricity defined as standard procedures present in the Matlab Image
Processing Toolbox, then several classifiers used to do the job such as Feed-forward neural
networks with log-sigmoid activation function (FF-NN) and with two hidden layers have
been created by ranging the number of the hidden units from 2 to 50, they have used the
Back propagation algorithm as well, which again present in the Matlab Neural Network
Toolbox…etc.
CHAPTER 2: LEUKEMIA DIAGNOSIS METHODS
26
The paper has done a great job, even though nobody can claim a fully automated system
unless a perfect segmentation algorithm is developed to pick up and select only the
lymphocytes out of a huge number of mixed blood cells. On the other hand the extracted
features or parameters had the mathematical style and they are all having no medical
meaning. What if the pathologist or the expert could be provided with a meaningful
features saving their time to figure out those manually, then let him provide the system
with his own opinion, taking this in account in sync with the automated system results, and
finally to end up with a solid decision, and increase the reliability of the system, because it
is still far away to get an automated system 100% accurate and reliable.
2.5 Summary
This chapter has reviewed the most common methods used in diagnosing leukemia,
immunophenotype is looking at the antibiotic side of the WBC, and the analysis would be
useful and reliable if the flow cytometers are involved within the process, which has the
ability to measure the properties of individual particles and analyzing thousands of blood
cells at once. The method seems to be useful in analyzing features relevant to the acute
leukemia while it is not the case with chronic types. Cytogenetic is a powerful and
promising method but it has the disadvantage of long term process which takes usually
couple of weeks to prepare the samples and then to go through the pairing procedure.
Morphological analysis is still powerful as well as cytogenetics and still playing a main
role in classifying leukemia. Several papers have worked on the same field, in spite of their
great job some threats and cracks still found. One of the reviewed papers has relied on a
single feature to do the classification, leaving behind an essential fact that features usually
overlapping among different types of leukemia. Some others have done a classification on
the level of acute leukemia only, and the extracted features had a pure numerical quantities,
the time we could provide the expert or the pathologist with features that have an
importance in the medical field, thus extracting these features manually will not anymore
depends on the expert capability, and all required is his observation on the obtained results
then his decision will be considered in sync with the systems output to ensure the high
reliability.
CHAPTER 3: LEUKEMIC CELL SEGMENTATION
27
CHAPTER 3
CHAPTER 3: LEUKEMIC-CELL SEGMENTATION
3.1 Overview
Identification of the exact type of leukemia in patients during the early stages of the
disease will potentially increases the probability of recovery. Several diagnosis methods
are available; applying specific tests such as cytogenetic, immunophenotypes, or the
observation of morphological features in a microscopic image by an experienced
pathologist. The first two methods have a shown a successful in identifying leukemia
types, however, they have undesirable drawbacks such as, high cost, long term progress,
and identification accuracy. Morphological analyses of microscopic blood smear images
are requiring only an image, and that makes it suitable for low cost, fast processing, and
high accuracy.
This chapter proposes a novel method for segmenting leukemic cells and separating the
nuclei from the cytoplasm region. The first section provides a general description of the
processing stages, in addition to the database preparation and images archiving. The
remaining sections are illustrating the process of segmentation in details. The process is
initiated by developing a specific algorithm that will select the optimum bimodal
thresholds which have the main role in regions segregation. The following stages
comprises of: using morphological operators, image enhancement and eliminating the
unwanted objects, specifically, objects that may stick to the cytoplasm’s membrane due
inefficient manual extraction of the single cell images during the archiving process.
Finally, the nuclei and cytoplasm regions will be reconstructed from the original leukemia
image using fundamental image processing techniques.

CHAPTER 3: LEUKEMIC CELL SEGMENTATION
28
3.2 General Description of the Proposed Leukemia Identifying System
The diagnosing process of leukemia takes place once the examination of a blood smear
shows a presence of any of the blasts (Immature WBCs) in a blood smear; blasts are
situated in the bone marrow and they cannot be seen in the blood smear unless the blast-
cells invasion starts, once it happens the blasts will crowd out the healthy blood cells and
suddenly may spill out in the blood stream [35]. Besides, several tests could be performed
such as general blood counting; where leukemia causes a very high level of white blood
cells that may cause low levels of platelets and hemoglobin. It is useful to have a sample of
the bone marrow which presented by intensive number of blasts. Consequently if a
presence of these blasts in the blood smear is being confirmed, then it is recommended a
Biopsy which is a small part of the bone marrow the doctor may remove it from the
hipbone or another large bone. Pathologist uses a microscope to check the tissue and the
morphological indexes of those leukemic cells[36].
The input images to the proposed system will be cells that being extracted manually,
regardless if they were originated in a blood or bone marrow smear. A fact exist that blasts
could not be spilled out in the blood stream unless the invasion of leukemia starts; the
blasts can be easily recognized by an expert and distinguishing them from other blood
cells. Thus, extracting these single cell images manually is applicable; using any reliable
and easy tool such as Adobe Photoshop, Paint.net (it is a popular and free tool could be
downloaded from the internet), or even an available automated segmenting system can
perform this task.
Images from where the blasts have been extracted are downloaded from the available
database of leukemic cells at Virginia university [11]. The downloaded images were all
subjected to the same conditions, which is essential to achieve a reliable and coherent
accuracy. All of the blood cells amongst the downloaded images were stained by the
Wright-Giemsa (for more information review section four at the second chapter ), since it
has the ability to distinguish easily between different types of blood cells, the microscopic
images are acquired with an efficient magnification of 1000x, and the resolution was 170
pixel/cm.
CHAPTER 3: LEUKEMIC CELL SEGMENTATION
29
Totally 120 single leukemic cell images are cropped out of the original multi cell images,
using Paint.Net. It has to be noticed that all of the multi cell images were already identified
and categorized into different leukemia categories by experts at the department of
hematology in Virginia University. The cropped images are constructed at size of 200x200
and all provided with a white background without affecting the original resolution.
According to the pre known classification of those leukemic cells, single cell images have
been archived as they belong to their four major forms: Acute Lymphoblastic (ALL),
Acute Myeloblastic (AML), Chronic lymphoblastic (CML), and Chronic Myeloblastic
(CML) to end up with 30 single cell images per each form of leukemia.
The morphological features of any leukemic cell are situated whether inside the cytoplasm
or the nuclei region. Thus an efficient extraction of the indexed features in both regions
requires separating cytoplasm away from the nuclei; this procedure is known as
segmentation. Since the fact that cytoplasm and nuclei regions are almost uniform with
respect to the gray level intensity, an efficient separation of nuclei from cytoplasm could
be achieved using bimodal threshold segmentation. Then boundaries of both regions could
be traced out based on the principle of chain code, which described in more details during
the following sections[37].
A set of boundaries other than the desired membranes may result during the tracing
procedure, these unwanted objects requires to be eliminated, and that suggests a slight
enhancement on the thresholded image to get rid of these objects. Furthermore, filling up
the inner region inside each membrane is necessary before performing the boundary
tracing.
Finally, both of cytoplasm and nuclei regions have to be restored back, which provides two
enhanced images contain valuable information on the cell features. The process of
restoration is achieved by: firstly, filling up the inner regions of both membranes, and
secondly, intersecting them with the original image, where the remaining areas other than
the intersecting regions will be turned into zero pixels. The prescribed stages are discussed
in more details during the following sections, Figure 3.1 and 3.2 are showing a general
description of the segmentation system including the earlier discussed stages.
30
Figure 3-1 Dataset preparation as an input to the segmentation module.
31
Figure 3-2 General block diagram of the segmentation phase includes the extraction of nuclei and cytoplasm regions.
CHAPTER 3: LEUKEMIC CELL SEGMENTATION
32
3.3 Mutli Membrane Processing of a Leukemic Cell
This section shows in detail the several stages of the segmentation module. Segmentation
is a decision process, deciding whether or not a pixel belongs to an object, technically
different approaches are available to segment an image include pixel-based segmentation,
which is trivial in sense they do not take in account the spatial contents but only decide
solely on the base of pixel gray level. The other available technique is region-based
segmentation which looks into the probability distribution of the object and the
background; this is often associated with statistical analysis to evaluate an optimum
threshold [37].
Since the fact that both of nuclei and cytoplasm regions are often uniform with respect to
the gray level intensity, the gray level of the leukemic cell tends to be bimodal, Figure 3.3
shows the histogram distribution of a typical leukemic cell. The peaks at region A and C
come from the nuclei and cytoplasm areas respectively; the difference in heights between
region A and C referrers to the fact that nuclei area is larger in size than in cytoplasm.
3.3.1 Bimodal-Threshold Selection
Inspecting the histogram of a typical leukemic cell will show that the first optimum
bimodal threshold is located between the peaks A and C, and specifically within the B
region. Experiments showed that optimum threshold falls within the first 65% of the gray
level intensity. In a few limited cases it is found that the optimum segregation of both
regions sometimes exceeds the range of 65%, which requires extending the range from
65% to 75% in order to avoid any miss membrane detection. The proposed system will
locate the intensity level that holds to the average number of pixels within the first 65%
intensity levels. However, criterion is established to ensure if the amount of pixels within
the 65% range is reasonable or not, typically we have to count hundred pixels at least, if
not so, the range will be extended to 10%, and then the new range will be evaluated back
again using the same principle.
CHAPTER 3: LEUKEMIC CELL SEGMENTATION
33
Figure 3-3 Histogram distribution of a typical leukemic cell.
The optimum threshold of segmenting nuclei from cytoplasm can be defined as the
threshold that is suitable to segregate region A from C, there is no certain method of how
to select a threshold; it is relevant to the application, and many other available methods
could be reviewed at this reference [37]. The proposed method in this research is
suggesting a selection of an intensity level that holds to the average number of pixels
within the 65% or the 75% range. The proposed criterion is expressed in terms of Equation
3.1 and 3.2 as shown below.
Avg� =∑ �(�)������
∑ I������
, ∀ P(I) ≠ 0 3.1
TH� = I|�(�)�����255 3.2
CHAPTER 3: LEUKEMIC CELL SEGMENTATION
34
where AvgD is average number of pixels distribution over the range, discarding the zero-
pixel intensity levels, P is the number of pixels at a certain intensity level I, and THN is the
first threshold level that is optimum to separate nuclei’s region from cytoplasm.
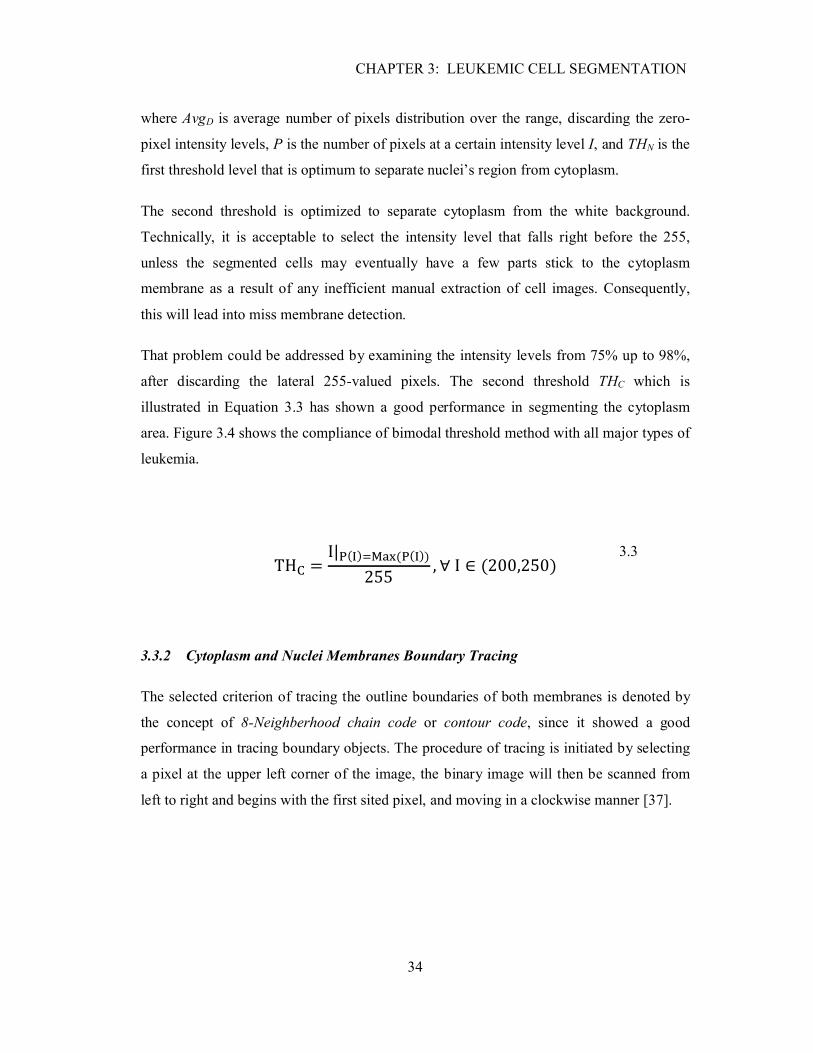
The second threshold is optimized to separate cytoplasm from the white background.
Technically, it is acceptable to select the intensity level that falls right before the 255,
unless the segmented cells may eventually have a few parts stick to the cytoplasm
membrane as a result of any inefficient manual extraction of cell images. Consequently,
this will lead into miss membrane detection.
That problem could be addressed by examining the intensity levels from 75% up to 98%,
after discarding the lateral 255-valued pixels. The second threshold THC which is
illustrated in Equation 3.3 has shown a good performance in segmenting the cytoplasm
area. Figure 3.4 shows the compliance of bimodal threshold method with all major types of
leukemia.
TH� = I|�(�)����(�(�))255 , ∀ I ∈ (200,250)
3.3
3.3.2 Cytoplasm and Nuclei Membranes Boundary Tracing
The selected criterion of tracing the outline boundaries of both membranes is denoted by
the concept of 8-Neighberhood chain code or contour code, since it showed a good
performance in tracing boundary objects. The procedure of tracing is initiated by selecting
a pixel at the upper left corner of the image, the binary image will then be scanned from
left to right and begins with the first sited pixel, and moving in a clockwise manner [37].
CHAPTER 3: LEUKEMIC CELL SEGMENTATION
35
Figure 3-4 Compliance of Bimodal-thresholds method with all four types of leukemia.
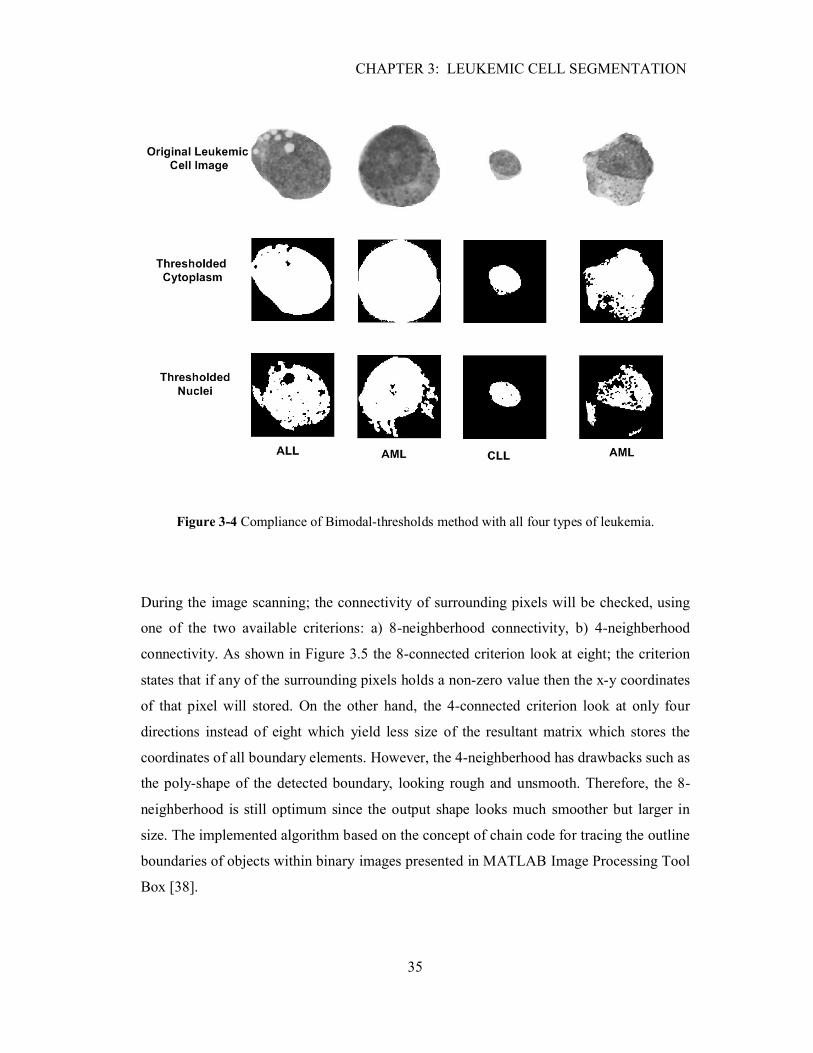
During the image scanning; the connectivity of surrounding pixels will be checked, using
one of the two available criterions: a) 8-neighberhood connectivity, b) 4-neighberhood
connectivity. As shown in Figure 3.5 the 8-connected criterion look at eight; the criterion
states that if any of the surrounding pixels holds a non-zero value then the x-y coordinates
of that pixel will stored. On the other hand, the 4-connected criterion look at only four
directions instead of eight which yield less size of the resultant matrix which stores the
coordinates of all boundary elements. However, the 4-neighberhood has drawbacks such as
the poly-shape of the detected boundary, looking rough and unsmooth. Therefore, the 8-
neighberhood is still optimum since the output shape looks much smoother but larger in
size. The implemented algorithm based on the concept of chain code for tracing the outline
boundaries of objects within binary images presented in MATLAB Image Processing Tool
Box [38].
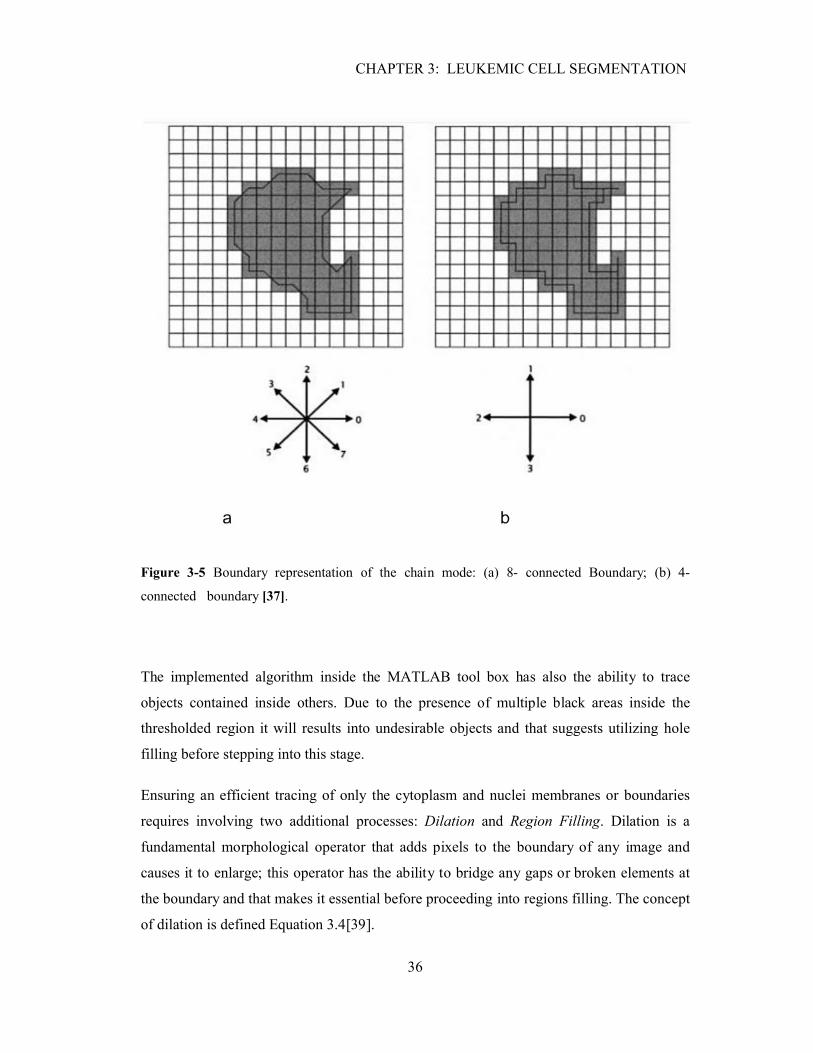
CHAPTER 3: LEUKEMIC CELL SEGMENTATION
36
Figure 3-5 Boundary representation of the chain mode: (a) 8- connected Boundary; (b) 4-
connected boundary [37].
The implemented algorithm inside the MATLAB tool box has also the ability to trace
objects contained inside others. Due to the presence of multiple black areas inside the
thresholded region it will results into undesirable objects and that suggests utilizing hole
filling before stepping into this stage.
Ensuring an efficient tracing of only the cytoplasm and nuclei membranes or boundaries
requires involving two additional processes: Dilation and Region Filling. Dilation is a
fundamental morphological operator that adds pixels to the boundary of any image and
causes it to enlarge; this operator has the ability to bridge any gaps or broken elements at
the boundary and that makes it essential before proceeding into regions filling. The concept
of dilation is defined Equation 3.4[39].
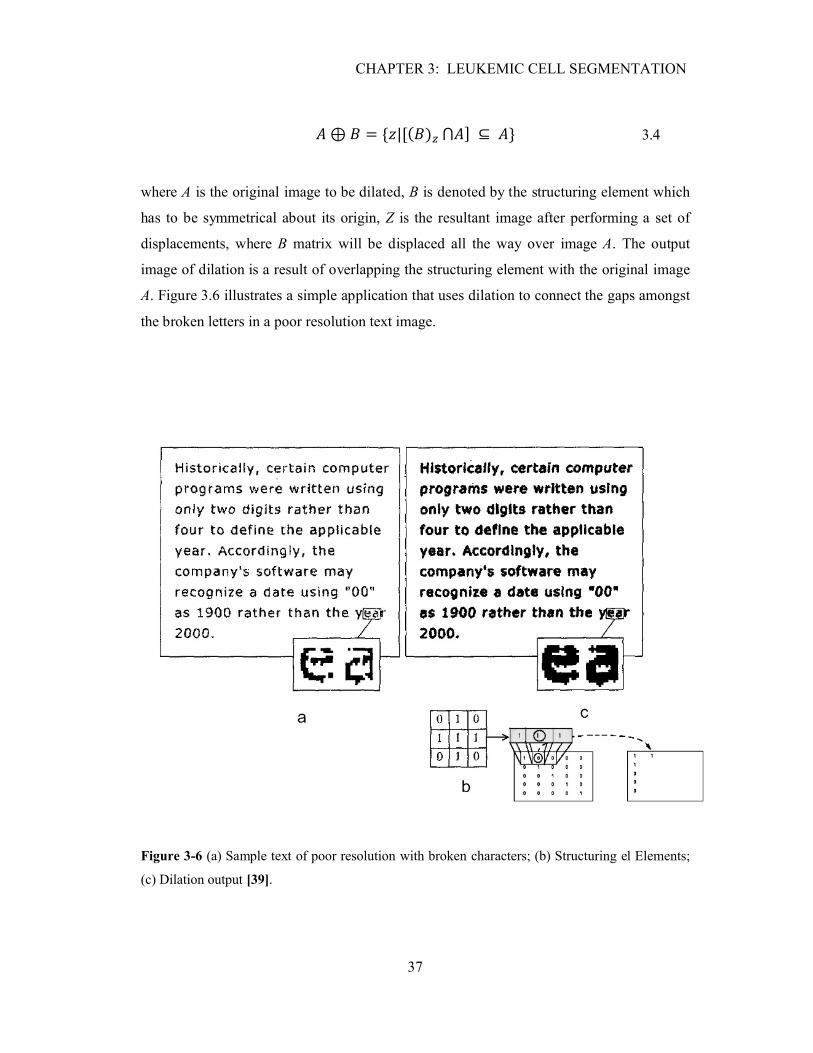
CHAPTER 3: LEUKEMIC CELL SEGMENTATION
37
� ⊕ � = {�|[(�)� ⋂�] ⊆ �} 3.4
where A is the original image to be dilated, B is denoted by the structuring element which
has to be symmetrical about its origin, Z is the resultant image after performing a set of
displacements, where B matrix will be displaced all the way over image A. The output
image of dilation is a result of overlapping the structuring element with the original image
A. Figure 3.6 illustrates a simple application that uses dilation to connect the gaps amongst
the broken letters in a poor resolution text image.
Figure 3-6 (a) Sample text of poor resolution with broken characters; (b) Structuring el Elements;
(c) Dilation output [39].
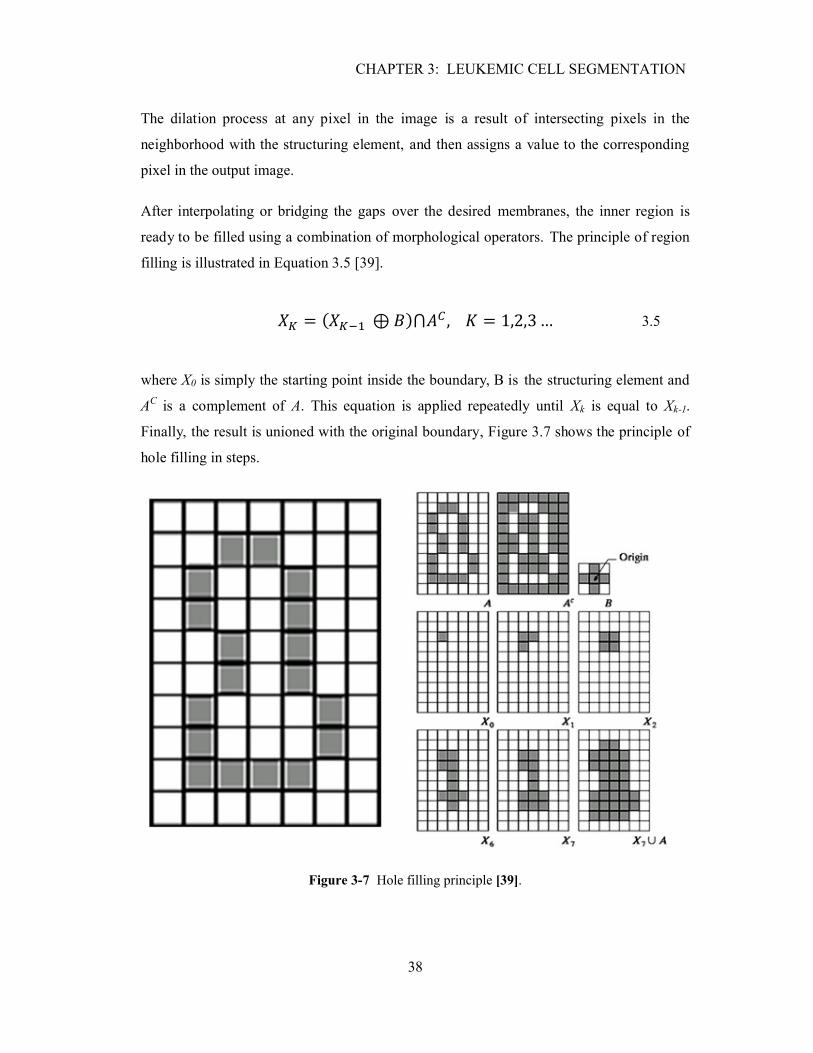
CHAPTER 3: LEUKEMIC CELL SEGMENTATION
38
The dilation process at any pixel in the image is a result of intersecting pixels in the
neighborhood with the structuring element, and then assigns a value to the corresponding
pixel in the output image.
After interpolating or bridging the gaps over the desired membranes, the inner region is
ready to be filled using a combination of morphological operators. The principle of region
filling is illustrated in Equation 3.5 [39].
�� = (���� ⊕ �)⋂�� , � = 1,2,3 … 3.5
where X0 is simply the starting point inside the boundary, B is the structuring element and
AC is a complement of A. This equation is applied repeatedly until Xk is equal to Xk-1.
Finally, the result is unioned with the original boundary, Figure 3.7 shows the principle of
hole filling in steps.
Figure 3-7 Hole filling principle [39].
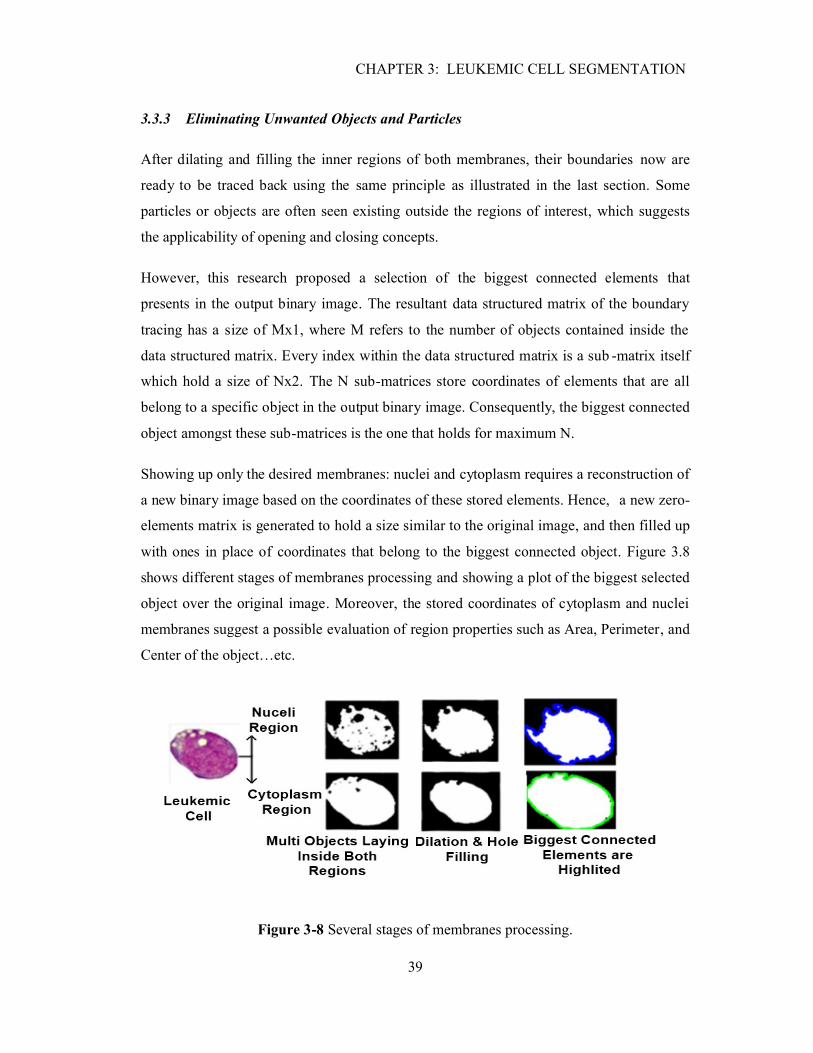
CHAPTER 3: LEUKEMIC CELL SEGMENTATION
39
3.3.3 Eliminating Unwanted Objects and Particles
After dilating and filling the inner regions of both membranes, their boundaries now are
ready to be traced back using the same principle as illustrated in the last section. Some
particles or objects are often seen existing outside the regions of interest, which suggests
the applicability of opening and closing concepts.
However, this research proposed a selection of the biggest connected elements that
presents in the output binary image. The resultant data structured matrix of the boundary
tracing has a size of Mx1, where M refers to the number of objects contained inside the
data structured matrix. Every index within the data structured matrix is a sub -matrix itself
which hold a size of Nx2. The N sub-matrices store coordinates of elements that are all
belong to a specific object in the output binary image. Consequently, the biggest connected
object amongst these sub-matrices is the one that holds for maximum N.
Showing up only the desired membranes: nuclei and cytoplasm requires a reconstruction of
a new binary image based on the coordinates of these stored elements. Hence, a new zero-
elements matrix is generated to hold a size similar to the original image, and then filled up
with ones in place of coordinates that belong to the biggest connected object. Figure 3.8
shows different stages of membranes processing and showing a plot of the biggest selected
object over the original image. Moreover, the stored coordinates of cytoplasm and nuclei
membranes suggest a possible evaluation of region properties such as Area, Perimeter, and
Center of the object…etc.
Figure 3-8 Several stages of membranes processing.
CHAPTER 3: LEUKEMIC CELL SEGMENTATION
40
3.3.4 Image Reconstruction of Cytoplasm and Nuclei Regions
Image restoration attempts to reconstruct and recover an image has been degraded, and
since a prior knowledge to the degradation phenomena is already known, an inverse
process could be applied to recover back the original image or even the regions of interest.
Therefore if the original leukemic cell image is being defined as L(x,y), nuclei filled up
region as N(x,y), and the cytoplasm filled up region as C(x,y), then the following formulas
represented in Equations 3.6 and 3.7 are applicable to recover back the nuclei and
cytoplasm regions respectively, since both of the restored regions contain valuable
information about the leukemic cells features.
��(�, �) = �(�, �). �(�, �) 3.6
��(�, �) = �(�, �). ��(�, �). �(�, �) 3.7
LN and LC represent the reconstructed regions of both nuclei and cytoplasm respectively.
The nuclei region recovery could be obtained by convoluting both of the matrices L and N
in the spatial domain, or simply applying whether an elements dot production or
intersecting them logically using an AND operator.
On the other hand, recovering cytoplasm could not be achieved the same way, since it
requires an elimination of the nuclei region at first. Thus dot production of LC with the
original image L will set only the background area outside the cytoplasm region to zeros
whereas the inner region remains unaffected. This problem could be addressed firstly, by
complementing the nuclei region to form NC, secondly, multiply it by the whole set to
extract the nuclei out. NC is obtained by XOR all of N(x,y) elements with a matrix of one-
valued elements that shall also have a size of N. As a result of the XOR operation the black
background outside the nuclei will be turned into one’s and vice versa. Figure 3.8 shows
both of cytoplasm and nuclei regions after the restoration process.

CHAPTER 3: LEUKEMIC CELL SEGMENTATION
41
Figure 3-9 Regions Reconstruction process.
3.4 Summary
This chapter has discussed different methodologies, and developed several respective
algorithms which have yielded in successful segmentation of nuclei and cytoplasm regions.
The region-based segmentation has shown a powerful and good performance, since it is
taking in account the spatial contents of an image. Due to empirical tests it is found that the
first bimodal threshold is located at the first 75% of the gray-level intensity scale, whereas
the second threshold suggested an examination of intensity levels that ranges from 75% to
98%, after discarding the lateral 255-valued pixels. Both of hole filling and dilation were
essential to build up the bridges over the broken boundaries and preparing the leukemic
cell image to be traced efficiently. Finally, the last stage of segmentation was regions
recovery using a set of fundamental image processing techniques such as unioning,
intersecting, and color inverting. The segmentation phase has provided us with two
enhanced images that contain valuable information on the leukemic cell features and then
shall be used as an input to the next following stages.
CHAPTER 4: MORPHOLOGICAL FEATURE EXTRACTION
42
CHAPTER 4
CHAPTER 4: MORPHOLOGICAL FEATURE EXTRACTION
4.1 Overview
The term of Morphological which appears at the title of this section refers to the study of
form, size, shape and structure of a given organ, this illustration is mandatory to avoid any
confusion with the Morphological Operations as part of the image processing techniques.
Hence wherever the term of Morphological Features appears in this research; it refers to
the appearance of white blood cells under the microscope, for further information on
morphological variations amongst leukemia types review the fourth section in the literature
review.
This research shows the effectiveness of implementing an automated identification system
that is morphologically-based, where the extracted feature medically meaningful. Thus the
expert will be able to have a fast prediction due to the observation of these readable
numerical quantities as a result of unique features extraction.
This chapter reviews an implementation of an automated features extraction module that
will be able to extract efficiently nine distinct features out of a single leukemic cell using
different methodologies and techniques based on different concepts. The nine extracted
features are: Cell Diameter, Nuclei to Cytoplasm ratio, Amount of Cytoplasm, Shape and
Regularity of the Nuclei Region, Cytoplasmic Vacuolations, Cytoplasmic Basophilia or
Granules, Coalescent Existence, Ovality, and the Nucleolus Visibility.

CHAPTER 4: MORPHOLOGICAL FEATURE EXTRACTION
43
4.2 General Description of the Morphological Feature Extraction Process.
The proposed method is intended to extract features that are medically meaningful rather
being mere numerical values. Previous research works attempted to identify leukemia
using parameters such as Area, Perimeter, Convex Solidity, Major Axis Length,
Orientation, Filled Area and Eccentricity as they presented in the Matlab Image Processing
Toolbox. Other papers have proposed a method to identify leukemia based on a single
feature extraction such as the thickness of cytoplasm, which is medically inefficient and
useless due to the overlapping amongst different types of leukemia [16].
The two output enhanced images from the segmentation stage contains valuable
information on the cell features. Figure 4.1 shows the main stages of extracting these nine
unique features based on different aspects, where each feature is obtained by an individual
and specific process.
The nine extracted features are: Cell Diameter, Nuclei to Cytoplasm ratio, Amount of
Cytoplasm, Shape and Regularity of the Nuclei Region, Cytoplasmic Vacuolations,
Cytoplasmic Basophilia or Granules, Coalescent Existence, Ovality (How circular the
Nuclei is), Nucleolus Appearance. For further information read the fourth section in the
literature review.
In fact the extracted features correlate to shape a unique form or sequence that is relevant
to one of the four major types of leukemia. Consequently, the identification process could
be achieved by subjecting the extracted features to a set of rules which based on the
morphological variations as they already summarized in Table 1.1 in the literature review.

CHAPTER 4: MORPHOLOGICAL FEATURE EXTRACTION
44
Figure 4-1 General description of the identification process.
4.2.1 Cell Diameter (DC,N )
This feature refers to the cell size, and it is directly relevant to the cytoplasm membrane
since it reflects the cell’s size. Furthermore, it is useful to resolve the diameter of both
nuclei and the cytoplasm regions, since the difference between both diameters could be
checked and verified if it is reasonable or not, and this can provide the system with a
feedback to ensure if the nuclei region were extracted accurately or not.
Blood cells in general having a shape of circle, the cell diameter could be defined
mathematically as the squared ratio of the area filling inside the tightest cytoplasm’s
membrane divided by pi and all multiplied by two. This definition is not sufficient unless
two additional factors are taken in account:

CHAPTER 4: MORPHOLOGICAL FEATURE EXTRACTION
45
Microscopic Magnification Power (ρ): the power of magnification refers to how
many times things will look larger than its actual size under the microscope, where
the power of magnification for all dataset images is indicated by 1000x [40].
Image Resolution (σ): it describes the detail an image holds, resolution quantifies
refer to how close lines can be to each other, from a pixel point view other
conventions are citing resolution as the number of pixels per length unit[41]. The
resolution of all acquired images were 170 pixels/cm or 17000 pixels/m.
Medically a convention is established to measure cell diameters are in the scale of
micrometers. The previous definition for measuring the cell diameter could be redefined
now using both of magnification power and image resolution in order to refer the cell back
to its actual size and then to perform a scale conversion from pixels to metric. Equation 4.1
is expressing the whole process into its mathematical form.
D� = 2 ∗ 10� ∗ �� ∑ C(x, y)������
������
� (� ∗ �)� , ∀�(�, �) ≠ 0 4.1
where C(x,y) is the cytoplasm region filled with all ones inside, ρ and σ are magnification
power and the resolution respectively. To express the results in terms of µm instead of m;
the resolved diameter has been multiplied by 106. Similar formula is also applicable to
resolve the diameter of nuclei using N(x,y) to replace C(x,y) as shown in Equation 4.2.
D� = 2 ∗ 10� ∗ �� ∑ N(x, y)������
������
� (� ∗ �)� , ∀�(�, �) ≠ 0 4.2
CHAPTER 4: MORPHOLOGICAL FEATURE EXTRACTION
46
4.2.2 Nuclei to Cytoplasm Ratio (�)
This feature is dimensionless since it describes the ratio in areas between the nuclei and
cytoplasm. It is obvious that nuclei region is always less in size than cytoplasm, which
turns the ratio to be always less than one or 100%. Referring back to Table 1.1 in the
literature review, it can be noticed how sophisticated the process of identification, and it
shows the inefficiency of a system that relies on using single feature with its decision; the
overlapping amongst different types of leukemia is remarkable, as an example ALL and
CLL are frequently sharing the same range of �. Equation 4.3 shows the mathematical
representation of �.
ζ = 100 ∗� ∑ N(x, y)���
���������
� ∑ C(x, y)������
������
, ∀� & �(�, �) ≠ 0 4.3
4.2.3 Cytoplasm Amount (Ac)
It refers to the area filling between the cytoplasm and nuclei membranes. This feature is
simply obtained by subtracting the nuclei’s filled up region which denoted by N(x,y) from
the cytoplasm’s region C(x,y). Equation 4.4 shows the principle of evaluating this feature.
A� = 100 ∗
⎣⎢⎢⎢⎡� � C(x, y)
���
���
���
���
− � � N(x, y)���
���
���
��� ⎦⎥⎥⎥⎤
, ∀� & �(�, �) ≠ 0 4.4
CHAPTER 4: MORPHOLOGICAL FEATURE EXTRACTION
47
4.2.4 Nuclear Shape & Regularity (α, β)
The Nuclear Shape usually varies from round, oval to Bizarre and reniform (having the
form or shape of a kidney or leaf). The term of Regularity (β) could be defined as a
description of how regular the nuclei membrane or the internal boundary of a leukemic
cell. Based on this definition the shape of nuclei is considered to be most regular when all
of the boundary elements have the same distance (DN) away from the cell’s central point,
and irregular when most of the elements vary in their distances from the origin. Irregularity
of the nuclei could be classified as a distinct feature for AML leukemic cells; since most of
the subcategories falling within this type seem irregular in their shape.
The term of Ovality or Non-Circularity is the degree of deviation from a perfect
circularity[42]. Therefore cells tend to be perfectly circular if the ratio between the minor
axis (the shortest diameter of ellipse) and the major axis (the longest diameter of ellipse) is
one or 100%. Cells vary in their Ovality and they are completely oval or having the form
of (straight line) if their Ovality is downgraded to zero.
Based on the definition of regularity; the distance for all elements that lay over the nuclei
boundary has to be measured from the cell’s origin point. Cells are different with respect to
their central points, and in order to standardize the process of evaluating regularity; all the
cells shall have the same central point. This problem is addressed by proposing an
assumption that shifts all central points of all leukemic cells to the zero-origin. This is
achieved by subtracting the coordinates of the x-axis boundary elements from the average
value of all boundary positions laying over the x-axis, where the same process is also
repeated for the y-axis boundary elements as it shown in Equation 4.5 and 4.6. Figure 4.2
shows the boundary of a typical leukemic cell before and after shifting the central point to
the zero origin.
� = 1� � ��(�, 1)
�
���, � = 1
� � ��(�, 2)�
���4.5
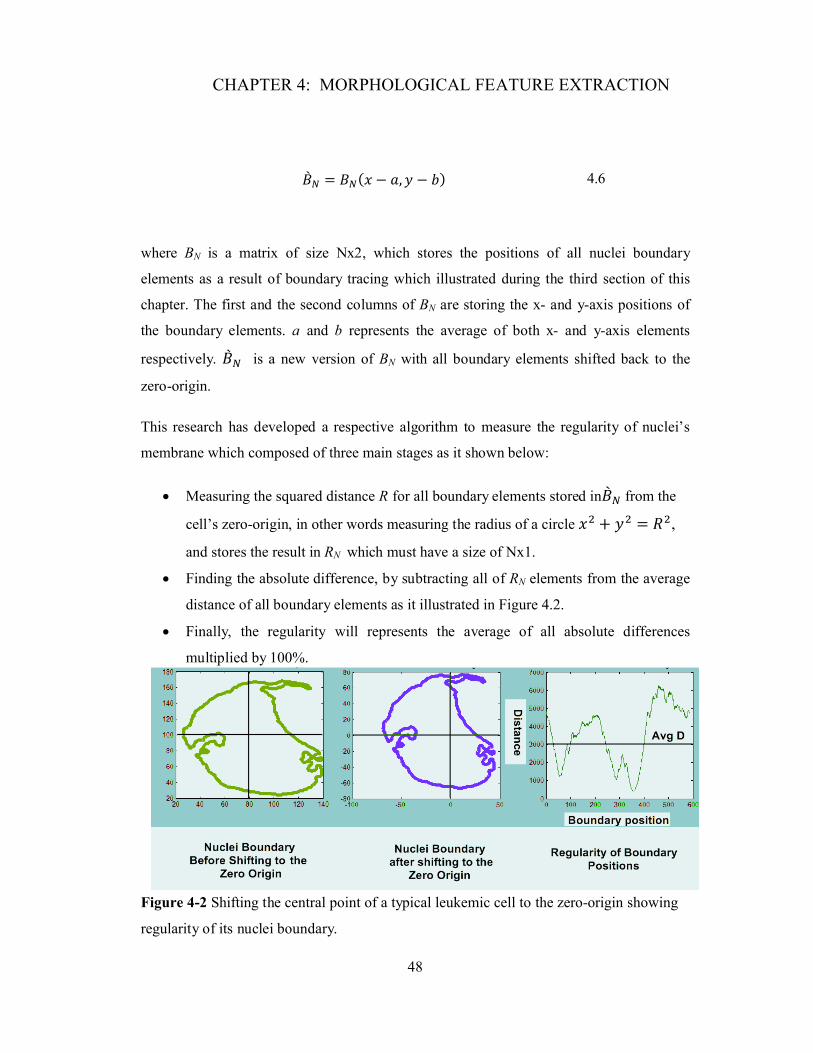
CHAPTER 4: MORPHOLOGICAL FEATURE EXTRACTION
48
�� � = ��(� − �, � − �) 4.6
where BN is a matrix of size Nx2, which stores the positions of all nuclei boundary
elements as a result of boundary tracing which illustrated during the third section of this
chapter. The first and the second columns of BN are storing the x- and y-axis positions of
the boundary elements. a and b represents the average of both x- and y-axis elements
respectively. �� � is a new version of BN with all boundary elements shifted back to the
zero-origin.
This research has developed a respective algorithm to measure the regularity of nuclei’s
membrane which composed of three main stages as it shown below:
Measuring the squared distance R for all boundary elements stored in�� � from the
cell’s zero-origin, in other words measuring the radius of a circle �� + �� = ��,
and stores the result in RN which must have a size of Nx1.
Finding the absolute difference, by subtracting all of RN elements from the average
distance of all boundary elements as it illustrated in Figure 4.2.
Finally, the regularity will represents the average of all absolute differences
multiplied by 100%.
Figure 4-2 Shifting the central point of a typical leukemic cell to the zero-origin showing
regularity of its nuclei boundary.
CHAPTER 4: MORPHOLOGICAL FEATURE EXTRACTION
49
The developed respective algorithms for measuring each of regularity (β), and circularity
(α) are expressed in terms of equation 4.7 and 4.8 respectively.
β = 100 ∗ 1� ����(�, 1) − �����
�
���4.7
α = 100 ∗ ���(��)���(��)
4.8
4.2.5 Cytoplasmic vacuolation (VC)
It is a small cavity inside the cytoplasm region tends to be white in color, bounded by a
single membrane, and containing water, food, or metabolic waste. The existence of
vacuolation is often associated with a known infection by the third subcategory of ALL.
The extraction of this feature begins right after the restoration of cytoplasm’s region where
that reduces the probability of miss detection with nucleolus, since they are both sharing
the same characteristics.
The proposed criterion is considering the topographical nature of the interested region.
Grayscale images can be thought of in three dimensions: the x- and y-axes present the
coordinates of pixels locations in an image and the z-axis represents the intensity of each
pixel. In this interpretation, the intensity values could be represented as elevations, as in a
topographical map, this concept is known as peaks and valleys. They both represent areas
in an image which holds for high and low intensity levels respectively[43], where this
morphological feature has the advantage of marking relevant image objects. Figure 4.3
represents a typical 2-D leukemic cell (ALL-L3) which has been extruded into 3-D form,
and it shows how vacuolations differ in their elevation from the surrounded pixels, whereas
the intensity levels are addressing the elevation in this 3-D image.
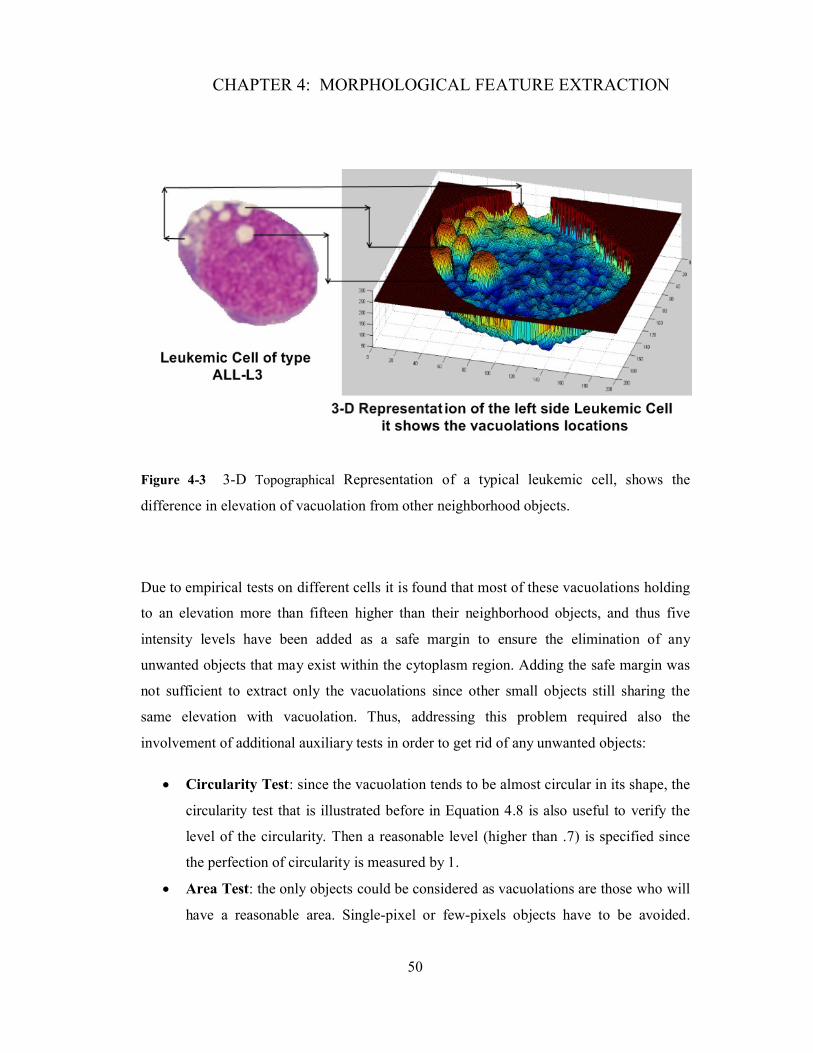
CHAPTER 4: MORPHOLOGICAL FEATURE EXTRACTION
50
Figure 4-3 3-D Topographical Representation of a typical leukemic cell, shows the
difference in elevation of vacuolation from other neighborhood objects.
Due to empirical tests on different cells it is found that most of these vacuolations holding
to an elevation more than fifteen higher than their neighborhood objects, and thus five
intensity levels have been added as a safe margin to ensure the elimination of any
unwanted objects that may exist within the cytoplasm region. Adding the safe margin was
not sufficient to extract only the vacuolations since other small objects still sharing the
same elevation with vacuolation. Thus, addressing this problem required also the
involvement of additional auxiliary tests in order to get rid of any unwanted objects:
Circularity Test: since the vacuolation tends to be almost circular in its shape, the
circularity test that is illustrated before in Equation 4.8 is also useful to verify the
level of the circularity. Then a reasonable level (higher than .7) is specified since
the perfection of circularity is measured by 1.
Area Test: the only objects could be considered as vacuolations are those who will
have a reasonable area. Single-pixel or few-pixels objects have to be avoided.
CHAPTER 4: MORPHOLOGICAL FEATURE EXTRACTION
51
Never found a vacuolation with an area less than 10, and the areas average was
ranging in size from about 30 to 100 pixels2.
All of the objects with intensity levels higher than 20 and satisfying the previously
mentioned criteria will be considered as vacuolation. Since vacuolations are uniform with
respect to their intensity level; they were found distinct from their neighborhood pixels.
Cells infected with the presence of vacuolations often tend to have many of it; Equation 4.9
shows the principle of vacuolation detection based on the concept of peaks rather than
valleys. The algorithm at each pixel will scan the elevations of all 4-neighborhood pixels
surrounding it in four directions: East, West, North, and South, then if any of them was less
than the corresponding pixel by 20 a value of 1 will be set to that pixel.
��� (� + �, � + �) = �0, ��(� + �, � + �) < ��(� + �, � + �)|�,�,�,� + 201, ��(� + �, � + �) ≥ ��(� + �, � + �)|�,�,�,� + 20
�
∀ �|���,�,�… = 0,1,2 …
4.9
The following step is counting the total number of objects detected within the binarized
output image ��� . A respective algorithm is developed to scan the image from left to right,
once it finds an on pixel; the connectivity of 4-neihberhood pixels will be checked
consequently in four directions, and if any of them was connected to that pixel they will be
all set to 1 to label the first object.
The scanning will proceed to the following pixels, and once it hits a zero valued pixel or a
miss connectivity followed by connectivity; the new whole set of the second object will be
labeled by 2…etc. The process will keep scanning whole the image column by column
until all of the connected objects are labeled from 1 to VC, which is the total number of
vacuolations. Figure 4.4 shows the processing stages of extracting vacuolations.
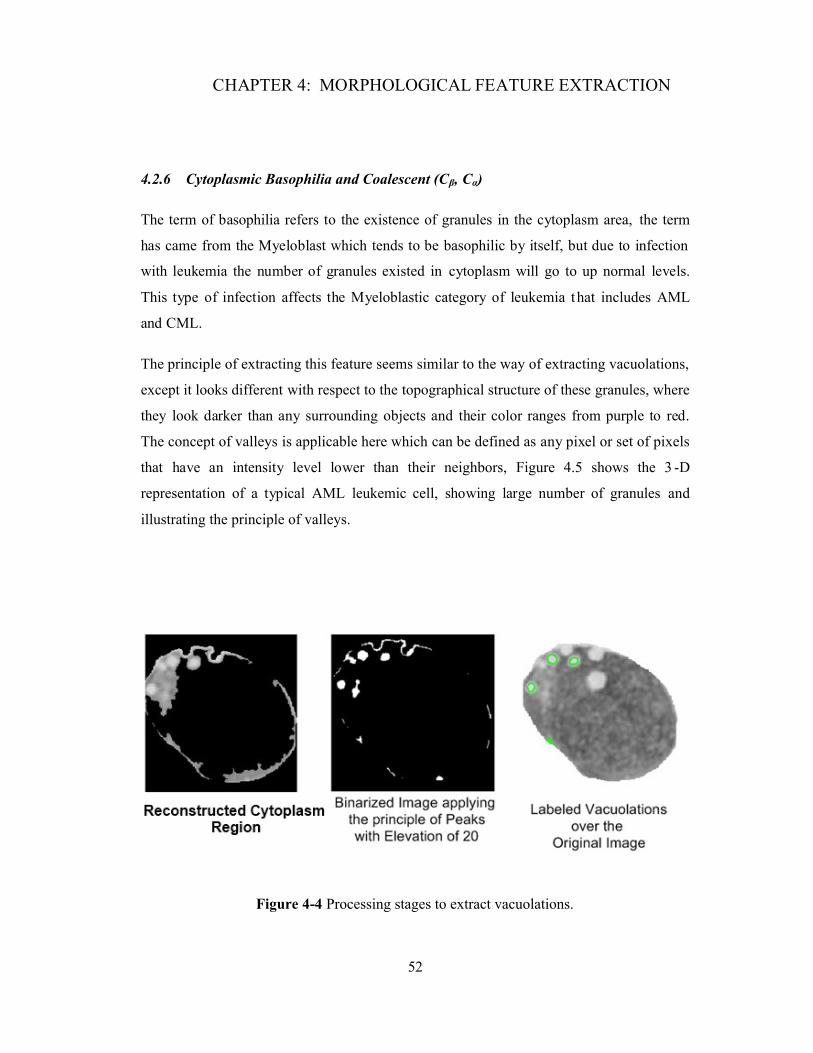
CHAPTER 4: MORPHOLOGICAL FEATURE EXTRACTION
52
4.2.6 Cytoplasmic Basophilia and Coalescent (Cβ, Cα)
The term of basophilia refers to the existence of granules in the cytoplasm area, the term
has came from the Myeloblast which tends to be basophilic by itself, but due to infection
with leukemia the number of granules existed in cytoplasm will go to up normal levels.
This type of infection affects the Myeloblastic category of leukemia that includes AML
and CML.
The principle of extracting this feature seems similar to the way of extracting vacuolations,
except it looks different with respect to the topographical structure of these granules, where
they look darker than any surrounding objects and their color ranges from purple to red.
The concept of valleys is applicable here which can be defined as any pixel or set of pixels
that have an intensity level lower than their neighbors, Figure 4.5 shows the 3 -D
representation of a typical AML leukemic cell, showing large number of granules and
illustrating the principle of valleys.
Figure 4-4 Processing stages to extract vacuolations.
CHAPTER 4: MORPHOLOGICAL FEATURE EXTRACTION
53
Granules often goes ten intensity levels down their neighborhoods, thus a safe margin of
five levels extra are useful to exclude any unwanted objects that may share the granules
characteristics. There is no restriction on the size of granules since they are varying from
few-pixels to large accumulation of pixels which lead to another feature namely,
coalescent. Equation 4.10 applies the principle of valleys on the gray-level restored image
of cytoplasm, then all of the objects within the output image have to be labeled.
���� (� + �, � + �) = �1, ��(� + �, � + �) < ��(� + �, � + �)|�,�,�,� − 150, ��(� + �, � + �) ≥ ��(� + �, � + �)|�,�,�,� − 15
�
∀ �|���,�,�… = 0,1,2 …
4.10
The binarized output image �� �� contains several objects which refer to the detected granules
in the restored image of cytoplasm. Moreover, the detected objects will be labeled from 1
to ��� . The size of the detected granules could be evaluated using the Matlab Image
Processing Tool Box which provides several options relevant to the region properties.
However, granules that are larger in size than others indicate the presence of coalescent,
which results from the granules accumulation in the cytoplasm region.
Coalescents are a result of granules accumulation in cytoplasm, and assert the presence of
Myeloid leukemia AML and CML. Therefore, during the granules count; coalescent has to
be divided into several granules before estimating the total number granules (��� ).
Several empirical tests on our database indicate a typical size of coalescent higher than 60.
Thus, for any object having a size more than 60, using the region properties, will be
considered as a coalescent (Cα).
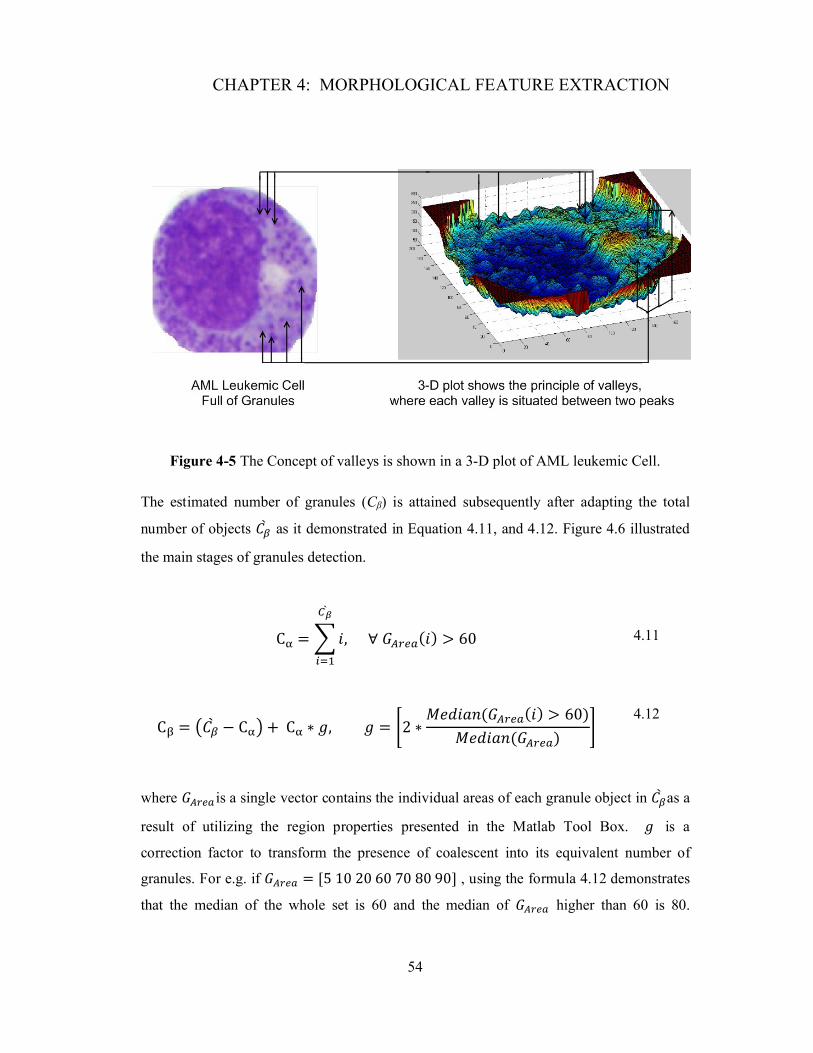
CHAPTER 4: MORPHOLOGICAL FEATURE EXTRACTION
54
Figure 4-5 The Concept of valleys is shown in a 3-D plot of AML leukemic Cell.
The estimated number of granules (Cβ) is attained subsequently after adapting the total
number of objects ��� as it demonstrated in Equation 4.11, and 4.12. Figure 4.6 illustrated
the main stages of granules detection.
C� = � �,���
���∀ �����(�) > 60 4.11
C� = ���� − C�� + C� ∗ �, � = �2 ∗ ������(�����(�) > 60)������(�����) �
4.12
where ����� is a single vector contains the individual areas of each granule object in ��� as a
result of utilizing the region properties presented in the Matlab Tool Box. � is a
correction factor to transform the presence of coalescent into its equivalent number of
granules. For e.g. if ����� = [5 10 20 60 70 80 90] , using the formula 4.12 demonstrates
that the median of the whole set is 60 and the median of ����� higher than 60 is 80.
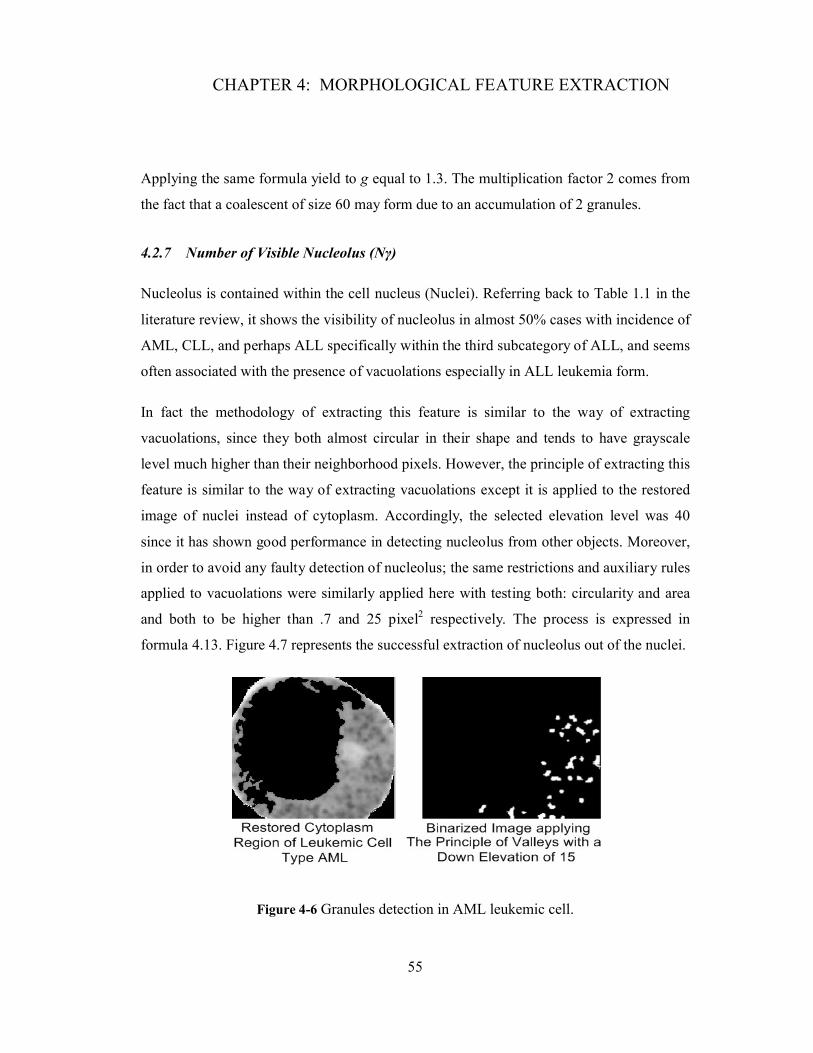
CHAPTER 4: MORPHOLOGICAL FEATURE EXTRACTION
55
Applying the same formula yield to g equal to 1.3. The multiplication factor 2 comes from
the fact that a coalescent of size 60 may form due to an accumulation of 2 granules.
4.2.7 Number of Visible Nucleolus (Nγ)
Nucleolus is contained within the cell nucleus (Nuclei). Referring back to Table 1.1 in the
literature review, it shows the visibility of nucleolus in almost 50% cases with incidence of
AML, CLL, and perhaps ALL specifically within the third subcategory of ALL, and seems
often associated with the presence of vacuolations especially in ALL leukemia form.
In fact the methodology of extracting this feature is similar to the way of extracting
vacuolations, since they both almost circular in their shape and tends to have grayscale
level much higher than their neighborhood pixels. However, the principle of extracting this
feature is similar to the way of extracting vacuolations except it is applied to the restored
image of nuclei instead of cytoplasm. Accordingly, the selected elevation level was 40
since it has shown good performance in detecting nucleolus from other objects. Moreover,
in order to avoid any faulty detection of nucleolus; the same restrictions and auxiliary rules
applied to vacuolations were similarly applied here with testing both: circularity and area
and both to be higher than .7 and 25 pixel2 respectively. The process is expressed in
formula 4.13. Figure 4.7 represents the successful extraction of nucleolus out of the nuclei.
Figure 4-6 Granules detection in AML leukemic cell.
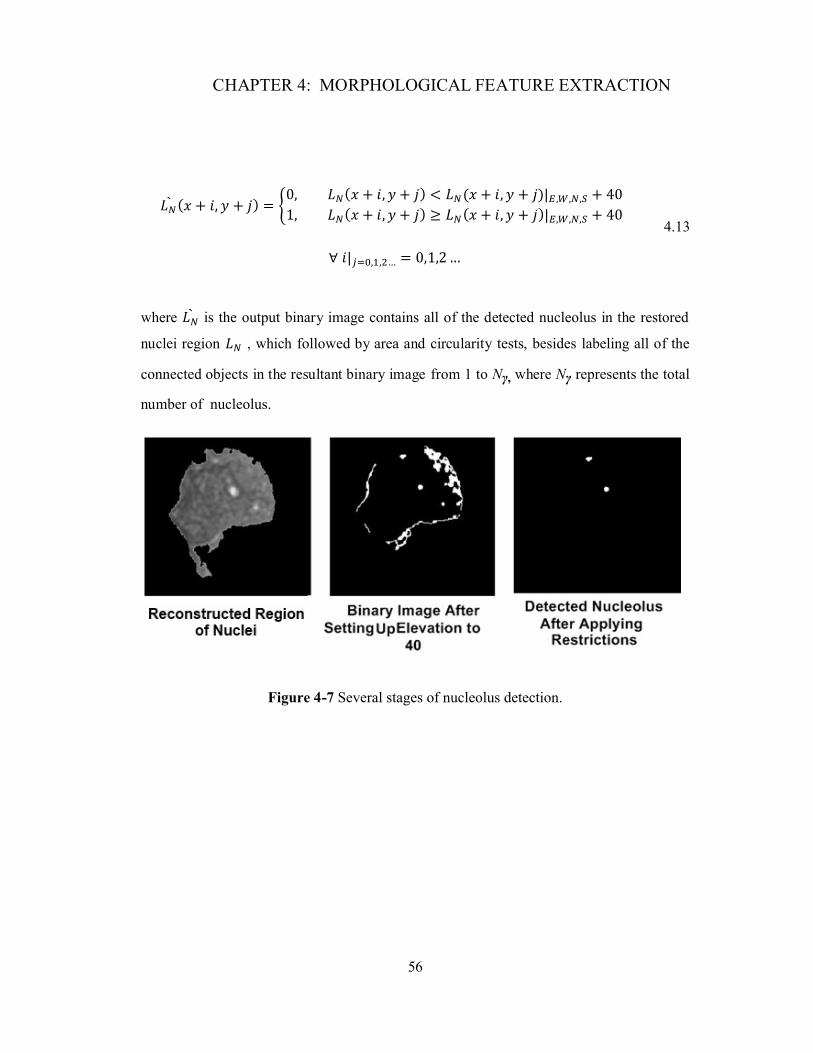
CHAPTER 4: MORPHOLOGICAL FEATURE EXTRACTION
56
��� (� + �, � + �) = �0, ��(� + �, � + �) < ��(� + �, � + �)|�,�,�,� + 401, ��(� + �, � + �) ≥ ��(� + �, � + �)|�,�,�,� + 40
�
∀ �|���,�,�… = 0,1,2 …
4.13
where ��� is the output binary image contains all of the detected nucleolus in the restored
nuclei region �� , which followed by area and circularity tests, besides labeling all of the
connected objects in the resultant binary image from 1 to Nγ, where Nγ represents the total
number of nucleolus.
Figure 4-7 Several stages of nucleolus detection.
CHAPTER 4: MORPHOLOGICAL FEATURE EXTRACTION
57
4.3 Summary
This chapter reviews the development of different respective algorithms based on different
methodologies and techniques. The region properties have provided the system with
valuable information, and especially the known coordinates of all boundary elements,
which aided intensively in developing the features extraction algorithms. Furthermore, it
helped in evaluating parameters such as: Regions Area, Area Ratios, unwanted objects
elimination, and shifting the central-point to the zero-origin which presented a standardized
formula to measure the nuclei’s regularity for all input leukemic cell images. One of the
main concepts which used in extracting features such as nucleolus and vacuolation was
peaks and valleys, due to the preknown elevation of these objects with respect to their
neighborhood surrounding area. All of these techniques and more have yielded
successfully in extracting nine unique morphological features.
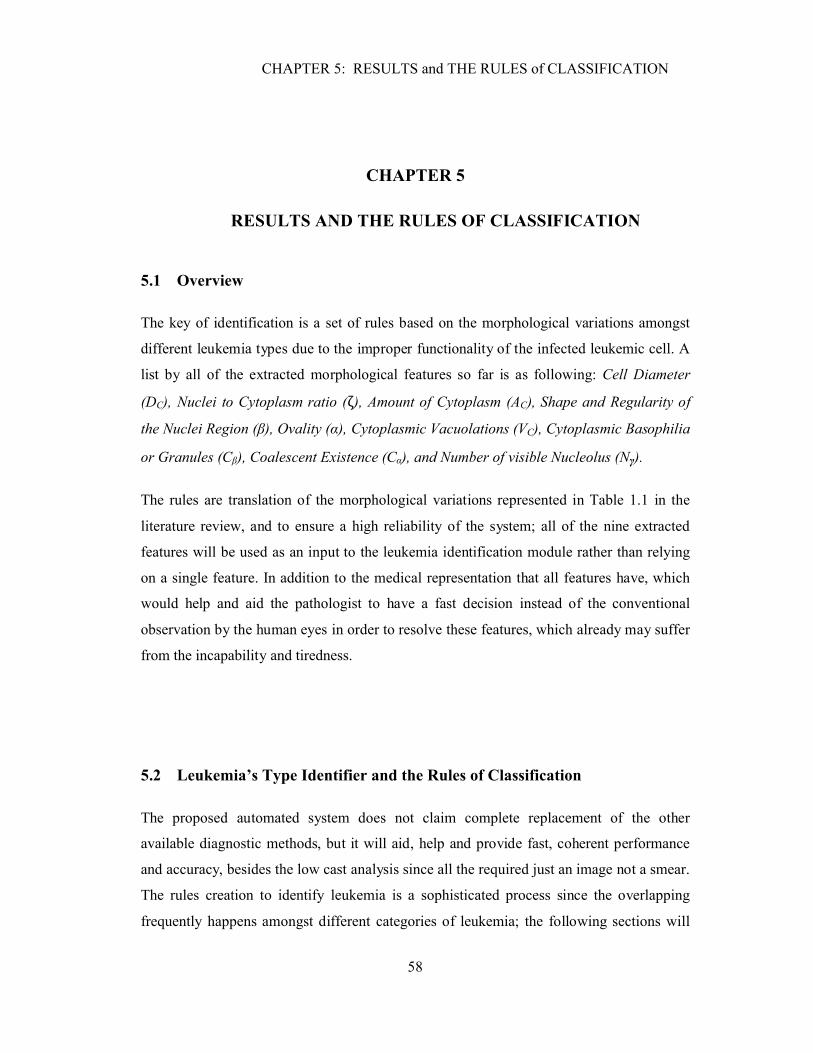
CHAPTER 5: RESULTS and THE RULES of CLASSIFICATION
58
CHAPTER 5
CHAPTER 5: RESULTS AND THE RULES OF CLASSIFICATION
5.1 Overview
The key of identification is a set of rules based on the morphological variations amongst
different leukemia types due to the improper functionality of the infected leukemic cell. A
list by all of the extracted morphological features so far is as following: Cell Diameter
(DC), Nuclei to Cytoplasm ratio (ζ), Amount of Cytoplasm (AC), Shape and Regularity of
the Nuclei Region (β), Ovality (α), Cytoplasmic Vacuolations (VC), Cytoplasmic Basophilia
or Granules (Cβ), Coalescent Existence (Cα), and Number of visible Nucleolus (Nγ).
The rules are translation of the morphological variations represented in Table 1.1 in the
literature review, and to ensure a high reliability of the system; all of the nine extracted
features will be used as an input to the leukemia identification module rather than relying
on a single feature. In addition to the medical representation that all features have, which
would help and aid the pathologist to have a fast decision instead of the conventional
observation by the human eyes in order to resolve these features, which already may suffer
from the incapability and tiredness.
5.2 Leukemia’s Type Identifier and the Rules of Classification
The proposed automated system does not claim complete replacement of the other
available diagnostic methods, but it will aid, help and provide fast, coherent performance
and accuracy, besides the low cast analysis since all the required just an image not a smear.
The rules creation to identify leukemia is a sophisticated process since the overlapping
frequently happens amongst different categories of leukemia; the following sections will

CHAPTER 5: RESULTS and THE RULES of CLASSIFICATION
59
have an illustration of how the rules can be tuned precisely to indicate the right upper and
lower bounds of each type.
The problem of features overlapping could be addressed by enforcing a set of auxiliary
rules whenever the overlapping occurs. The elimination process will take in account all the
relevant features of each leukemia type.
It can be noticed that many features are not distinct to a certain type of leukemia anyhow,
and it belongs to multiple types instead of one at the same time. Therefore, the research has
proposed a criterion of allocating Weights for each extracted feature based on its based on
its significance in identifying a certain type of leukemia, and since four types of leukemia
are there; the allocated weights will have values ranging from one, two, three and four out
four, whereas features with high significance will be assigned high weight values and vice
versa. For e.g. ALL and AML leukemia are both sharing almost the same range of cell
diameters, accordingly, it will assign a weight of ½ and a symbolic value A to both of
them.
Similarly, the system will keep assigning different Symbolic values that refers to a specific
weights, and a built in lookup table will be used to retrieve these weights back from their
symbolic values. Then the identification system will select the leukemia type that holds for
the highest probability. Figure 5.1 shows a lookup table of all symbolic values and their
equivalent weights accordingly.
5.2.1 Rule One: Cell diameter (DC)
Obviously, it can be noticed that ALL and AML are almost sharing the same diameters
range, hence the symbolic value A will be assigned to both types with respect to that
feature which has a weight of ½ as illustrated in the lookup table at Figure 5.1. Then using
a set of auxiliary rules, if satisfied, will help to eliminate one of the two available choices
ALL and AML and then a symbolic value of AL or AM will be assigned which indicates
the significance of this feature to one of the two types. Figure 5.2 shows a set of
conditional statements to identify leukemia with respect to this feature.

CHAPTER 5: RESULTS and THE RULES of CLASSIFICATION
60
Figure 5-1 Symbolic representation and weights allocation.

CHAPTER 5: RESULTS and THE RULES of CLASSIFICATION
61
Figure 5-2 Identification code based on the cell diameter.
5.2.2 Rule Two: Nuclei to Cytoplasm ratio (�)
Referring to Table 1.1 it can be noticed how large the amount of overlapping within this
feature, which requires intensive number of rules to restrict any kind of miss identification.
Obviously, overlapping at this feature occurs at ranges higher than 60% that is associated
with ALL, AML, and CLL. Such a problem is addressed by tuning delicately to the right
upper and lower bounds of each type. Additionally, an array of auxiliary rules are involved
to achieve the elimination using relevant features of high significance with respect to
above three forms of leukemia such as cell diameter and the amount of granules, since
granules are rarely appear amongst ALL and CLL types of leukemia.
Firstly, the system will assign a symbolic value of ACL as a result of all cells having �higher than 60. Consequently, ALL, AML, and CML will be assigned weights of 1/3 with
respect to the significance of this feature.
Assign a Symbol of
AM
Assign a Symbol of
CM
DC ≥16 &Cβ> Cβ_Avg
Assign a Symbol of
AL
DC ≥16 &
Assign a Symbol of A
Reading Cell Diameter DC
If DC ≥12 & α>80 &
Cβ≤ Cβ_Avg
Assign a Symbol of
CL
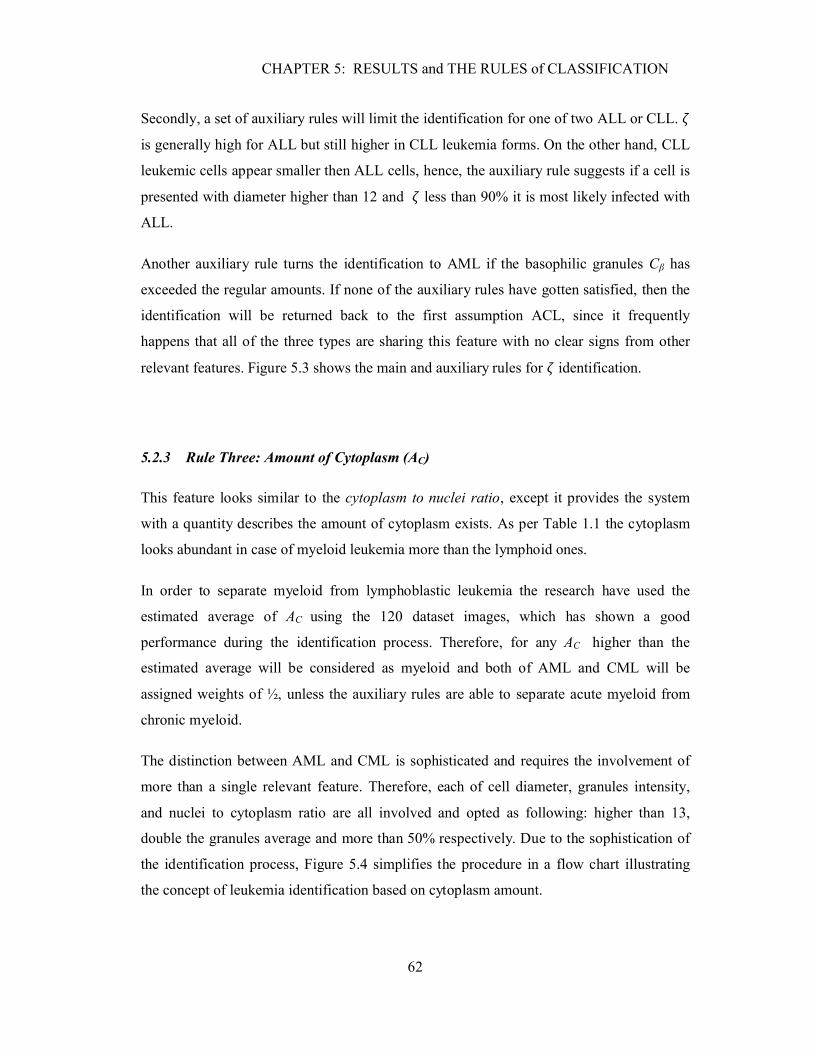
CHAPTER 5: RESULTS and THE RULES of CLASSIFICATION
62
Secondly, a set of auxiliary rules will limit the identification for one of two ALL or CLL. �is generally high for ALL but still higher in CLL leukemia forms. On the other hand, CLL
leukemic cells appear smaller then ALL cells, hence, the auxiliary rule suggests if a cell is
presented with diameter higher than 12 and � less than 90% it is most likely infected with
ALL.
Another auxiliary rule turns the identification to AML if the basophilic granules Cβ has
exceeded the regular amounts. If none of the auxiliary rules have gotten satisfied, then the
identification will be returned back to the first assumption ACL, since it frequently
happens that all of the three types are sharing this feature with no clear signs from other
relevant features. Figure 5.3 shows the main and auxiliary rules for � identification.
5.2.3 Rule Three: Amount of Cytoplasm (AC)
This feature looks similar to the cytoplasm to nuclei ratio, except it provides the system
with a quantity describes the amount of cytoplasm exists. As per Table 1.1 the cytoplasm
looks abundant in case of myeloid leukemia more than the lymphoid ones.
In order to separate myeloid from lymphoblastic leukemia the research have used the
estimated average of AC using the 120 dataset images, which has shown a good
performance during the identification process. Therefore, for any AC higher than the
estimated average will be considered as myeloid and both of AML and CML will be
assigned weights of ½, unless the auxiliary rules are able to separate acute myeloid from
chronic myeloid.
The distinction between AML and CML is sophisticated and requires the involvement of
more than a single relevant feature. Therefore, each of cell diameter, granules intensity,
and nuclei to cytoplasm ratio are all involved and opted as following: higher than 13,
double the granules average and more than 50% respectively. Due to the sophistication of
the identification process, Figure 5.4 simplifies the procedure in a flow chart illustrating
the concept of leukemia identification based on cytoplasm amount.
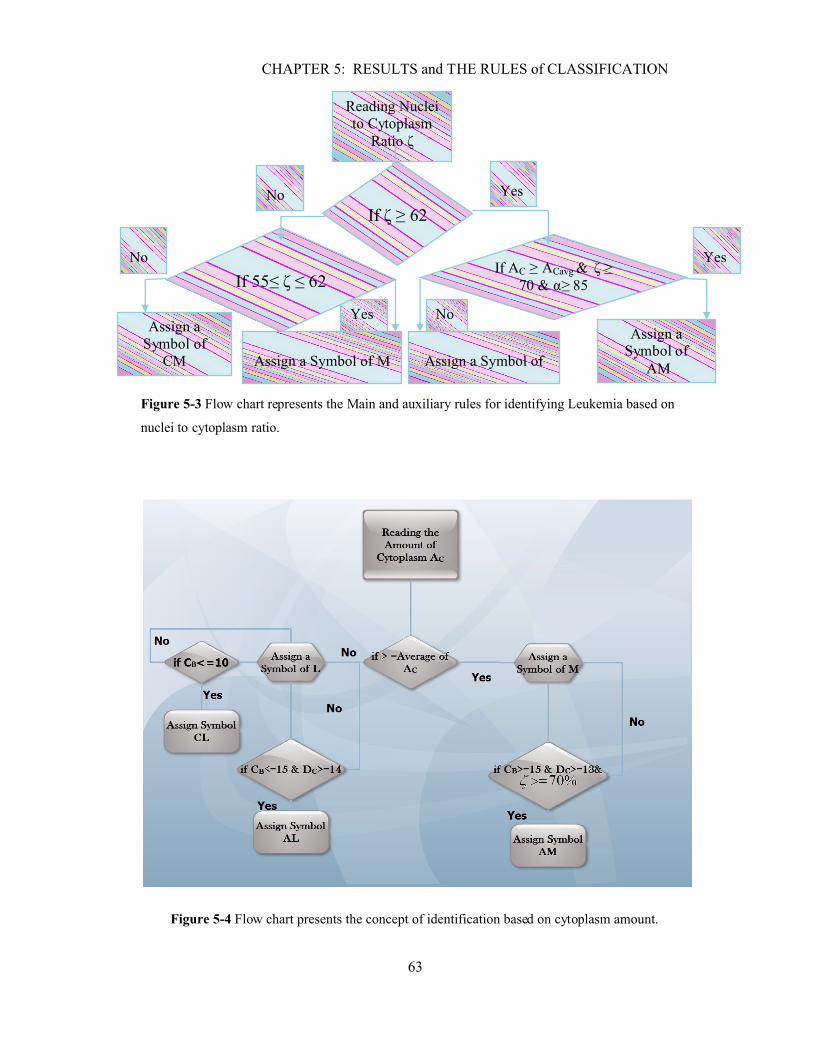
CHAPTER 5: RESULTS and THE RULES of CLASSIFICATION
63
Figure 5-3 Flow chart represents the Main and auxiliary rules for identifying Leukemia based on
nuclei to cytoplasm ratio.
Figure 5-4 Flow chart presents the concept of identification based on cytoplasm amount.
Yes
Yes
Yes
Assign a Symbol of
AM
Assign a Symbol of
CM Assign a Symbol of
AL
Assign a Symbol of M
If AC ≥ ACavg & ζ ≥ 70 & α≥ 85If 55≤ ζ ≤ 62
Reading Nuclei to Cytoplasm
Ratio ζ
If ζ ≥ 62No
No
No
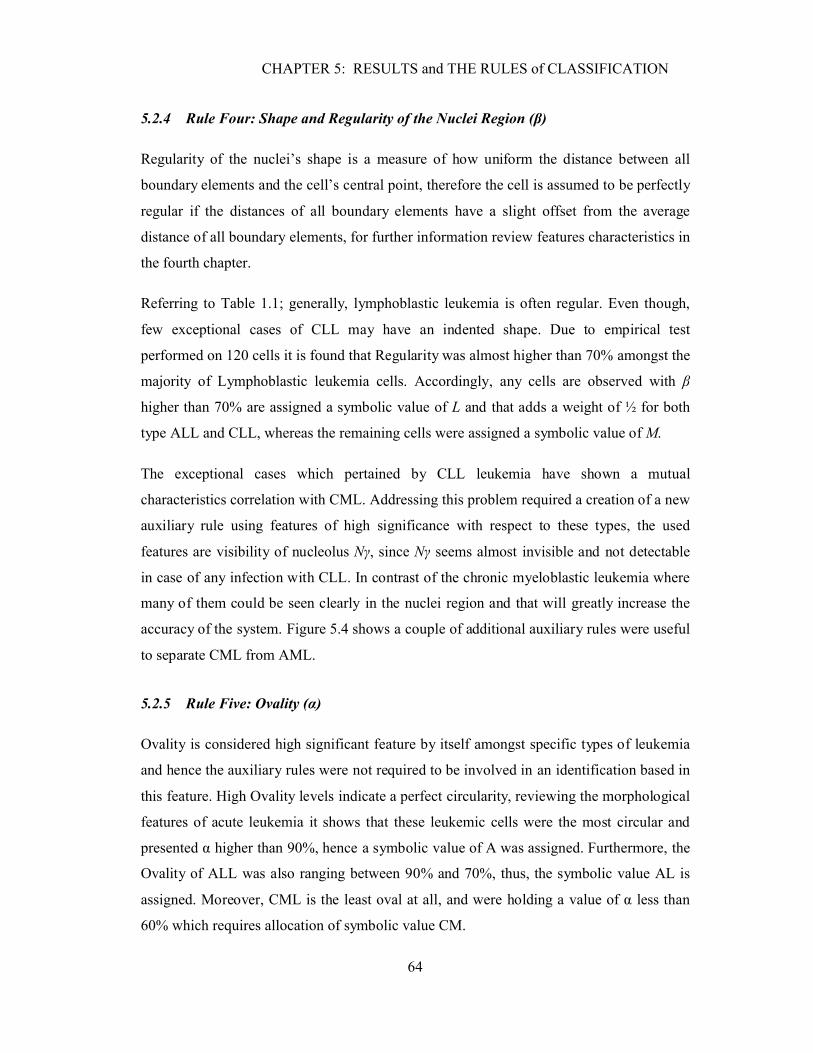
CHAPTER 5: RESULTS and THE RULES of CLASSIFICATION
64
5.2.4 Rule Four: Shape and Regularity of the Nuclei Region (β)
Regularity of the nuclei’s shape is a measure of how uniform the distance between all
boundary elements and the cell’s central point, therefore the cell is assumed to be perfectly
regular if the distances of all boundary elements have a slight offset from the average
distance of all boundary elements, for further information review features characteristics in
the fourth chapter.
Referring to Table 1.1; generally, lymphoblastic leukemia is often regular. Even though,
few exceptional cases of CLL may have an indented shape. Due to empirical test
performed on 120 cells it is found that Regularity was almost higher than 70% amongst the
majority of Lymphoblastic leukemia cells. Accordingly, any cells are observed with β
higher than 70% are assigned a symbolic value of L and that adds a weight of ½ for both
type ALL and CLL, whereas the remaining cells were assigned a symbolic value of M.
The exceptional cases which pertained by CLL leukemia have shown a mutual
characteristics correlation with CML. Addressing this problem required a creation of a new
auxiliary rule using features of high significance with respect to these types, the used
features are visibility of nucleolus Nγ, since Nγ seems almost invisible and not detectable
in case of any infection with CLL. In contrast of the chronic myeloblastic leukemia where
many of them could be seen clearly in the nuclei region and that will greatly increase the
accuracy of the system. Figure 5.4 shows a couple of additional auxiliary rules were useful
to separate CML from AML.
5.2.5 Rule Five: Ovality (α)
Ovality is considered high significant feature by itself amongst specific types of leukemia
and hence the auxiliary rules were not required to be involved in an identification based in
this feature. High Ovality levels indicate a perfect circularity, reviewing the morphological
features of acute leukemia it shows that these leukemic cells were the most circular and
presented α higher than 90%, hence a symbolic value of A was assigned. Furthermore, the
Ovality of ALL was also ranging between 90% and 70%, thus, the symbolic value AL is
assigned. Moreover, CML is the least oval at all, and were holding a value of α less than
60% which requires allocation of symbolic value CM.
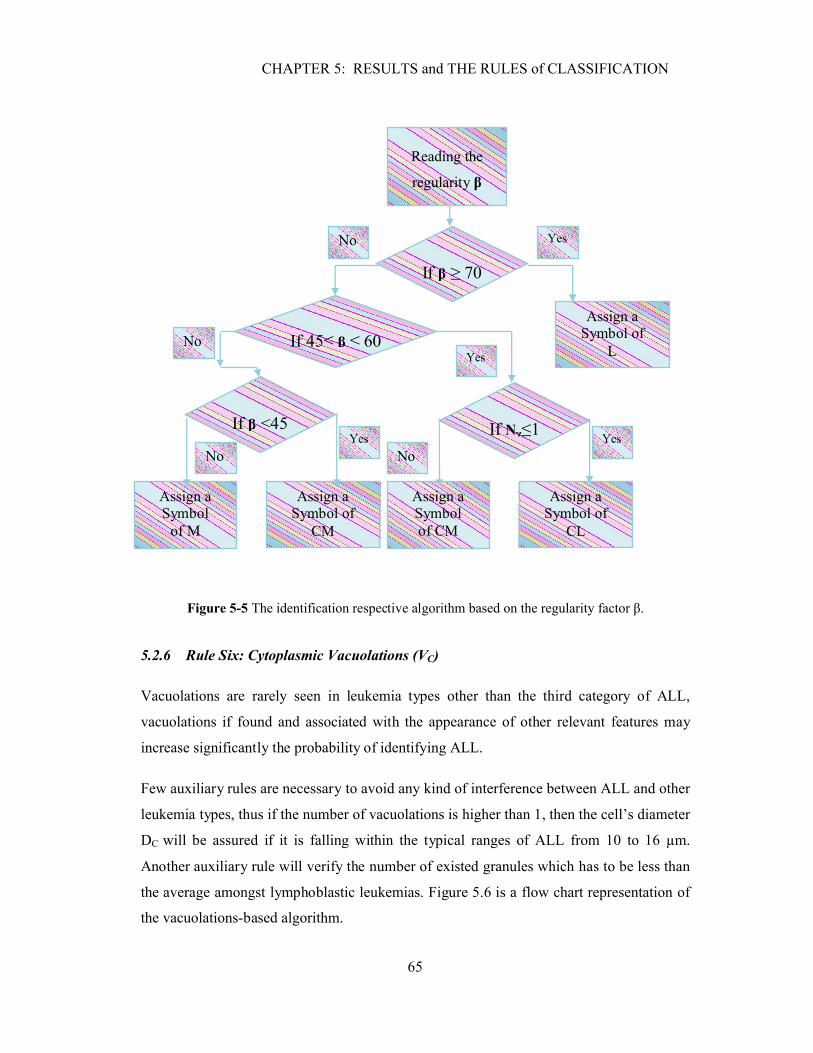
CHAPTER 5: RESULTS and THE RULES of CLASSIFICATION
65
Figure 5-5 The identification respective algorithm based on the regularity factor β.
5.2.6 Rule Six: Cytoplasmic Vacuolations (VC)
Vacuolations are rarely seen in leukemia types other than the third category of ALL,
vacuolations if found and associated with the appearance of other relevant features may
increase significantly the probability of identifying ALL.
Few auxiliary rules are necessary to avoid any kind of interference between ALL and other
leukemia types, thus if the number of vacuolations is higher than 1, then the cell’s diameter
DC will be assured if it is falling within the typical ranges of ALL from 10 to 16 µm.
Another auxiliary rule will verify the number of existed granules which has to be less than
the average amongst lymphoblastic leukemias. Figure 5.6 is a flow chart representation of
the vacuolations-based algorithm.
YesNo
No
No Yes
Yes
Yes
Assign a Symbol
of M
If 45≤ β ≤ 60
Assign a Symbol of
CM
If β <45
Reading the
regularity β
If β ≥ 70
Assign a Symbol of
L
Assign a Symbol of
CL
Assign a Symbolof CM
If Nγ≤1No
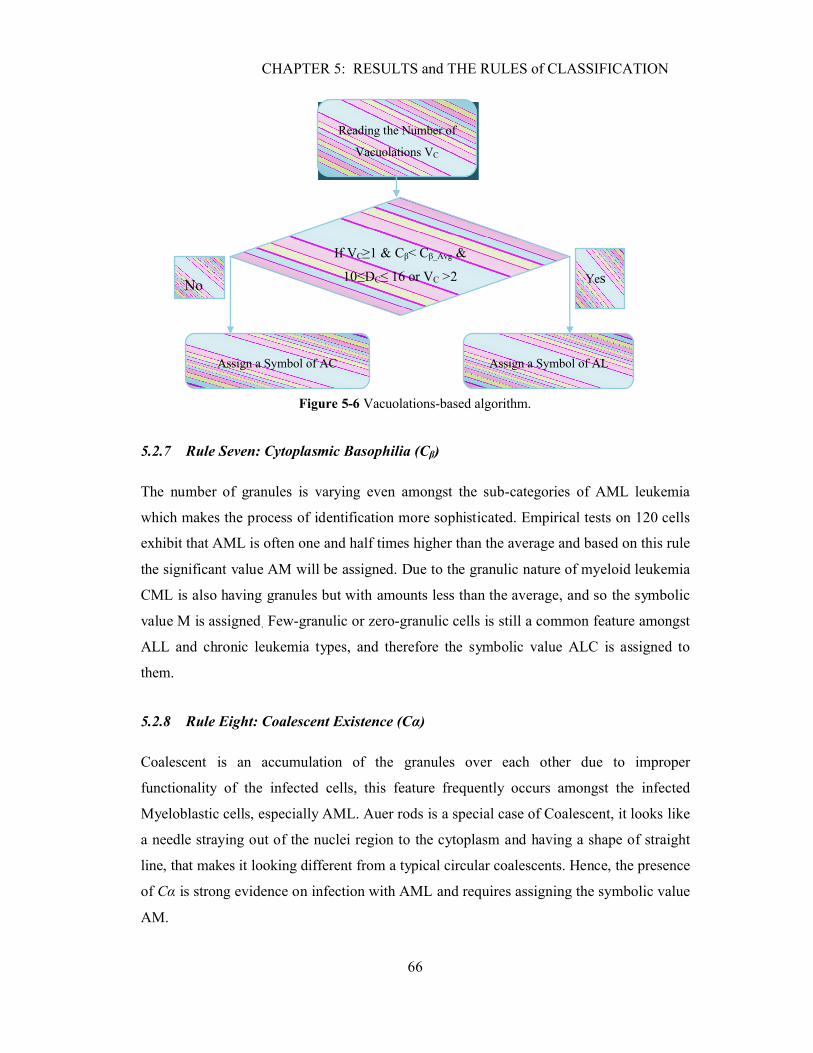
CHAPTER 5: RESULTS and THE RULES of CLASSIFICATION
66
Figure 5-6 Vacuolations-based algorithm.
5.2.7 Rule Seven: Cytoplasmic Basophilia (Cβ)
The number of granules is varying even amongst the sub-categories of AML leukemia
which makes the process of identification more sophisticated. Empirical tests on 120 cells
exhibit that AML is often one and half times higher than the average and based on this rule
the significant value AM will be assigned. Due to the granulic nature of myeloid leukemia
CML is also having granules but with amounts less than the average, and so the symbolic
value M is assigned. Few-granulic or zero-granulic cells is still a common feature amongst
ALL and chronic leukemia types, and therefore the symbolic value ALC is assigned to
them.
5.2.8 Rule Eight: Coalescent Existence (Cα)
Coalescent is an accumulation of the granules over each other due to improper
functionality of the infected cells, this feature frequently occurs amongst the infected
Myeloblastic cells, especially AML. Auer rods is a special case of Coalescent, it looks like
a needle straying out of the nuclei region to the cytoplasm and having a shape of straight
line, that makes it looking different from a typical circular coalescents. Hence, the presence
of Cα is strong evidence on infection with AML and requires assigning the symbolic value
AM.
Reading the Number of
Vacuolations VC
If VC≥1 & Cβ< Cβ_Avg &
10≤DC≤ 16 or VC >2
Assign a Symbol of AC Assign a Symbol of AL
No Yes
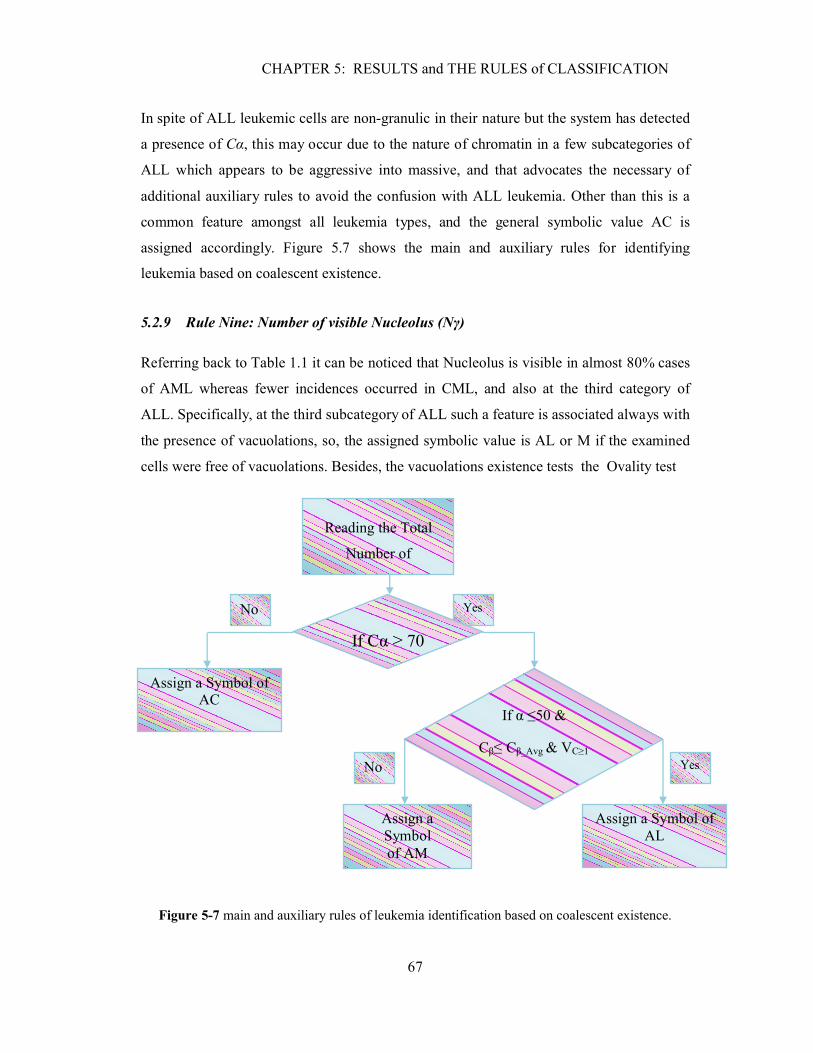
CHAPTER 5: RESULTS and THE RULES of CLASSIFICATION
67
In spite of ALL leukemic cells are non-granulic in their nature but the system has detected
a presence of Cα, this may occur due to the nature of chromatin in a few subcategories of
ALL which appears to be aggressive into massive, and that advocates the necessary of
additional auxiliary rules to avoid the confusion with ALL leukemia. Other than this is a
common feature amongst all leukemia types, and the general symbolic value AC is
assigned accordingly. Figure 5.7 shows the main and auxiliary rules for identifying
leukemia based on coalescent existence.
5.2.9 Rule Nine: Number of visible Nucleolus (Nγ)
Referring back to Table 1.1 it can be noticed that Nucleolus is visible in almost 80% cases
of AML whereas fewer incidences occurred in CML, and also at the third category of
ALL. Specifically, at the third subcategory of ALL such a feature is associated always with
the presence of vacuolations, so, the assigned symbolic value is AL or M if the examined
cells were free of vacuolations. Besides, the vacuolations existence tests the Ovality test
Figure 5-7 main and auxiliary rules of leukemia identification based on coalescent existence.
No Yes
No Yes
Reading the Total
Number of
If Cα ≥ 70
Assign a Symbol ofAC
Assign a Symbol ofAL
Assign a Symbolof AM
If α ≤50 &
Cβ≤ Cβ_Avg & VC≥1

CHAPTER 5: RESULTS and THE RULES of CLASSIFICATION
68
also useful since it tends to be higher than 80% in AML leukemia and that distinguish it
from CML. If none of the auxiliary rules were satisfied to achieve the elimination then it
advocates an allocation of the symbolic value ALC.
5.3 The Identification Rule
The nine extracted features out of the two enhanced images of each single leukemic cell
will be processed and allocated weights individually based on the previously optimized
rules. Consequently, the output of the previous stage is four vectors represent the four
major forms of leukemia, and each vector will hold nine different symbolic values.
The size of each output vector is 1XM, where M refers to the total number of extracted
features. Each index in the output vectors presents a specific weight that has been retrieved
from the lookup table 5.1. Subsequently, the weights average of each vector will be
evaluated which could be imagined as the probability of infection with each type of
leukemia, consequently, the highest probability or the maximum weights average
determines the exact type of leukemia. The process of identification is expressed in terms
of ���as it shown in Equation 5.1. Figure 5.8 illustrates the process of identification and
showing a numerical example of a typical ALL leukemic cell.
LK� = ��� � 1� � ��
�
���� , ∴ ��|���,���,���,��� ≡ 1 × � 5.1
5.4 Results and Discussion
The results of implementing the proposed leukemic cell identification method were
obtained using 2.8 GHz PC with 2 GB of RAM, Windows 7 OS and Matlab 2008a
software tools. The proposed segmentation system has been tested using images of
leukemic single cells extracted from multi cell images provided online by the Health
Center at University of Virginia [11]. The dataset used in this work consist of 120 gray-
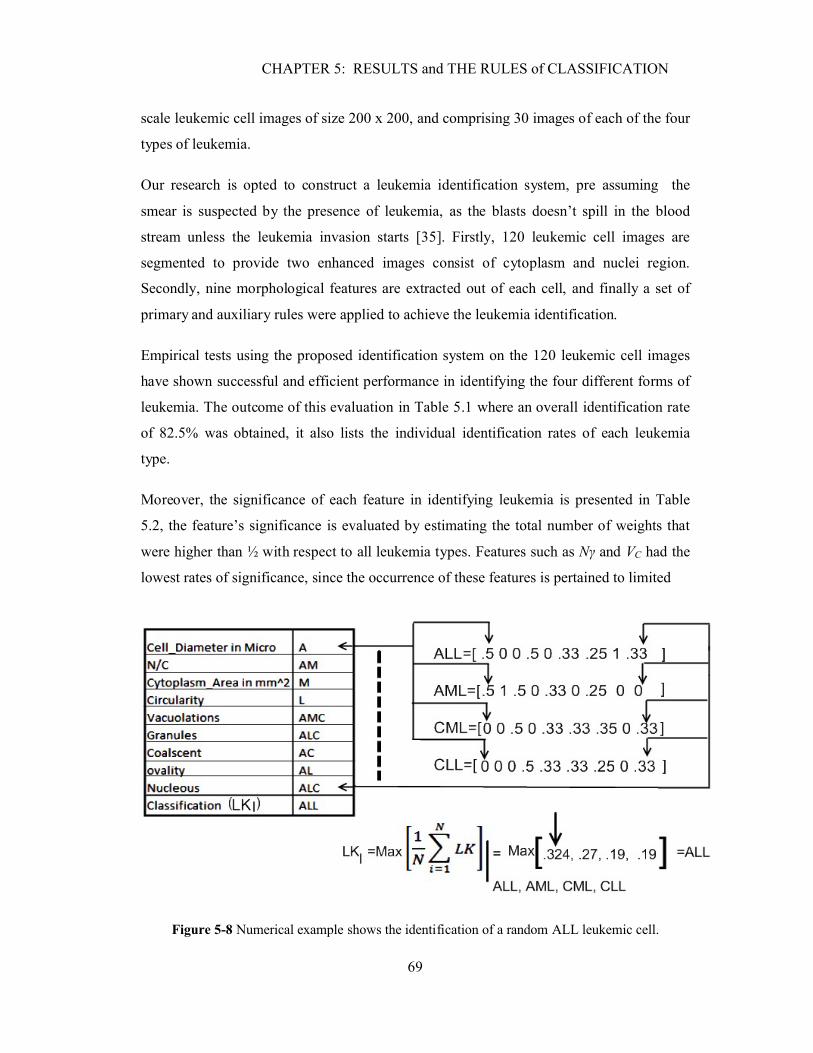
CHAPTER 5: RESULTS and THE RULES of CLASSIFICATION
69
scale leukemic cell images of size 200 x 200, and comprising 30 images of each of the four
types of leukemia.
Our research is opted to construct a leukemia identification system, pre assuming the
smear is suspected by the presence of leukemia, as the blasts doesn’t spill in the blood
stream unless the leukemia invasion starts [35]. Firstly, 120 leukemic cell images are
segmented to provide two enhanced images consist of cytoplasm and nuclei region.
Secondly, nine morphological features are extracted out of each cell, and finally a set of
primary and auxiliary rules were applied to achieve the leukemia identification.
Empirical tests using the proposed identification system on the 120 leukemic cell images
have shown successful and efficient performance in identifying the four different forms of
leukemia. The outcome of this evaluation in Table 5.1 where an overall identification rate
of 82.5% was obtained, it also lists the individual identification rates of each leukemia
type.
Moreover, the significance of each feature in identifying leukemia is presented in Table
5.2, the feature’s significance is evaluated by estimating the total number of weights that
were higher than ½ with respect to all leukemia types. Features such as Nγ and VC had the
lowest rates of significance, since the occurrence of these features is pertained to limited
Figure 5-8 Numerical example shows the identification of a random ALL leukemic cell.
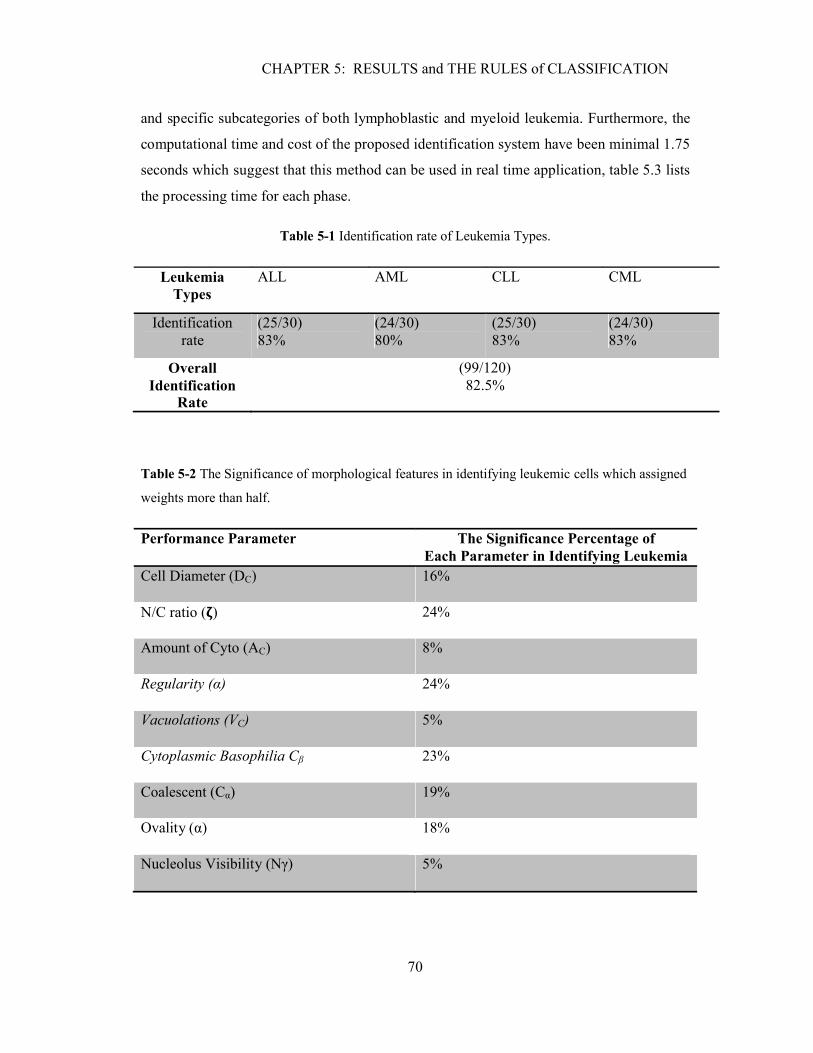
CHAPTER 5: RESULTS and THE RULES of CLASSIFICATION
70
and specific subcategories of both lymphoblastic and myeloid leukemia. Furthermore, the
computational time and cost of the proposed identification system have been minimal 1.75
seconds which suggest that this method can be used in real time application, table 5.3 lists
the processing time for each phase.
Table 5-1 Identification rate of Leukemia Types.
Table 5-2 The Significance of morphological features in identifying leukemic cells which assigned
weights more than half.
Performance Parameter The Significance Percentage ofEach Parameter in Identifying Leukemia
Cell Diameter (DC) 16%
N/C ratio (�) 24%
Amount of Cyto (AC) 8%
Regularity (α) 24%
Vacuolations (VC) 5%
Cytoplasmic Basophilia Cβ 23%
Coalescent (Cα) 19%
Ovality (α) 18%
Nucleolus Visibility (Nγ) 5%
Leukemia Types
ALL AML CLL CML
Identification rate
(25/30)83%
(24/30)80%
(25/30)83%
(24/30)83%
Overall Identification
Rate
(99/120)82.5%
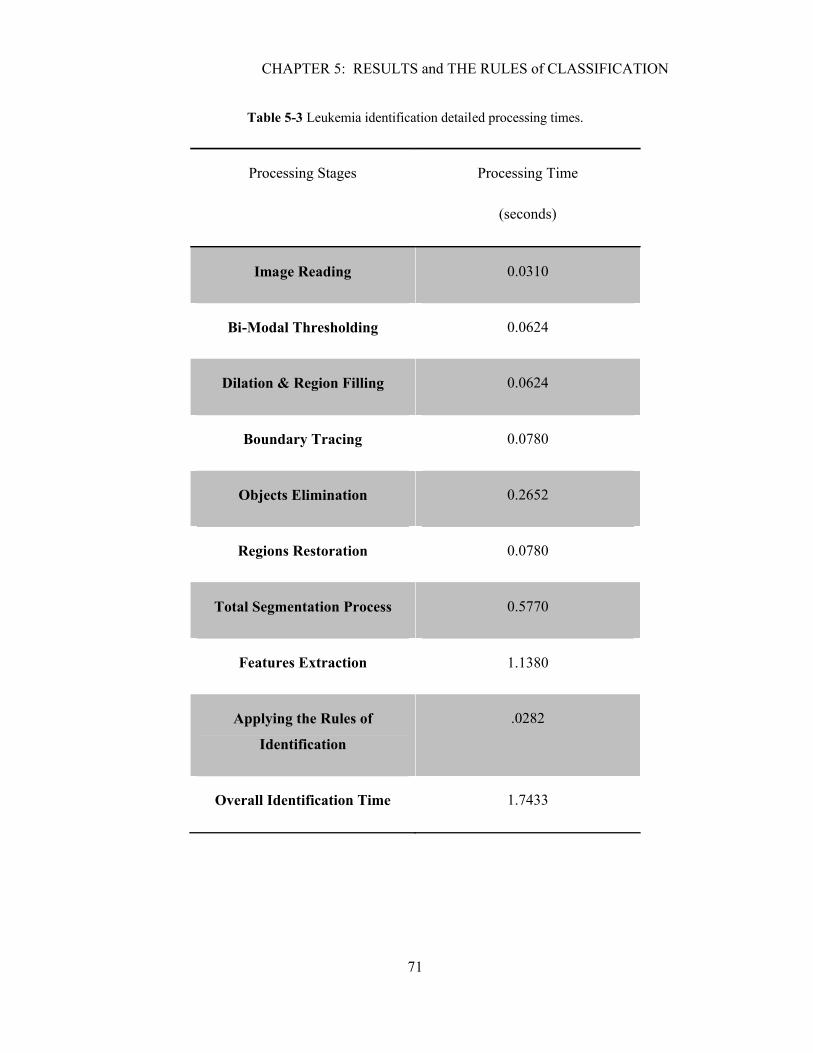
CHAPTER 5: RESULTS and THE RULES of CLASSIFICATION
71
Table 5-3 Leukemia identification detailed processing times.
Processing Stages Processing Time
(seconds)
Image Reading 0.0310
Bi-Modal Thresholding 0.0624
Dilation & Region Filling 0.0624
Boundary Tracing 0.0780
Objects Elimination 0.2652
Regions Restoration 0.0780
Total Segmentation Process 0.5770
Features Extraction 1.1380
Applying the Rules of
Identification
.0282
Overall Identification Time 1.7433
CHAPTER 5: RESULTS and THE RULES of CLASSIFICATION
72
5.5 Comparison to the Previous Identification Systems
The difference between the developed system and other previous systems which were also
morphologically-based is presented in the reliability of the developed system and the
ability of identifying four different forms of leukemia at a time; in contrast of the other
systems which were basically designed to identify two forms whether chronic or acute
leukemia. The reliability in the developed system is assured by extracting nine unique
features out of each leukemic cell image; considering the fact that features are overlapping
amongst different form leukemia, and thus one or two features are not sufficient for the
identification as it was shown before in Table 1.1.
For example, a morphologically based system which was previously suggested in [33]
identified two forms of Acute Leukemia (ALL and AML) using also morphological
analysis and reporting an identification rate of 95%. However, although the identification
rate appears high but the system reliability is questionable since it was relying on
extracting one single feature (thickness of cytoplasm or the cytoplasm amount) for the
identification. This is actually not sufficient and not medically acceptable due to the
overlapping amongst the different forms of leukemia. For example, the third sub category
of ALL leukemia has an amount of cytoplasm as abundant as many other subcategories of
AML leukemia, which makes ALL indistinguishable from AML as reported in [16].
Moreover, the work in [33] used a dataset of 25 single leukemic cell images for the
development of the identification system which we consider as insufficient, in comparison
to our dataset that includes 120 leukemic cell images.
In comparison to non-morphologically based systems; the developed system outperforms
the existing systems in cost, speed, and identification rate. Table 5.4 summarizes the
performance comparison between the developed system and previous systems [25] [47].

CHAPTER 5: RESULTS and THE RULES of CLASSIFICATION
73
Table 5-4 Performance comparison between the developed system and other existing systems.
Type of Diagnostic System
Cost Time Cost Identification Rate
Existing Systems[25] [47].
$2,400-$4,800 48 hours-one week 50% of Patients were misdiagnosed
Developed System Costless requires just an image and a
regular pc
1.743 (sec) 82.5%
5.6 Summary
This chapter reviews the rules of identification as a translation of the morphological
variations amongst leukemia forms, where the reliability of the system is assured by
involving the nine morphological features during the process of identification. The
identification criterion is achieved by allocating a weight for each extracted feature based
on its significance, this followed by generating four different vectors presenting the four
available forms of leukemia. Subsequently, the weights average of each vector is evaluated
and the output vector exhibits the highest probability will determine the exact form of
leukemia. The overall sufficient identification rate was 82.5% and the individual
identification rate were 83%, 80%, 83%, and 83% for each of ALL, AML, CLL, and AML
respectively. The computational and time costs of our system have been minimal and
remarkable that was a fast 1.75 seconds which suggests the applicability of this system in
real time implementations.

CONCLUSIONS
74
CONCLUSIONS
Leukemia is a broad term covering a spectrum of diseases and subdivided into two major
categories, Acute Leukemia which includes ALL and AML types; they are both
characterized by the rapid growth of infected leukocytes and spreading quickly which
makes the disease fatal in weeks to months if not treated. The second category is known as
Chronic Leukemia and includes CLL and CML types, where the progress of
overproduction is much slower than in acute leukemia. A system was established in 1976
known by FAB (French-American-British Classification) has illustrated the morphological
variations amongst the different leukemia types or forms based on the cell appearance
under the microscope.
There is need for an automated method that identifies the four major different forms of
leukemia in infected blood cells. Currently, the available leukemia diagnosis systems
include immune-phenotype, Cytogenetic, and Morphological Analysis. These diagnostic
methods have show successful results. However, they have drawbacks related to cost, time
expense, and correct diagnosis rates.
Therefore, we proposed in this thesis an automated identification system that addresses
these problems. The proposed novel identification system is based on morphological
analysis of leukemic cell images, and comprises three phases; namely, single cell
segmentation, features extraction, and classification.
The first phase involves separating the nuclei from the cytoplasm region, which provides
two enhanced images for each input cell. The enhanced result images contain valuable
information on the cell features, hence are used as the input images in the next phase of the
identification system. The yielded segmentation regions were visually inspected according
to a pre-set criterion. Based on empirical tests it is found that the first bimodal threshold is
located at the first 75% of the gray-level intensity scale, and the second threshold was
optimized at the intensity level holds for the maximum number of pixels over the intensity
level range which ranges between 75% - 98%. This has been followed by hole filling and
dilation which were essential to connect the broken boundaries and preparing the cell
image for tracing. The last stage of segmentation was regions recovery; applying a set of
CONCLUSIONS
75
fundamental image processing techniques, such as unioning, intersecting, and color
inverting.
The second phase in the leukemia identification system is the features extraction module;
developing several respective algorithms and using different methodologies and
techniques. However, region properties of the detected membranes had a main role in
developing several algorithms to evaluate features like: Regions Area, Nuclei to Cytoplasm
Ratio, Ovality and Regularity Tests. Moreover, the region properties were also useful to
eliminate any unwanted objects that exist within the region of interest. Due to the
preknown elevation of objects like vacuolations and nucleolus; concept such as peaks and
valleys was also useful in segmenting specific objects such as nucleolus and vacuolations
within nuclei and cytoplasm regions respectively.
The third phase was the leukemia identification or classification module which involved
establishing a set of primary and auxiliary rules tuned precisely in respect to the
morphological variations amongst leukemia types. The systems reliability is assured by
considering nine morphological features as an input to the leukemia identification phase
instead of using only one feature. The classification criterion was based on, firstly, weights
allocation for the extracted features based on its significance in identifying leukemia,
secondly, generation of four output vectors with respect to the four major forms of
leukemia, and finally evaluating the average weight of each vector. Consequently, the
maximum average or highest probability of those vectors will determine the exact form of
leukemia.
Numerical quantities that represented the extracted features have an importance in the
medical field, specifically in diagnosing leukemia which would help and aid the pathologist
to provide a fast prediction of the examined leukemic cell in synchronization with leukemia
identification systems output. Experimental results yielded a successful overall ratio of
correct identification of leukemia type by 82.5%. The individual identification rates for
ALL, AML, CLL, and AML were 83%, 80%, 83%, and 83%, respectively. The processing
time for the identification was fast as 1.75 seconds which suggest its applicability in real
time implementations. The identification rates are reasonable since the developed system
does not claim complete replacement of the available diagnosis systems, but rather acts as

CONCLUSIONS
76
an aid with high diagnostic probability for specialist, and helps the medical specialists to
choose the right chemotherapy which may potentially increases the likelihood of recovery.
REFERENCES
77
REFERENCES
[1] T.I. Mughal, J. M. Goldman, S.T Mughal, Understanding Leukemias,Lymphomas and
Myelomas. London, UK : Taylor & Francis Group, 2006. pp. 39-42.
[2] A. Khashman , IBCIS: Intelligent blood cell identification system. Progress in Natural
Science, Lefkosa, Mersin 10, Turkey 2008, pp. 1309–1312.
[3] Standardlifehealthcare. [Online] [Cited: March 21, 2009.] Available: http://standardlifehealth
care.medi-health.info/index.php?action=article&id=23069427.
[4] Rnceus. [Online] [Cited: March 21, 2009.] Available: http://www.rnceus.com/cbc/cbcwbc.
html.
[5] Wikipedia. [Online] [Cited: March 25, 2009.] Available: http://en.wikipedia.org/wiki/
Myelocyte.
[6] C. Wiener, A.S. Fauci, E. Braunwald, Harrison's Principles of Internal Medicine. McGraw-
Hill, 16th Edition, Chapter 97, 2007.
[7] Leukemia and Lymphoma awareness month. New Jersy, USA : The Cancer Institute of New
Jersey Patient Education Committee, 2008.
[8] S. Faderl, H.M. Kantarjian, M. Talpaz, Z. Estrov, Clinical Significance of Cytogenetic
Abnormalities in Adult Acute Lymphoblastic Leukemia. Washington, USA : The Journal of The
American Society of Hematology, 1998, Issue 11, Vol. 91.
[9] L.A. Ries, C.L. Kosary, B.F. Hankey., SEER Cancer Statistics Review. National Cancer
Institute, 2007, pp. 1973-1996. Also available online. Last accessed April 19, 2007.
[10] Wadsworth. [Online] [Cited: April 15, 2009.] Available: http://www.wadsworth.org/
chemheme/heme/microscope/cgl.htm.
REFERENCES
78
[11] Healthsystem.virginia.edu. [Online] [Cited: March 20, 2009.] Available: http://www.
healthsystem.virginia.edu/internet/hematology/HessEDD/MalignantHematologicDisorders/leuke
mias/.
[12] Medical-dictionary. [Online] [Cited: April 10, 2009.] Available: http://medical-dictionary.
thefreedictionary.com/morphology.
[13] B.J. Bain, Leukemia Diagnosis. London, UK : Blackwell Publishing Ltd, 2003.
[14] F. Naeim, P.N. Rao,W.W. Grody., Hematopathology,Morphology, Immunophenotype. First
edition. Los Angeles, USA : Elsevier Inc, 2008. pp. 13-20,227-241.
[15] A. Metha, V. Hoffbrand., Haematology at a Glance. s.l. : Blackwell Sceince, 2000. pp. 48-
52. ISBN 0-632-04793-3.
[16] B.J. Bain., Leukemia Diagnosis. London, UK : Blackwell Publishing Ltd, 2003. pp. 45-60.
[17] Biology-online. [Online] [Cited: April 2, 2009.] Available: http://www.biology-online.org
/dictionary/Reniform.
[18] Thefreedictionary. [Online] [Cited: April 1, 2009.] Available: http://www.thefreedictionary.
com/Vacuolation.
[19] C.J. Prychid, P.J. Rudall, Systematics and Biology of Silica Bodies in Monocotyledons. The
Botanical Review, Gregory, 2003.
[20] R.S. Riley, M. Idowu, Principles and Applications of Flow Cytometry. Virginia, USA :
Virginia Commonwealth University. pp. 2-4.
[21] R.Kothari, H.Cualing, T. Balachander, Neural Network Analysis of Flow Cytometery
Immunophenotype Data. IEEE Transactions On Biomedical Engineering, 1996. Vol. 43, 8.
[22] Cancer. [Online] [Cited: April 24, 2009.] Available: http://www.cancer.org/docroot/ cri/ con
tent/cri_2_4_3x_how_is_leukemia_diagnosed_62.asp.
REFERENCES
79
[23] S.L. Gersen, M.B. Keagle, The Principles of Clinical Cytogenetics. 2nd Edition. Totowa,
USA : Human Press, 2005. pp. 3-5.
[24] S. Alok, G. Baker, F. Daniel, Recurrence of Acute lymphocytic Leukemia Diagnosed by
sub-retinal Biopsy. Ophthalmic Communications Society, 2009, Vol.3, pp. 323-325.
[25] J. Graham, Automated Image Interpretation in Mammography, Cytogenetics and Retino-
pathy. IEEE Transactions on Biomedical Image Processing: Manchester, UK 2001.
[26] Clinicaltools. [Online] [Cited: April 23, 2009.] Available: http://images2.clinicaltools.com
/images/gene/karyotype_male.jpg.
[27] A. Khmelinskii, R. Ventura and J. Sanches, "Automatic Chromosome Pairing Using Mutual
Information". Lisbon, Portugal : IEEE Transactions on Biomedical Engineering, 2009.
[28] H.S. Brown, "Cytochemistry Stains". ( H&H Informational Primer), Sigma Aldrich Corp-
oration, 2003.
[29] L.S. Garcia, Diagnostic Medical Parasitology. Washington, USA : ASM Press, 2001.
[30] J. Nordenson, F. Francis, Manual of Laboratory and Diagnostic Tests. Philadelphia: Lippin-cott, 1996.
[31] Cytochemical Stains. Washington.edu. [Online] May 15, 2008. [Cited: May 11, 2009.]
Available: http://depts.washington.edu/labweb/Divisions/Hema/Cytochem.htm.
[32] Healthsystem.virginia.edu. [Online] [Cited: March 20, 2009.] Available: http://www.
healthsystem.virginia.edu/internet/hematology/HessEDD/MalignantHematologicDisorders/Leuk
emias/AML-M4.cfm.
[33] A. Faraj, Computer Based Acute Leukemia Classification. IEEE Biomedical Enginee- ring
Transactions: Egypt, Cairo, 2004, Vol. 4, pp. 701-704.

REFERENCES
80
[34] F. Scotti, Automatic Morphological Analysis for Acute Leukemia Identification in
Peripheral Blood Microscope Images. IEEE International Conference on Computational
Intelligence for Measurement Systems and Applications: Milan, Italy, 2005, Vol. 5, pp. 96-102.
[35] B.J.Bain., Leukemia Diagnosis. 3rd Edition. London,UK : Blackwell Publishing, 2003. pp.
51.
[36] Nci.nih.gov. [Online] Nov 15, 2008. [Cited: June 20, 2009.] Available: http://nci.nih.gov/
cancertopics/wyntk/leukemia/page6/print?page=&keyword=.
[37] B. Jane., Practical Handbook On Image Processing For Scientific And Technical
Applications. s.l. : CRC Press, 2004. pp. 494.
[38] MATLAB 2009a., Analysing and Enhancing Images (Image Processing Tool Box). s.l. :
MATH WORKS, 2009.
[39] R. C. Gonzalez, R.E. Woods, S.L. Eddins., Digital Image Processing Using Matlab.
Pearson Prentice Hall: Jeresy, USA , Inc., 2004, pp.524-540.
[40] Micro.magnet.fsu.edu. [Online] [Cited: July 20, 2009.] Available: http://micro.magnet.fsu.
edu/primer/java/scienceopticsu/virtual/magnifying/index.html.
[41] D. Creamer, Understanding Resolution and the Meaning of (DPI, PPI, SPI and LPI).
I.D.E.A.S, 2006.
[42] Wikipedia.org. [Online] [Cited: May 10, 2009.] Available: http://en.wikipedia.org/wiki/
Ovality.
[43] MATLAB 2009a., Image Processing Tool Box:Morphological Reconstruction. US : Math
Works, 2009.
[44] Patient UK, Various Specific Types of Blood Test & full Blood Count. Patient UK, 2006.

REFERENCES
81
[45] J.N. Jameson, L. Dennis, T. Randolph, B. Eugene, S. Anthony, Harrison's Principles Of
Internal Medicine. McGraw-Hill Medical Publishing Division: New York, USA, 2005, ISBN 0-
07-140235-7.
[46] G.A. Colvin, G.J. Elfenbein, The Latest Treatment Advances For Acute Myelogenous
Leukemia. Med Health, 2003, pp. 243.
[47] K. Capell, Meeting Leukemia's Diagnostic Challenge, Business Week, The McGraw-Hill Companies, London, 5 Sep. 2005.