Embed Size (px)
Citation preview
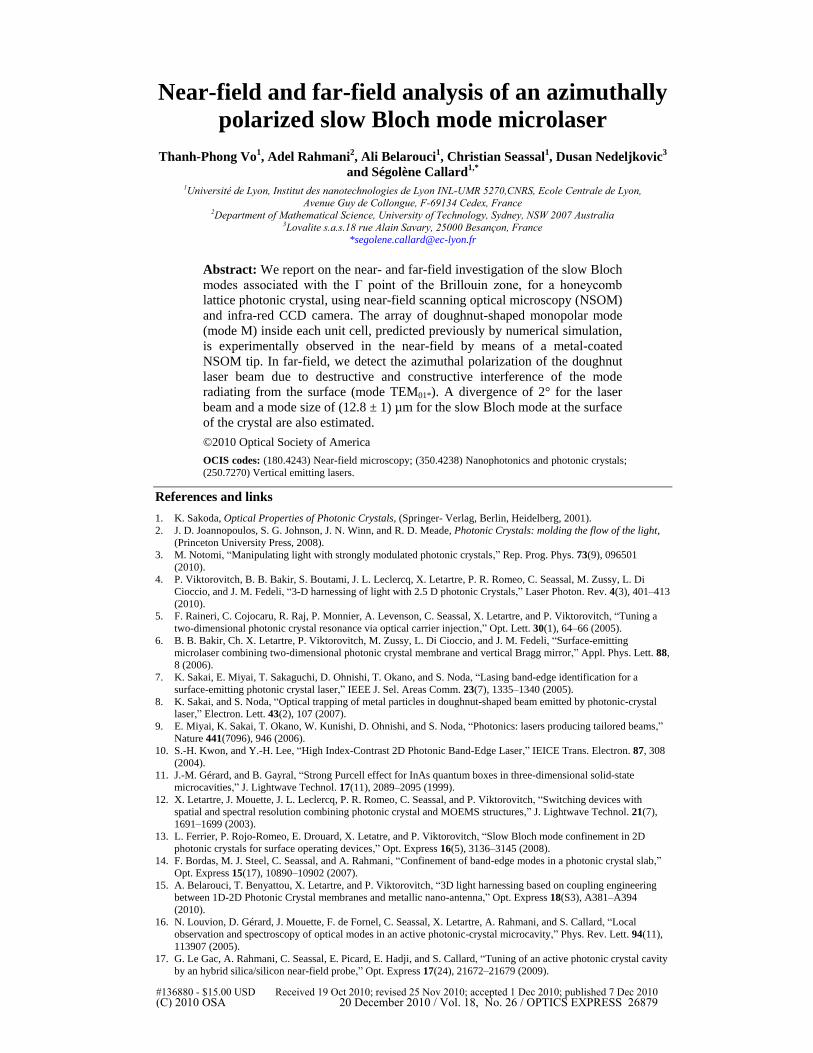
Near-field and far-field analysis of an azimuthally
polarized slow Bloch mode microlaser
Thanh-Phong Vo1, Adel Rahmani
2, Ali Belarouci
1, Christian Seassal
1, Dusan Nedeljkovic
3
and Ségolène Callard1,*
1Université de Lyon, Institut des nanotechnologies de Lyon INL-UMR 5270,CNRS, Ecole Centrale de Lyon,
Avenue Guy de Collongue, F-69134 Cedex, France 2Department of Mathematical Science, University of Technology, Sydney, NSW 2007 Australia
3Lovalite s.a.s.18 rue Alain Savary, 25000 Besançon, France
Abstract: We report on the near- and far-field investigation of the slow Bloch
modes associated with the Γ point of the Brillouin zone, for a honeycomb
lattice photonic crystal, using near-field scanning optical microscopy (NSOM)
and infra-red CCD camera. The array of doughnut-shaped monopolar mode
(mode M) inside each unit cell, predicted previously by numerical simulation,
is experimentally observed in the near-field by means of a metal-coated
NSOM tip. In far-field, we detect the azimuthal polarization of the doughnut
laser beam due to destructive and constructive interference of the mode
radiating from the surface (mode TEM01*). A divergence of 2° for the laser
beam and a mode size of (12.8 ± 1) µm for the slow Bloch mode at the surface
of the crystal are also estimated.
©2010 Optical Society of America
OCIS codes: (180.4243) Near-field microscopy; (350.4238) Nanophotonics and photonic crystals;
(250.7270) Vertical emitting lasers.
References and links
1. K. Sakoda, Optical Properties of Photonic Crystals, (Springer- Verlag, Berlin, Heidelberg, 2001).
2. J. D. Joannopoulos, S. G. Johnson, J. N. Winn, and R. D. Meade, Photonic Crystals: molding the flow of the light,
(Princeton University Press, 2008).
3. M. Notomi, “Manipulating light with strongly modulated photonic crystals,” Rep. Prog. Phys. 73(9), 096501
(2010).
4. P. Viktorovitch, B. B. Bakir, S. Boutami, J. L. Leclercq, X. Letartre, P. R. Romeo, C. Seassal, M. Zussy, L. Di
Cioccio, and J. M. Fedeli, “3-D harnessing of light with 2.5 D photonic Crystals,” Laser Photon. Rev. 4(3), 401–413
(2010).
5. F. Raineri, C. Cojocaru, R. Raj, P. Monnier, A. Levenson, C. Seassal, X. Letartre, and P. Viktorovitch, “Tuning a
two-dimensional photonic crystal resonance via optical carrier injection,” Opt. Lett. 30(1), 64–66 (2005).
6. B. B. Bakir, Ch. X. Letartre, P. Viktorovitch, M. Zussy, L. Di Cioccio, and J. M. Fedeli, “Surface-emitting
microlaser combining two-dimensional photonic crystal membrane and vertical Bragg mirror,” Appl. Phys. Lett. 88,
8 (2006).
7. K. Sakai, E. Miyai, T. Sakaguchi, D. Ohnishi, T. Okano, and S. Noda, “Lasing band-edge identification for a
surface-emitting photonic crystal laser,” IEEE J. Sel. Areas Comm. 23(7), 1335–1340 (2005).
8. K. Sakai, and S. Noda, “Optical trapping of metal particles in doughnut-shaped beam emitted by photonic-crystal
laser,” Electron. Lett. 43(2), 107 (2007).
9. E. Miyai, K. Sakai, T. Okano, W. Kunishi, D. Ohnishi, and S. Noda, “Photonics: lasers producing tailored beams,”
Nature 441(7096), 946 (2006).
10. S.-H. Kwon, and Y.-H. Lee, “High Index-Contrast 2D Photonic Band-Edge Laser,” IEICE Trans. Electron. 87, 308
(2004).
11. J.-M. Gérard, and B. Gayral, “Strong Purcell effect for InAs quantum boxes in three-dimensional solid-state
microcavities,” J. Lightwave Technol. 17(11), 2089–2095 (1999).
12. X. Letartre, J. Mouette, J. L. Leclercq, P. R. Romeo, C. Seassal, and P. Viktorovitch, “Switching devices with
spatial and spectral resolution combining photonic crystal and MOEMS structures,” J. Lightwave Technol. 21(7),
1691–1699 (2003).
13. L. Ferrier, P. Rojo-Romeo, E. Drouard, X. Letatre, and P. Viktorovitch, “Slow Bloch mode confinement in 2D
photonic crystals for surface operating devices,” Opt. Express 16(5), 3136–3145 (2008).
14. F. Bordas, M. J. Steel, C. Seassal, and A. Rahmani, “Confinement of band-edge modes in a photonic crystal slab,”
Opt. Express 15(17), 10890–10902 (2007).
15. A. Belarouci, T. Benyattou, X. Letartre, and P. Viktorovitch, “3D light harnessing based on coupling engineering
between 1D-2D Photonic Crystal membranes and metallic nano-antenna,” Opt. Express 18(S3), A381–A394
(2010).
16. N. Louvion, D. Gérard, J. Mouette, F. de Fornel, C. Seassal, X. Letartre, A. Rahmani, and S. Callard, “Local
observation and spectroscopy of optical modes in an active photonic-crystal microcavity,” Phys. Rev. Lett. 94(11),
113907 (2005).
17. G. Le Gac, A. Rahmani, C. Seassal, E. Picard, E. Hadji, and S. Callard, “Tuning of an active photonic crystal cavity
by an hybrid silica/silicon near-field probe,” Opt. Express 17(24), 21672–21679 (2009).
#136880 - $15.00 USD Received 19 Oct 2010; revised 25 Nov 2010; accepted 1 Dec 2010; published 7 Dec 2010(C) 2010 OSA 20 December 2010 / Vol. 18, No. 26 / OPTICS EXPRESS 26879

18. C. Monat, C. Seassal, X. Letartre, P. Regreny, P. Rojo Romeo, P. Viktorovitch, M. Le Vassor d'Yerville, D.
Cassagne, J. P. Albert, E. Jalaguier, S. Pocas, and B. Aspar, “InP-based two-dimensionnal photonic crystal on
silicon: InP-plane Bloch mode laser,” Appl. Phys. Lett. 81(27), 5102 (2002).
19. C. Monat, C. Seassal, X. Letartre, P. Regreny, M. Gendry, P. R. Romeo, P. Viktorovitch, M. Le Vassor d'Yerville,
D. Cassagne, J. P. Albert, E. Jalaguier, S. Pocas, and B. Aspar, “Two-dimensional hexagonal-shaped microcavities
formed in a two-dimensional photonic crystal on an InP membrane,” J. Appl. Phys. 93(1), 23 (2003).
20. R. Stöckle, C. Fokas, V. Deckert, R. Zenobi, B. Sick, B. Hecht, and U. P. Wild, “High-quality near-field optical
probes by tube etching,” Appl. Phys. Lett. 75(2), 160 (1999).
21. R. Bachelot, C. Ecoffet, D. Deloeil, P. Royer, and D. J. Lougnot, “Integration of micrometer-sized polymer
elements at the end of optical fibers by free-radical photopolymerization,” Appl. Opt. 40(32), 5860–5871 (2001).
22. G. Machavariani, Y. Lumer, I. Moshe, and S. Jackel, “Transforming the (0,1)* LG mode with radial polarization to
a nearly Gaussian beam by use of a spiral phase element and spatial filter,” Proc. SPIE 6346, 63461W (2006).
23. M. Mivelle, I. A. Ibrahim, F. Baida, G. W. Burr, D. Nedeljkovic, D. Charraut, J.-Y. Rauch, R. Salut, and T.
Grosjean, “Bowtie nano-aperture as interface between near-fields and a single-mode fiber,” Opt. Express 18(15),
15964–15974 (2010).
1. Introduction
2D-Photonic crystal (PC) structures have enabled the fabrication of a wide variety of
nanophotonic components [1,2]. In perfect PCs, the exploitation of the enhanced local density of
states at critical points of the band diagram has attracted considerable attention [3–6]. Near these
points, low curvature flat bands give rise to delocalized and stationary optical slow Bloch modes
(SBMs). These properties make them good candidates to enhance Purcell or various non-linear
effects [5] or to design low-threshold lasers [6]. Among these modes, SBMs emitting in the
vertical direction, i.e. located at the Γ-point of the Brillouin zone are particularly interesting for
integrating 2D PC architectures with free space optics. In particular, SBMs have proved to be
suitable for achieving strong vertical emission with peculiar polarization properties [7–10]. One
of the important features of these modes is their global lateral expansion inside the PC.
Theoretically, the expansion, i.e. the mode surface (S) is proportional to the band curvature
(which is intrinsic to the 2D-PC design) and to τ, the lifetime of the mode in the structure
[11,12]. The lifetime is linked to the coupling time τc between the SBM and radiating modes and
τloss, which is related to other losses (associated to PC defects, lateral escape of photons and
modal mismatch). In the case of an active structure, like a micro-laser, the mode expansion can
also be governed by other mechanisms involving carrier-induced refractive-index change [5].
Indeed, having a direct access to the mode surface is an important way to gain a better
understanding of the mode confinement mechanisms. While introducing defects in the PC can
be a very effective way to confine SBMs to a very small size [13,14], some applications, which
require a good coupling between a SBM and free-space radiation modes [15], require a spatially
broader SBM and it is therefore important to investigate how SBM behave in a defect-free PC
structure.
Conventional optical characterization techniques, such as micro-photoluminescence, give
valuable information on the far-field pattern of the mode. However, they fail to reveal the actual
size of the mode as only radiating light is collected. On the other hand, near-field optical
microscopy enables us to visualize the evanescent component of the mode with a spatial
resolution below the diffraction limit [16]. Consequently, in accordance with the convention of
near-field optics, the term near-field will be reserved here to processes that involves evanescent
waves which currently occur in within less of a half wavelength of the sample. In this paper, we
present a far-field and a near-field study of a 2D-PC Γ-point SBM laser mode. We show that the
far-field and the near-field image of the mode at the 2D-PC surface are different. Far-field
results show the direct production of azimuthally polarized doughnut mode. As opposed, near-
field results yield a better insight in the real mode structure inside the PC slab in agreement with
theoretical prediction. An accurate estimate of the mode size can be inferred from NSOM
measurements. We also show that for a Γ-point mode, the nature of the NSOM probe is a crucial
issue in obtaining the real mode profile. Here, we focused on the fundamental mode of a 2D-PC
honeycomb lattice of air holes in an InP membrane incorporating quantum wells. In the first
part, the theoretical spatial and spectral properties of the mode are described. Secondly, a far-
field polarization analysis of the SBM mode is presented. We then present NSOM experimental
results obtained with two types of probe: classical bare silica tip and metal-coated aperture tips.
2. Structure design and simulation
The PC design consists of an honeycomb lattice of cylindrical air holes (with a lattice parameter
A = 730 nm and a 245 nm hole diameter) patterned in a 240 nm thick InP slab bonded on top of
a SiO2 substrate. The PC structure is designed to support a low curvature band-edge mode at the
#136880 - $15.00 USD Received 19 Oct 2010; revised 25 Nov 2010; accepted 1 Dec 2010; published 7 Dec 2010(C) 2010 OSA 20 December 2010 / Vol. 18, No. 26 / OPTICS EXPRESS 26880

Γ point of the first- Brillouin zone [5,6]. The optical response of the structure was modeled
using 3D finite-difference time domain method (3D-FDTD) with perfectly matched layers
boundary conditions. The size of the PC structure is about 20x20 µm2 and consists of the PC
slab on a 2µm SiO2 substrate. Computational meshes were 30 nm for x, y, and z. The monopolar
mode is excited with a dipole placed near the center of the structure. Figure 1 presents the mode
intensity pattern, computed at the surface of the InP slab, for the band edge mode of lowest
energy, labeled M-mode for monopolar mode.
Fig. 1. 3D-FDTD simulation of the monopolar mode at the surface of a 2D-PC slab honeycomb
structure. a) Overview of the PC structure. b) Normalized field intensity (Ex2 + Ey2) at the surface
of the PC at 1602 nm. c) Zoom over the central part of the PC showing intensity map with the air
holes in black, d) Electric field pattern illustrating the azimuthally polarized field in each unit cell.
The simulation shows that the mode surface is limited by the edge of the PC-structure. The
mode intensity is maximum in the centre of the PC and its global envelop is gaussian. Moreover,
simulations indicate that the intensity is distributed in each honeycomb lattice unit cell as a
doughnut of about 260 nm of outer radius and 90 nm of inner radius. The polarization of the
electric field is indeed azimuthally polarized in each unit cell: the zero of the intensity of the
field at the centre of each hexagon is due to the phase singularity.
3. Experiments
The InP slab is single mode near 1.55µm and includes at its center four InAsP quantum wells
(QW), separated by InP barrier layers. The photoluminescence from the QWs occurs between
1350 nm and 1650 nm. This heterostructure is wafer-bonded onto the fused silica host substrate
[17]. Compared to silicon substrates, this design enables front side and back side photo-
excitation of the quantum wells. The PC is prepared by drilling a honeycomb lattice of air holes
in the slab using e-beam lithography followed by reactive ion etching [18,19]. The NSOM
experimental set up is presented in Fig. 2. It uses a stand alone commercial head (NT-MDT
SMENA), positioned at the top of an inverted microscope. Two different kinds of probes were
used: home-made bare silica tips [20] and polymer metallized tips [21] with aperture of 100 nm.
Both probes were made out of single mode optical fiber at 1.55µm with a core diameter of 9µm.
#136880 - $15.00 USD Received 19 Oct 2010; revised 25 Nov 2010; accepted 1 Dec 2010; published 7 Dec 2010(C) 2010 OSA 20 December 2010 / Vol. 18, No. 26 / OPTICS EXPRESS 26881

Fig. 2. Experimental set-up: near-field and far-field analysis are implemented.
The NSOM is working in collection mode: the tip collects the photoluminescence (PL) in
near-field at the surface of the sample. The PC structures are optically pumped at 780 nm with a
pulsed laser diode (with a 10% duty cycle) and modulated at 2 kHz. In this set up the sample is
pumped from the back side. The collimated laser beam is focused on the 2D-PC through the
silica substrate with a corrected objective (NA = 0.75). The excitation spot focused on the
surface has a Gaussian profile and a surface area less than 10μm by 10µm. Its position in the
2D-PC can be controlled accurately with the inverted microscope. The photoluminescence
signal is collected in the near-field by the probe and sent to a monochromator (1 nm resolution).
A long pass filter is used to eliminate completely the pump light (cutoff wavelength at 1100
nm). The signal is detected with a thermo-electrically cooled InGaAs photodetector. The
structure can be investigated over the spectral range between 1350 and 1650 nm. A lock-in
amplifier is used to demodulate the signal and enhance the signal to noise ratio. For topography
imaging, the fiber is attached to a piezoelectric tuning fork setup which allows a shear-force
feedback loop to regulate the distance between tip and sample surface (typically between 5 and
15 nm). In this configuration, topographic and photoluminescence images are recorded
simultaneously. Besides, the inverted microscope presents several output allowing the sample
observation in far-field in the visible range (silicon CCD camera) and in the IR range (Xeva-
076, Xenics).
4. Results and discussion
Fig. 3. Far-field and near-field spectra of honeycomb lattice normalized to the maximum
intensity. Mode M at λSBM = 1611 nm matching well in two types of measurement.
Figure 3 shows the photoluminescence spectra of the structure recorded in the far-field and
in the near-field and measured at room temperature. A strong and sharp peak corresponding to
#136880 - $15.00 USD Received 19 Oct 2010; revised 25 Nov 2010; accepted 1 Dec 2010; published 7 Dec 2010(C) 2010 OSA 20 December 2010 / Vol. 18, No. 26 / OPTICS EXPRESS 26882

laser emission was observed at 1611 nm. The peak wavelength is in good agreement with the
simulation value found for the monopolar mode (1602 nm). To confirm this assumption, far-
field and near-field investigations were conducted to characterize the shape and polarization of
the radiated beam and the spatial distribution of the mode inside the structure.
For the far-field study, the inverted microscope was used to form the image of the mode
through the NA = 0.75 objective. The image is obtained in far-field (as the objective only
collects radiating waves) but it does not constitute a radiation pattern as it corresponds to the
spatial distribution of the mode intensity at the surface of the structure. The results are displayed
in Fig. 4. The first one (Fig. 4a) is the image recorded without polarizer: it clearly shows a
doughnut-shaped mode. This shape is very different to what simulations predict for the mode
profile (Fig. 1.) at the surface of structure. However, the doughnut shape can be inferred from
the fact that these images are recorded in the far-field where processes of destructive and
constructive interferences take place and explain the fading of field in the center of the beam [7].
Fig. 4. Image of the mode at the surface of the PC in the far-field zone (the image is collected
through a microscope objective with an NA of 0.75). a) Image of the mode without polarizer, b)-
e) images with a polarizer oriented respectively at 0°, 60°, 90°, and 120°.
The beam patterns recorded through a polarizer are also shown in Fig. 4. Through the
polarizer, the doughnut is transformed into two lobes symmetrically located on either side of the
polarizer axis. These results indicate explicitly that the emitted beam is a TEM01* mode with an
azimuthal polarization [7–9]. This mode can also be expressed as the coherent superposition of
two Hermite-Gauss (HG) beams which have two lobes and no radial symmetry (HG10 with x
polarization and HG01 with y polarization) [22]. The polarizer effect is to select one of the HG
modes parallel to its orientation. This demonstrates the direct and simple generation of pure
azimuthal doughnut laser beam with a 2D-PC honeycomb lattice.
Near-field inspection of the mode allows a deeper understanding of the mode expansion
inside the PC. Two measurements have been performed in the near-field. In the first place, a
simple bare silica tip was used to collect the mode intensity at the surface of the 2D-PC. Figure
5c. shows an image recorded with a silicon CCD camera that displayed the contour of the whole
PC as well as the position and the size of the excitation spot (~10µm diameter). Figures 5a and
5b present respectively a topographic shear-force image of the structure and the optical image
recorded at the wavelength of mode M (1611 nm). Unexpectedly, the near-field image of the
mode reveals also a global doughnut shape. Unlike the simulation, this image displayed with the
bare silica tip shows that the intensity is minimum at the center of the excitation spot where it
should be maximum. Moreover, compared to the far-field image (Fig. 4a), the near-field image
shows additional features: the intensity map exhibits a periodic modulation which wavelength
fits well the Bloch mode period of the M mode (~730 nm). These sub wavelength features
confirm that the collection of light takes place in the near-field where the evanescent field is
more significant. The presence of the global doughnut shape in near-field can be explained by
the fact that the bare silica tip, besides converting evanescent light at the surface to propagating
light, is also able to collect a large amount of radiating light through its bare sides. At the Γ
point, M-mode emits strongly in the vertical direction to form the doughnut pattern recorded in
far-field. At the center of the doughnut of Fig. 5b, where no radiating light is observed due to
destructive interference, the optical intensity associated to the evanescent light is estimated to be
thirty times weaker than in the ring (Fig. 5d). In order to minimize the contribution of the
vertical radiation, one can use a metallized tip with an aperture.
#136880 - $15.00 USD Received 19 Oct 2010; revised 25 Nov 2010; accepted 1 Dec 2010; published 7 Dec 2010(C) 2010 OSA 20 December 2010 / Vol. 18, No. 26 / OPTICS EXPRESS 26883

Fig. 5. a) Topography in shear-force mode b) Near-field distribution of intensity of mode-M
recorded with a bare silica tip at 1611 nm, the scaling bar is 5 µm, c) CCD image in the visible
range of the excitation spot (780 nm) on the structure, the width of the gaussian beam is about 9.5
µm, d) Mode section recorded along the line P1 (corresponding to ΓK direction in the reciprocal
space)
Fig. 6. a) Topography in shear-force mode with metallized tip N°1 b) Near-field distribution of
intensity of mode-M recorded with tip N°1 at 1611 nm, the scaling bar is 5 µm, c) Topography
with tip N°2, d) Near-field distribution of intensity of mode-M recorded with tip N°2 at 1611 nm,
the scaling bar is 5 µm
The topographic and near-field images recorded with two different Al-coated tips are shown
in Fig. 6. In the Figs. 6a-6b with tip N°1, the large doughnut still appears. However, new
features are also visible in the centre where the radiating field vanishes: in each unit cell of the
PC, small doughnuts are clearly visible. In the Figs. 6c-6d with tip N°2, the large doughnut
almost disappears to the benefit of a triangular array of small doughnuts which is a clear
signature of the monopolar mode as presented in Fig. 1. Indeed, by quantitative measurement,
the new contrast of optical intensity between the ring of the large doughnut and its centre is
approximately thirteen fold for tip N°1 and fivefold for tip N°2. The difference between the two
intensity mapping of Figs. 6b and 6d is probably due to two different aperture sizes of the
metallized tips. We assumed that the aperture of tip N°1 is larger than tip N°2 because the #136880 - $15.00 USD Received 19 Oct 2010; revised 25 Nov 2010; accepted 1 Dec 2010; published 7 Dec 2010(C) 2010 OSA 20 December 2010 / Vol. 18, No. 26 / OPTICS EXPRESS 26884

amount of signal collected is higher: it also explained why the resolution of tip N°2 is better. It
also confirms that unlike the bare silica tip, the metallized tip succeeds to reveal the fine
structure of the SBM. Figure 7 shows that a small doughnut is indeed present in each unit cell of
the honeycomb lattice. The dimensions of these doughnuts are 310 nm for the outer radius and
70 nm for the inner radius which is consistent with the theoretical predictions of Fig. 1.
Fig. 7. Detail of the M-mode, a) Topographic image b) Optical near-field image at 1611 nm
(2.5µm x 2.5µm), circles indicate holes positions of the 2D-PC. In one unit cell, the outer radius
of the doughnut is 310 nm and the inner radius 70 nm (λ/10).
From near-field images, mode expansion inside the PC can also be inferred. Figure 8a
presents the mode expansion recorded under the same excitation conditions as Fig. 6. Though
the tip is still collecting an amount of radiating light which accounts for the slight non-
uniformity of the mode, it clearly shows that the mode reaches a maximum at the centre and
decreases monotically, in agreement with the predicted, theoretical mode profile (Fig. 1b).
Fig. 8. a) Near-field intensity distribution of mode-M collected with tip N°2 at 1611 nm b) Mode
section recorded along the direction of the white arrows of a), .
Cross section recorded along the symmetry axe of the honeycomb lattice (Fig. 8b) yield an
estimation of the size of the mode at the surface of the PC: considering the decay of the mode at
1/e2, the width of the mode is (12.8 ± 1)µm which is of the same order of magnitude as the
excitation spot. Taking this as the diameter of the beam waist, a divergence of 2° is expected for
this beam. The correlation between the excitation spot size and the mode surface tends to
confirm the modification of refractive-index induced by the pump. The SBM mode confinement
is attributed to the optical well created by the step-index existing between the pumped area and
the unpumped area [5]. Experiments with variable pumping area are under progress to study the
relationship between the pump size and the mode size.
5. Conclusion
We successfully investigated the distribution of slow Bloch monopolar mode at Γ-point on
perfect honeycomb structure both in far-field and near-field. The radiating mode M to the far-
field formed a doughnut shape due to destructive and constructive interference. For near-field
study by NSOM in collection mode, the array of doughnut patterns repeated by unit cell is
obtained. This result enables the unambiguous identification of the monopolar mode with the
3D-FDTD simulations. In addition, the simple and direct generation of pure azimuthally
doughnut laser beam with a 2D-PC honeycomb lattice was demonstrated. This opens the way to
other perspective for the development of such micro-lasers, as the total field symmetry of
azimuthally polarized mode makes it suitable for applications as optical trapping [8] or high
numerical aperture focusing. The importance of the tip selection for studying III-V photonic
#136880 - $15.00 USD Received 19 Oct 2010; revised 25 Nov 2010; accepted 1 Dec 2010; published 7 Dec 2010(C) 2010 OSA 20 December 2010 / Vol. 18, No. 26 / OPTICS EXPRESS 26885

crystal structures was also demonstrated. With vertical emitting structures bare silica tip is not
adapted for near-field mode inspection. Conversely, metallized tip is able to reveal the near-field
patterns of the optical modes. However, the collected intensity is much weaker due to the
nanoaperture. The ideal tip should be designed to optimize the coupling between the mode and
the tip. Functionalized tips with nano-antenna could meet this requirement [23]. Besides, as
nano-antenna response is polarization dependent, it should yield local information on the
polarization of the mode at the surface.
Acknowledgement
We thank Philippe Regreny for growing the epitaxial structures. The wafer bonding technology
was supplied by CEA-LETI. This work was supported by the Agence nationale de la Recherche
(Program NANOEC” N ANR07 NANS-036) and by an award under the Merit Allocation
Scheme on the National Computational Infrastructure at the Australian National University.
#136880 - $15.00 USD Received 19 Oct 2010; revised 25 Nov 2010; accepted 1 Dec 2010; published 7 Dec 2010(C) 2010 OSA 20 December 2010 / Vol. 18, No. 26 / OPTICS EXPRESS 26886