Embed Size (px)
Citation preview
Pediatric Pulmonology
Neck Circumference Percentile: A Screening Tool forPediatric Obstructive Sleep Apnea
Sherri Katz, MSc, MDCM, FRCPC,1,2* Kimmo Murto, MD, FRCPC,2,3 Nicholas Barrowman, PhD,4
Janine Clarke, BSc, BPHE,5 Lynda Hoey,4 Franco Momoli, PhD,4,6,7 Robert Laberge, MD, FRCPC,2,8
and Jean-Philippe Vaccani, MD, B. Med. Sc., FRCSC2,9
Summary. Rationale: Large neck circumference (NC) is associated with obstructive sleep apnea
(OSA) in adults, especially males. Since NC changes with age and sex, a lack of reference ranges
makes neck size difficult to assess as a screening tool in children. Methods: Using a population-
baseddataset of 1,913 children, we developed reference ranges for NCbyageand sex for children
aged 6–17 years. In this study, we collected NC data on 245 children aged 6–17 years presenting
to the Children’s Hospital of Eastern Ontario for polysomnography. The association between
NC> the 95th percentile and OSA (total apnea-hypopnea-index>5events/hr and/or obstructive-
apnea-index�1event/hr) was explored. Thresholds of BMI percentile and waist circumference
were also examined. Results: Individuals with NC>95th percentile for age and sex had increased
risk of OSA (relative risk 1.7 [95% CI 1.0–3.0], P¼0.04), compared to those with NC�95th
percentile. BMI�95th percentile gave similar results (relative risk 1.8 [95%CI 1.1–2.9],P¼0.02).
When examined by sex, the association was significant in males�12 years (relative risk 3.3 [95%
CI 1.0–10.4], P¼0.04), but not females (P¼0.63). Neither BMI�95th percentile nor waist
circumference>95th percentile was significant. Conclusions: Children and youth with NC>95th
percentile for age and sex have significantly increased risk of OSA. This effect is significant in
males�12 years, whereas BMI is not. NC percentile may be an additional screening tool for OSA
in children and youth. Pediatr Pulmonol. � 2014 Wiley Periodicals, Inc.
Key words: neck circumference; obstructive sleep apnea; pediatric; percentiles;
predictor.
Funding source: Children’s Hospital of Eastern Ontario Research Institute, Children’s
Hospital of Eastern Ontario Departments of Anaesthesia, Pediatrics, and Surgery.
1Division of Respirology, Department of Pediatrics, Children’s Hospital of
Eastern Ontario, University of Ottawa, Ottawa, Ontario, Canada.
2Faculty of Medicine, University of Ottawa, Ottawa, Ontario, Canada.
3Department of Anesthesiology, Children’s Hospital of Eastern Ontario,
University of Ottawa, Ottawa, Ontario, Canada.
4Clinical Research Unit, Children’s Hospital of Eastern Ontario Research
Institute, University of Ottawa, Ottawa, Ontario, Canada.
5Statistics Canada, Health Statistics Division, Ottawa, Canada.
6Clinical Epidemiology, Ottawa Hospital Research Institute, Ottawa,
Ontario, Canada.
7Department of Epidemiology and Community Medicine, University of
Ottawa, Ottawa, Ontario, Canada.
8Department of Pediatrics, Children’s Hospital of Eastern Ontario,
University of Ottawa, Ottawa, Ontario, Canada.
9Department of Otolaryngology, Children’s Hospital of Eastern Ontario,
University of Ottawa, Ottawa, Ontario, Canada.
Conflict of interest: None.
This research was conducted at the Children’s Hospital of Eastern Ontario,
Ottawa, Ontario, Canada.
This work was presented as a poster at the Sleep conference in 2013. (Katz
SL, Murto K, Barrowman N, Clarke J, Hoey L, Momoli F, Vaccani JP. Neck
Circumference Percentile: A Screening Tool for Pediatric Obstructive Sleep
Apnea. SLEEP, 2013, 36:A382.) The data presented at the conference,
however, utilized a preliminary set of reference data for neck circumference,
which has since been refined.
�Correspondence to: Sherri Katz, MSc, MDCM, FRCPC, Children’s
Hospital of Eastern Ontario, 401 Smyth Rd, Ottawa, Ontario, Canada K1H
8L1. E-mail: [email protected]
Received 22 October 2013; Revised 12 December 2013; Accepted 20
January 2014.
DOI 10.1002/ppul.23003
Published online in Wiley Online Library
(wileyonlinelibrary.com).
� 2014 Wiley Periodicals, Inc.
INTRODUCTION
Obstructive sleep apnea (OSA) is increasingly beingrecognized in children and has significant associatedmorbidity.1 Diagnosis of OSA, however, is challenging.Questionnaires and physical examination findings, in-cluding tonsil size, are poor predictors of its presence.2
The gold standard diagnostic test, polysomnography(PSG), has limited availability, is expensive and resourceintensive. A simple clinical measurement that can helpidentify children at risk of OSA is therefore needed inorder to prioritize PSG testing.There is increasing recognition of obesity as a major
cause of pediatric OSA,3–5 a trend which is expected toescalate, as the pediatric obesity epidemic grows.6 Amongstadults, however, there ismounting evidence that it is not justtotal adiposity, but rather the distribution of adiposity,whichcontributes toOSA risk. Fat deposition around the trunk andupper body predisposes to airway collapse and results inincreased workload to maintain airway patency.7 In adults,central adiposity8,9 and enlarged neck circumference(NC)10–14 are predictors of OSA.One of the challenges in using NC as a predictor of
OSA in children and youth is determining a normal necksize, since NC changes with age, sex, and pubertal status.Age- and sex-adjusted reference ranges are thereforeneeded. The World Health Organization recommendsdevelopment of pediatric reference values, using rigoroussampling methods and describing a reference populationof healthy weight children.15 Our group has developedreference ranges for NC by age and sex for children aged6–17 years, using a large population-based data set of1,409 Canadian children with bodymass index (BMI) lessthan 85th percentile. We hypothesize that children withNC greater than the 95th percentile for age and sex haveincreased relative risk of OSA, compared to those withNC� 95 percentile and that NC is a better predictor ofOSA than BMI or waist circumference (WC). Further-more, we hypothesize that NCwill be a better predictor ofOSA in peri- and post-pubertal children. The objectives ofthis study were: 1) to evaluate the relative risk of OSA inchildren above the 95th percentile of NC; 2) to evaluatethis relative risk amongst those 12 years of age and older
compared to those under 12, separately by sex; and 3) tocompare NC above the 95th percentile to thresholds foroverweight and obesity (BMI� 85th or 95th percentile),as well as WC, in terms of sensitivity and specificity topredict OSA.
METHODS
This prospective observational study included 250children aged 6–17 years, sequentially scheduled toundergo polysomnography at the Children’s Hospital ofEastern Ontario from May 2008 to September 2011, whogave consent/assent for participation. Children with aprevious diagnosis of OSA, treated with positive airwaypressure or tracheostomy were excluded. Ethics approvalwas obtained from the Children’s Hospital of EasternOntario Research Ethics Board. Demographic variablesmeasured included height, weight, WC, NC,16 and NCpercentile, determined from reference values for Canadi-an children and youth.17 NC was measured at the mostprominent part of the thyroid cartilage, with the child’shead erect and eyes facing forward, according to ourpublished protocol, which provides good reliability(repeatability co-efficient 1.3 cm).16 WC was measuredat the point equidistant between the iliac crest and thelowest rib according to an established protocol, in those11 years and older, for whom reference percentiles wereavailable.18 All measurements were performed on thenight of PSG testing.Polysomnographies were performed and scored accord-
ing to American Association of Sleep Medicine stand-ards.19 Children were considered to have OSA if their totalapnea-hypopnea index was greater than (>) 5 events/hrand/or their obstructive apnea index was greater than orequal to (�) 1 event/hr on PSG. While a variety ofdefinitions of OSA in children have been used in theliterature, the strict definition used here satisfies conditionsidentified in most of the pivotal studies of OSA prevalenceand treatment.1 To explore the impact of using a less strictdefinition of OSA, the definition used in the ChildhoodAdenotonsillectomy Study (CHAT), consisting of AHI�2 events/hr and/or OAI> 1 event/hr was also tested.20
In the clinical experience of our laboratory, roughly20–30% of children referred for PSG are found to haveOSA. Since, we were aiming to detect a relative risk of 2or greater, we anticipated that approximately 15% ofchildren with NC� 95th percentile would be found tohave OSA, compared to 30% of those with NC> 95thpercentile. If NC> 95th percentile has a prevalence ofapproximately 50%, and the probability of type-I error isfixed at 5%, then a sample of 250 children would provideapproximately 81% power to detect an effect of thismagnitude.Demographic and anthropometric characteristics were
summarized using descriptive statistics and nonparametric
ABBREVIATIONS:
% percent
> greater than
� greater than or equal to
BMI body mass index
CI confidence interval
IQR interquartile range
NC neck circumference
OSA obstructive sleep apnea
PSG polysomnography
WC waist circumference
2 Katz et al.
Pediatric Pulmonology
correlations between BMI, NC, and WC were computed.Comparisons of anthropometrics were performed betweenthose with and without OSA using Fisher’s exact test forsex and Student’s t-test or Wilcoxon’s rank sum test, asappropriate for other variables. The distribution of NCpercentiles for the population with and without OSAwasalso examined. The proportion of NC> 95th percentilewas compared between thosewith and without OSA usingFisher’s exact test.The 95th percentile of NC was chosen as a promising
candidate cut point for predicting OSA. This representsthe highest percentile that could be estimated in thereference sample, corresponding to the most extremeneck sizes, which would be expected to give the greatestspecificity for screening OSA. Relative risk of OSAwith95% confidence interval (95%, CI) was calculated forchildren with NC> 95th percentile compared to thoseequal to or below, using a log binomial model. In order toassess those children pre-puberty compared to those peri-and post-puberty, children under 12 years and those12 years and older were compared. Again using logbinomial models, relative risk was determined for thefollowing subgroups: less than 12 years, �12 years, andseparately for males and females �12 years.Finally, the associations between thresholds of BMI
representing overweight and obese conditions (� the 85thand 95th percentiles, respectively)21 and OSA risk werecompared. The association of WC> 95th percentile andOSA risk was also evaluated in the older sub-groups (�12years), for whom reference values were available forCanadian youth.18
RESULTS
The study population consisted of 250 children andyouth, ranging in age from 6.0 to 17.98 years. Data onNC were available for 245, who comprised the finalstudy sample. One hundred forty-three (58.4%) of thesubjects were overweight or obese (BMI� 85 percentile;Table 1). Fifty-two (21.2%) of the sample had OSA andnone had central sleep apnea. A higher proportion ofmales had OSA compared to females. BMI percentilewas also higher amongst those who had OSA, but therange was quite wide (8.2–99.9). Absolute NC values(range 19.0–50.0 cm) did not differ between those withand without OSA.
Fifty-six percent of the population also had NC above the95th percentile (Table 2). The proportion of NC> 95thpercentile was greater amongst thosewith OSA comparedto those without (P¼ 0.04).Correlations between anthropometric measures were
next evaluated. For NC, the Spearman correlation withBMI is 0.82, which accounts for 68% of the variabilityin BMI. The Spearman correlation between WC andBMI is 0.92, suggesting that approximately 85% of thevariability in BMI can be accounted for by WC. Themedian BMI percentile when NC was above the 95thpercentile was 98.6% (interquartile range (IQR) 91.6–99.5%). Amongst those with NC percentile above the95th, 17% had BMI less than the 85th percentile. Themedian BMI percentile when WC was above the 95thpercentile was 98.7% (IQR 95.2–99.4%) and 8% hadBMI less than the 85th percentile when WC was abovethe 95th.The relative risk of OSA was increased if NC was
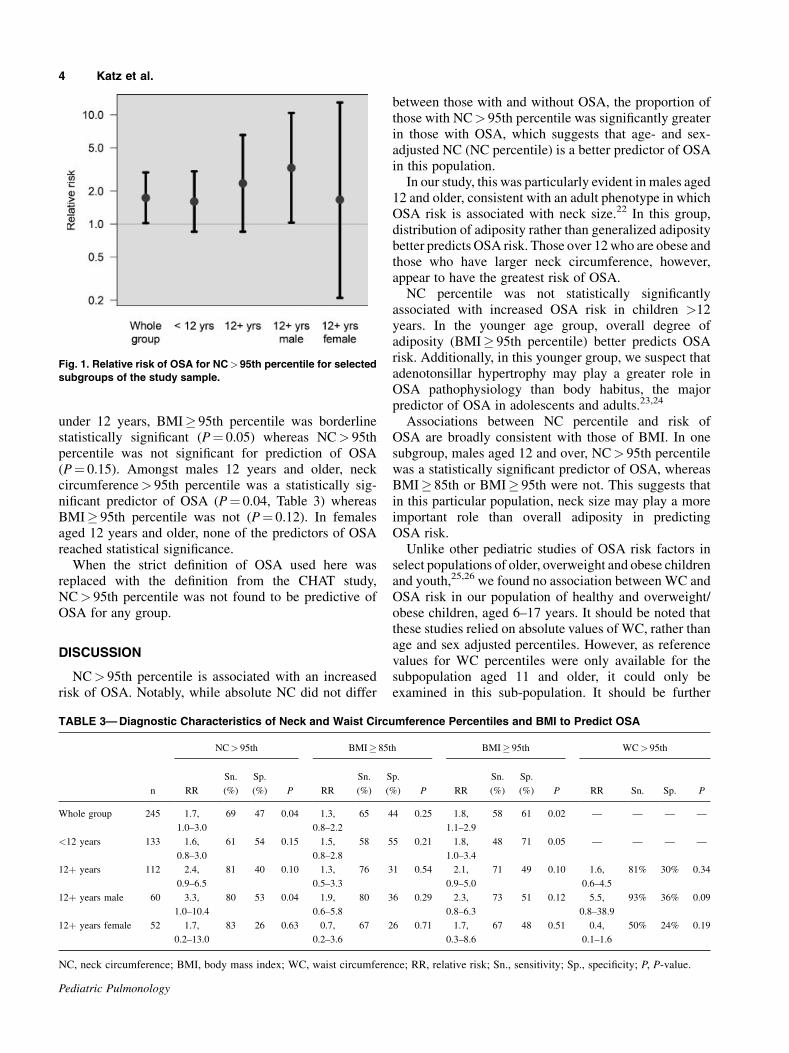
>95th percentile for the whole study population (RR¼ 1.7, P¼ 0.04). This effect was not significant for thoseunder 12 years old (RR 1.6, P¼ 0.15). Sub-analysisrevealed the highest relative risk (3.3, P¼ 0.04) for males12 years and older, but no significantly increased risk ofOSA for females 12 years and older (RR¼ 1.7, P¼ 0.63;Fig. 1 and Table 3). In both males and females, neitherWC> 95th percentile nor BMI� 95th percentile wassignificantly associated with OSA (Table 3).For the whole group, OSA predictive performance of
NC above the 95th percentile was similar to that ofBMI� 95th percentile. NC> 95th percentile detectednine cases of OSA that would not have been predicted byBMI� 95th percentile, whereas BMI� 95th percentiledetected three cases of OSA that would not have beenpredicted by NC percentile> 95th percentile. In children
TABLE 1—Characteristics of the Study Sample (N¼ 245)
Whole group, N¼ 245 Children with OSA, N¼ 52 Children with no OSA, N¼ 193 P
Age (years); mean (range) 11.7 (6.0–17.9) 11.2 (6.2–17.8) 11.9 (6.0–17.9) 0.19
Male; n (%) 136 (56%) 36 (69%) 100 (52%) 0.03
BMI percentile; median (IQR) 91.1 (58.6–99.0) 96.6 (81.1–99.5) 73.2 (55.0–98.7) 0.02
NC (cm); median (IQR) 31.0 (28.0–36.0) 32.0 (28.0–37.0) 31.0 (28.0–35.0) 0.58
IQR, interquartile range.
TABLE 2—Distribution of Neck Circumference Percentiles
Percentile
interval
Whole group,
N¼ 245
Children with
OSA, N¼ 52
Children with no
OSA, N¼ 193
<5th 8 (3%) 3 (6%) 5 (3%)
5th–50th 42 (17%) 5 (10%) 37 (19%)
>50th–95th 57 (23%) 8 (15%) 49 (25%)
>95th 138 (56%) 36 (69%) 102 (53%)
Neck Circumference Percentile Predicts OSA in Kids 3
Pediatric Pulmonology
under 12 years, BMI� 95th percentile was borderlinestatistically significant (P¼ 0.05) whereas NC> 95thpercentile was not significant for prediction of OSA(P¼ 0.15). Amongst males 12 years and older, neckcircumference> 95th percentile was a statistically sig-nificant predictor of OSA (P¼ 0.04, Table 3) whereasBMI� 95th percentile was not (P¼ 0.12). In femalesaged 12 years and older, none of the predictors of OSAreached statistical significance.When the strict definition of OSA used here was
replaced with the definition from the CHAT study,NC> 95th percentile was not found to be predictive ofOSA for any group.
DISCUSSION
NC> 95th percentile is associated with an increasedrisk of OSA. Notably, while absolute NC did not differ
between those with and without OSA, the proportion ofthose with NC> 95th percentile was significantly greaterin those with OSA, which suggests that age- and sex-adjusted NC (NC percentile) is a better predictor of OSAin this population.In our study, this was particularly evident in males aged
12 and older, consistent with an adult phenotype in whichOSA risk is associated with neck size.22 In this group,distribution of adiposity rather than generalized adipositybetter predicts OSA risk. Those over 12who are obese andthose who have larger neck circumference, however,appear to have the greatest risk of OSA.NC percentile was not statistically significantly
associated with increased OSA risk in children >12years. In the younger age group, overall degree ofadiposity (BMI� 95th percentile) better predicts OSArisk. Additionally, in this younger group, we suspect thatadenotonsillar hypertrophy may play a greater role inOSA pathophysiology than body habitus, the majorpredictor of OSA in adolescents and adults.23,24
Associations between NC percentile and risk ofOSA are broadly consistent with those of BMI. In onesubgroup, males aged 12 and over, NC> 95th percentilewas a statistically significant predictor of OSA, whereasBMI� 85th or BMI� 95th were not. This suggests thatin this particular population, neck size may play a moreimportant role than overall adiposity in predictingOSA risk.Unlike other pediatric studies of OSA risk factors in
select populations of older, overweight and obese childrenand youth,25,26 we found no association between WC andOSA risk in our population of healthy and overweight/obese children, aged 6–17 years. It should be noted thatthese studies relied on absolute values of WC, rather thanage and sex adjusted percentiles. However, as referencevalues for WC percentiles were only available for thesubpopulation aged 11 and older, it could only beexamined in this sub-population. It should be further
Fig. 1. Relative risk of OSA for NC>95th percentile for selected
subgroups of the study sample.
TABLE 3—Diagnostic Characteristics of Neck and Waist Circumference Percentiles and BMI to Predict OSA
NC> 95th BMI� 85th BMI� 95th WC> 95th
n RR
Sn.
(%)
Sp.
(%) P RR
Sn.
(%)
Sp.
(%) P RR
Sn.
(%)
Sp.
(%) P RR Sn. Sp. P
Whole group 245 1.7,
1.0–3.0
69 47 0.04 1.3,
0.8–2.2
65 44 0.25 1.8,
1.1–2.9
58 61 0.02 — — — —
<12 years 133 1.6,
0.8–3.0
61 54 0.15 1.5,
0.8–2.8
58 55 0.21 1.8,
1.0–3.4
48 71 0.05 — — — —
12þ years 112 2.4,
0.9–6.5
81 40 0.10 1.3,
0.5–3.3
76 31 0.54 2.1,
0.9–5.0
71 49 0.10 1.6,
0.6–4.5
81% 30% 0.34
12þ years male 60 3.3,
1.0–10.4
80 53 0.04 1.9,
0.6–5.8
80 36 0.29 2.3,
0.8–6.3
73 51 0.12 5.5,
0.8–38.9
93% 36% 0.09
12þ years female 52 1.7,
0.2–13.0
83 26 0.63 0.7,
0.2–3.6
67 26 0.71 1.7,
0.3–8.6
67 48 0.51 0.4,
0.1–1.6
50% 24% 0.19
NC, neck circumference; BMI, body mass index; WC, waist circumference; RR, relative risk; Sn., sensitivity; Sp., specificity; P, P-value.
4 Katz et al.
Pediatric Pulmonology
noted, that WC reference percentile values used werederived from a population of healthy- and unhealthy-weight individuals whereas NC reference values werederived from a healthy weight population.17 This is astrength of the NC reference data set, since it may allowbetter discrimination between healthy individuals andthose at risk of adverse health conditions.15
The strict definition of OSA applied in this study allowsdetection of clinically significant OSA and is consistentwith many studies in the literature.1 This definition waschosen in order to ensure that if NC thresholds are used inclinical practice, moderate-severe OSA would be de-tected. One challenge in the diagnosis of OSA in childrenis the widespread lack of sufficient resources to conductPSG, the gold standard for diagnosis, on all childrensuspected of having OSA. Screening to predict those withmore severe disease, in order to prioritize them fordefinitive PSG testing would be a more effective use of alimited resource. Applying a less strict definition of OSAmay be of less clinical utility. Nonetheless, a less strictdefinition of OSA, used in the CHAT study, was alsoconsidered. However, using these criteria for OSArevealed a NC> 95 percentile was not predictive ofOSA risk.This study has some limitations. Pubertal status was not
directly assessed, as this is a socially sensitive measure-ment. Instead, age 12 or above was used as a surrogate forperi- or post-pubertal status. Second, although derivedfrom a nationally representative healthy-weight popula-tion, the reference data set for NCwas not large enough todiscriminate NC just above the 95th percentile frommuchmore extreme NC measurements, which may be betterpredictors of OSA. This may have resulted in a ceilingeffect, which may have weakened the predictive power ofNC percentiles in our study. Furthermore, the group offemales aged 12 and over was small, which may havelimited our ability to detect associations betweenanthropometrics and OSA. Our findings are consistentwith the adult literature, however, in which upper-bodyobesity is more strongly associated with OSA risk inmales, whereas waist-to-hip ratio may be more predictivein adult females.27,28
In adults, NC is strongly associated with risk ofOSA10,11,29 and has been incorporated into a number ofscreening tools for OSA.13,14,30–32 One model, includingNC, BMI, and oral cavity measurements had a sensitivityof 100%, positive predictive value of 100% and negativepredictive value of 88.5%.33 Such a multifactorial modelfor OSA prediction in children and youth warrants pursuitin further studies. Nonetheless, NC corrected for height inadults, which standardizes NC for body size in a mannersomewhat analogous to the methodology used in thisstudy, has been shown to be a better predictor of OSA thangeneralized obesity.12 Furthermore, in adults, a neck sizeover 18 in. is associated with OSA.32 In children, this
measurement must consider age and sex, as neck sizechanges with growth. Interestingly, in children and youth,neck sizes significantly smaller than 18 in. were associat-ed with OSA risk. In males over 12, where NC> 95thpercentile was a statistically significant predictor of OSA,the 95th percentile of NC in healthy-weight males rangesfrom 13.0 in. at age 12–15.3 in. at age 16 years.17 Thus,even in peri/post-pubertal individuals who may beapproaching adult height and weight, neck sizes at alower threshold than in adults may be helpful in screeningfor OSA. NC above the 95th percentile adjusted for ageand sex is therefore a practical tool for predicting OSA inchildren and youth and should be considered an indicationfor expedited PSG.
ACKNOWLEDGEMENTS
Wewould like to thank those children and families whoparticipated in the study. Funding was received from theChildren’s Hospital of Eastern Ontario Research Instituteand the Children’s Hospital of Eastern Ontario, Depart-ments of Anesthesia, Surgery and Pediatrics, for operat-ing costs of this study. The sponsors had no involvementin study design or conduct.
REFERENCES
1. Marcus CL, Brooks LJ, Draper KA, Gozal D, Halbower AC,
Jones J, Schechter MS, Ward SD, Sheldon SH, Shiffman RN,
Lehmann C, Spruyt K. Diagnosis and management of childhood
obstructive sleep apnea syndrome. Pediatrics 2012;130:e714–
e755.
2. Dixon JB, Schachter LM, O’Brien PE. Predicting sleep apnea and
excessive day sleepiness in the severely obese: indicators for
polysomnography. Chest 2003;123:1134–1141.
3. WingYK,Hui SH, PakWM,HoCK, CheungA, Li AM, FokTF. A
controlled study of sleep related disordered breathing in obese
children. Arch Dis Child 2003;88:1043–1047.
4. Silvestri JM, Weese-Mayer DE, Bass MT, Kenny AS, Hauptman
SA, Pearsall SM. Polysomnography in obese children with a
history of sleep-associated breathing disorders. Pediatr Pulmonol
1993;16:124–129.
5. Marcus CL, Curtis S, Koerner CB, Joffe A, Serwint JR, Loughlin
GM. Evaluation of pulmonary function and polysomnography in
obese children and adolescents. Pediatr Pulmonol 1996;21:176–
183.
6. Tremblay MS, Katzmarzyk PT, Willms JD. Temporal trends in
overweight and obesity in Canada, 1981–1996. Int J Obes Relat
Metab Disord 2002;26:538–543.
7. Tung A. The biology and genetics of obesity and obstructive sleep
apnea. Anesthesiol Clin North America 2005;23:445–461, vi.
8. Schwartz AR, Patil SP, Laffan AM, Polotsky V, Schneider H,
Smith PL. Obesity and obstructive sleep apnea: pathogenic
mechanisms and therapeutic approaches. [Review] [191 refs].
Proc Am Thorac Soc 2008;5:185–192.
9. Simpson L, Mukherjee S, Cooper MN, Ward KL, Lee JD, Fedson
AC, Potter J, Hillman DR, Eastwood P, Palmer LJ, Kirkness J. Sex
differences in the association of regional fat distribution with the
severity of obstructive sleep apnea. Erratum appears in Sleep.
2010; Aug 1;33(8): preceding 1003 Note: Hillman Fanzca, David
R [corrected to Hillman, David R]. Sleep 2010;33:467–474.
Neck Circumference Percentile Predicts OSA in Kids 5
Pediatric Pulmonology
10. Davies RJ, Stradling JR. The relationship between neck
circumference, radiographic pharyngeal anatomy, and the
obstructive sleep apnoea syndrome. Eur Respir J 1990;3:509–
514.
11. Hoffstein V, Mateika S. Differences in abdominal and neck
circumferences in patients with and without obstructive sleep
apnoea. Eur Respir J 1992;5:377–381.
12. Davies RJ, Ali NJ, Stradling JR. Neck circumference and other
clinical features in the diagnosis of the obstructive sleep apnoea
syndrome. Thorax 1992;47:101–105.
13. Sharma SK, Kurian S, Malik V, Mohan A, Banga A, Pandey RM,
Handa KK, Mukhopadhyay S. A stepped approach for prediction
of obstructive sleep apnea in overtly asymptomatic obese subjects:
a hospital based study. Sleep Med 2004;5:351–357.
14. Chung F, Yegneswaran B, Liao P, Chung SA, Vairavanathan S,
Islam S, Khajehdehi A, Shapiro CM. STOP questionnaire: a tool to
screen patients for obstructive sleep apnea. Anesthesiology
2008;108:812–821.
15. World Health Organization. WHO child growth standards: length/
height-for-age, weight-for-age, weight-for-length, weight-for
height and body mass index-for-age: methods and development.
2006.
16. Laberge R, Vaccani JP, Gow RM, Gaboury I, Hoey L, Katz SL.
Inter and intra rater reliability of neck circumference measure-
ments in children. Pediatr Pulmonol 2009;44:64–69.
17. Katz SL, Vaccani JP, Clarke J, Hoey L, Colley R, Barrowman N.
2013; Towards Creation of a Screening Tool for Obstructive Sleep
Apnea: Reference Neck Sizes in Children. Under review at BMC
Pediatrics.
18. Katzmarzyk PT. Waist circumference percentiles for Canadian
youth 11–18y of age. Eur J Clin Nutr 2004;58:1011–1015.
19. Iber C, Ancoli-Israel S, Chesson AL, Quan SF. American academy
of sleep medicine. The AASM manual for the scoring of sleep and
associated events: rules, terminology and technical specifications.
1 edition. Westchester: American Academy of Sleep Medicine;
2007.
20. Redline S, Amin R, Beebe D, Chervin RD, Garetz SL, Giordani B,
Marcus CL, Moore RH, Rosen CL, Arens R, Gozal D, Katz ES,
Mitchell RB, Muzumdar H, Taylor HG, Thomas N, Ellenberg S.
The Childhood Adenotonsillectomy Trial (CHAT): rationale,
design, and challenges of a randomized controlled trial evaluating
a standard surgical procedure in a pediatric population. Sleep
2011;34:1509–1517.
21. Kuczmarski RJ, Ogden CL, Guo S. 2000; CDC Growth Charts for
the United States: Methods and Development. 2002. Report nr 11.
22. Ronen O, Malhotra A, Pillar G, Ronen O, Malhotra A, Pillar G.
Influence of gender and age on upper-airway length during
development. Pediatrics 2007;120:e1028–e1034.
23. Marcus CL. Pathophysiology of childhood obstructive sleep
apnea: current concepts. Respir Physiol 2000;119:143–1454.
24. Bhattacharjee R, Kheirandish-Gozal L, Spruyt K, Mitchell RB,
Promchiarak J, Simakajornboon N, Kaditis AG, Splaingard D,
Splaingard M, Brooks LJ, Marcus CL, Sin S, Arens R, Verhulst
SL, Gozal D. Adenotonsillectomy outcomes in treatment of
obstructive sleep apnea in children: a multicenter retrospective
study. Am J Respir Crit Care Med 2010;182:676–683.
25. Verhulst SL, Schrauwen N, Haentjens D, Suys B, Rooman RP, Van
GL, DeBacker WA, Desager KN. Sleep-disordered breathing in
overweight and obese children and adolescents: prevalence,
characteristics and the role of fat distribution. Arch Dis Child
2007;92:205–208.
26. Bixler EO, Vgontzas AN, Lin HM, Liao D, Calhoun S, Vela-
Bueno A, Fedok F, Vlasic V, Graff G. Sleep disordered breathing
in children in a general population sample: prevalence and risk
factors. Sleep 2009;32:731–736.
27. Millman RP, Carlisle CC, McGarvey ST, Eveloff SE, Levinson
PD. Body fat distribution and sleep apnea severity in women.
Chest 1995;107:362–366.
28. Martinez-Rivera C, Abad J, Fiz JA, Rios J, Morera J. Usefulness of
truncal obesity indices as predictive factors for obstructive sleep
apnea syndrome. Obesity 2008;16:113–118.
29. Katz I, Stradling J, Slutsky AS, Zamel N, Hoffstein V. Do patients
with obstructive sleep apnea have thick necks? AmRev Respir Dis
1990;141:1228–1231.
30. Santaolalla MF, Iriondo Bedialauneta JR, Aguirre LU, Martinez
IA, Sanchez Del RA, Sanchez Fernandez JM. The predictive value
of clinical and epidemiological parameters in the identification of
patients with obstructive sleep apnoea (OSA): a clinical prediction
algorithm in the evaluation of OSA. Eur Arch Otorhinolaryngol
2007;264:637–643.
31. Bouloukaki I, Kapsimalis F, Mermigkis C, Kryger M, Tzanakis N,
Panagou P, Moniaki V, Vlachaki EM, Varouchakis G, Siafakas
NM, Schiza SE. Prediction of obstructive sleep apnea syndrome in
a large Greek population. Sleep Breath 2011;15:657–664.
32. Chung F, Yang Y, Liao P. Predictive performance of the STOP-
Bang score for identifying obstructive sleep apnea in obese
patients. Obes Surg 2013;23:2050–2057.
33. Kushida CA, Efron B, Guilleminault C. A predictive morphomet-
ric model for the obstructive sleep apnea syndrome. Ann Intern
Med 1997;127:581–587.
6 Katz et al.
Pediatric Pulmonology