Embed Size (px)
Citation preview
Research on structural health monitoring and damage detection of buried pipelines University of Michigan
NEESR SG – Damage Detection and Health Monitoring of Buried Pipelines
after Earthquake-Induced Ground Movement
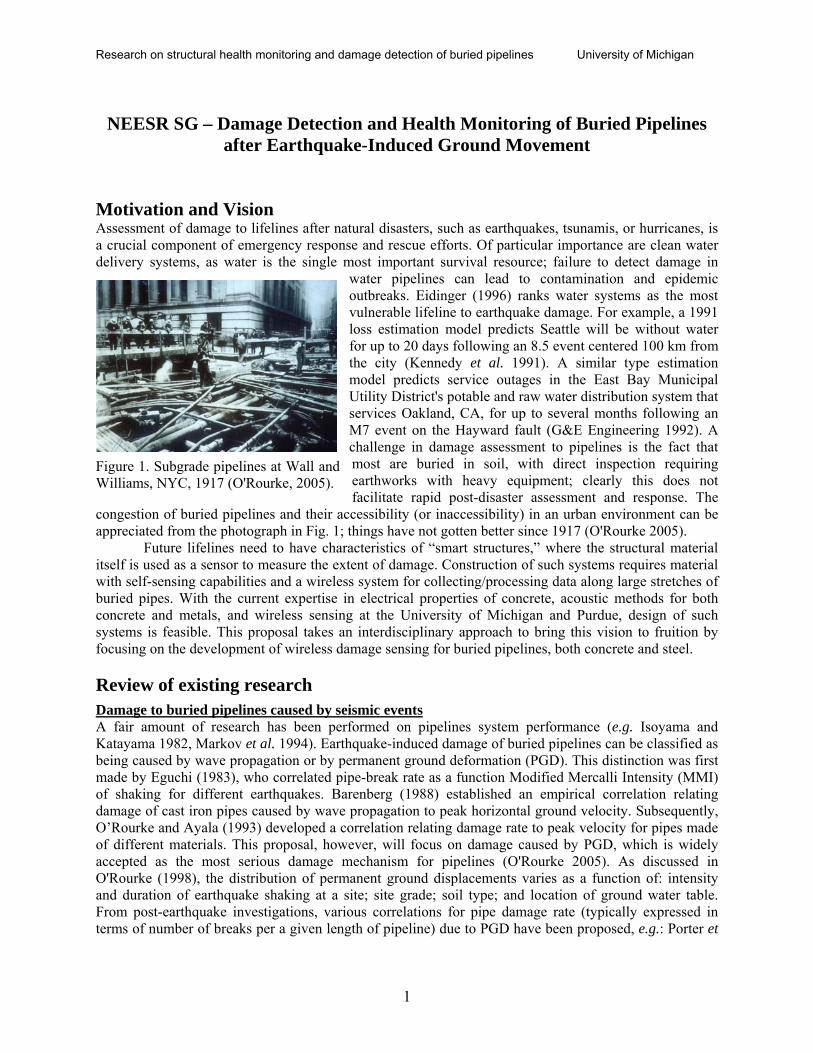
Motivation and Vision Assessment of damage to lifelines after natural disasters, such as earthquakes, tsunamis, or hurricanes, is a crucial component of emergency response and rescue efforts. Of particular importance are clean water delivery systems, as water is the single most important survival resource; failure to detect damage in
water pipelines can lead to contamination and epidemic outbreaks. Eidinger (1996) ranks water systems as the most vulnerable lifeline to earthquake damage. For example, a 1991 loss estimation model predicts Seattle will be without water for up to 20 days following an 8.5 event centered 100 km from the city (Kennedy et al. 1991). A similar type estimation model predicts service outages in the East Bay Municipal Utility District's potable and raw water distribution system that services Oakland, CA, for up to several months following an M7 event on the Hayward fault (G&E Engineering 1992). A challenge in damage assessment to pipelines is the fact that most are buried in soil, with direct inspection requiring earthworks with heavy equipment; clearly this does not facilitate rapid post-disaster assessment and response. The
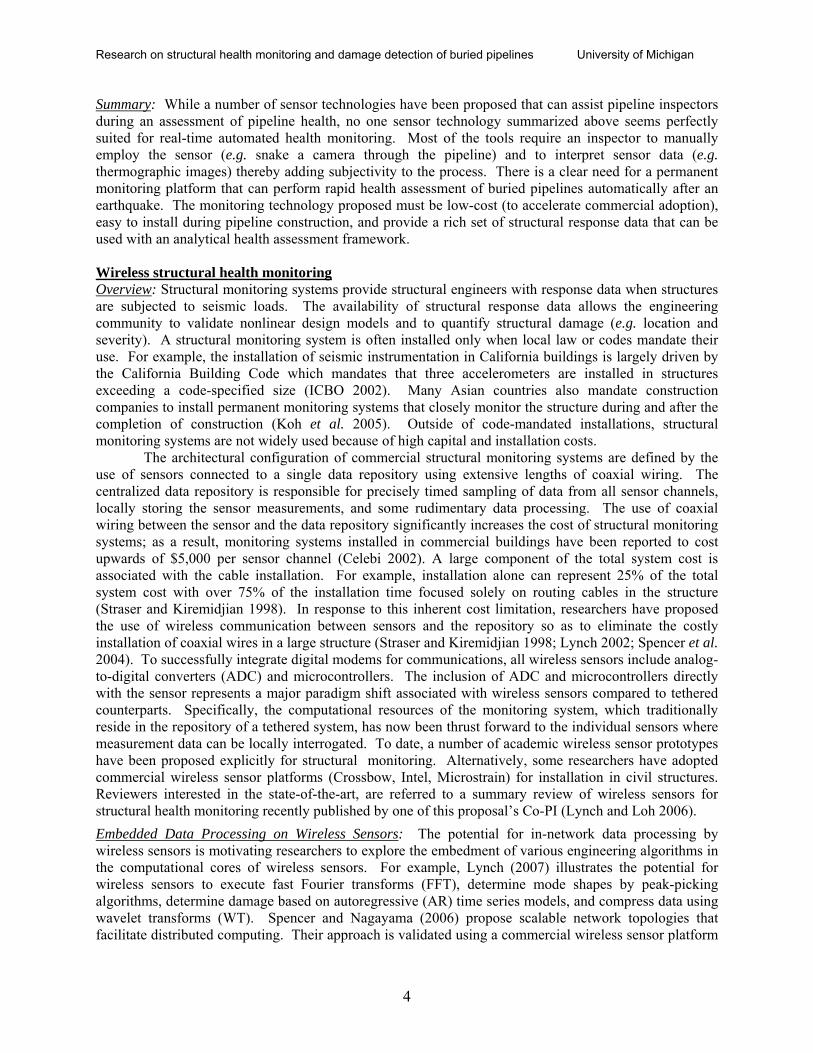
congestion of buried pipelines and their accessibility (or inaccessibility) in an urban environment can be appreciated from the photograph in Fig. 1; things have not gotten better since 1917 (O'Rourke 2005).
Figure 1. Subgrade pipelines at Wall andWilliams, NYC, 1917 (O'Rourke, 2005).
Future lifelines need to have characteristics of “smart structures,” where the structural material itself is used as a sensor to measure the extent of damage. Construction of such systems requires material with self-sensing capabilities and a wireless system for collecting/processing data along large stretches of buried pipes. With the current expertise in electrical properties of concrete, acoustic methods for both concrete and metals, and wireless sensing at the University of Michigan and Purdue, design of such systems is feasible. This proposal takes an interdisciplinary approach to bring this vision to fruition by focusing on the development of wireless damage sensing for buried pipelines, both concrete and steel.
Review of existing research
Damage to buried pipelines caused by seismic events A fair amount of research has been performed on pipelines system performance (e.g. Isoyama and Katayama 1982, Markov et al. 1994). Earthquake-induced damage of buried pipelines can be classified as being caused by wave propagation or by permanent ground deformation (PGD). This distinction was first made by Eguchi (1983), who correlated pipe-break rate as a function Modified Mercalli Intensity (MMI) of shaking for different earthquakes. Barenberg (1988) established an empirical correlation relating damage of cast iron pipes caused by wave propagation to peak horizontal ground velocity. Subsequently, O’Rourke and Ayala (1993) developed a correlation relating damage rate to peak velocity for pipes made of different materials. This proposal, however, will focus on damage caused by PGD, which is widely accepted as the most serious damage mechanism for pipelines (O'Rourke 2005). As discussed in O'Rourke (1998), the distribution of permanent ground displacements varies as a function of: intensity and duration of earthquake shaking at a site; site grade; soil type; and location of ground water table. From post-earthquake investigations, various correlations for pipe damage rate (typically expressed in terms of number of breaks per a given length of pipeline) due to PGD have been proposed, e.g.: Porter et
1
Research on structural health monitoring and damage detection of buried pipelines University of Michigan
al. (1991), Heubach (1995), Eidinger et al. (1995), and O'Rourke et al. (1998). Correlations can be categorized based on types of pipe (e.g. iron, asbestos cement) and PGD (e.g. distributed or localized).
A pipeline intersecting a fault that undergoes movement is primarily subjected to bending and shear, but integrated normal stress may result in the overall tensile or compressive force in a given cross-section. This depends on the orientation at which the pipeline crosses a fault plane. Several simplified models for soil-pipe interaction have been proposed for the various deformation modes (e.g. Newmark and Hall (1975), Kennedy et al. (1977), O'Rourke et al. (1985), O'Rourke and Liu (1999)), with comprehensive summaries of the state-of-the-practice being given in O'Rourke and Liu (1999) and O'Rourke (2003). These models can be further categorized depending on whether they apply to continuous or segmented pipes. [Note: It is these types of models that will be embedded on the wireless sensors to process measured data.] In addition to simplified models, detailed finite element analyses have been performed on pipelines subjected to PGD (e.g. Liu and O'Rourke (1997), Yoshisaki et al. (2001)). Existing inspection technologies for pipeline systems
Condition Assessment of Metallic Pipelines: The energy sector has conducted regular inspection of their metallic pipelines for well over 60 years due to significant cost savings offered by vigilant inspection (Ciocco et al. 2002). One common strategy for inspecting pipelines located above grade includes visual inspection by a trained professional. Other evaluation methods include simple hydrodynamic modeling of the pipeline flows using in-line flow meters and pressure sensors; observable digressions from the model signify potential leaks or failures within the pipeline (Liu 2003). However, for pipelines located in difficult to reach locations or buried below the surface, the installation of sensors or the use of remote sensing technologies are needed for non-destructive evaluation (NDE) of pipeline conditions.
A major sensor technology that has found widespread use in the energy sector for monitoring pipeline health are “smart” pigs. Pigs are small rubberized packages that can be placed within the pipeline and transported by control of differential pressure in the pipeline network. Originally intended to clean the interior surfaces of pipelines, pigs today are fitted with sophisticated instrumentation to inspect pipelines for damage and signs of corrosion (Liu 2003). Most pigs carry two types of sensing transducers used for pipeline inspection: remote field eddy current sensors and ultrasonic transducers (Grigg 2006). The pig is fitted with two electrical coils that act as a remote eddy current sensor. An electrical current is applied to the first coil resulting in the generation of a magnetic field. The second coil, spaced a few centimeters along the pig, is then used to measure two magnetic fields resulting from the first coil: a direct magnetic field generated by the first coil and a remote magnetic field generated by the first coil’s introduction of eddy currents in the metallic pipe wall (Burais and Nicolas 1989). Flaws in the pipeline (i.e. corrosion pitting, cracks) alter the flow of the pipe’s eddy currents and hence can be observed by variations in the remote magnetic field. The second set of sensors installed on the pig are ultrasonic elements used to assess loss of pipeline thickness due to corrosion. The pigs launch ultrasonic waves along the pipeline length and correlate the propagation speed of the ultrasonic waves to the pipeline thickness.
An alternative approach to sensing pipeline health is to mount acoustic and ultrasonic emission transducers to the surface of the pipe as part of a permanent monitoring system. Piezoelectric transducers are used to introduce guided elastic waves (i.e. Lamb waves) into the metallic pipe wall so that their propagation properties (e.g. attenuation, velocity, reflections) can be correlated to the physical condition of the system. There exists both analytical and experimental work in the literature on Lamb wave propagation in the longitudinal (Rose 1999) and circumferential (Towfighi et al. 2002) directions of both isotropic and anisotropic pipeline systems. Attractive features of Lamb waves in particular is that they can be directed and propagate over very long distances with little attenuation (up to one hundred meters).
Internal Sensing of Concrete Pipelines: One commonly employed inspection method for assessment of concrete pipelines is the use of cameras. Cameras are either placed within the pipe at a manhole access point, or, are moved through the pipe length by a robotic system (Sinha and Fieguth 2006). Some disadvantages of camera inspection is that it is labor intensive and only provides a visual depiction of pipe
2
Research on structural health monitoring and damage detection of buried pipelines University of Michigan
internal surfaces; cracks are not always clearly identified by an inspectors subjective assessment of the visual picture. Furthermore, robotic driven cameras have been reported to frequently get stuck in the pipe.
When the internal area of the pipeline is readily accessible, ultrasonic transducers can also be used to map the pipe condition. One such tool is the rotating sonic caliper (RSC) consisting of an ultrasonic transducer that emits an ultrasonic pulse from inside the pipe in one radial direction; the amplitude and time of the returning pulse (due to the reflections from the inner pipe wall) is used to measure pipe thickness and to identify pipe cracks (Wirahadikusumah et al. 1998). The RSC is designed so that the ultrasonic tip can rotate all directions allowing the circumference of the pipe at a location to be mapped. While RSC has been successfully employed to inspect clay and concrete pipes, it can not inspect beyond the inner pipe surface due to high attenuation of the ultrasonic signal (Duran et al. 2002).
An alternative approach is to employ ultrasonic non-destructive evaluation of buried concrete pipelines. Unlike the success this approach has had in the energy sector where metallic pipelines are used, the use of ultrasonic Lamb waves to inspect concrete pipes has been limited. This is largely due poor elastic wave propagation characteristics of cementitious materials (Ciocco et al. 2002). As a result, a large number of ultrasonic sensors would be needed along the pipeline length, supported by a large data acquisition system. Furthermore, characterization of damage and/or defects can be hampered by the inhomogeneous nature of concrete pipes. Finally, the eddy current technique widely used in the energy sector has also been applied to monitor waterline pipelines. For example, the San Diego Water Authority uses remote field eddy current methods to assess the condition of steel tendons in prestressed concrete cylinder pipes (Grigg 2006).
Fiber Optic Strain Sensing in Pipelines: Since the 1970’s, the civil engineering profession has extensively explored the use of fiber optic sensors such as Fiber Bragg Gratings (FBG) to measure the distribution of strain in large-scale infrastructure systems. The FBG strain sensor consists of a traditional silicon glass fiber upon which a Bragg grating is etched (Tennyson 2003). When the Bragg grating is strained, the wavelength reflected by the grating changes linearly. A broad range of static and dynamic strains can be accurately measured with FBG sensors including strains as small as 1 με (Inaudi 2003). Fiber optic strain sensing has many advantages that have generated much excitement: sensor signals are immune to electromagnetic and radio frequency interference, fibers are unobtrusive, and the fact that the sensor is a true distributed sensor with multiple (4 to 16) Bragg gratings serially multiplexed on one single cable. Various field deployments of FBG strain sensors on pipeline systems have reported. For example, a 500 m stretch of a large gas pipeline in Italy has recently been instrumented with FBG strain sensors to monitor its strain response to landslides (Inaudi and Glisic 2005). While fiber optic monitoring has superb performance characteristics, the cost of the technology is out of reach for most pipeline applications. The cost of a fiber optic system can range from $20K to $100K (Bergmeister 2000).
Remote Sensing Approaches to Concrete Pipeline Inspection: Pipelines can also be inspected using remote sensor technologies deployed above grade. For example, infrared thermography systems (ITS) have been proposed for monitoring the thermal effects associated with pipeline leaks and poor backfill conditions (Inagaki and Okamoto 1997). For example, thermographic images taken in St. Louis were successful in identifying surface thermal conditions consistent with a ruptured water pipeline (Weil 1998). However, ITS is labor-intensive and subjective interpretation of thermograms often leading to false diagnosis of pipeline conditions (Wirahadikusumah et al. 1998). Ground penetrating radar (GPR) is another remote sensing technology that can be used to image the condition of buried pipeline systems. GPR consists of antennas employed above grade that burst impulses of electromagnetic energy into the ground. Reflections from boundaries between two different dielectrics (e.g. soil layers, soil-pipe boundary, pipeline structural defects) are received back to the same antenna. Two challenges associated with GPR is the need to use large beam widths and the general attenuation of radar in soil; these factors lead to poor radar images from which inspectors must judge the pipeline condition (Hayakawa and Kawanaka 1998). While poor image quality can be mitigated by sophisticated GPR signal processing and image reconstruction techniques, more work is needed in this area.
3
Research on structural health monitoring and damage detection of buried pipelines University of Michigan
Summary: While a number of sensor technologies have been proposed that can assist pipeline inspectors during an assessment of pipeline health, no one sensor technology summarized above seems perfectly suited for real-time automated health monitoring. Most of the tools require an inspector to manually employ the sensor (e.g. snake a camera through the pipeline) and to interpret sensor data (e.g. thermographic images) thereby adding subjectivity to the process. There is a clear need for a permanent monitoring platform that can perform rapid health assessment of buried pipelines automatically after an earthquake. The monitoring technology proposed must be low-cost (to accelerate commercial adoption), easy to install during pipeline construction, and provide a rich set of structural response data that can be used with an analytical health assessment framework. Wireless structural health monitoring Overview: Structural monitoring systems provide structural engineers with response data when structures are subjected to seismic loads. The availability of structural response data allows the engineering community to validate nonlinear design models and to quantify structural damage (e.g. location and severity). A structural monitoring system is often installed only when local law or codes mandate their use. For example, the installation of seismic instrumentation in California buildings is largely driven by the California Building Code which mandates that three accelerometers are installed in structures exceeding a code-specified size (ICBO 2002). Many Asian countries also mandate construction companies to install permanent monitoring systems that closely monitor the structure during and after the completion of construction (Koh et al. 2005). Outside of code-mandated installations, structural monitoring systems are not widely used because of high capital and installation costs.
The architectural configuration of commercial structural monitoring systems are defined by the use of sensors connected to a single data repository using extensive lengths of coaxial wiring. The centralized data repository is responsible for precisely timed sampling of data from all sensor channels, locally storing the sensor measurements, and some rudimentary data processing. The use of coaxial wiring between the sensor and the data repository significantly increases the cost of structural monitoring systems; as a result, monitoring systems installed in commercial buildings have been reported to cost upwards of $5,000 per sensor channel (Celebi 2002). A large component of the total system cost is associated with the cable installation. For example, installation alone can represent 25% of the total system cost with over 75% of the installation time focused solely on routing cables in the structure (Straser and Kiremidjian 1998). In response to this inherent cost limitation, researchers have proposed the use of wireless communication between sensors and the repository so as to eliminate the costly installation of coaxial wires in a large structure (Straser and Kiremidjian 1998; Lynch 2002; Spencer et al. 2004). To successfully integrate digital modems for communications, all wireless sensors include analog-to-digital converters (ADC) and microcontrollers. The inclusion of ADC and microcontrollers directly with the sensor represents a major paradigm shift associated with wireless sensors compared to tethered counterparts. Specifically, the computational resources of the monitoring system, which traditionally reside in the repository of a tethered system, has now been thrust forward to the individual sensors where measurement data can be locally interrogated. To date, a number of academic wireless sensor prototypes have been proposed explicitly for structural monitoring. Alternatively, some researchers have adopted commercial wireless sensor platforms (Crossbow, Intel, Microstrain) for installation in civil structures. Reviewers interested in the state-of-the-art, are referred to a summary review of wireless sensors for structural health monitoring recently published by one of this proposal’s Co-PI (Lynch and Loh 2006).
Embedded Data Processing on Wireless Sensors: The potential for in-network data processing by wireless sensors is motivating researchers to explore the embedment of various engineering algorithms in the computational cores of wireless sensors. For example, Lynch (2007) illustrates the potential for wireless sensors to execute fast Fourier transforms (FFT), determine mode shapes by peak-picking algorithms, determine damage based on autoregressive (AR) time series models, and compress data using wavelet transforms (WT). Spencer and Nagayama (2006) propose scalable network topologies that facilitate distributed computing. Their approach is validated using a commercial wireless sensor platform
4
Research on structural health monitoring and damage detection of buried pipelines University of Michigan
(Intel iMote2) that performs damage detection based on damage locating vectors (DLV). Zimmerman and Lynch (2006) embed model updating algorithms on wireless sensors to update analytical models of a structure using actual measurement data. Zhang and Li (2006) also showcase an embedded wavelet-based data compression scheme for wireless sensors monitoring the dynamic response of structures.
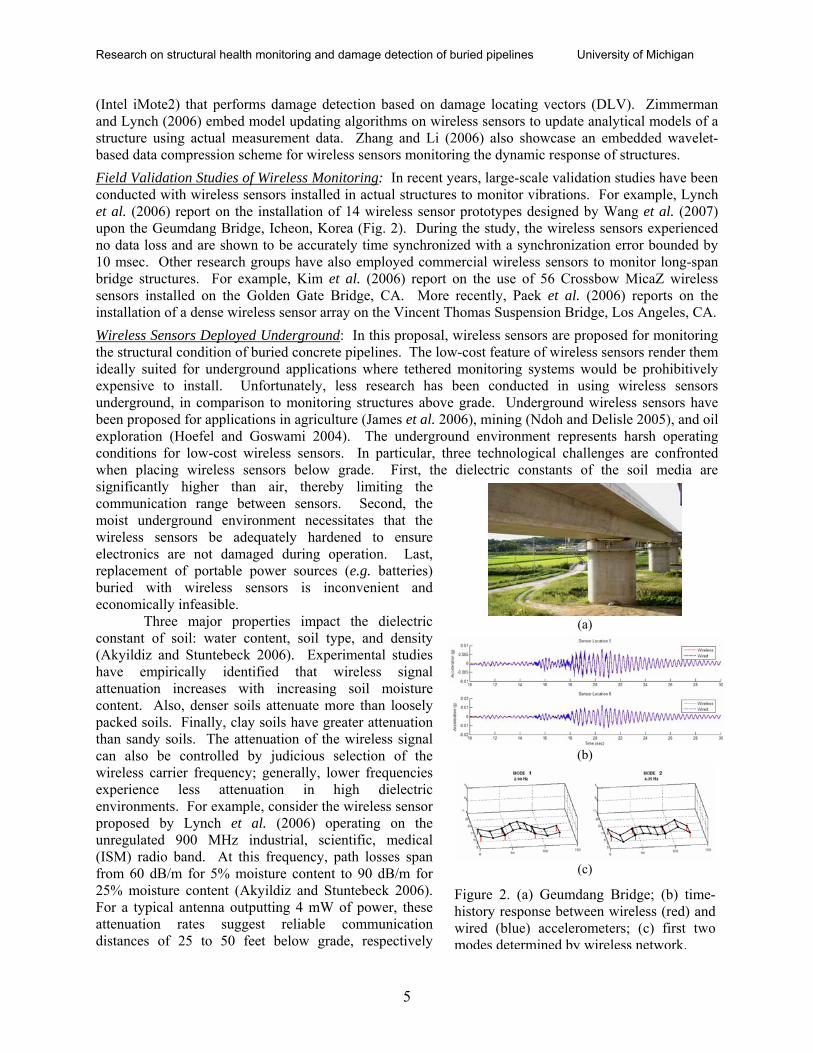
Field Validation Studies of Wireless Monitoring: In recent years, large-scale validation studies have been conducted with wireless sensors installed in actual structures to monitor vibrations. For example, Lynch et al. (2006) report on the installation of 14 wireless sensor prototypes designed by Wang et al. (2007) upon the Geumdang Bridge, Icheon, Korea (Fig. 2). During the study, the wireless sensors experienced no data loss and are shown to be accurately time synchronized with a synchronization error bounded by 10 msec. Other research groups have also employed commercial wireless sensors to monitor long-span bridge structures. For example, Kim et al. (2006) report on the use of 56 Crossbow MicaZ wireless sensors installed on the Golden Gate Bridge, CA. More recently, Paek et al. (2006) reports on the installation of a dense wireless sensor array on the Vincent Thomas Suspension Bridge, Los Angeles, CA.
Wireless Sensors Deployed Underground: In this proposal, wireless sensors are proposed for monitoring the structural condition of buried concrete pipelines. The low-cost feature of wireless sensors render them ideally suited for underground applications where tethered monitoring systems would be prohibitively expensive to install. Unfortunately, less research has been conducted in using wireless sensors underground, in comparison to monitoring structures above grade. Underground wireless sensors have been proposed for applications in agriculture (James et al. 2006), mining (Ndoh and Delisle 2005), and oil exploration (Hoefel and Goswami 2004). The underground environment represents harsh operating conditions for low-cost wireless sensors. In particular, three technological challenges are confronted when placing wireless sensors below grade. First, the dielectric constants of the soil media are significantly higher than air, thereby limiting the communication range between sensors. Second, the moist underground environment necessitates that the wireless sensors be adequately hardened to ensure electronics are not damaged during operation. Last, replacement of portable power sources (e.g. batteries) buried with wireless sensors is inconvenient and economically infeasible.
Three major properties impact the dielectric constant of soil: water content, soil type, and density (Akyildiz and Stuntebeck 2006). Experimental studies have empirically identified that wireless signal attenuation increases with increasing soil moisture content. Also, denser soils attenuate more than loosely packed soils. Finally, clay soils have greater attenuation than sandy soils. The attenuation of the wireless signal can also be controlled by judicious selection of the wireless carrier frequency; generally, lower frequencies experience less attenuation in high dielectric environments. For example, consider the wireless sensor proposed by Lynch et al. (2006) operating on the unregulated 900 MHz industrial, scientific, medical (ISM) radio band. At this frequency, path losses span from 60 dB/m for 5% moisture content to 90 dB/m for 25% moisture content (Akyildiz and Stuntebeck 2006). For a typical antenna outputting 4 mW of power, these attenuation rates suggest reliable communication distances of 25 to 50 feet below grade, respectively
(a)
(b)
(c)
Figure 2. (a) Geumdang Bridge; (b) time-history response between wireless (red) and wired (blue) accelerometers; (c) first two modes determined by wireless network.
5
Research on structural health monitoring and damage detection of buried pipelines University of Michigan
(Maxstream 2005).
Electrical properties of cementitious materials The mechanical properties of cement-based materials (e.g. concrete, fiber reinforced cementitious composites) have been thoroughly explored to produce stronger and more durable building materials. In contrast, their electrical properties have not been as widely investigated. Material resistivity is the measure of how easy it is for electrical current to flow normal to two faces of a unit volume. The resistivity of cementitious materials depends on their chemical content but generally are classified as semi-conductors with resistivity spanning from 103 to 108 Ω-cm (Whiting and Nagi 2003). Unlike metals where current is the transport of electrons, current in cementitious materials is the flow of ions within the porous material. Hammond and Robson (1955) report on the resistivity of concrete and cement-based materials as a function of the amount of cement content, water-cement ratio, and aggregate and admixture types. Electrical properties can also be used to monitor curing processes since resistivity and water content are strongly correlated (Malhotra and Carino 2004). Monitoring the resistivity of reinforced concrete can also be used to indirectly measure the corrosion of steel reinforcement (Hope et al. 1985). In recent years, researchers have expanded their understanding of cementitious material resistivity so that these materials can be used to self-sense strain and damage. Cementitious materials are natural piezoresistors that experience linear change in resistance due to strain (Chung 2003). A fixed direct current (I) is applied to a cementitious sample with the voltage potential (V) measured; based on Ohm’s Law (V=IR), the resistance (R) of the material can be determined. As the sample is strained, its resistance undergoes a corresponding change. Resistivity measurements can also be used to identify the formation of crack damage within cementitious specimens. When the cementitious material cracks, its gage factor undergoes a distinct change (Chung 2003; Lynch and Hou 2005). Most cementitious materials are complex composites consisting of multiple phases and phase interfaces. A direct result of the composite complexity, the electrical response characteristics of cement composites have a strong dependency upon the frequency of the AC electrical signal. To reveal the electrical properties of cementitious composites over a full spectrum of electrical frequencies, electrical impedance spectroscopy (EIS) is typically employed. In EIS, an AC sinusoidal current with regulated amplitude is input to a specimen as the AC voltage response is measured (namely, amplitude and phase shift). Based on distortions in the amplitude and phase of the output signal, specimen impedances are determined. Cracks within cement-based specimens produce impedance plots distinctly different from those of undamaged specimens. EIS has been used to monitor the formation of cracks in fiber reinforced cement composites (Peled et al. 2001) .
Acoustic properties of cementitious materials Acoustic emission describes the elastic energy that is released by materials undergoing deformation (Miller and Drouillard 1996). These emissions are commonly attributed to cracking or fracture in materials like concrete. Acoustic emission monitoring is frequently used for pressure vessels and piplelines since the tests do not require downtime. As a result acoustic emission has been used to detect damage along active metallic (Skalskyi et al. 1995, Shehadeh et al. 2006) concrete (Buchanan 1992) and composite tanks (Ramirez et al. 2006). While acoustic emission has several advantages, it is reported to be expensive, complex to implement due to instrumentation and cabling costs, and only able to capture damage at higher stress levels than what have previously been experienced in the structure (SEI/ASCE 11-99). The implementation of wireless sensors can dramatically improve the cost and removes the complexities due to cabling. While many think that acoustic emission only captures the elastic wave caused by the generation of a crack, other sources may also generate the acoustic activity that is detected during testing. For example, Yoon et al. (2000a) demonstrated that reinforced concrete elements will generate acoustic activity during loading and unloading at loads substantially below the failure load. This acoustic activity can be attributed to friction between the reinforcing steel and concrete as it occurs during loading and unloading. This activity can be substantially greater than that caused by the development of new cracks. This is similar to the felicity effect that is observed in fiber reinforced plastic vessels (Miller and Drouillard 1996). The activity generated by sliding friction tends to be substantially different that
6
Research on structural health monitoring and damage detection of buried pipelines University of Michigan
activity caused by tensile cracking. Yoon et al. (2000b) differentiated between failure modes through cross plots of amplitude and duration and wavelet analysis. Puri (2003, 2006) used acoustic emission to detect the location of damage when concrete was tested in compression. They demonstrated that mechanical fracture energy was linearly correlated with the measured acoustic energy, however this measure was not proven to be independent of specimen geometry. Concerns about specimen geometry are due to the relatively short distances that acoustic waves can travel without substantial attenuation. One advantage of the concrete pressure pipe geometry is the existence of the steel sleeve in the pipe can serve as a wave guide which will enable signals to propagate much further along the length of the pipe. The characteristics of the acoustic activity signals (i.e., amplitude and duration) will be used to distinguish acoustic activity that due to bell and spigot connection sliding or flexural failure of the pipe. Linear triangulation can also be used to detect the position of damage along the length of the pipe system. Project Description
Justification Lifelines are crucial components of any infrastructure system. Whether water delivery or for telecommunication lines, they are required for a modern society to function. Estimates of lifelines damage during 1994 Northridge earthquake are in excess of $2 billion (Earthquake Engineering Handbook 2003). Rapid damage detection (and subsequent repair) is critical to minimizing the adverse effect of natural disasters, such as earthquakes, on society. Information on the behavior of buried pipes during ground motions is limited, and methods of damage detection require earthworks to expose the pipes. Non-intrusive fast “trenchless” methods for damage detection of pipelines will significantly improve emergency response to natural disasters, and will enhance the capabilities for health monitoring of this distributed infrastructure. Design of non-intrusive fast trenchless methods is challenging both from the material sensing and signal transmission standpoint. Acoustic (wave propagation) methods for sensing metal pipe damage will be employed. For concrete pipes with a novel approach is proposed based on cultivation of material self-sensing capabilities. A robust and reliable method of data collection and delivery is necessary to communicate pipeline response signals from their underground environment to above-ground acquisition systems; a wireless system is developed to economically address this need.
Research Tasks Task 1 – Soil-pipe interaction analytical/numerical analyses
There are two main causes of buried lifelines damage due to seismic events: wave propagation and permanent ground displacements; this research focuses on the latter. PGD occur primarily due to: (a) surface faulting; (b) land-sliding; (c) differential settlement; and (d) lateral spreading due to liquefaction. For localized permanent displacements, damage is typically concentrated in the neighborhood of the rupture in the soil, whereas for
spatially distributed displacements breaks (damage) may occur anywhere within the PGD zone. This task includes analyses of soil-structure interaction in the fault neighborhood.
AB
C D
E
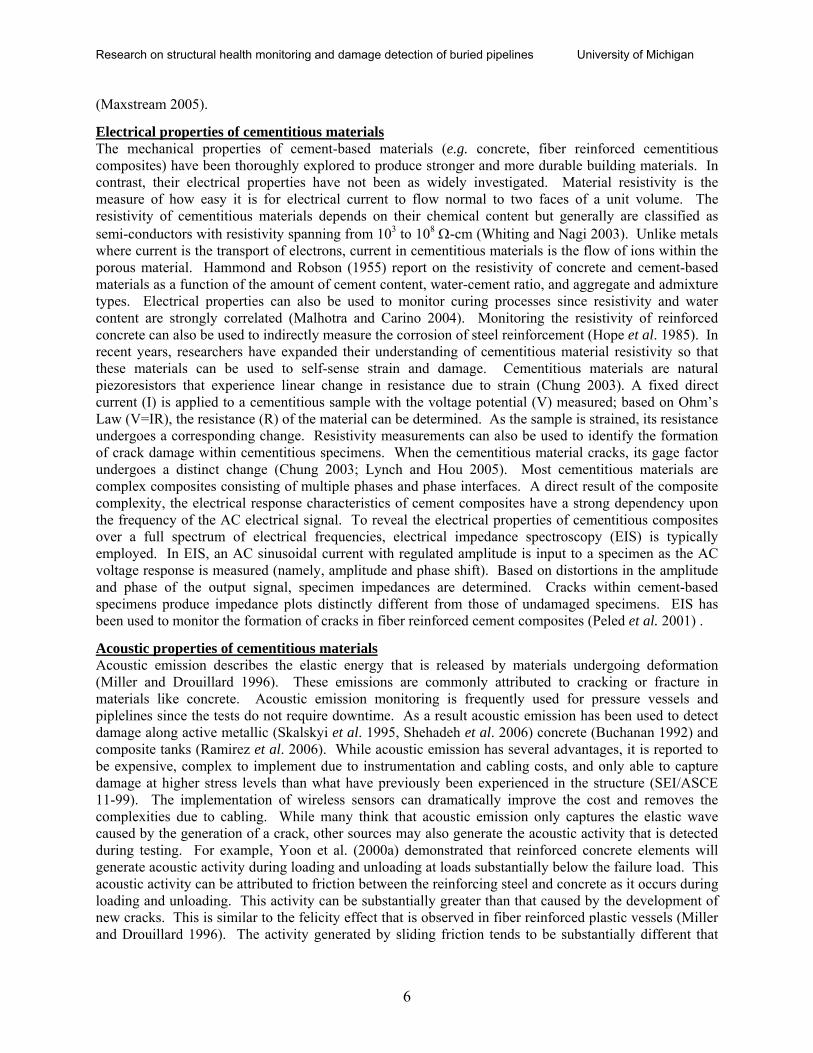
Fig. 3 Cross-sectional view of pipeline intersecting a normal fault.
Fault propagation to the ground surface is a major cause of pipe breaks (Fig. 3). During the 1971 San Fernando earthquake, fault movements caused over 1400 breaks in water and other pipelines (McCaffrey and O’Rourke 1983). Continuous pipes can fail by tensile failure, kinking (wrinkling or local buckling), beam buckling, or failure of welded slip joints. Segmented pipelines can fail by axial pull-out, crushing of bell-and-spigot joints, or circumferential flexural failure and joint rotation. This proposal addresses both continuous and segmented pipelines, subjected predominantly to ground faulting. There is relatively little research published on this subject, and this task focuses on two issues: (a) prediction of damage given the ground movement; and (b) development of analyses yielding information needed to make optimum decisions as to the placement of sensors for damage detection. In addition, simplified
7
Research on structural health monitoring and damage detection of buried pipelines University of Michigan
analyses are needed for the embedded data processing algorithms on wireless sensors, so that the data can be processed and reduced before transmission by the wireless system.
Three types of analysis will be carried out: (a) finite element (and finite difference); (b) lattice-compliance (Winkler-type) analysis of soil-structure interaction; and (c) limit and shakedown analysis. 3-D finite element analyses are expected to yield information on the distribution of stresses and strains in the pipeline system subjected to ground faulting, and damage due to yielding or brittle behavior of the pipeline material. These analyses will allow one to identify the critical components of the system and damage patterns for both continuous and segmented pipelines. The approximate lattice-compliance (Winkler-type) method will be used to obtain an approximate solution to straining pipelines during ground faulting. The level of approximation of these results will be assessed through comparisons to FEM solutions. The advantage of the simplified solution is in its modest computational demand – this is why such analyses algorithms can be embedded in sensors, so that information gathered by the sensors can be processed locally on-board. The difficulties in such analyses stem from correlation of lattice (spring) properties to the physical parameters; these correlations will be found from finite element studies where the model parameters are related directly to soil and pipe mechanical properties. Finally, limit analysis and shakedown analysis (particularly for metal pipes) will be used to find shakedown limits, and determine “survivability” of pipelines subjected to “moderate” earthquakes.
An additional issue that will be considered is arching in soils above pipelines. Arching is an elusive phenomenon, but it can be predicted if the deposition of the backfill is modeled (Michalowski and Park 2004). Taking advantage of arching is favorable for buried structures, but the effect may be lost during seismic shaking. The process of soil deposition (trench backfilling) will be modeled using the discrete element method, to indicate what type of deposition process is conducive to arching. Subsequently, seismic shaking will be applied to predict the change in the arching load distribution. This is a novel approach to arching predictions, and the results of this part of investigation is to indicate what is the most favorable earthwork process to backfill the pipelines in the ground.
The geotechnical and structural group at the University of Michigan has expertise and access to computational infrastructure at University of Michigan, including finite element analysis software (such as ABAQUS, NASTRAN, ANSYS, PATRAN, IDEAS) to tackle the soil-structure interaction of buried pipelines. In addition, the group has discrete modeling program PFC3D (ITASCA 2005) to consider soil backfilling processes and soil arching; the finite difference program FLAC is also available.
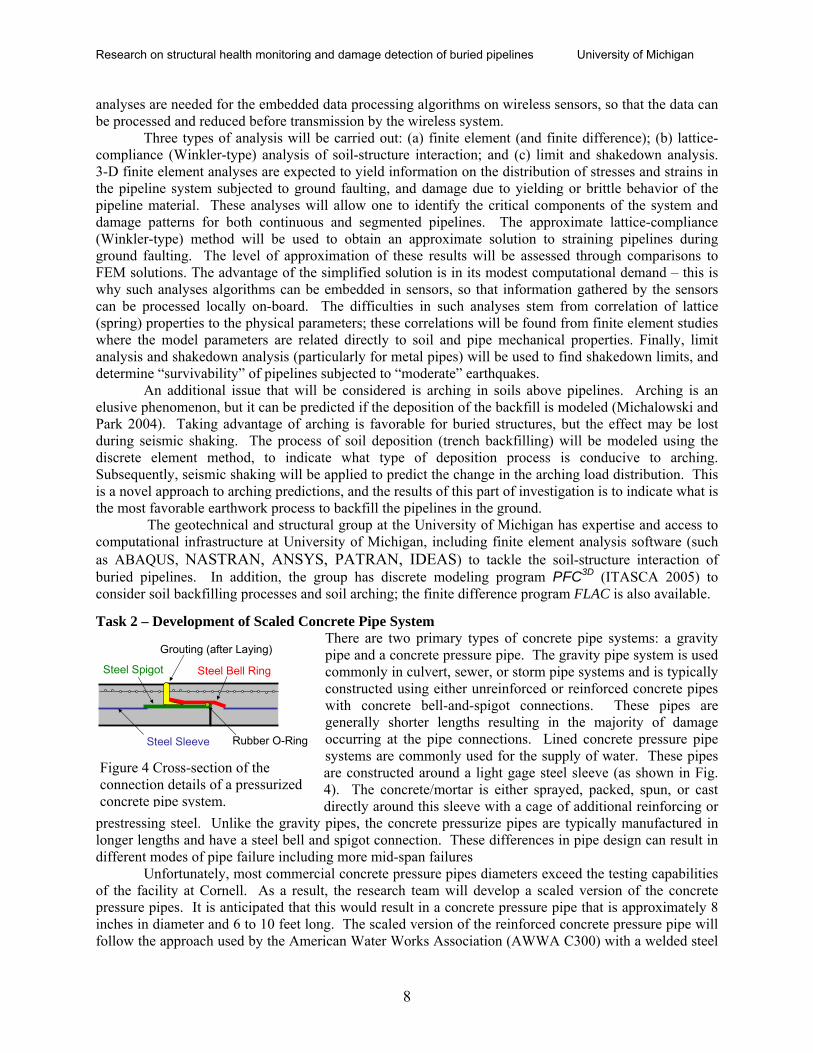
Task 2 – Development of Scaled Concrete Pipe System There are two primary types of concrete pipe systems: a gravity pipe and a concrete pressure pipe. The gravity pipe system is used commonly in culvert, sewer, or storm pipe systems and is typically constructed using either unreinforced or reinforced concrete pipes with concrete bell-and-spigot connections. These pipes are generally shorter lengths resulting in the majority of damage occurring at the pipe connections. Lined concrete pressure pipe systems are commonly used for the supply of water. These pipes are constructed around a light gage steel sleeve (as shown in Fig. 4). The concrete/mortar is either sprayed, packed, spun, or cast directly around this sleeve with a cage of additional reinforcing or
prestressing steel. Unlike the gravity pipes, the concrete pressurize pipes are typically manufactured in longer lengths and have a steel bell and spigot connection. These differences in pipe design can result in different modes of pipe failure including more mid-span failures
Grouting (after Laying)
Steel Spigot Steel Bell Ring
Unfortunately, most commercial concrete pressure pipes diameters exceed the testing capabilities of the facility at Cornell. As a result, the research team will develop a scaled version of the concrete pressure pipes. It is anticipated that this would result in a concrete pressure pipe that is approximately 8 inches in diameter and 6 to 10 feet long. The scaled version of the reinforced concrete pressure pipe will follow the approach used by the American Water Works Association (AWWA C300) with a welded steel
Steel Sleeve Rubber O-Ring
Figure 4 Cross-section of the connection details of a pressurized concrete pipe system.
8
Research on structural health monitoring and damage detection of buried pipelines University of Michigan
sleeve and rings, a reinforcing cage, a wall of concrete encasing the steel cage and sleeve, and a rubber gasket. The team anticipates altering the properties of the sleeve during the testing program to enable different failure modes to be simulated. The pipes will be cast at Purdue and shipped to Cornell. One advantage of manufacturing the concrete pipes for this study is the ability to embed or to manufacture connections for the wireless sensing systems. It is anticipated that once these concepts are proven they will be easily scaled to a production pipe operation. The composition of the concrete mixture can be optimized for electrical conductivity. In addition to examining the composition of the concrete, spin technologies will be investigated for their ability to provide a functionally graded paste or mortar layer. This may provide economic advantages in that it can provide a more conductive layer on the surface of the concrete pipe for damage detection and location. In addition to experimental measures, numerical simulation will be used to optimize sensor location and material properties.
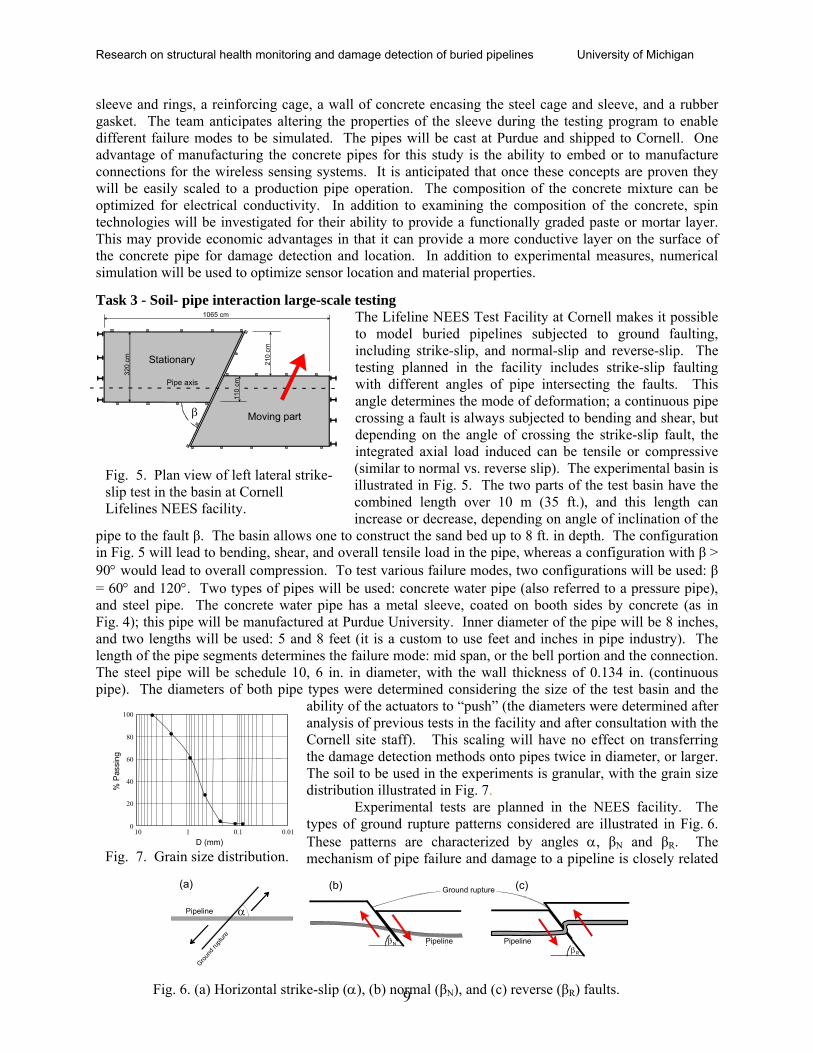
Task 3 - Soil- pipe interaction large-scale testing The Lifeline NEES Test Facility at Cornell makes it possible to model buried pipelines subjected to ground faulting, including strike-slip, and normal-slip and reverse-slip. The testing planned in the facility includes strike-slip faulting with different angles of pipe intersecting the faults. This angle determines the mode of deformation; a continuous pipe crossing a fault is always subjected to bending and shear, but depending on the angle of crossing the strike-slip fault, the integrated axial load induced can be tensile or compressive (similar to normal vs. reverse slip). The experimental basin is illustrated in Fig. 5. The two parts of the test basin have the combined length over 10 m (35 ft.), and this length can increase or decrease, depending on angle of inclination of the
pipe to the fault β. The basin allows one to construct the sand bed up to 8 ft. in depth. The configuration in Fig. 5 will lead to bending, shear, and overall tensile load in the pipe, whereas a configuration with β > 90° would lead to overall compression. To test various failure modes, two configurations will be used: β = 60° and 120°. Two types of pipes will be used: concrete water pipe (also referred to a pressure pipe), and steel pipe. The concrete water pipe has a metal sleeve, coated on booth sides by concrete (as in Fig. 4); this pipe will be manufactured at Purdue University. Inner diameter of the pipe will be 8 inches, and two lengths will be used: 5 and 8 feet (it is a custom to use feet and inches in pipe industry). The length of the pipe segments determines the failure mode: mid span, or the bell portion and the connection. The steel pipe will be schedule 10, 6 in. in diameter, with the wall thickness of 0.134 in. (continuous pipe). The diameters of both pipe types were determined considering the size of the test basin and the
ability of the actuators to “push” (the diameters were determined after analysis of previous tests in the facility and after consultation with the Cornell site staff). This scaling will have no effect on transferring the damage detection methods onto pipes twice in diameter, or larger. The soil to be used in the experiments is granular, with the grain size distribution illustrated in Fig. 7.
1065 cm
320
cm 210
cm
110
cmPipe axis
Stationary
Moving partβ
Fig. 5. Plan view of left lateral strike-slip test in the basin at Cornell Lifelines NEES facility.
10 1 0.1 0.010
20
40
60
80
100
D (mm)
% P
assi
ng
Fig. 7. Grain size distribution.
Experimental tests are planned in the NEES facility. The types of ground rupture patterns considered are illustrated in Fig. 6. These patterns are characterized by angles α, βN and βR. The mechanism of pipe failure and damage to a pipeline is closely related
Fig. 6. (a) Horizontal strike-slip (α), (b) normal (βN), and (c) reverse (βR) faults.
Pipeline
ound
ruptu
re
Gr
Ground rupture
α
(a) (b) (c)
βR
βN Pipeline Pipeline
9
Research on structural health monitoring and damage detection of buried pipelines University of Michigan
to the type of fault and angles α and β. 7 Strike-slip testing on polyethylene pipes indicated that the facility operates well in such
configuration. Testing with normal or reverse faulting with arbitrary angle βN (or βR) has not been done yet in the facility, and involves some technical difficulties, which would require substantial budgetary increase to overcome. However, we will test the pipes with faulting angle of 90°. The results of this testing will be used in the development of the damage detection methods. Besides instrumentation developed in Task 4, the pipes will be equipped with the strain gauges, both tensiometric and the sensing sheets capable of indicating the changes of the soil stress on the pipe, thus indicating location of passive and active zones in the soil. The Cornell NEES facility has recently acquired a 120-channel data acquisition system, and it will be available to the team. The cost of gauges is included in the budget. The data will be used to describe the process of progressive distress to the pipe during the test, and to validate the numerical models. Numerical models will then be used to simulate other configurations (for which the physical testing will not be carried out) to indicate how the wireless sensing strategy can be optimized. Task 4 – Development of a Self-Sufficient Wireless Sensor Package for Buried Pipelines In this proposal, a wireless sensor prototype (Lynch et al. 2006; Wang et al. 2007) previously validated in large-scale civil structures and integrated within the NEES information technology (IT) infrastructure (see Results from Prior NSF Research) will be modified for unattended operation when buried in moist soils. Specifically, the academic wireless sensor platform will serve as the fundamental building block of an in-situ pipeline health monitoring system. The challenges of the underground environment (e.g. moisture, attenuation, and inaccessibility) necessitate the wireless sensor be both mechanically robust and free from short-term power solutions (i.e. not using batteries) typically used in structures.
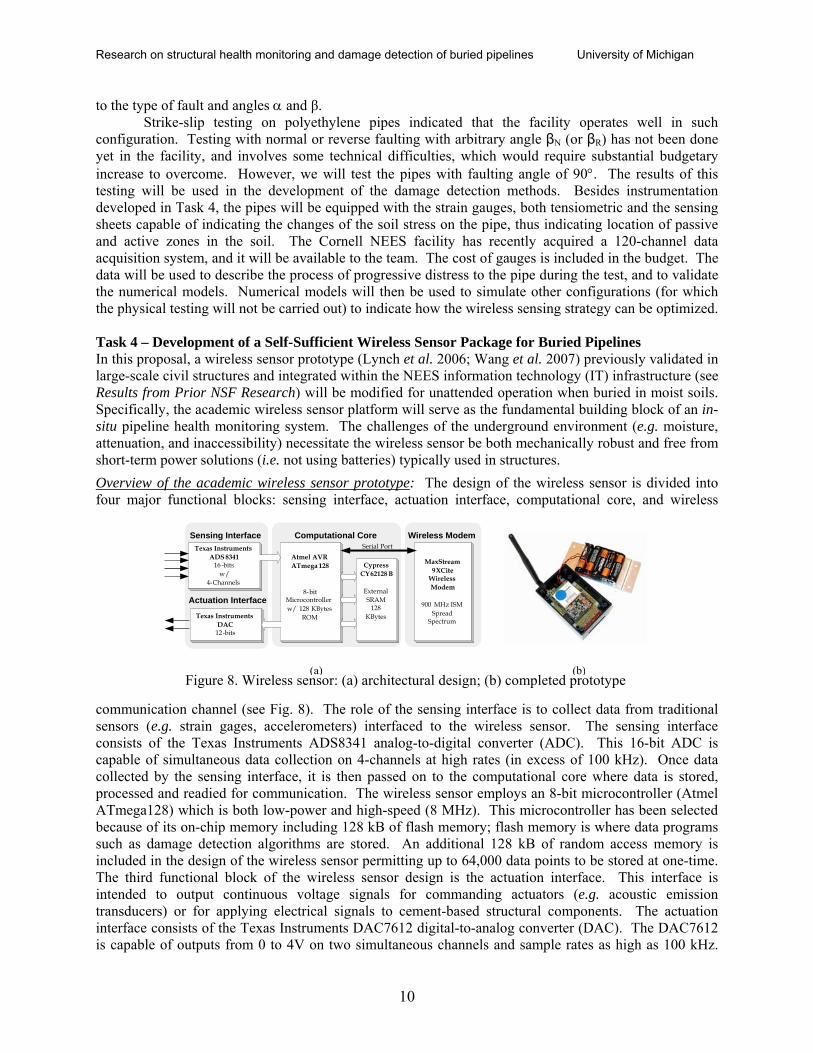
Overview of the academic wireless sensor prototype: The design of the wireless sensor is divided into four major functional blocks: sensing interface, actuation interface, computational core, and wireless
communication channel (see Fig. 8). The role of the sensing interface is to collect data from traditional sensors (e.g. strain gages, accelerometers) interfaced to the wireless sensor. The sensing interface consists of the Texas Instruments ADS8341 analog-to-digital converter (ADC). This 16-bit ADC is capable of simultaneous data collection on 4-channels at high rates (in excess of 100 kHz). Once data collected by the sensing interface, it is then passed on to the computational core where data is stored, processed and readied for communication. The wireless sensor employs an 8-bit microcontroller (Atmel ATmega128) which is both low-power and high-speed (8 MHz). This microcontroller has been selected because of its on-chip memory including 128 kB of flash memory; flash memory is where data programs such as damage detection algorithms are stored. An additional 128 kB of random access memory is included in the design of the wireless sensor permitting up to 64,000 data points to be stored at one-time. The third functional block of the wireless sensor design is the actuation interface. This interface is intended to output continuous voltage signals for commanding actuators (e.g. acoustic emission transducers) or for applying electrical signals to cement-based structural components. The actuation interface consists of the Texas Instruments DAC7612 digital-to-analog converter (DAC). The DAC7612 is capable of outputs from 0 to 4V on two simultaneous channels and sample rates as high as 100 kHz.
Computational Core Wireless ModemSensing Interface
Figure 8. Wireless sensor: (a) architectural design; (b) completed prototype
MaxStream 9XCite
Wireless Modem
900 MHz ISM Spread
Spectrum
Texas InstrumentsADS 8341
16 -bits w/
4-Channels
Atmel AVRATmega 128
8-bit Microcontrollerw/ 128 KBytes
ROM
Cypress CY62128 B
External SRAM
128 KBytes
Serial Port
Texas InstrumentsDAC
12-bits
Actuation Interface
(a) (b)
10
Research on structural health monitoring and damage detection of buried pipelines University of Michigan
The last functional component of the wireless sensor is the wireless modem. The Maxstream 9XCite modem is selected for this project because it can attain high communication ranges in open-space air (1000 feet). In the underground environment where the propagation channel’s dielectric constant is higher, preliminary calculations suggest this 900 MHz radio will be capable of at least 25 feet of communication range.
Completely packaged prototype: The current wireless sensor prototype is packaged in a compact hardened container roughly 5x4x8 cm in dimensions. The container, as shown in Fig. 8b, protects the internal electronics and power source (i.e. batteries) of the wireless sensor from the elements commonly encountered when deployed in bridge and building structures. For deployment in an underground environment, a water-proof container which ensures no water reaches the wireless sensor will be adopted. Standard water-proof instrumentation packages are readily available from standard electronic vendors. The fully assembled wireless sensor costs roughly $100 per unit. The unit is currently powered using 5 AA rechargeable batteries that can operate for 30+ continuous hours before recharging is required.
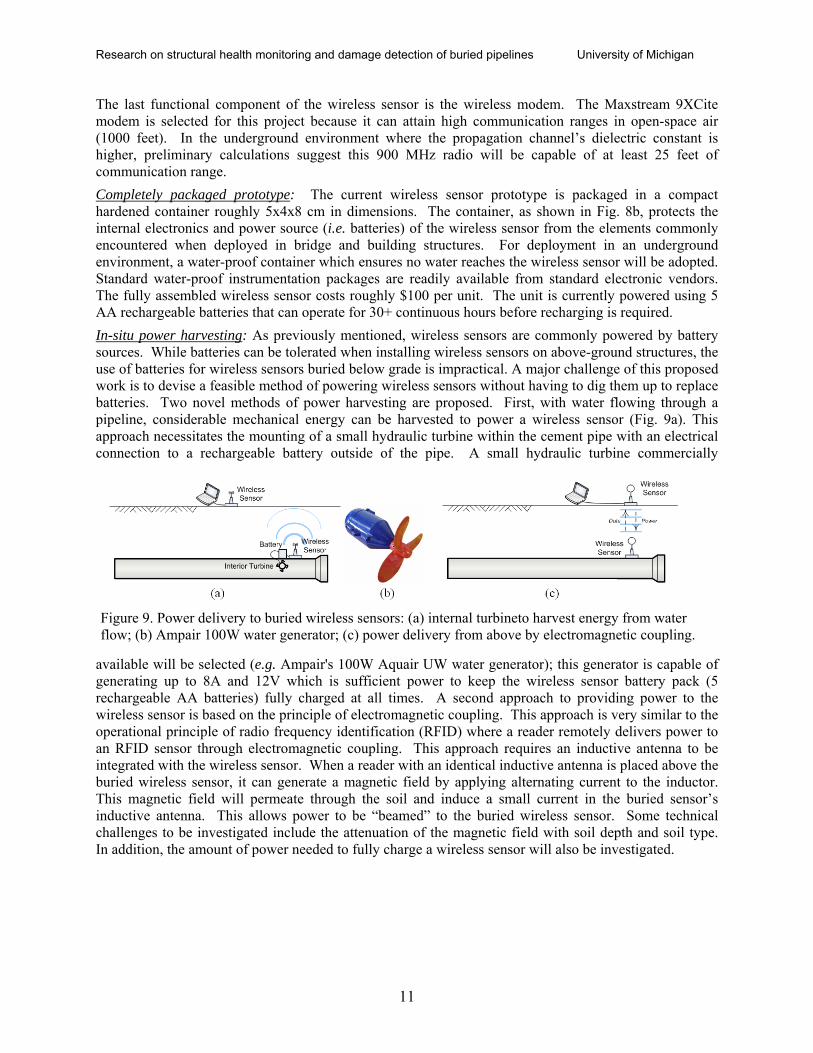
In-situ power harvesting: As previously mentioned, wireless sensors are commonly powered by battery sources. While batteries can be tolerated when installing wireless sensors on above-ground structures, the use of batteries for wireless sensors buried below grade is impractical. A major challenge of this proposed work is to devise a feasible method of powering wireless sensors without having to dig them up to replace batteries. Two novel methods of power harvesting are proposed. First, with water flowing through a pipeline, considerable mechanical energy can be harvested to power a wireless sensor (Fig. 9a). This approach necessitates the mounting of a small hydraulic turbine within the cement pipe with an electrical connection to a rechargeable battery outside of the pipe. A small hydraulic turbine commercially
available will be selected (e.g. Ampair's 100W Aquair UW water generator); this generator is capable of generating up to 8A and 12V which is sufficient power to keep the wireless sensor battery pack (5 rechargeable AA batteries) fully charged at all times. A second approach to providing power to the wireless sensor is based on the principle of electromagnetic coupling. This approach is very similar to the operational principle of radio frequency identification (RFID) where a reader remotely delivers power to an RFID sensor through electromagnetic coupling. This approach requires an inductive antenna to be integrated with the wireless sensor. When a reader with an identical inductive antenna is placed above the buried wireless sensor, it can generate a magnetic field by applying alternating current to the inductor. This magnetic field will permeate through the soil and induce a small current in the buried sensor’s inductive antenna. This allows power to be “beamed” to the buried wireless sensor. Some technical challenges to be investigated include the attenuation of the magnetic field with soil depth and soil type. In addition, the amount of power needed to fully charge a wireless sensor will also be investigated.
Figure 9. Power delivery to buried wireless sensors: (a) internal turbineto harvest energy from water flow; (b) Ampair 100W water generator; (c) power delivery from above by electromagnetic coupling.
11
Research on structural health monitoring and damage detection of buried pipelines University of Michigan
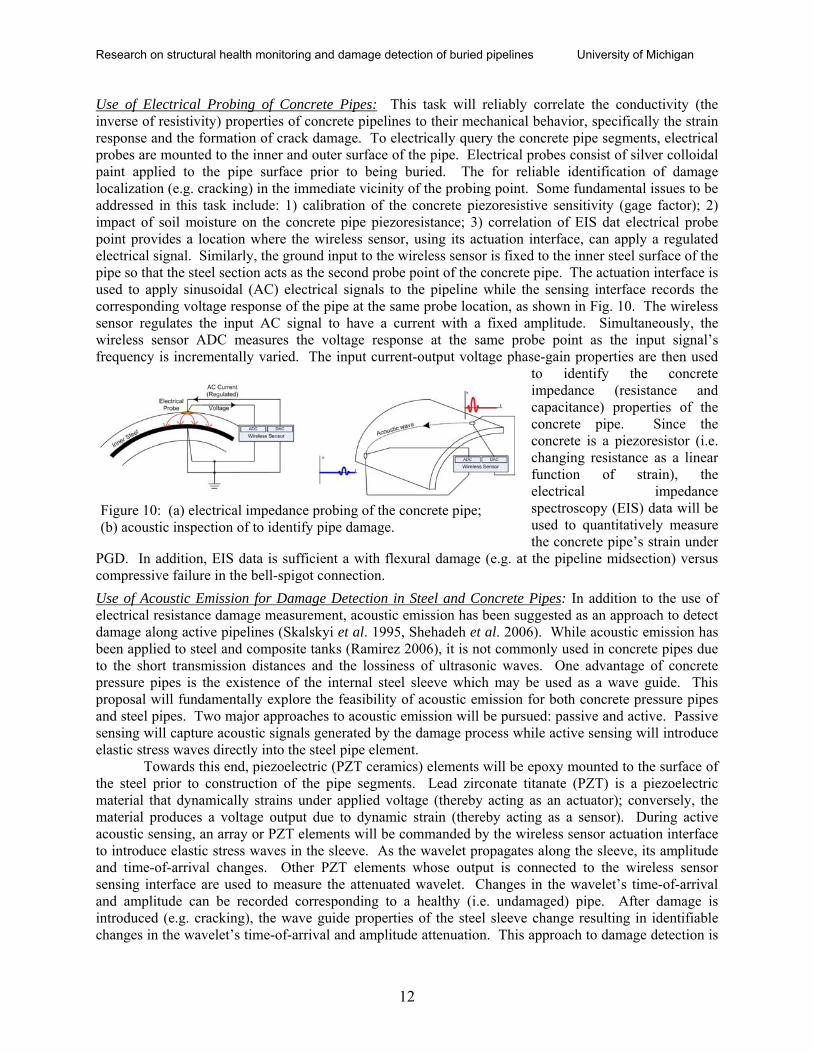
Figure 10: (a) electrical impedance probing of the concrete pipe; (b) acoustic inspection of to identify pipe damage.
Use of Electrical Probing of Concrete Pipes: This task will reliably correlate the conductivity (the inverse of resistivity) properties of concrete pipelines to their mechanical behavior, specifically the strain response and the formation of crack damage. To electrically query the concrete pipe segments, electrical probes are mounted to the inner and outer surface of the pipe. Electrical probes consist of silver colloidal paint applied to the pipe surface prior to being buried. The for reliable identification of damage localization (e.g. cracking) in the immediate vicinity of the probing point. Some fundamental issues to be addressed in this task include: 1) calibration of the concrete piezoresistive sensitivity (gage factor); 2) impact of soil moisture on the concrete pipe piezoresistance; 3) correlation of EIS dat electrical probe point provides a location where the wireless sensor, using its actuation interface, can apply a regulated electrical signal. Similarly, the ground input to the wireless sensor is fixed to the inner steel surface of the pipe so that the steel section acts as the second probe point of the concrete pipe. The actuation interface is used to apply sinusoidal (AC) electrical signals to the pipeline while the sensing interface records the corresponding voltage response of the pipe at the same probe location, as shown in Fig. 10. The wireless sensor regulates the input AC signal to have a current with a fixed amplitude. Simultaneously, the wireless sensor ADC measures the voltage response at the same probe point as the input signal’s frequency is incrementally varied. The input current-output voltage phase-gain properties are then used
to identify the concrete impedance (resistance and capacitance) properties of the concrete pipe. Since the concrete is a piezoresistor (i.e. changing resistance as a linear function of strain), the electrical impedance spectroscopy (EIS) data will be used to quantitatively measure the concrete pipe’s strain under
PGD. In addition, EIS data is sufficient a with flexural damage (e.g. at the pipeline midsection) versus compressive failure in the bell-spigot connection.
Use of Acoustic Emission for Damage Detection in Steel and Concrete Pipes: In addition to the use of electrical resistance damage measurement, acoustic emission has been suggested as an approach to detect damage along active pipelines (Skalskyi et al. 1995, Shehadeh et al. 2006). While acoustic emission has been applied to steel and composite tanks (Ramirez 2006), it is not commonly used in concrete pipes due to the short transmission distances and the lossiness of ultrasonic waves. One advantage of concrete pressure pipes is the existence of the internal steel sleeve which may be used as a wave guide. This proposal will fundamentally explore the feasibility of acoustic emission for both concrete pressure pipes and steel pipes. Two major approaches to acoustic emission will be pursued: passive and active. Passive sensing will capture acoustic signals generated by the damage process while active sensing will introduce elastic stress waves directly into the steel pipe element.
Towards this end, piezoelectric (PZT ceramics) elements will be epoxy mounted to the surface of the steel prior to construction of the pipe segments. Lead zirconate titanate (PZT) is a piezoelectric material that dynamically strains under applied voltage (thereby acting as an actuator); conversely, the material produces a voltage output due to dynamic strain (thereby acting as a sensor). During active acoustic sensing, an array or PZT elements will be commanded by the wireless sensor actuation interface to introduce elastic stress waves in the sleeve. As the wavelet propagates along the sleeve, its amplitude and time-of-arrival changes. Other PZT elements whose output is connected to the wireless sensor sensing interface are used to measure the attenuated wavelet. Changes in the wavelet’s time-of-arrival and amplitude can be recorded corresponding to a healthy (i.e. undamaged) pipe. After damage is introduced (e.g. cracking), the wave guide properties of the steel sleeve change resulting in identifiable changes in the wavelet’s time-of-arrival and amplitude attenuation. This approach to damage detection is
12
Research on structural health monitoring and damage detection of buried pipelines University of Michigan
often termed the pitch-catch method and is shown in Fig. 10. The same approach to detecting damage in steel-only pipes will also be pursued, namely the pitch-catch method using PZT elements. Fundamental acoustic emission tests will be performed on segments of the pipe to determine the influence of the bell and spigot connection on losses along the wave-guide.
During passive acoustic sensing, segments of the pipe will undergo various modes of damage (including decoupling, sliding, and flexural failure of the pipe) with the damage event generating acoustic signatures. Full acoustic waveforms will be captured and analyzed by the wireless sensors using the PZT elements attached to the steel pipe surface. The detected waves will be analyzed to assess aspects of the waveforms that will enable failure modes to be differentiated. Specifically the characteristic amplitude to duration ratios, frequencies, and energy contents will be analyzed. Linear triangulation can also be used to detect the position of damage along the length of the pipe system. These predictions of damage location will be compared with the physical measurements on pipes tested at Cornell.
13