Embed Size (px)
Citation preview

Instructions for use
Title Negative Magnus lift on a rotating sphere at around the critical Reynolds number
Author(s) Muto, Masaya; Tsubokura, Makoto; Oshima, Nobuyuki
Citation Physics of Fluids, 24(1): 014102
Issue Date 2012-01
Doc URL http://hdl.handle.net/2115/49222
RightsCopyright 2012 American Institute of Physics. This article may be downloaded for personal use only. Any other userequires prior permission of the author and the American Institute of Physics. The following article appeared in Phys.Fluids 24, 014102 (2012) and may be found at http://link.aip.org/link/?phf/24/014102
Type article
File Information PoF24-1_014102.pdf
Hokkaido University Collection of Scholarly and Academic Papers : HUSCAP

Negative Magnus lift on a rotating sphere at around the critical ReynoldsnumberMasaya Muto, Makoto Tsubokura, and Nobuyuki Oshima Citation: Phys. Fluids 24, 014102 (2012); doi: 10.1063/1.3673571 View online: http://dx.doi.org/10.1063/1.3673571 View Table of Contents: http://pof.aip.org/resource/1/PHFLE6/v24/i1 Published by the American Institute of Physics. Related ArticlesMaximum entropy states of quasi-geostrophic point vortices Phys. Fluids 24, 056601 (2012) Effect of swirl decay on vortex breakdown in a confined steady axisymmetric flow Phys. Fluids 24, 043601 (2012) Simulations of turbulent rotating flows using a subfilter scale stress model derived from the partially integratedtransport modeling method Phys. Fluids 24, 045108 (2012) Free magnetohydrodynamic shear layers in the presence of rotation and magnetic field Phys. Plasmas 19, 056502 (2012) Statistics and scaling properties of temperature field in symmetrical non-Oberbeck-Boussinesq turbulentconvection Phys. Fluids 24, 045102 (2012) Additional information on Phys. FluidsJournal Homepage: http://pof.aip.org/ Journal Information: http://pof.aip.org/about/about_the_journal Top downloads: http://pof.aip.org/features/most_downloaded Information for Authors: http://pof.aip.org/authors
Downloaded 21 May 2012 to 133.87.26.18. Redistribution subject to AIP license or copyright; see http://pof.aip.org/about/rights_and_permissions
Negative Magnus lift on a rotating sphere at aroundthe critical Reynolds number
Masaya Muto, Makoto Tsubokura,a) and Nobuyuki OshimaDivision of Mechanical and Space Engineering, Faculty of Engineering, HokkaidoUniversity, Kita13, Nishi8, Kita-ku, Sapporo, Hokkaido 060-8628, Japan
(Received 22 February 2011; accepted 17 November 2011; published online 5 January 2012)
Negative Magnus lift acting on a sphere rotating about the axis perpendicular to an
incoming flow was investigated using large-eddy simulation at three Reynolds
numbers of 1.0� 104, 2.0� 105, and 1.14� 106. The numerical methods used were
first validated on a non-rotating sphere, and the spatial resolution around the sphere
was determined so as to reproduce the laminar separation, reattachment, and
turbulent transition of the boundary layer observed in the vicinity of the critical
Reynolds number. The rotating sphere exhibited a positive or negative Magnus
effect depending on the Reynolds number and the imposed rotating speed. At
Reynolds numbers in the subcritical or supercritical regimes, the direction of the
Magnus lift force was independent of the rotational speed. In contrast, the lift force
was negative in the critical regime when particular rotating speeds were imposed.
This negative Magnus effect was investigated in the context of suppression or
promotion of boundary layer transition around the separation point. VC 2012American Institute of Physics. [doi:10.1063/1.3673571]
I. INTRODUCTION
The Magnus effect is a phenomenon in which a clockwise-rotating sphere or cylinder sub-
jected to a left-to-right flow experiences a lift force.1 While the mechanism is usually explained in
terms of the inviscid flow, the same phenomenon is also used to explain the curious and unpredict-
able motions of spinning balls used in such sports as baseball, volleyball, and football. The phe-
nomenon is complicated by the viscous effects of the flow as the boundary layer on the ball
surface separates due to an adverse pressure gradient. Generally, the difference in the relative ve-
locity of the sphere surface with respect to the incoming uniform flow makes the boundary layer
on the downstream-moving side (upper side in this context) thinner than that on the upstream-
moving side. Thus, the boundary-layer separation is delayed on the downstream-moving side
while it is accelerated on the upstream-moving side. As a result, the wake flow is distorted down-
ward, and a positive lift force acts on the sphere that is based on the principle of action and reac-
tion. In addition, the laminar-turbulent transition of the boundary layer complicates the
phenomenon even more as it causes the separation point to shift considerably downstream along
the surface. Thus, the drag of a non-rotating sphere substantially decreases around the critical
Reynolds number.
Experimental studies have found that a negative lift force appears on a rotating sphere as a
result of the interaction of these separation and transition phases, which contradicts the Magnus
effect, at specific rotational speeds around the critical Reynolds number.2–4 The diagram Taneda2
prepared for the negative lift force he observed shows that it appears only in the neighborhood of
a Reynolds number of 2.5� 105 and at a non-dimensional rotational speed (ratio of circumferen-
tial velocity to incoming flow velocity) of less than 0.6.
The difficulty encountered in measuring a minute positive or negative lift force on a rotating
sphere experimentally without the effect of supporting rods or wires results in a quantitative dis-
agreement among experimental data on the lift force magnitude, the Reynolds number range, and
a)Author to whom correspondence should be addressed. Electronic mail: [email protected]. Tel.: þ81-11-706-
6723. FAX: þ81-11-706-6725.
1070-6631/2012/24(1)/014102/15/$30.00 VC 2012 American Institute of Physics24, 014102-1
PHYSICS OF FLUIDS 24, 014102 (2012)
Downloaded 21 May 2012 to 133.87.26.18. Redistribution subject to AIP license or copyright; see http://pof.aip.org/about/rights_and_permissions
the rotational speed where the negative Magnus effect is observed. Hence, little knowledge has so
far been obtained concerning the mechanism of the negative Magnus effect.
Our objectives in the study reported here were to verify using numerical simulation the exis-
tence of the negative Magnus effect of a rotating sphere observed in previous experimental studies
and to investigate the physical mechanism leading to the generation of negative lift.
II. NUMERICAL DETAILS
The non-dimensional rotational speed, conventionally called the spin parameter, is defined as
the ratio of the circumferential velocity to the incoming flow velocity, C¼Dpx=U0, where Dp is
the sphere diameter, x is the rotating angular velocity, and U0 is the incoming flow velocity. In pre-
vious experimental studies,2–4 the negative Magnus effect was observed at a C of less than 0.6.
Thus, two non-dimensional velocities (C¼ 0.2 and 1) were considered in this study. Since the range
of Reynolds numbers at which negative lift has been observed is relatively large (Taneda2: 6� 104
to 5� 105; Maccoll3: 4.6� 104 to 1.1� 105; Davies4: 9� 104), we used Reynolds numbers in the
subcritical, critical, and supercritical flow regimes5 (1.0� 104, 2.0� 105, and 1.14� 106, respec-
tively). Reynolds number Rep is defined here as U0Dp=�, where � is the kinetic viscosity.
To investigate a high-Reynolds-number turbulent flow including transition, we used large-
eddy simulation (LES) with a dynamic subgrid-scale model.6,7 The validity of this numerical
method has been demonstrated by studies8,9 on the sensitivity of subgrid-scale models for the de-
velopment of vortices in the shear layer around a sphere. Numerical treatment of the target flow is
difficult because the grid resolution in the vicinity of the surface should be fine enough for the nor-
mal surface direction to capture the boundary-layer distortion during the separation phenomena.
In addition, the grid allocation should be homogeneous in the flow direction to properly capture
the transition to turbulence. We thus avoided using spherical and cylindrical coordinate10,11 sys-
tems and instead used an unstructured finite volume grid.12 For this reason, assuming an incom-
pressible Newtonian flow, we discretized the continuity and Navier-Stokes equations by using the
vertex-centered finite volume method.
Second-order central differences approximations were used to discretize the spatial deriva-
tive, while 5% of the first-order upwind scheme was blended with the central differences to esti-
mate the convective flux on the cell surface. The effect of the upwind blend on the convective
term was essential to preventing numerical oscillation from appearing on the unstructured grid. It
should be noted that a higher-order upwind scheme is not well suited for an unstructured numeri-
cal grid because the grid is not necessarily aligned along the direction normal to the cell surface.
The diffusive fluxes were treated on the basis of the deferred correction formula suggested by
Muzaferija13 to avoid checkerboard-type oscillation. The time marching was based on the frac-
tional step method by Kim and Moin14 in which the first-order Euler implicit scheme is used for
velocity prediction. The coupling of the velocity and pressure fields was based on the simplified
marker and cell (SMAC) method by Amsden and Harlow.15 The flow rate on the control-volume
surface was estimated using the method proposed by Rhie and Chow.16 In the simulation, the Cou-
rant number for the time marching was restricted to less than 1.8. Under these conditions, we con-
firmed that that there is little difference in the aerodynamic forces between the first-order Euler
and third-order Adams-Moulton schemes.
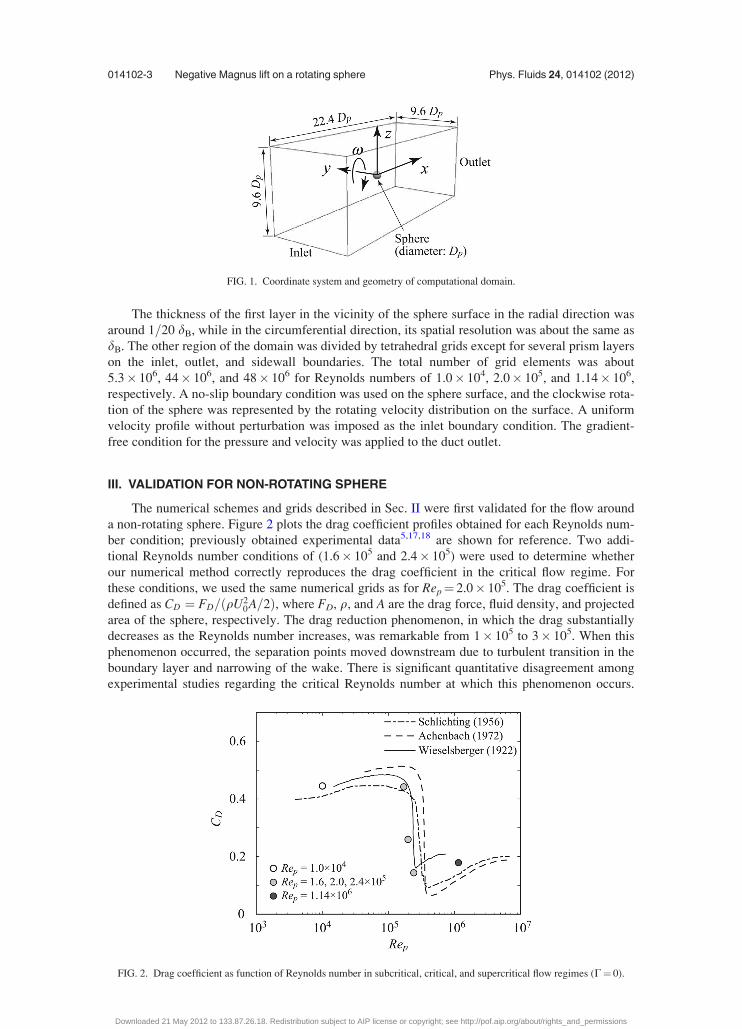
The computational domain was a rectangular duct with a sphere fixed at the center, as shown
in Fig. 1. The blockage ratio between the projection area of the sphere and the cross-section of the
domain was less than 0.85%. Thirty prism-mesh layers were placed on the sphere surface for use
in resolving the velocity profile of the boundary layer. The spatial resolution around the sphere
was set so as to reproduce the drag reduction at the critical Reynolds number, as discussed in Sec.
III. On the basis of several resolution tests, the size of the grid elements was determined using the
laminar boundary-layer thickness dB on the sphere, which was estimated using the equation pro-
posed by Schlichting17
dB ¼ 3�
ffiffiffiffiffiffiffiffiffiffiffiffiffiffiffiffiffiffiDp=2� �
�
U0
s: (1)
014102-2 Muto, Tsubokura, and Oshima Phys. Fluids 24, 014102 (2012)
Downloaded 21 May 2012 to 133.87.26.18. Redistribution subject to AIP license or copyright; see http://pof.aip.org/about/rights_and_permissions
The thickness of the first layer in the vicinity of the sphere surface in the radial direction was
around 1=20 dB, while in the circumferential direction, its spatial resolution was about the same as
dB. The other region of the domain was divided by tetrahedral grids except for several prism layers
on the inlet, outlet, and sidewall boundaries. The total number of grid elements was about
5.3� 106, 44� 106, and 48� 106 for Reynolds numbers of 1.0� 104, 2.0� 105, and 1.14� 106,
respectively. A no-slip boundary condition was used on the sphere surface, and the clockwise rota-
tion of the sphere was represented by the rotating velocity distribution on the surface. A uniform
velocity profile without perturbation was imposed as the inlet boundary condition. The gradient-
free condition for the pressure and velocity was applied to the duct outlet.
III. VALIDATION FOR NON-ROTATING SPHERE
The numerical schemes and grids described in Sec. II were first validated for the flow around
a non-rotating sphere. Figure 2 plots the drag coefficient profiles obtained for each Reynolds num-
ber condition; previously obtained experimental data5,17,18 are shown for reference. Two addi-
tional Reynolds number conditions of (1.6� 105 and 2.4� 105) were used to determine whether
our numerical method correctly reproduces the drag coefficient in the critical flow regime. For
these conditions, we used the same numerical grids as for Rep¼ 2.0� 105. The drag coefficient is
defined as CD ¼ FD=ðqU20A=2Þ, where FD, q, and A are the drag force, fluid density, and projected
area of the sphere, respectively. The drag reduction phenomenon, in which the drag substantially
decreases as the Reynolds number increases, was remarkable from 1� 105 to 3� 105. When this
phenomenon occurred, the separation points moved downstream due to turbulent transition in the
boundary layer and narrowing of the wake. There is significant quantitative disagreement among
experimental studies regarding the critical Reynolds number at which this phenomenon occurs.
FIG. 1. Coordinate system and geometry of computational domain.
FIG. 2. Drag coefficient as function of Reynolds number in subcritical, critical, and supercritical flow regimes (C¼ 0).
014102-3 Negative Magnus lift on a rotating sphere Phys. Fluids 24, 014102 (2012)
Downloaded 21 May 2012 to 133.87.26.18. Redistribution subject to AIP license or copyright; see http://pof.aip.org/about/rights_and_permissions
The critical Reynolds number observed by Achenbach5 (3.7� 105) is about twice that observed by
Wieselsberger.18 The effects of free stream turbulence intensity, sphere surface roughness, and
supporting system rigidity have been suggested as possible reasons for this disagreement.5,19 Our
numerical results qualitatively reproduce the drag phenomenon and are in good agreement with
those of Wieselsberger. Since there was no turbulence intensity in the free stream in our numerical
simulation, our results did not clarify the effects of turbulence intensity on the critical Reynolds
number and on the turbulent transition in the separated and reattached surface boundary layer.
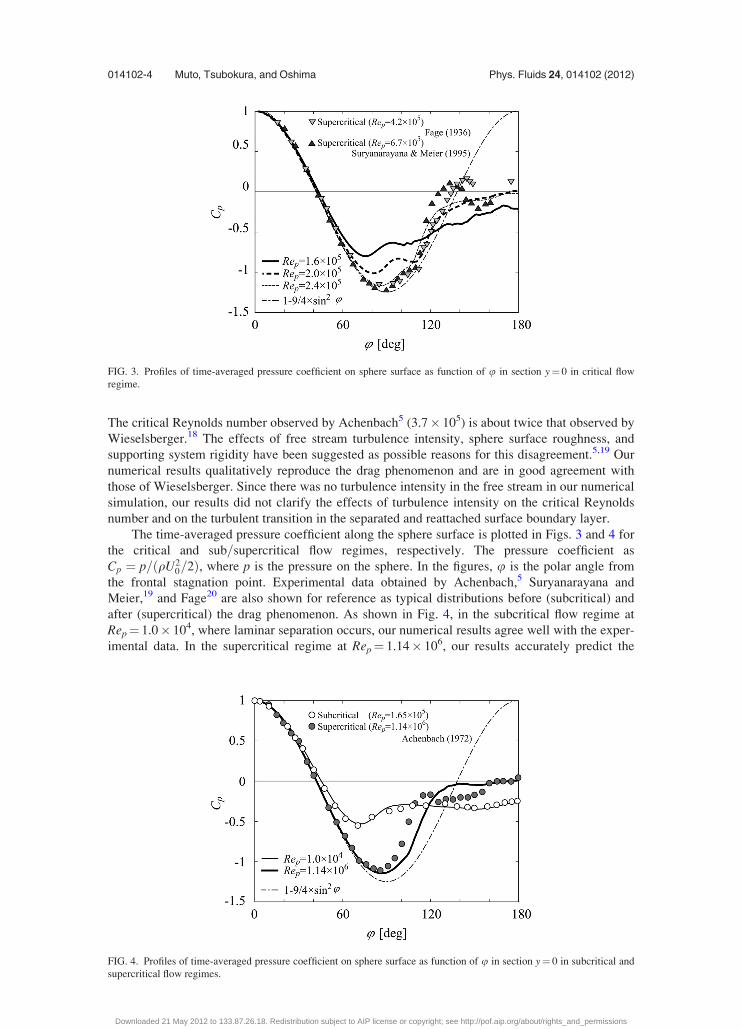
The time-averaged pressure coefficient along the sphere surface is plotted in Figs. 3 and 4 for
the critical and sub=supercritical flow regimes, respectively. The pressure coefficient as
Cp ¼ p=ðqU20=2Þ, where p is the pressure on the sphere. In the figures, u is the polar angle from
the frontal stagnation point. Experimental data obtained by Achenbach,5 Suryanarayana and
Meier,19 and Fage20 are also shown for reference as typical distributions before (subcritical) and
after (supercritical) the drag phenomenon. As shown in Fig. 4, in the subcritical flow regime at
Rep¼ 1.0� 104, where laminar separation occurs, our numerical results agree well with the exper-
imental data. In the supercritical regime at Rep¼ 1.14� 106, our results accurately predict the
FIG. 3. Profiles of time-averaged pressure coefficient on sphere surface as function of u in section y¼ 0 in critical flow
regime.
FIG. 4. Profiles of time-averaged pressure coefficient on sphere surface as function of u in section y¼ 0 in subcritical and
supercritical flow regimes.
014102-4 Muto, Tsubokura, and Oshima Phys. Fluids 24, 014102 (2012)
Downloaded 21 May 2012 to 133.87.26.18. Redistribution subject to AIP license or copyright; see http://pof.aip.org/about/rights_and_permissions
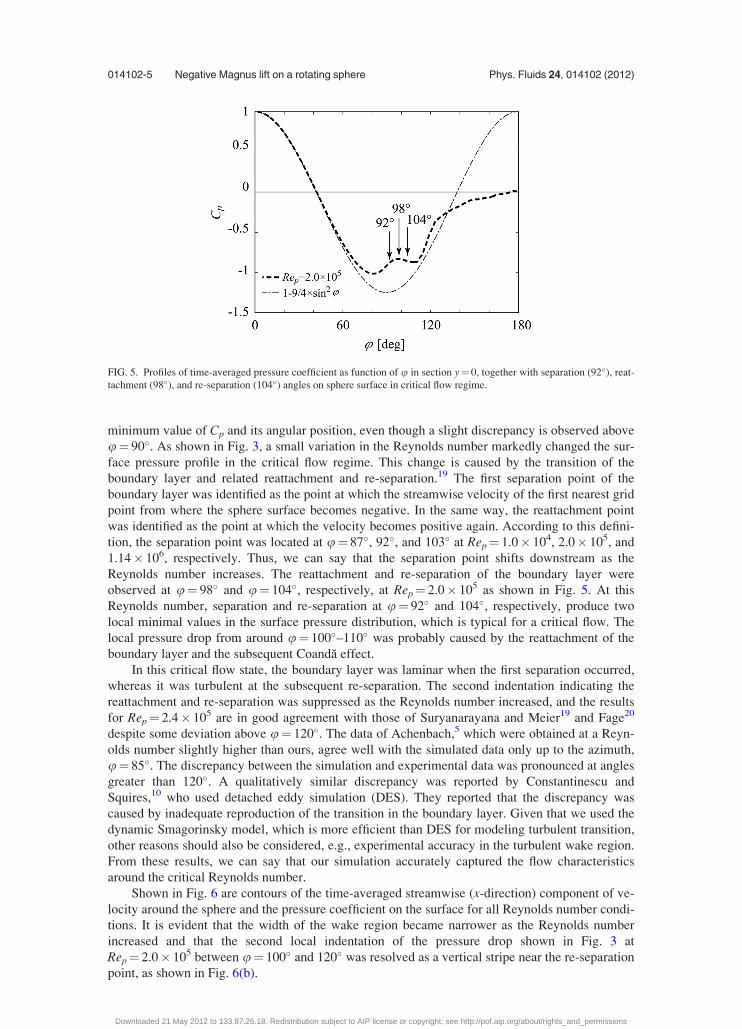
minimum value of Cp and its angular position, even though a slight discrepancy is observed above
u¼ 90�. As shown in Fig. 3, a small variation in the Reynolds number markedly changed the sur-
face pressure profile in the critical flow regime. This change is caused by the transition of the
boundary layer and related reattachment and re-separation.19 The first separation point of the
boundary layer was identified as the point at which the streamwise velocity of the first nearest grid
point from where the sphere surface becomes negative. In the same way, the reattachment point
was identified as the point at which the velocity becomes positive again. According to this defini-
tion, the separation point was located at u¼ 87�, 92�, and 103� at Rep¼ 1.0� 104, 2.0� 105, and
1.14� 106, respectively. Thus, we can say that the separation point shifts downstream as the
Reynolds number increases. The reattachment and re-separation of the boundary layer were
observed at u¼ 98� and u¼ 104�, respectively, at Rep¼ 2.0� 105 as shown in Fig. 5. At this
Reynolds number, separation and re-separation at u¼ 92� and 104�, respectively, produce two
local minimal values in the surface pressure distribution, which is typical for a critical flow. The
local pressure drop from around u¼ 100�–110� was probably caused by the reattachment of the
boundary layer and the subsequent Coanda effect.
In this critical flow state, the boundary layer was laminar when the first separation occurred,
whereas it was turbulent at the subsequent re-separation. The second indentation indicating the
reattachment and re-separation was suppressed as the Reynolds number increased, and the results
for Rep¼ 2.4� 105 are in good agreement with those of Suryanarayana and Meier19 and Fage20
despite some deviation above u¼ 120�. The data of Achenbach,5 which were obtained at a Reyn-
olds number slightly higher than ours, agree well with the simulated data only up to the azimuth,
u¼ 85�. The discrepancy between the simulation and experimental data was pronounced at angles
greater than 120�. A qualitatively similar discrepancy was reported by Constantinescu and
Squires,10 who used detached eddy simulation (DES). They reported that the discrepancy was
caused by inadequate reproduction of the transition in the boundary layer. Given that we used the
dynamic Smagorinsky model, which is more efficient than DES for modeling turbulent transition,
other reasons should also be considered, e.g., experimental accuracy in the turbulent wake region.
From these results, we can say that our simulation accurately captured the flow characteristics
around the critical Reynolds number.
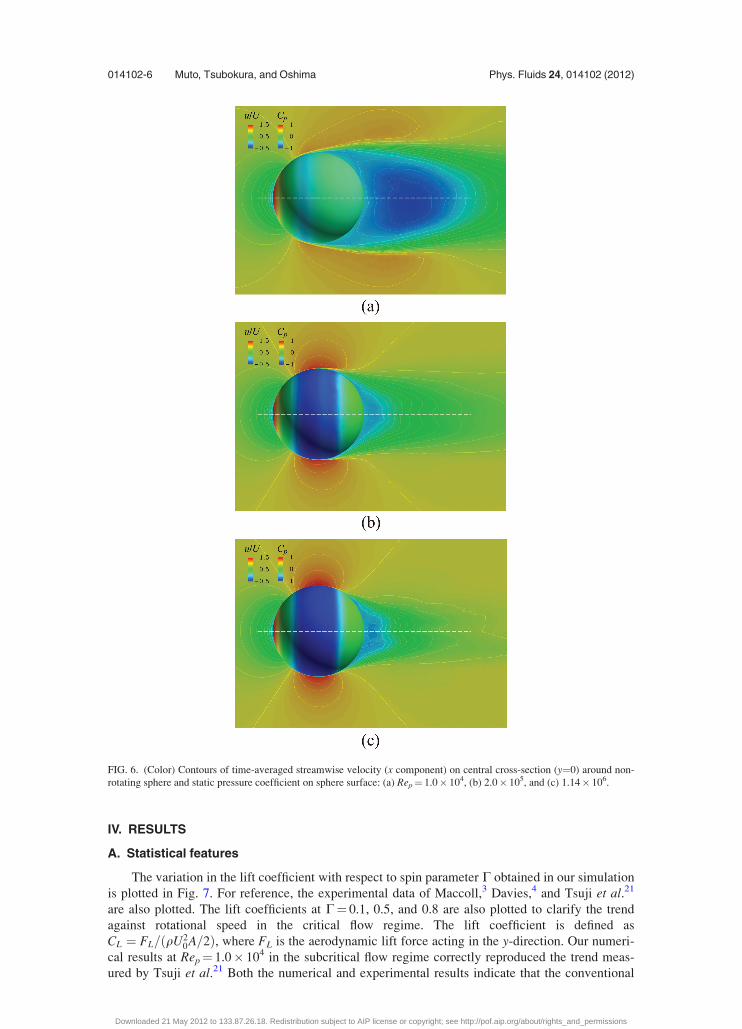
Shown in Fig. 6 are contours of the time-averaged streamwise (x-direction) component of ve-
locity around the sphere and the pressure coefficient on the surface for all Reynolds number condi-
tions. It is evident that the width of the wake region became narrower as the Reynolds number
increased and that the second local indentation of the pressure drop shown in Fig. 3 at
Rep¼ 2.0� 105 between u¼ 100� and 120� was resolved as a vertical stripe near the re-separation
point, as shown in Fig. 6(b).
FIG. 5. Profiles of time-averaged pressure coefficient as function of u in section y¼ 0, together with separation (92�), reat-
tachment (98�), and re-separation (104�) angles on sphere surface in critical flow regime.
014102-5 Negative Magnus lift on a rotating sphere Phys. Fluids 24, 014102 (2012)
Downloaded 21 May 2012 to 133.87.26.18. Redistribution subject to AIP license or copyright; see http://pof.aip.org/about/rights_and_permissions
IV. RESULTS
A. Statistical features
The variation in the lift coefficient with respect to spin parameter C obtained in our simulation
is plotted in Fig. 7. For reference, the experimental data of Maccoll,3 Davies,4 and Tsuji et al.21
are also plotted. The lift coefficients at C¼ 0.1, 0.5, and 0.8 are also plotted to clarify the trend
against rotational speed in the critical flow regime. The lift coefficient is defined as
CL ¼ FL=ðqU20A=2Þ, where FL is the aerodynamic lift force acting in the y-direction. Our numeri-
cal results at Rep¼ 1.0� 104 in the subcritical flow regime correctly reproduced the trend meas-
ured by Tsuji et al.21 Both the numerical and experimental results indicate that the conventional
FIG. 6. (Color) Contours of time-averaged streamwise velocity (x component) on central cross-section (y¼0) around non-
rotating sphere and static pressure coefficient on sphere surface: (a) Rep¼ 1.0� 104, (b) 2.0� 105, and (c) 1.14� 106.
014102-6 Muto, Tsubokura, and Oshima Phys. Fluids 24, 014102 (2012)
Downloaded 21 May 2012 to 133.87.26.18. Redistribution subject to AIP license or copyright; see http://pof.aip.org/about/rights_and_permissions
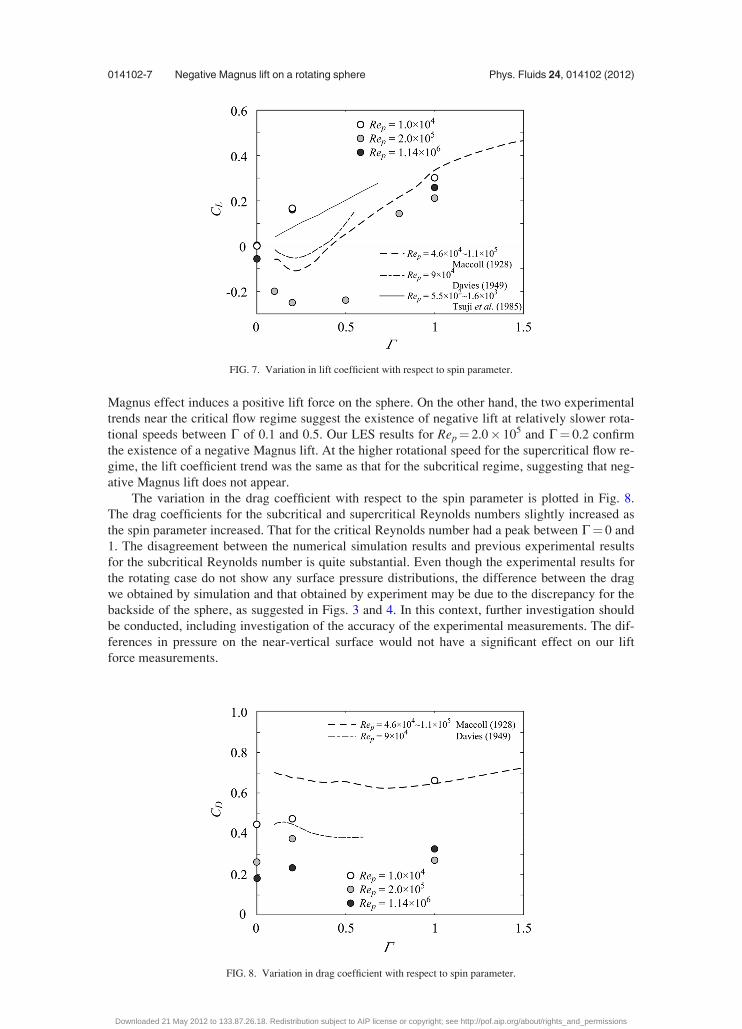
Magnus effect induces a positive lift force on the sphere. On the other hand, the two experimental
trends near the critical flow regime suggest the existence of negative lift at relatively slower rota-
tional speeds between C of 0.1 and 0.5. Our LES results for Rep¼ 2.0� 105 and C¼ 0.2 confirm
the existence of a negative Magnus lift. At the higher rotational speed for the supercritical flow re-
gime, the lift coefficient trend was the same as that for the subcritical regime, suggesting that neg-
ative Magnus lift does not appear.
The variation in the drag coefficient with respect to the spin parameter is plotted in Fig. 8.
The drag coefficients for the subcritical and supercritical Reynolds numbers slightly increased as
the spin parameter increased. That for the critical Reynolds number had a peak between C¼ 0 and
1. The disagreement between the numerical simulation results and previous experimental results
for the subcritical Reynolds number is quite substantial. Even though the experimental results for
the rotating case do not show any surface pressure distributions, the difference between the drag
we obtained by simulation and that obtained by experiment may be due to the discrepancy for the
backside of the sphere, as suggested in Figs. 3 and 4. In this context, further investigation should
be conducted, including investigation of the accuracy of the experimental measurements. The dif-
ferences in pressure on the near-vertical surface would not have a significant effect on our lift
force measurements.
FIG. 7. Variation in lift coefficient with respect to spin parameter.
FIG. 8. Variation in drag coefficient with respect to spin parameter.
014102-7 Negative Magnus lift on a rotating sphere Phys. Fluids 24, 014102 (2012)
Downloaded 21 May 2012 to 133.87.26.18. Redistribution subject to AIP license or copyright; see http://pof.aip.org/about/rights_and_permissions
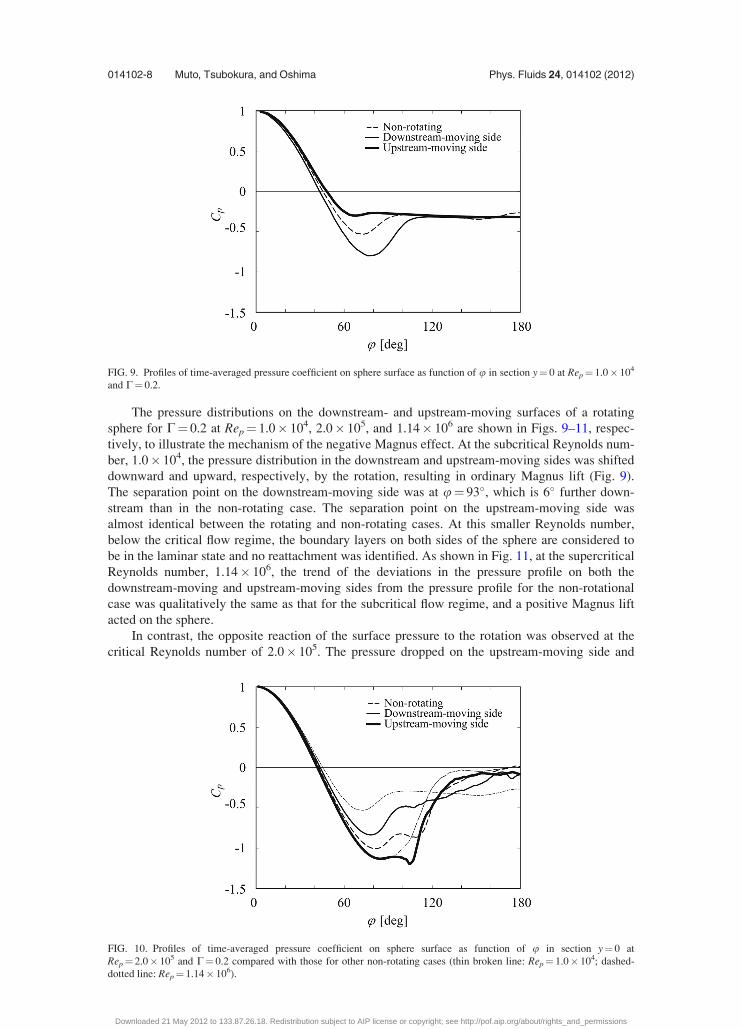
The pressure distributions on the downstream- and upstream-moving surfaces of a rotating
sphere for C¼ 0.2 at Rep¼ 1.0� 104, 2.0� 105, and 1.14� 106 are shown in Figs. 9–11, respec-
tively, to illustrate the mechanism of the negative Magnus effect. At the subcritical Reynolds num-
ber, 1.0� 104, the pressure distribution in the downstream and upstream-moving sides was shifted
downward and upward, respectively, by the rotation, resulting in ordinary Magnus lift (Fig. 9).
The separation point on the downstream-moving side was at u¼ 93�, which is 6� further down-
stream than in the non-rotating case. The separation point on the upstream-moving side was
almost identical between the rotating and non-rotating cases. At this smaller Reynolds number,
below the critical flow regime, the boundary layers on both sides of the sphere are considered to
be in the laminar state and no reattachment was identified. As shown in Fig. 11, at the supercritical
Reynolds number, 1.14� 106, the trend of the deviations in the pressure profile on both the
downstream-moving and upstream-moving sides from the pressure profile for the non-rotational
case was qualitatively the same as that for the subcritical flow regime, and a positive Magnus lift
acted on the sphere.
In contrast, the opposite reaction of the surface pressure to the rotation was observed at the
critical Reynolds number of 2.0� 105. The pressure dropped on the upstream-moving side and
FIG. 9. Profiles of time-averaged pressure coefficient on sphere surface as function of u in section y¼ 0 at Rep¼ 1.0� 104
and C¼ 0.2.
FIG. 10. Profiles of time-averaged pressure coefficient on sphere surface as function of u in section y¼ 0 at
Rep¼ 2.0� 105 and C¼ 0.2 compared with those for other non-rotating cases (thin broken line: Rep¼ 1.0� 104; dashed-
dotted line: Rep¼ 1.14� 106).
014102-8 Muto, Tsubokura, and Oshima Phys. Fluids 24, 014102 (2012)
Downloaded 21 May 2012 to 133.87.26.18. Redistribution subject to AIP license or copyright; see http://pof.aip.org/about/rights_and_permissions
rose on the downstream-moving side, as shown in Fig. 10. Note that the second indentation around
u¼ 100� for the non-rotating case, indicating the existence of the reattachment point, disappeared
on the downstream-moving side. This is attributed to the suppression of the turbulent transition
caused by the decrease in the relative velocity in the boundary layer with respect to the sphere sur-
face. Thus, the laminarized boundary layer separated at u¼ 90�, slightly faster than for the case
without rotation. The second indentation corresponding to the reattachment and re-separation
became steeper and narrower due to the rotation. It is reasonable to conclude that this was due to
an increase in the local Reynolds number in the boundary layer with respect to the relative veloc-
ity between the sphere surface and streamwise velocity in the boundary layer, thus promoting tur-
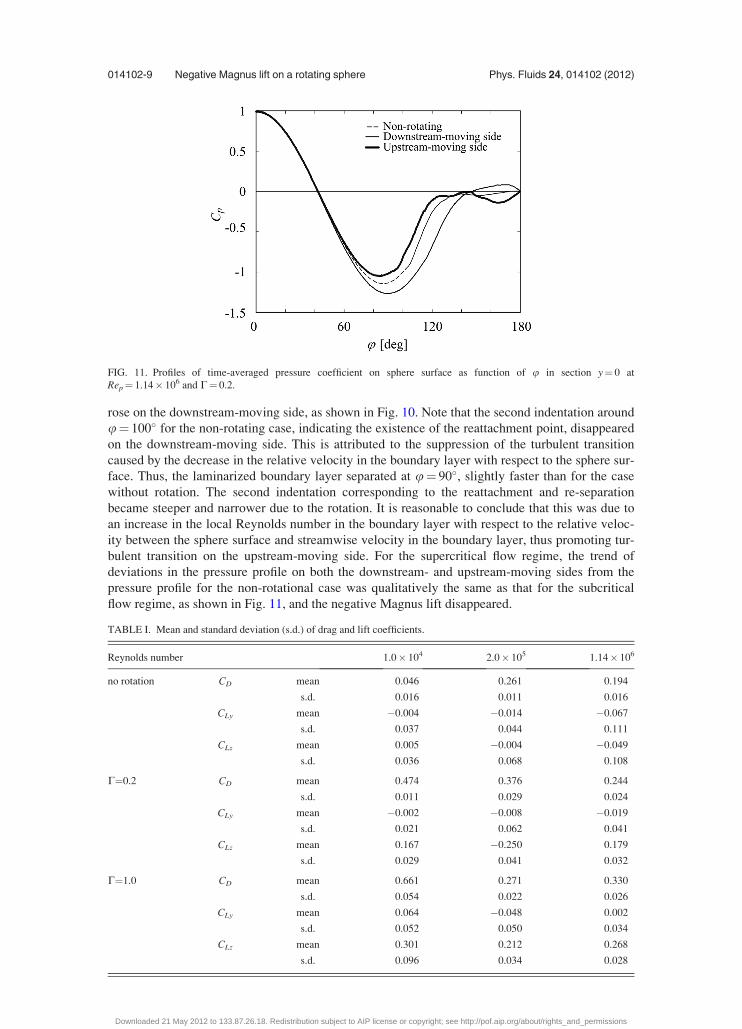
bulent transition on the upstream-moving side. For the supercritical flow regime, the trend of
deviations in the pressure profile on both the downstream- and upstream-moving sides from the
pressure profile for the non-rotational case was qualitatively the same as that for the subcritical
flow regime, as shown in Fig. 11, and the negative Magnus lift disappeared.
FIG. 11. Profiles of time-averaged pressure coefficient on sphere surface as function of u in section y¼ 0 at
Rep¼ 1.14� 106 and C¼ 0.2.
TABLE I. Mean and standard deviation (s.d.) of drag and lift coefficients.
Reynolds number 1.0� 104 2.0� 105 1.14� 106
no rotation CD mean 0.046 0.261 0.194
s.d. 0.016 0.011 0.016
CLy mean �0.004 �0.014 �0.067
s.d. 0.037 0.044 0.111
CLz mean 0.005 �0.004 �0.049
s.d. 0.036 0.068 0.108
C¼0.2 CD mean 0.474 0.376 0.244
s.d. 0.011 0.029 0.024
CLy mean �0.002 �0.008 �0.019
s.d. 0.021 0.062 0.041
CLz mean 0.167 �0.250 0.179
s.d. 0.029 0.041 0.032
C¼1.0 CD mean 0.661 0.271 0.330
s.d. 0.054 0.022 0.026
CLy mean 0.064 �0.048 0.002
s.d. 0.052 0.050 0.034
CLz mean 0.301 0.212 0.268
s.d. 0.096 0.034 0.028
014102-9 Negative Magnus lift on a rotating sphere Phys. Fluids 24, 014102 (2012)
Downloaded 21 May 2012 to 133.87.26.18. Redistribution subject to AIP license or copyright; see http://pof.aip.org/about/rights_and_permissions
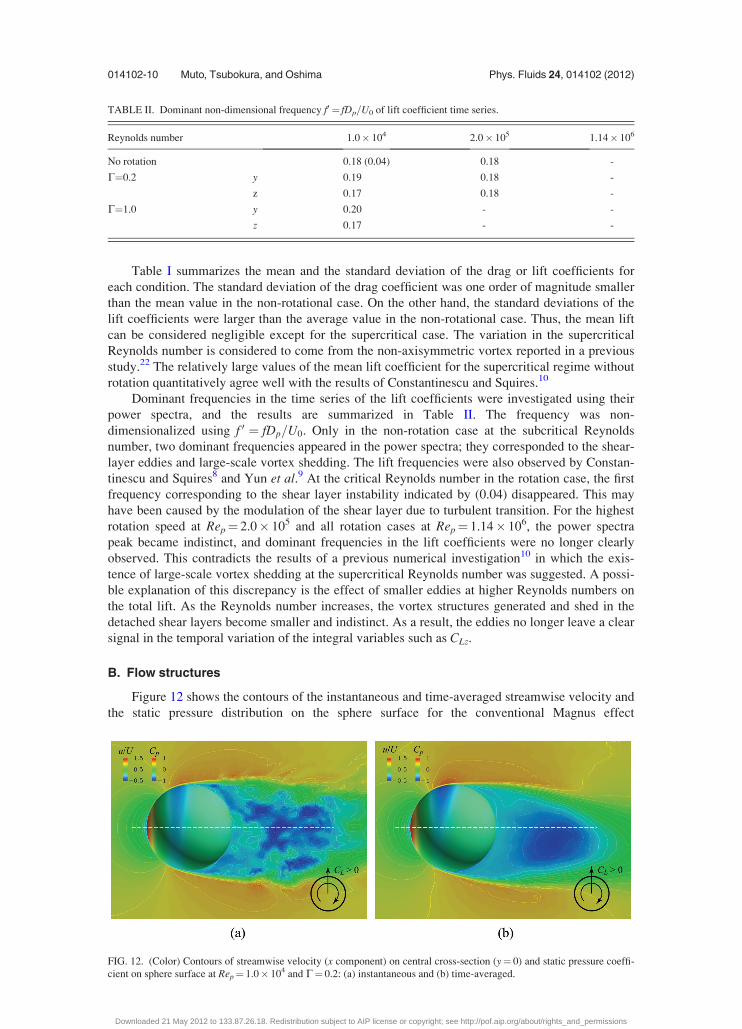
Table I summarizes the mean and the standard deviation of the drag or lift coefficients for
each condition. The standard deviation of the drag coefficient was one order of magnitude smaller
than the mean value in the non-rotational case. On the other hand, the standard deviations of the
lift coefficients were larger than the average value in the non-rotational case. Thus, the mean lift
can be considered negligible except for the supercritical case. The variation in the supercritical
Reynolds number is considered to come from the non-axisymmetric vortex reported in a previous
study.22 The relatively large values of the mean lift coefficient for the supercritical regime without
rotation quantitatively agree well with the results of Constantinescu and Squires.10
Dominant frequencies in the time series of the lift coefficients were investigated using their
power spectra, and the results are summarized in Table II. The frequency was non-
dimensionalized using f 0 ¼ fDp=U0. Only in the non-rotation case at the subcritical Reynolds
number, two dominant frequencies appeared in the power spectra; they corresponded to the shear-
layer eddies and large-scale vortex shedding. The lift frequencies were also observed by Constan-
tinescu and Squires8 and Yun et al.9 At the critical Reynolds number in the rotation case, the first
frequency corresponding to the shear layer instability indicated by (0.04) disappeared. This may
have been caused by the modulation of the shear layer due to turbulent transition. For the highest
rotation speed at Rep¼ 2.0� 105 and all rotation cases at Rep¼ 1.14� 106, the power spectra
peak became indistinct, and dominant frequencies in the lift coefficients were no longer clearly
observed. This contradicts the results of a previous numerical investigation10 in which the exis-
tence of large-scale vortex shedding at the supercritical Reynolds number was suggested. A possi-
ble explanation of this discrepancy is the effect of smaller eddies at higher Reynolds numbers on
the total lift. As the Reynolds number increases, the vortex structures generated and shed in the
detached shear layers become smaller and indistinct. As a result, the eddies no longer leave a clear
signal in the temporal variation of the integral variables such as CLz.
B. Flow structures
Figure 12 shows the contours of the instantaneous and time-averaged streamwise velocity and
the static pressure distribution on the sphere surface for the conventional Magnus effect
TABLE II. Dominant non-dimensional frequency f0 ¼ fDp=U0 of lift coefficient time series.
Reynolds number 1.0� 104 2.0� 105 1.14� 106
No rotation 0.18 (0.04) 0.18 -
C¼0.2 y 0.19 0.18 -
z 0.17 0.18 -
C¼1.0 y 0.20 - -
z 0.17 - -
FIG. 12. (Color) Contours of streamwise velocity (x component) on central cross-section (y¼ 0) and static pressure coeffi-
cient on sphere surface at Rep¼ 1.0� 104 and C¼ 0.2: (a) instantaneous and (b) time-averaged.
014102-10 Muto, Tsubokura, and Oshima Phys. Fluids 24, 014102 (2012)
Downloaded 21 May 2012 to 133.87.26.18. Redistribution subject to AIP license or copyright; see http://pof.aip.org/about/rights_and_permissions
(Rep¼ 1.0� 104 and C¼ 0.2). A positive lift on the sphere was confirmed by the distortion of the
wake in the downward direction.
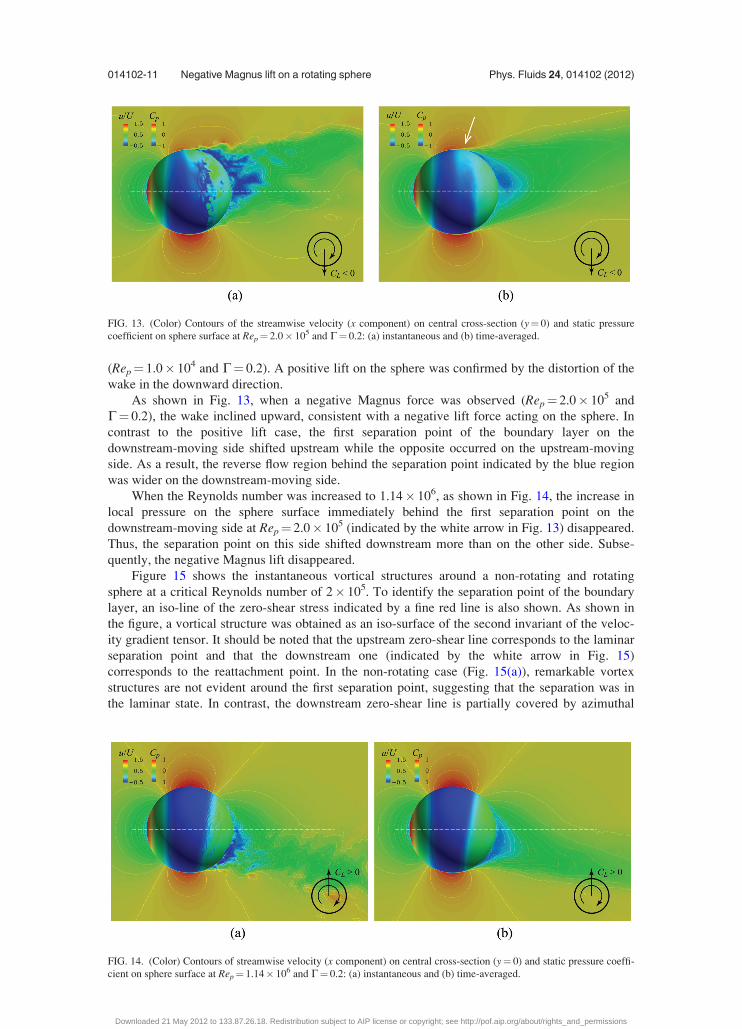
As shown in Fig. 13, when a negative Magnus force was observed (Rep¼ 2.0� 105 and
C¼ 0.2), the wake inclined upward, consistent with a negative lift force acting on the sphere. In
contrast to the positive lift case, the first separation point of the boundary layer on the
downstream-moving side shifted upstream while the opposite occurred on the upstream-moving
side. As a result, the reverse flow region behind the separation point indicated by the blue region
was wider on the downstream-moving side.
When the Reynolds number was increased to 1.14� 106, as shown in Fig. 14, the increase in
local pressure on the sphere surface immediately behind the first separation point on the
downstream-moving side at Rep¼ 2.0� 105 (indicated by the white arrow in Fig. 13) disappeared.
Thus, the separation point on this side shifted downstream more than on the other side. Subse-
quently, the negative Magnus lift disappeared.
Figure 15 shows the instantaneous vortical structures around a non-rotating and rotating
sphere at a critical Reynolds number of 2� 105. To identify the separation point of the boundary
layer, an iso-line of the zero-shear stress indicated by a fine red line is also shown. As shown in
the figure, a vortical structure was obtained as an iso-surface of the second invariant of the veloc-
ity gradient tensor. It should be noted that the upstream zero-shear line corresponds to the laminar
separation point and that the downstream one (indicated by the white arrow in Fig. 15)
corresponds to the reattachment point. In the non-rotating case (Fig. 15(a)), remarkable vortex
structures are not evident around the first separation point, suggesting that the separation was in
the laminar state. In contrast, the downstream zero-shear line is partially covered by azimuthal
FIG. 13. (Color) Contours of the streamwise velocity (x component) on central cross-section (y¼ 0) and static pressure
coefficient on sphere surface at Rep¼ 2.0� 105 and C¼ 0.2: (a) instantaneous and (b) time-averaged.
FIG. 14. (Color) Contours of streamwise velocity (x component) on central cross-section (y¼ 0) and static pressure coeffi-
cient on sphere surface at Rep¼ 1.14� 106 and C¼ 0.2: (a) instantaneous and (b) time-averaged.
014102-11 Negative Magnus lift on a rotating sphere Phys. Fluids 24, 014102 (2012)
Downloaded 21 May 2012 to 133.87.26.18. Redistribution subject to AIP license or copyright; see http://pof.aip.org/about/rights_and_permissions
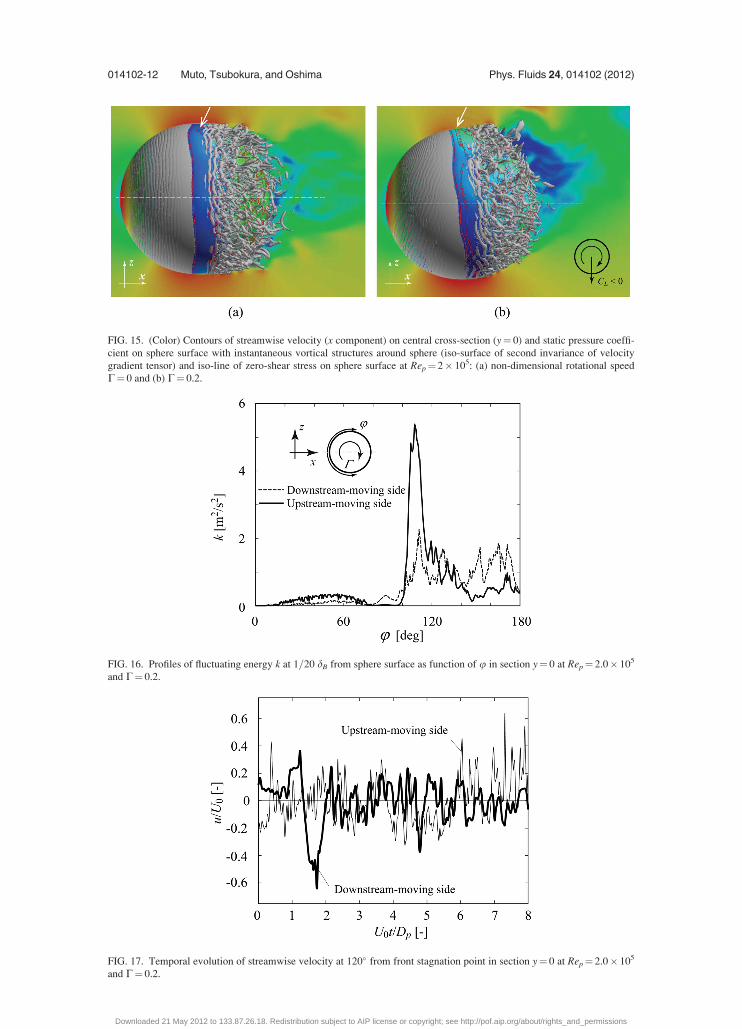
FIG. 15. (Color) Contours of streamwise velocity (x component) on central cross-section (y¼ 0) and static pressure coeffi-
cient on sphere surface with instantaneous vortical structures around sphere (iso-surface of second invariance of velocity
gradient tensor) and iso-line of zero-shear stress on sphere surface at Rep¼ 2� 105: (a) non-dimensional rotational speed
C¼ 0 and (b) C¼ 0.2.
FIG. 16. Profiles of fluctuating energy k at 1=20 dB from sphere surface as function of u in section y¼ 0 at Rep¼ 2.0� 105
and C¼ 0.2.
FIG. 17. Temporal evolution of streamwise velocity at 120� from front stagnation point in section y¼ 0 at Rep¼ 2.0� 105
and C¼ 0.2.
014102-12 Muto, Tsubokura, and Oshima Phys. Fluids 24, 014102 (2012)
Downloaded 21 May 2012 to 133.87.26.18. Redistribution subject to AIP license or copyright; see http://pof.aip.org/about/rights_and_permissions
vortex structures, indicating that the transition occurred around the reattachment region. When the
sphere rotated at C¼ 0.2 and the negative Magnus effect appeared, as shown in Fig. 15(b), the
boundary layer on the upstream-moving side was perturbed around the first separation point, and
the laminar separation became indistinct.
To investigate the turbulent transition of the boundary layer on the sphere surface on the
upstream-moving side, we compared the kinetic energy of the velocity fluctuation in the boundary
layer between the downstream- and upstream-moving sides. Figure 16 shows an apparent differ-
ence in the fluctuation in the boundary layer between the two sides. This high fluctuation energy kdenotes high levels of fluctuation in the flow, which is consistent with turbulence. Here, k is
defined as
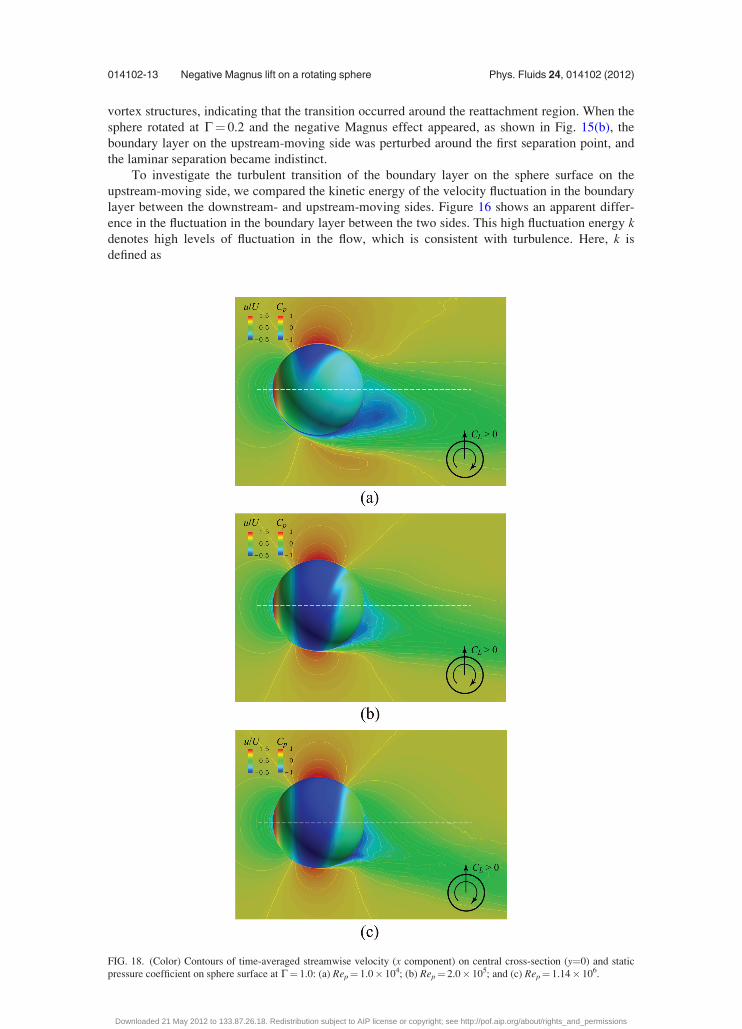
FIG. 18. (Color) Contours of time-averaged streamwise velocity (x component) on central cross-section (y¼0) and static
pressure coefficient on sphere surface at C¼ 1.0: (a) Rep¼ 1.0� 104; (b) Rep¼ 2.0� 105; and (c) Rep¼ 1.14� 106.
014102-13 Negative Magnus lift on a rotating sphere Phys. Fluids 24, 014102 (2012)
Downloaded 21 May 2012 to 133.87.26.18. Redistribution subject to AIP license or copyright; see http://pof.aip.org/about/rights_and_permissions
k ¼ u2RMS þ v2
RMS þ w2RMS
� �=2; (2)
where uRMS, vRMS, and wRMS are the root mean square values of the velocity fluctuation for the x,
y, and z directions, respectively. This distribution of k suggests that turbulent transition in the
boundary layer is promoted on the upstream-moving side of the sphere and that the transition con-
tributes to the shift of the separation point, which leads to generation of negative Magnus lift.
Figure 17 shows the temporal evolution of the streamwise velocity at u¼ 120� for the same
conditions as for Fig. 16. The time series for the upstream-moving side had a higher frequency
than that for the downstream-moving one. This temporal evolution also suggests that turbulent
transition in the boundary layer is promoted on the upstream-moving side.
When rotational speed C was increased to 1.0, the pressure distribution on the downstream-
moving side approached the state of the potential flow for all three Rep cases, as shown in Fig. 18.
This was due to the relative velocity with respect to the incoming flow becoming zero. Thus, the
pressure on this side became significantly lower than that on the other side. As a result, the nega-
tive Magnus lift did not appear in any of these cases.
V. SUMMARY
The lift force of a rotating sphere was investigated by using large-eddy simulation for Reyn-
olds numbers (Rep) of 1.0� 104, 2.0� 105, and 1.14� 106, and the physical mechanism leading to
the generation of negative Magnus lift was investigated in the context of the suppression or pro-
motion of the boundary layer transition around the separation point.
• In the critical flow regime (Rep¼2.0� 105), the lift force on the sphere became negative at a rel-
atively low rotational speed and then changed to positive as the rotational speed increased. The
negative lift force was caused by laminarization of the surface boundary layer on the
downstream-moving side and transition to turbulence on the upstream-moving side. The former
shifted the separation point upstream, and the latter shifted it downstream, compared with the
non-rotating case.• In the subcritical flow regime (Rep¼1.0� 104), in which the surface boundary layer was sub-
jected to fully laminar separation, the lift force on the sphere increased as the rotational speed
increased. This increase in lift is considered to be the ordinary Magnus effect.• Finally, in the supercritical flow regime (Rep¼1.14� 106), in which the surface boundary layer
was subjected to fully turbulent separation, the lift force on the sphere monotonically increased
as the rotational speed increased.
ACKNOWLEDGMENTS
The authors acknowledge the support of the Ministry of Education, Culture, Sports, Science
and Technology, Japan, in funding this study with a Grant-in-Aid for Scientific Research (C)
20560143.
1G. Magnus, “Uber die Abweichung der Geschosse, und: Uber eine abfallende Erscheinung bei rotierenden Korpern,”Poggendorff’s Ann. Phys. Chem. 164, 1 (1853).
2S. Taneda, “Negative magnus effect,” Rep. Res. Inst. Appl. Mech. 5(20), 123 (1957).3J. H. Maccoll, “Aerodynamics of a spinning Sphere,” J. R. Aeronaut. Soc. 28, 777 (1928).4J. M. Davies, “The aerodynamics of golf balls,” J. Appl. Phys. 20, 821 (1949).5E. Achenbach, “Experiments on the flow past spheres at very high Reynolds numbers,” J. Fluid Mech. 54, 565 (1972).6M. Germano, U. Piomelli, P. Moin, and W. H. Cabot, “A dynamic subgrid-scale eddy viscosity model,” Phys. Fluids A3(7), 1760 (1991).
7D. K. Lilly, “A proposed modification of the Germano subgrid-scale closure method,” Phys. Fluids A 4(4), 633 (1992).8G. Constantinescu and K. Squires, “LES and DES investigation of turbulent flow over a sphere at Re¼ 10 000,” Flow,Turbul. Combust. 70, 267 (2003).
9G. Constantinescu, M. Chapelet, and K. Squires, “Turbulence modeling applied to flow over a sphere,” AIAA J. 41, 1733(2003).
10G. Constantinescu and K. Squires, “Numerical investigations of flow over a sphere in the subcritical and supercriticalregimes,” Phys. Fluids 16(5), 1449 (2004).
11G. Yun, D. Kim, and H. Choi, “Vortical structures behind a sphere at subcritical Reynolds numbers,” Phys. Fluids 18,015102 (2006).
12K. Mahesh, G. Constantinescu, and P. Moin, “A numerical method for large-eddy simulation in complex geometries,” J.Comput. Phys. 197, 215 (2004).
014102-14 Muto, Tsubokura, and Oshima Phys. Fluids 24, 014102 (2012)
Downloaded 21 May 2012 to 133.87.26.18. Redistribution subject to AIP license or copyright; see http://pof.aip.org/about/rights_and_permissions
13S. Muzaferija, “Adaptive finite volume method for flow prediction using unstructured meshes and multigrid approach,”Ph.D. dissertation (University of London, 1994).
14J. Kim and P. Moin, “Application of a fractional-step method to incompressible Navier-Stokes equations,” J. Comput.Phys. 59, 308 (1985).
15 A. A. Amsden and F. H. Harlow, “A simplified MAC technique for incompressible fluid flow calculations,” J. Comput.Phys. 6, 322 (1970).
16C. M. Rhie and W. L. Chow, “Numerical study of the turbulent flow past an airfoil with trailing edge separation,” AIAAJ. 21, 1525 (1983).
17H. Schlichting, Boundary Layer Theory (McGraw-Hill, New York, 1955).18C. Wieselsberger, “Weitere Feststellungen uber die Gesetze des Flussigkeits und Luftwiderstandes,” Phys. Z. 23, 219
(1922).19G. K. Suryanarayana and E. A. Meier, “Effect of ventilation on the flow field around a sphere,” Exp. Fluids 19, 78
(1995).20A. Fage, “Experiments on a sphere at critical Reynolds numbers,” Aeronautical Research Council, Reports and Memo-
randa No. 1766 (Her Majesty’s Stationery Office, London, 1936).21Y. Tsuji, Y. Morikawa, and O. Mizuno, “Experimental measurement of the magnus force on a rotating sphere at low
Reynolds numbers,” J. Fluids Eng. 107, 484 (1985).22S. Taneda, “Visual observations of the flow past a sphere at Reynolds numbers between 104 and 106,” J. Fluid Mech. 85,
187 (1978).
014102-15 Negative Magnus lift on a rotating sphere Phys. Fluids 24, 014102 (2012)
Downloaded 21 May 2012 to 133.87.26.18. Redistribution subject to AIP license or copyright; see http://pof.aip.org/about/rights_and_permissions


![VARIO Magnus [e]Magnus](https://img.pdfslide.net/doc/110x75/62e7b22695cddb648811f746/vario-magnus-emagnus.jpg)