Embed Size (px)
Citation preview
Neighborhood Bridges:
2012-2013 Evaluation Report
July 8, 2013
Submitted to
The Children’s Theatre Company
By
Debra Ingram
CENTER FOR APPLIED RESEARCH AND EDUCATIONAL IMPROVEMENT UNIVERSITY OF MINNESOTA i
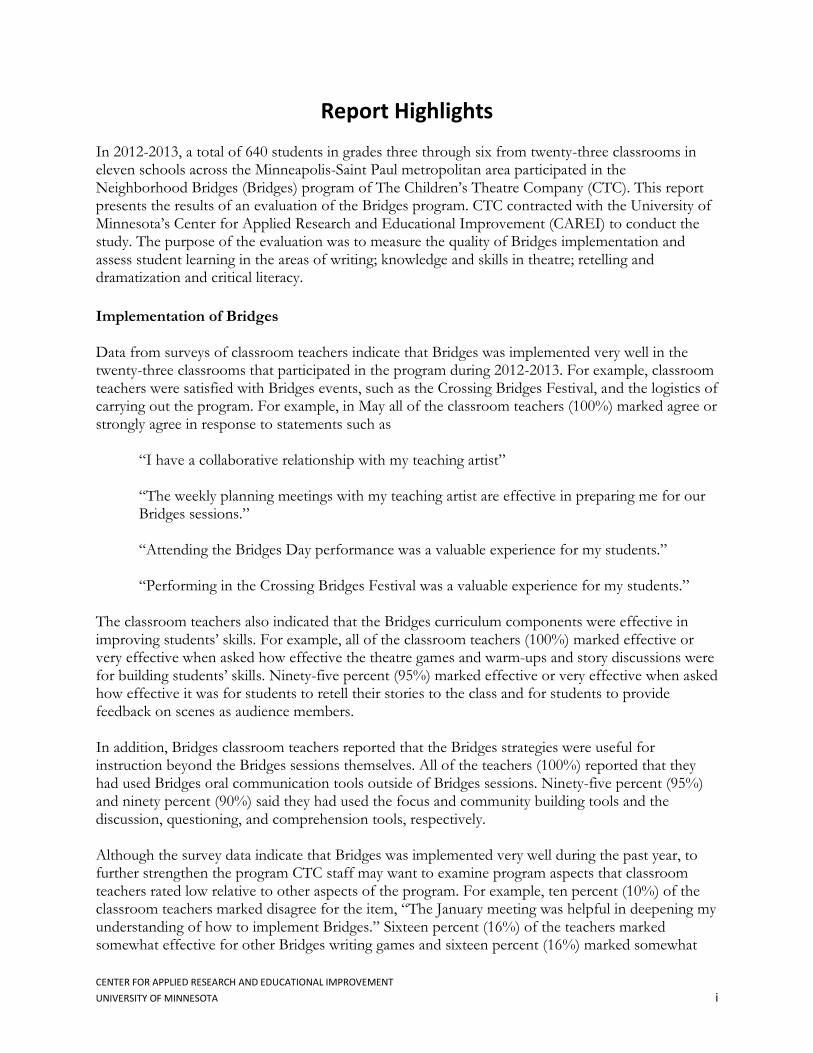
Report Highlights
In 2012-2013, a total of 640 students in grades three through six from twenty-three classrooms in eleven schools across the Minneapolis-Saint Paul metropolitan area participated in the Neighborhood Bridges (Bridges) program of The Children’s Theatre Company (CTC). This report presents the results of an evaluation of the Bridges program. CTC contracted with the University of Minnesota’s Center for Applied Research and Educational Improvement (CAREI) to conduct the study. The purpose of the evaluation was to measure the quality of Bridges implementation and assess student learning in the areas of writing; knowledge and skills in theatre; retelling and dramatization and critical literacy.
Implementation of Bridges Data from surveys of classroom teachers indicate that Bridges was implemented very well in the twenty-three classrooms that participated in the program during 2012-2013. For example, classroom teachers were satisfied with Bridges events, such as the Crossing Bridges Festival, and the logistics of carrying out the program. For example, in May all of the classroom teachers (100%) marked agree or strongly agree in response to statements such as
“I have a collaborative relationship with my teaching artist” “The weekly planning meetings with my teaching artist are effective in preparing me for our Bridges sessions.” “Attending the Bridges Day performance was a valuable experience for my students.” “Performing in the Crossing Bridges Festival was a valuable experience for my students.”
The classroom teachers also indicated that the Bridges curriculum components were effective in improving students’ skills. For example, all of the classroom teachers (100%) marked effective or very effective when asked how effective the theatre games and warm-ups and story discussions were for building students’ skills. Ninety-five percent (95%) marked effective or very effective when asked how effective it was for students to retell their stories to the class and for students to provide feedback on scenes as audience members. In addition, Bridges classroom teachers reported that the Bridges strategies were useful for instruction beyond the Bridges sessions themselves. All of the teachers (100%) reported that they had used Bridges oral communication tools outside of Bridges sessions. Ninety-five percent (95%) and ninety percent (90%) said they had used the focus and community building tools and the discussion, questioning, and comprehension tools, respectively. Although the survey data indicate that Bridges was implemented very well during the past year, to further strengthen the program CTC staff may want to examine program aspects that classroom teachers rated low relative to other aspects of the program. For example, ten percent (10%) of the classroom teachers marked disagree for the item, “The January meeting was helpful in deepening my understanding of how to implement Bridges.” Sixteen percent (16%) of the teachers marked somewhat effective for other Bridges writing games and sixteen percent (16%) marked somewhat
CENTER FOR APPLIED RESEARCH AND EDUCATIONAL IMPROVEMENT UNIVERSITY OF MINNESOTA ii
effective for students rehearsing short scenes with their peers. CTC staff and the researchers could look more closely at the survey data to determine if the effectiveness of these Bridges components varied by the grade level of students or perhaps the number of years that a classroom teacher has been involved in Bridges. The data may indicate that targeted professional development or coaching for classroom teachers related to these areas of the program would be useful. Student Learning in Writing Information from the classroom teacher and student surveys, along with information from the Neighborhood Bridges Writing Assessment indicate that students’ writing skills improved during their participation in Bridges. For example, on the May survey ninety-five percent (95%) of the classroom teachers marked agree or strongly agree for the statement, “Students’ writing skills have improved.” Ninety percent of the teachers (90%) reported that students’ enjoyment of writing had improved. Students also reported that their writing skills had improved since the fall. Eighty-four percent (84%) of the students in grades four through six chose a response of agree or strongly agree for the survey item, “From the beginning of the year until now I’ve gotten better at writing stories.” In addition, ninety-two percent (61%) of the students in grade three marked yes when asked if they were a better writer. The writing assessment measures student’s skills in five areas: ideas, organization, style, mechanics, and creativity, along with a count of the number of words each student has written. On the grade three writing assessment there were statistically significant increases from fall to spring on each of the five dimensions. The overall score increased from an average of 8.3 points to an average of 11.6 points (out of a total possible twenty points). This change was also statistically significant. Eighty-five percent of the third grade students met the benchmark by having an overall score of ten points or higher on the spring writing assessment. Students in grades four through six showed a statistically significant increase from fall to spring on the writing dimension of ideas and the dimension of organization. The overall score increased from an average of 11.7 points in the fall to an average of 12.3 points in the spring, a statistically significant difference. Eighty percent of the students in grades four through six met the benchmark established for the writing assessment. Students’ Knowledge and Skills in Theatre The evaluation data provide multiple forms of evidence to indicate that students’ knowledge and skills in theatre increase during the course of their participation in Bridges. Results from the classroom teacher survey indicate that teachers noticed increases in at least a majority of their students’ theatre skills over the course of the year. At least ninety percent (90%) of the classroom teachers marked agree or strongly agree when asked about improvements in the seven skills which make up the learning area of retelling and dramatization on the May survey. Examples of these skills are students’ ability to use clear diction when speaking in front of others and students’ ability to animate their bodies in the scenes they perform in Bridges. On the student survey, the students also reported growth in their theatre skills. Almost three-fourths (72%) of the third grade students responded yes to the statement, “I work well with my team to make plays.” Sixty-eight percent (68%) of the students in grades four through six reported that their skills in retelling a story in front of the class had improved.
CENTER FOR APPLIED RESEARCH AND EDUCATIONAL IMPROVEMENT UNIVERSITY OF MINNESOTA iii
The Neighborhood Bridges Responding to a Play Assessment measures students’ ability to use theatre arts vocabulary and concepts to respond to a theatre performance. Data from this assessment show that Bridges students were successful in preparing a response to the performance of Jackie and Me that they attended at CTC. The average overall score for third grade students was 18.8 (out of a total possible thirty-two points). Eighty-six percent of the students (86%) in grade three met the benchmark of sixteen points or higher on the responding assessment. The average overall score on the responding assessment for students in grades four through six was 19.2 (out of a total possible thirty-six points) Sixty-seven percent (67%) of the students in grades four through six met the benchmark score of eighteen points or higher. On the Neighborhood Bridges Theatre Vocabulary Recognition Test, students in grades three through six showed a statistically significant increase from fall to spring in the number of terms they identified correctly. In addition, sixty-five percent (65%) of the students in grade three met the benchmark set for their spring post-test and seventy-five percent (75%) of the students in grades four through six met the benchmark set for their spring post-test.1 Students’ Skills in Critical Literacy The May survey asked classroom teachers whether they had seen changes in their students’ critical literacy skills during their participation in Bridges and their survey responses indicate that students developed skills in this area. Eighty-five percent (85%) of the teachers chose agree or strongly agree in response to the statement, “Students’ critical literacy skills have increased” and fifteen percent (15%) marked disagree. Among the six specific critical literacy skills listed on the survey, the highest proportion of classroom teachers (95%) marked agree or strongly agree for the item, “Students have become more skilled in looking for meaning in stories.” In addition, ninety percent (90%) of the teachers chose agree or strongly agree in response to the item, “Students question the world in which they live through analysis of stories” and the item, “Students have become more skilled at discussing the assumptions that underlie the stories used in Bridges.” In closing, as a whole, the results of the evaluation study indicate that Bridges was implemented successfully in twenty-three classrooms of students in grades three through six during the 2012-2013 school year. Data from surveys of classroom teachers and students who participated in Bridges along with data from assessment tools administered by the researchers provide evidence of what students learned during their participation in Bridges. Students increased their skills in writing, their knowledge and skills in theatre, and their knowledge in the areas of critical literacy and retelling and dramatization.
1 There are two versions of the vocabulary test: one for students in grade three and one for students in grades four
through six.

CENTER FOR APPLIED RESEARCH AND EDUCATIONAL IMPROVEMENT UNIVERSITY OF MINNESOTA iv
Table of Contents Description of Neighborhood Bridges ............................................................................................... 1 Design and Methods.............................................................................................................................. 2 Results: Implementation of Neighborhood Bridges ......................................................................... 6 Results: Student Learning in Neighborhood Bridges ....................................................................... 10 Results from the Classroom Teacher Surveys ...................................................................... 10 Results from the Student Survey ............................................................................................ 13 Writing Assessment Results .................................................................................................... 15 Responding to a Play Assessment Results ............................................................................ 18 Theatre Vocabulary Recognition Test Results ..................................................................... 22 Summary and Discussion ...................................................................................................................... 24
CENTER FOR APPLIED RESEARCH AND EDUCATIONAL IMPROVEMENT UNIVERSITY OF MINNESOTA v
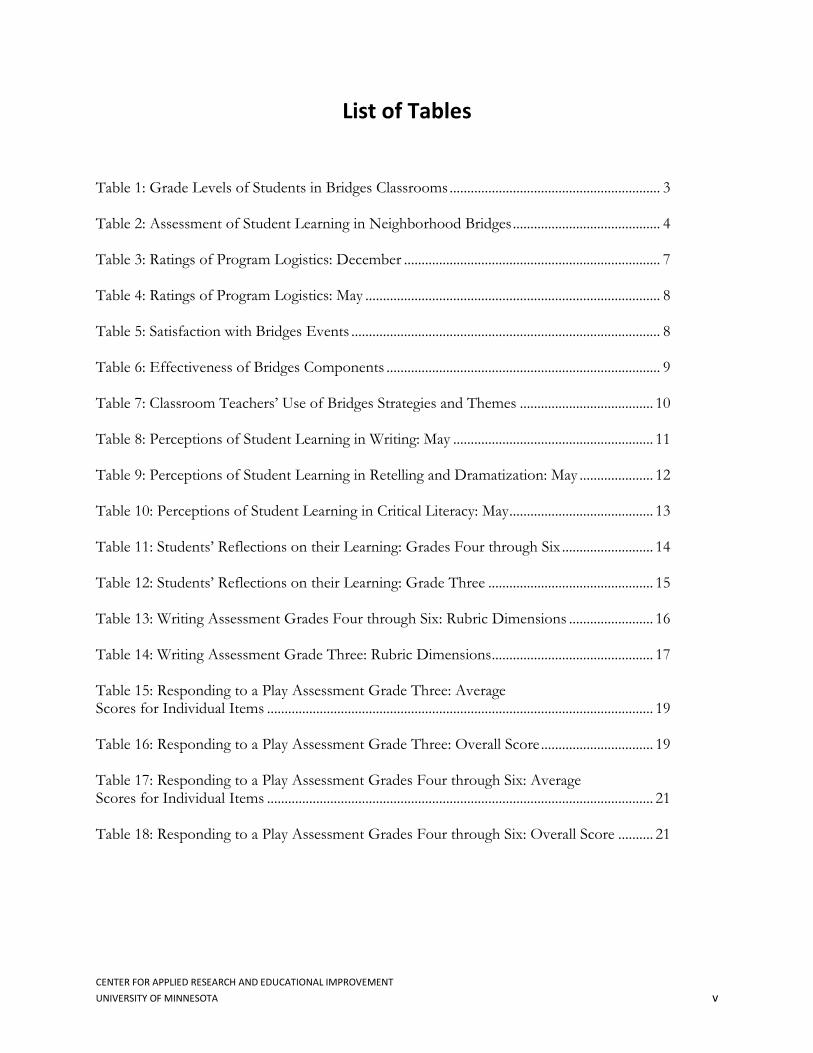
List of Tables Table 1: Grade Levels of Students in Bridges Classrooms ............................................................ 3 Table 2: Assessment of Student Learning in Neighborhood Bridges .......................................... 4 Table 3: Ratings of Program Logistics: December ......................................................................... 7 Table 4: Ratings of Program Logistics: May .................................................................................... 8 Table 5: Satisfaction with Bridges Events ........................................................................................ 8 Table 6: Effectiveness of Bridges Components .............................................................................. 9 Table 7: Classroom Teachers’ Use of Bridges Strategies and Themes ...................................... 10 Table 8: Perceptions of Student Learning in Writing: May ......................................................... 11 Table 9: Perceptions of Student Learning in Retelling and Dramatization: May ..................... 12 Table 10: Perceptions of Student Learning in Critical Literacy: May ......................................... 13 Table 11: Students’ Reflections on their Learning: Grades Four through Six .......................... 14 Table 12: Students’ Reflections on their Learning: Grade Three ............................................... 15 Table 13: Writing Assessment Grades Four through Six: Rubric Dimensions ........................ 16 Table 14: Writing Assessment Grade Three: Rubric Dimensions .............................................. 17 Table 15: Responding to a Play Assessment Grade Three: Average Scores for Individual Items .............................................................................................................. 19 Table 16: Responding to a Play Assessment Grade Three: Overall Score ................................ 19 Table 17: Responding to a Play Assessment Grades Four through Six: Average Scores for Individual Items .............................................................................................................. 21 Table 18: Responding to a Play Assessment Grades Four through Six: Overall Score .......... 21
CENTER FOR APPLIED RESEARCH AND EDUCATIONAL IMPROVEMENT UNIVERSITY OF MINNESOTA vi
List of Tables (continued)
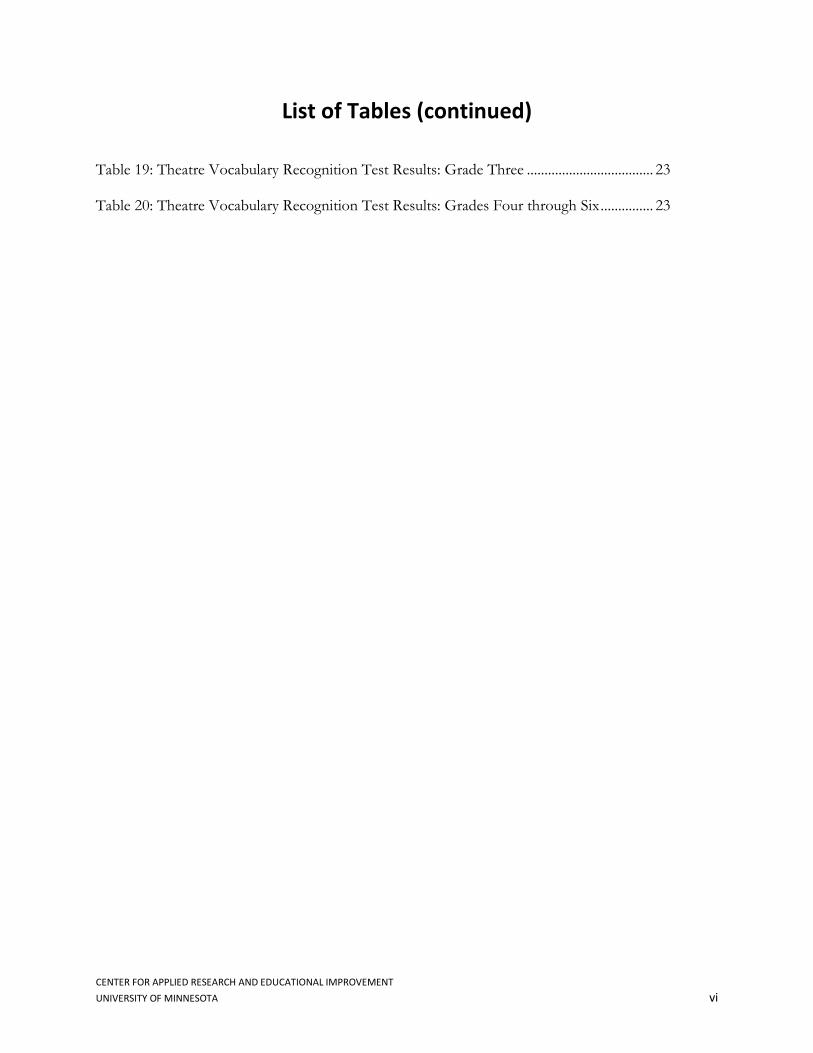
Table 19: Theatre Vocabulary Recognition Test Results: Grade Three .................................... 23 Table 20: Theatre Vocabulary Recognition Test Results: Grades Four through Six ............... 23
CENTER FOR APPLIED RESEARCH AND EDUCATIONAL IMPROVEMENT UNIVERSITY OF MINNESOTA vii
List of Figures Figure 1: Writing Assessment Grades Four through Six: Rubric Dimensions ......................... 16 Figure 2: Writing Assessment Grade Three: Rubric Dimensions .............................................. 18 Figure 3: Responding to a Play Assessment Grades Two and Three: Average Scores for Individual Items ........................................................................................................................... 20 Figure 4: Responding to a Play Assessment Grades Four through Six: Average Scores for Individual Items ........................................................................................................................... 22
CENTER FOR APPLIED RESEARCH AND EDUCATIONAL IMPROVEMENT UNIVERSITY OF MINNESOTA 1
In 2012-2013, students in twenty-three classrooms from eleven schools in the Minneapolis-Saint Paul metropolitan area participated in the Neighborhood Bridges (Bridges) program of The Children’s Theatre Company (CTC). A total of 640 students from grades three to six participated in Bridges across the twenty-three classrooms. This report presents the results of an evaluation of the Bridges program. CTC contracted with the University of Minnesota’s Center for Applied Research and Educational Improvement (CAREI) to conduct the study. The purpose of the evaluation was to measure the quality of Bridges implementation and assess student learning in the areas of writing; knowledge and skills in theatre; retelling and dramatization and critical literacy.
Description of Neighborhood Bridges Bridges is a 31-week program of storytelling and creative drama for elementary and middle school students intended to help them
develop critical literacy skills
recognize their capacity to become storytellers of their own lives
develop their abilities to write, speak, and think clearly
achieve state and national standards for theatre
improve their achievement in reading and writing Bridges was founded in 1997 by Peter Brosius, Artistic Director of CTC, and Jack Zipes, Professor of German and Comparative Literature at the University of Minnesota. Each week, Bridges brings teaching artists into participating classrooms to work collaboratively with the classroom teacher. A typical two-hour Bridges session is composed of four parts:
The Fantastic Binominal: The teaching artist and students spontaneously create a story through free association based on two arbitrarily chosen nouns and a preposition. Then students create their own stories and write them in their Bridges notebook. Each week two or three students are asked to present their stories to their peers. The teaching artist and classroom teacher coach the students in using gestures and voice to dramatize their story. Storytelling: The teaching artist and classroom teacher each tell a tale, often two different versions of the same tale, or tales related to each other. The tales are drawn from an anthology provided with the Bridges curriculum. Over the course of the year, tales are presented from several genres including fairy tales, pourquois tales, and myths. The stories are followed by discussion designed to help students think critically about the content of the tales and the implications for their lives. Scenes and Theatre Games: Students work in small groups to create and perform brief scenes based on the stories they have just heard. The teaching artist leads students in games designed to develop their skills in areas such as focus, diction, gestures, and collaboration.
CENTER FOR APPLIED RESEARCH AND EDUCATIONAL IMPROVEMENT UNIVERSITY OF MINNESOTA 2
Writing Games: Students participate in a reflective writing exercise to solidify the day’s learning and incorporate the creative energy of their scenes into their own stories.
In addition to the weekly Bridges components, students also do the following over the course of the program: create and perform one play at their school and a second play onstage at CTC; write letters to and receive letters from a pen pal at another Bridges school; and attend a professional production at CTC and meet their pen pals. Although students do some writing as part of their weekly Bridges sessions, it is hoped that teachers incorporate some of students’ Bridges writing into their regular writing instruction so that students have an opportunity to further develop their stories and their writing skills. Each week, the teaching artists and classroom teachers at each school meet for one hour to develop the lesson plans for upcoming sessions.
Design and Methods The purpose of the evaluation was to measure the quality of Bridges implementation and assess student learning in areas such as writing and theatre. This section contains a description of the study participants and how the researchers collected and analyzed the data.
Study Participants The study participants included the twenty-two classroom teachers who collaborated with eighteen teaching artists to provided Bridges to students in twenty-three different classrooms throughout the Minneapolis and Saint Paul metropolitan area. Six hundred and forty students in grades three through six participated in Bridges across the twenty-three classrooms. Table 1 shows the number of Bridges classrooms at each grade level. In three of the classrooms Bridges was offered during after-school hours.
CENTER FOR APPLIED RESEARCH AND EDUCATIONAL IMPROVEMENT UNIVERSITY OF MINNESOTA 3
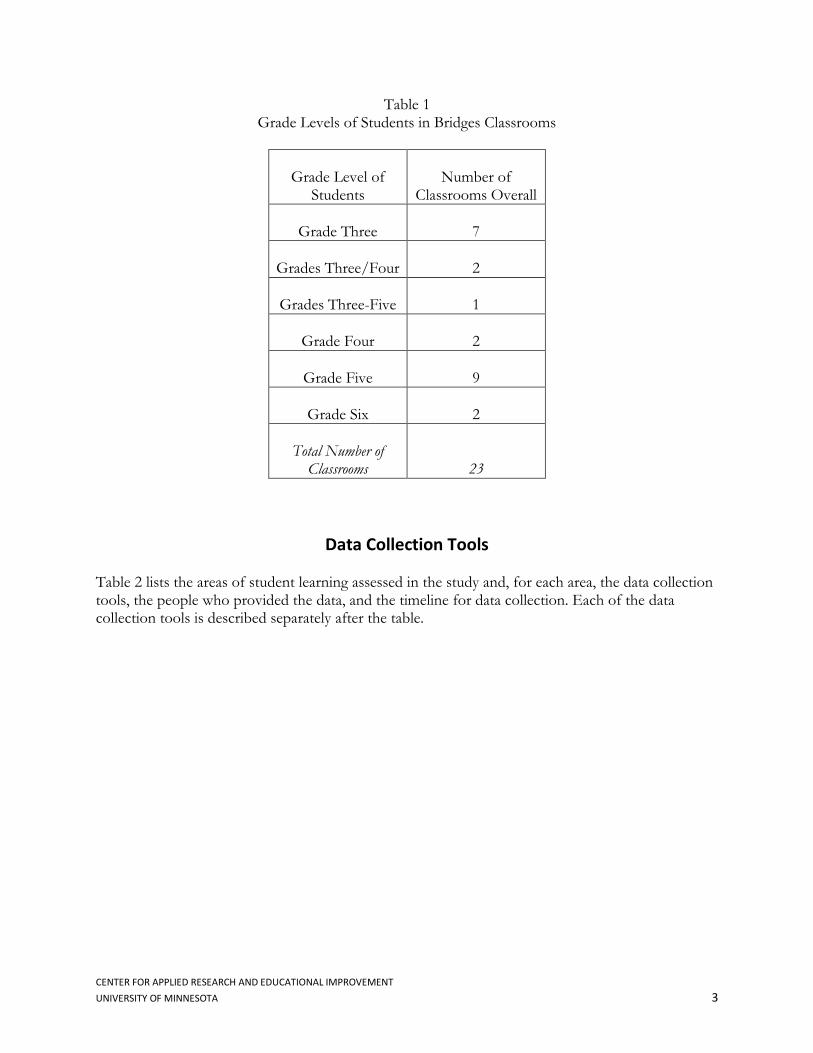
Table 1 Grade Levels of Students in Bridges Classrooms
Grade Level of
Students
Number of
Classrooms Overall
Grade Three
7
Grades Three/Four
2
Grades Three-Five
1
Grade Four
2
Grade Five
9
Grade Six
2
Total Number of
Classrooms
23
Data Collection Tools Table 2 lists the areas of student learning assessed in the study and, for each area, the data collection tools, the people who provided the data, and the timeline for data collection. Each of the data collection tools is described separately after the table.

CENTER FOR APPLIED RESEARCH AND EDUCATIONAL IMPROVEMENT UNIVERSITY OF MINNESOTA 4
Table 2: Assessment of Student Learning in Neighborhood Bridges
Student Learning Area Data Collection Tools Who Provides the Data and when is it Collected?
Writing --Neighborhood Bridges Writing Assessment
A sample of each student’s writing is collected in the fall and again in March.
--Neighborhood Bridges Classroom Teacher Evaluation Surveys I and II
All Bridges classroom teachers complete Survey I in December and Survey II in May.
--Neighborhood Bridges Student Evaluation Survey
All Bridges students complete a survey in May.
Knowledge and Skills in Theater
--Neighborhood Bridges Theatre Vocabulary Recognition Test
All Bridges students complete the vocabulary survey in the fall during one of the first Bridges sessions and again in May.
--Neighborhood Bridges Responding to a Play Assessment
All Bridges students complete the responding to a play assessment worksheet in February and March after they attend a performance at CTC.
Retelling and Dramatization
--Neighborhood Bridges Classroom Teacher Evaluation Surveys I and II
All Bridges classroom teachers complete Survey I in December and Survey II in May.
--Neighborhood Bridges Student Evaluation Survey All Bridges students complete a survey in May.
Critical Literacy --Neighborhood Bridges Classroom Teacher Evaluation Surveys I and II
All Bridges classroom teachers complete Survey I in December and Survey II in May.
CENTER FOR APPLIED RESEARCH AND EDUCATIONAL IMPROVEMENT UNIVERSITY OF MINNESOTA 5
Writing Assessment To assess students’ skills in writing, the researchers collect a sample of each student’s writing in the fall and again in March. The writing samples are drawn from writing that students do during the Fantastic Binominal activity during Bridges classroom sessions. The writing samples are scored by trained reviewers based on a rubric, which includes dimensions such as ideas and creativity. Two reviewers score each sample and their scores are averaged to create a composite score for each dimension of the writing assessment. Growth in students’ writing skills is determined by comparing each student’s score on the fall sample to his/her score on the March sample. Assessment of Theatre Knowledge and Skills To assess students’ knowledge and skills in theatre, the researchers used two tools that they had developed in an earlier study in collaboration with Bridges staff, classroom teachers, and teaching artists. The tools, which align with the state and national theatre arts standards that are emphasized in Bridges, are as follows.
Neighborhood Bridges Responding to a Play Assessment
Neighborhood Bridges Theatre Vocabulary Recognition Test Details of each tool are described below. Responding to a Play Assessment The Neighborhood Bridges Responding to a Play Assessment tool was designed to measure students’ ability to use theatre arts concepts and vocabulary to respond to a theatre performance. The tool contains a worksheet with open-ended questions about aspects of a play and students are asked to prepare a brief written response to each. There are two versions of the tool: one for students in grades two and three, and one for students in grades four through six. Trained readers score students’ responses based on a rubric that describes four levels of achievement for each question. The tool is designed to work with any type of theatre performance students might attend, including the short scenes that students routinely prepare and perform for their peers as part of Bridges classroom sessions. In February 2013, Bridges students attended a performance of Jackie and Me at CTC. After the performance, classroom teachers administered the assessment to their students based on instructions provided with the tool. The raters’ scores on each item were averaged to create a composite score for each item and an overall composite score. Theatre Vocabulary Recognition Test The Neighborhood Bridges Theatre Vocabulary Recognition Test was designed to measure students’ understanding of 20 theatre terms that are used regularly in Bridges. The vocabulary terms appear on the survey in four sets of five terms. Within each set, students match each term to its definition, choosing from among the five definitions provided in each set. Students completed a pre-survey in
CENTER FOR APPLIED RESEARCH AND EDUCATIONAL IMPROVEMENT UNIVERSITY OF MINNESOTA 6
the fall to measure their knowledge level before their participation in Bridges. The survey is repeated in the spring so that researchers can measure the change in students’ theatre vocabulary knowledge after students’ participation in Bridges. Classroom Teacher Evaluation Surveys The purpose of the classroom teacher evaluation surveys is to collect information in two areas: 1) how classroom teachers implemented Bridges in their classrooms and 2) how classroom teachers think their students were affected by their participation in Bridges, specifically in terms of student learning in the areas of writing, retelling and dramatization, and critical literacy. The surveys were developed as part of an earlier study. There are two surveys for classroom teachers. They are asked to complete the first survey online in December and the second survey online in May. The survey items asked respondents to rate their level of agreement on a four point scale – where a rating of 1 equaled strongly disagree and a rating of 4 equaled strongly agree – with statements about the appropriateness of the curriculum and program activities, the roles of the classroom teacher and teaching artist in conducting the program, and student learning. Student Evaluation Survey The purpose of the student survey is to collect information on what students think they have learned during their involvement in Bridges. The survey asks students to think about how their skills may have changed since the beginning of the school year. There are two versions of the survey: one for students in grades two and three, and one for students in grades four through six. The survey for students in grades two and three measures students’ skills in nine areas. Students are instructed to “Read each sentence and decide how much it sounds like you. Then, circle the face that matches your answer.” The response choices are three drawings of a face (showing a smile, a neutral mouth, and a frown) and a word (Yes, Maybe, or No) corresponding to each face. On the survey for students in grades four through six, for each of six learning areas students are instructed to choose the answer that describes them best from a four-point scale that ranges from strongly disagree to strongly agree. The surveys were included in the curriculum materials distributed to classroom teachers in September and students completed the survey during a Bridges session in May. The surveys were developed and used by CTC staff in earlier studies.
Results: Implementation of Neighborhood Bridges This section describes survey results from classroom teachers in two areas: satisfaction with program logistics and events, and the effectiveness of Bridges’ components for student learning. This is followed by information from classroom teachers on their use of Bridges strategies and themes in their instruction outside of Bridges sessions. This information was gathered through online questionnaires completed by Bridges classroom teachers in December and May. The rates of completion on the surveys were good. Seventy-one percent (71%) of the classroom teachers completed a survey in December and ninety-one percent (91%) completed a survey in May.
CENTER FOR APPLIED RESEARCH AND EDUCATIONAL IMPROVEMENT UNIVERSITY OF MINNESOTA 7
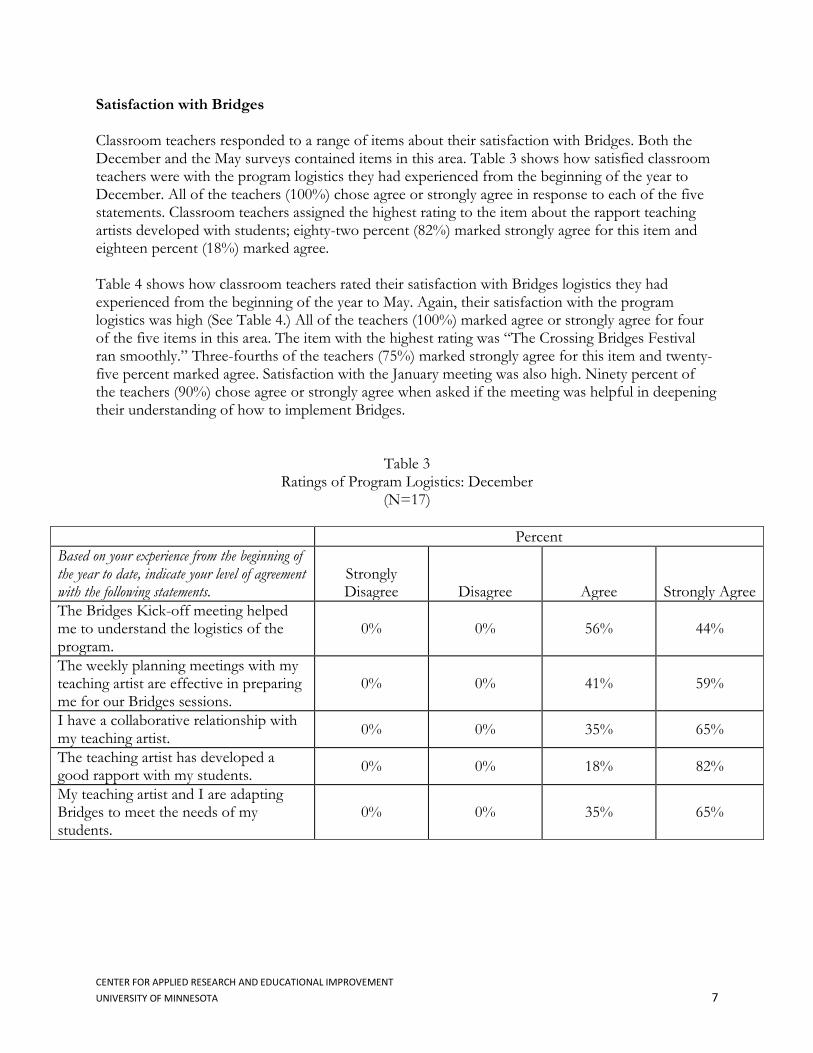
Satisfaction with Bridges Classroom teachers responded to a range of items about their satisfaction with Bridges. Both the December and the May surveys contained items in this area. Table 3 shows how satisfied classroom teachers were with the program logistics they had experienced from the beginning of the year to December. All of the teachers (100%) chose agree or strongly agree in response to each of the five statements. Classroom teachers assigned the highest rating to the item about the rapport teaching artists developed with students; eighty-two percent (82%) marked strongly agree for this item and eighteen percent (18%) marked agree. Table 4 shows how classroom teachers rated their satisfaction with Bridges logistics they had experienced from the beginning of the year to May. Again, their satisfaction with the program logistics was high (See Table 4.) All of the teachers (100%) marked agree or strongly agree for four of the five items in this area. The item with the highest rating was “The Crossing Bridges Festival ran smoothly.” Three-fourths of the teachers (75%) marked strongly agree for this item and twenty-five percent marked agree. Satisfaction with the January meeting was also high. Ninety percent of the teachers (90%) chose agree or strongly agree when asked if the meeting was helpful in deepening their understanding of how to implement Bridges.
Table 3 Ratings of Program Logistics: December
(N=17)
Percent
Based on your experience from the beginning of the year to date, indicate your level of agreement with the following statements.
Strongly Disagree Disagree Agree Strongly Agree
The Bridges Kick-off meeting helped me to understand the logistics of the program.
0% 0% 56% 44%
The weekly planning meetings with my teaching artist are effective in preparing me for our Bridges sessions.
0% 0% 41% 59%
I have a collaborative relationship with my teaching artist.
0% 0% 35% 65%
The teaching artist has developed a good rapport with my students.
0% 0% 18% 82%
My teaching artist and I are adapting Bridges to meet the needs of my students.
0% 0% 35% 65%
CENTER FOR APPLIED RESEARCH AND EDUCATIONAL IMPROVEMENT UNIVERSITY OF MINNESOTA 8
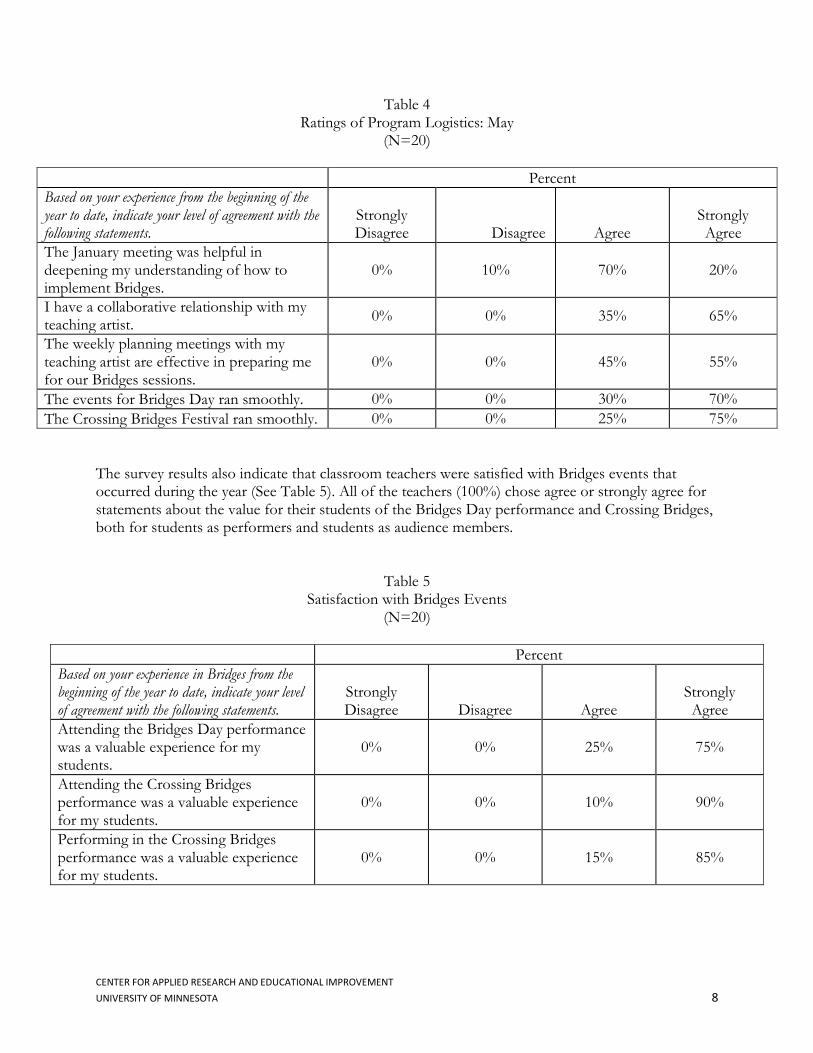
Table 4 Ratings of Program Logistics: May
(N=20)
Percent
Based on your experience from the beginning of the year to date, indicate your level of agreement with the following statements.
Strongly Disagree Disagree Agree
Strongly Agree
The January meeting was helpful in deepening my understanding of how to implement Bridges.
0% 10% 70% 20%
I have a collaborative relationship with my teaching artist.
0% 0% 35% 65%
The weekly planning meetings with my teaching artist are effective in preparing me for our Bridges sessions.
0% 0% 45% 55%
The events for Bridges Day ran smoothly. 0% 0% 30% 70%
The Crossing Bridges Festival ran smoothly. 0% 0% 25% 75%
The survey results also indicate that classroom teachers were satisfied with Bridges events that occurred during the year (See Table 5). All of the teachers (100%) chose agree or strongly agree for statements about the value for their students of the Bridges Day performance and Crossing Bridges, both for students as performers and students as audience members.
Table 5 Satisfaction with Bridges Events
(N=20)
Percent
Based on your experience in Bridges from the beginning of the year to date, indicate your level of agreement with the following statements.
Strongly Disagree Disagree Agree
Strongly Agree
Attending the Bridges Day performance was a valuable experience for my students.
0% 0% 25% 75%
Attending the Crossing Bridges performance was a valuable experience for my students.
0% 0% 10% 90%
Performing in the Crossing Bridges performance was a valuable experience for my students.
0% 0% 15% 85%
CENTER FOR APPLIED RESEARCH AND EDUCATIONAL IMPROVEMENT UNIVERSITY OF MINNESOTA 9
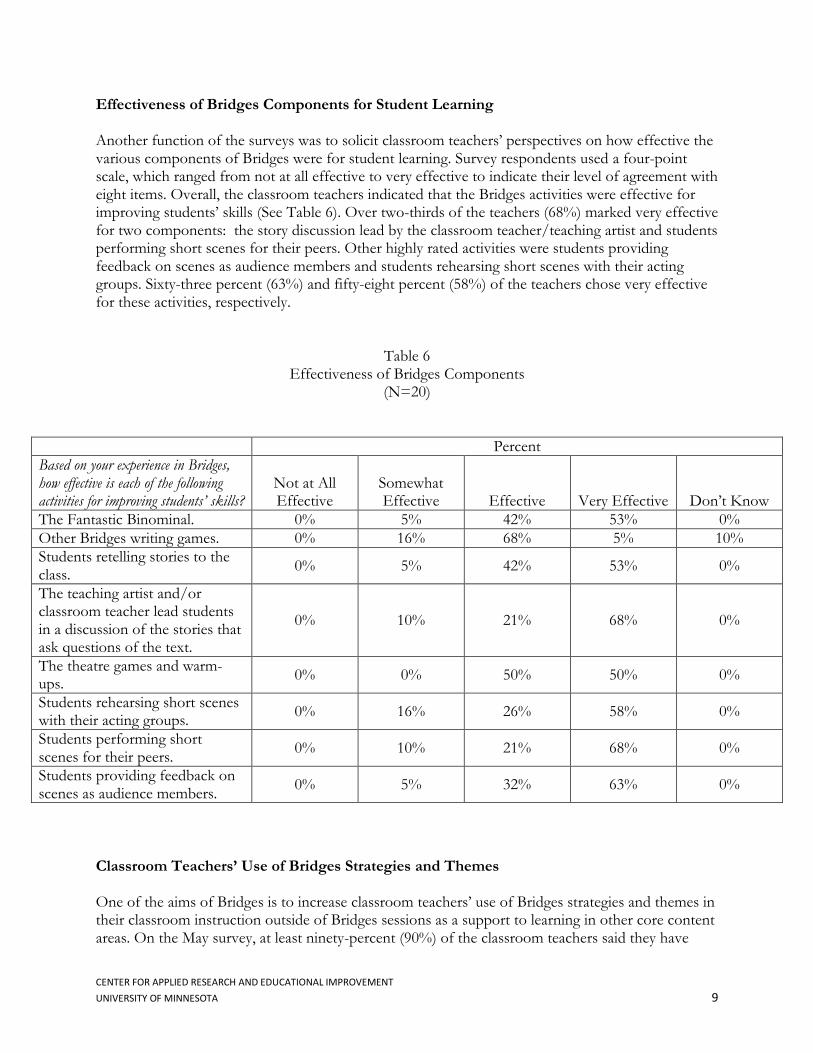
Effectiveness of Bridges Components for Student Learning Another function of the surveys was to solicit classroom teachers’ perspectives on how effective the various components of Bridges were for student learning. Survey respondents used a four-point scale, which ranged from not at all effective to very effective to indicate their level of agreement with eight items. Overall, the classroom teachers indicated that the Bridges activities were effective for improving students’ skills (See Table 6). Over two-thirds of the teachers (68%) marked very effective for two components: the story discussion lead by the classroom teacher/teaching artist and students performing short scenes for their peers. Other highly rated activities were students providing feedback on scenes as audience members and students rehearsing short scenes with their acting groups. Sixty-three percent (63%) and fifty-eight percent (58%) of the teachers chose very effective for these activities, respectively.
Table 6 Effectiveness of Bridges Components
(N=20)
Percent
Based on your experience in Bridges, how effective is each of the following activities for improving students’ skills?
Not at All Effective
Somewhat Effective Effective Very Effective Don’t Know
The Fantastic Binominal. 0% 5% 42% 53% 0%
Other Bridges writing games. 0% 16% 68% 5% 10%
Students retelling stories to the class.
0% 5% 42% 53% 0%
The teaching artist and/or classroom teacher lead students in a discussion of the stories that ask questions of the text.
0% 10% 21% 68% 0%
The theatre games and warm-ups.
0% 0% 50% 50% 0%
Students rehearsing short scenes with their acting groups.
0% 16% 26% 58% 0%
Students performing short scenes for their peers.
0% 10% 21% 68% 0%
Students providing feedback on scenes as audience members.
0% 5% 32% 63% 0%
Classroom Teachers’ Use of Bridges Strategies and Themes One of the aims of Bridges is to increase classroom teachers’ use of Bridges strategies and themes in their classroom instruction outside of Bridges sessions as a support to learning in other core content areas. On the May survey, at least ninety-percent (90%) of the classroom teachers said they have
CENTER FOR APPLIED RESEARCH AND EDUCATIONAL IMPROVEMENT UNIVERSITY OF MINNESOTA 10
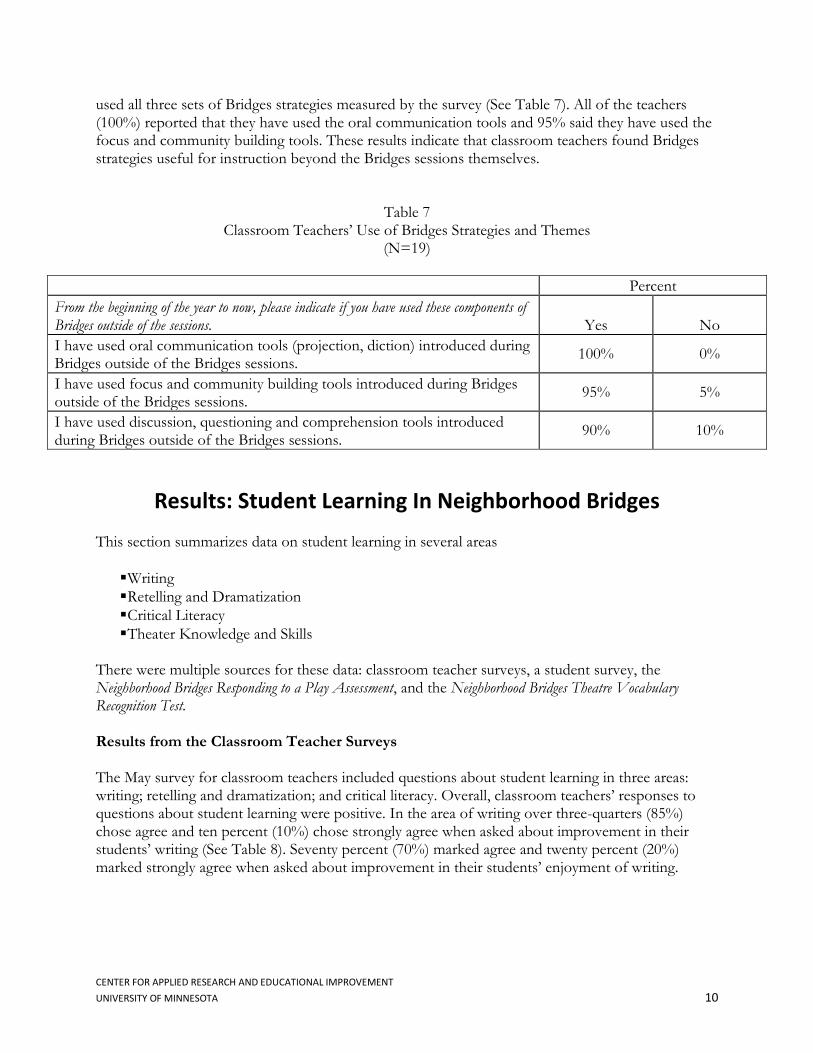
used all three sets of Bridges strategies measured by the survey (See Table 7). All of the teachers (100%) reported that they have used the oral communication tools and 95% said they have used the focus and community building tools. These results indicate that classroom teachers found Bridges strategies useful for instruction beyond the Bridges sessions themselves.
Table 7 Classroom Teachers’ Use of Bridges Strategies and Themes
(N=19)
Percent
From the beginning of the year to now, please indicate if you have used these components of Bridges outside of the sessions. Yes No
I have used oral communication tools (projection, diction) introduced during Bridges outside of the Bridges sessions.
100% 0%
I have used focus and community building tools introduced during Bridges outside of the Bridges sessions.
95% 5%
I have used discussion, questioning and comprehension tools introduced during Bridges outside of the Bridges sessions.
90% 10%
Results: Student Learning In Neighborhood Bridges This section summarizes data on student learning in several areas
Writing
Retelling and Dramatization
Critical Literacy
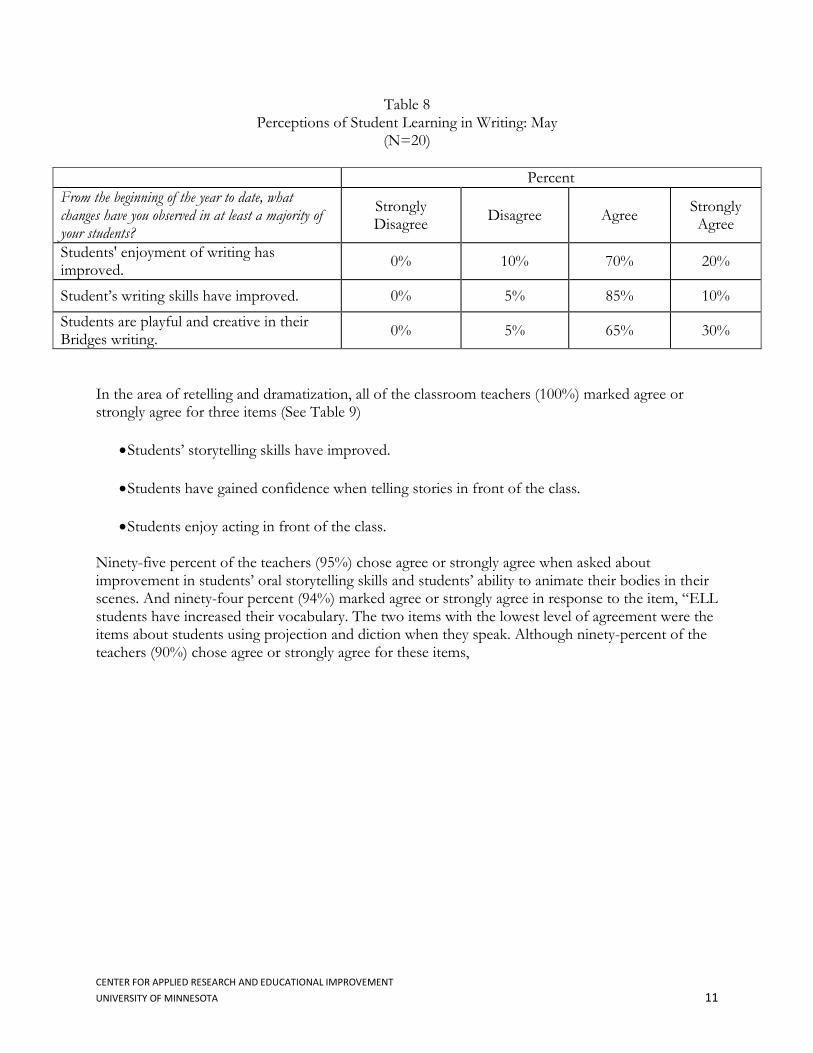
Theater Knowledge and Skills There were multiple sources for these data: classroom teacher surveys, a student survey, the Neighborhood Bridges Responding to a Play Assessment, and the Neighborhood Bridges Theatre Vocabulary Recognition Test. Results from the Classroom Teacher Surveys The May survey for classroom teachers included questions about student learning in three areas: writing; retelling and dramatization; and critical literacy. Overall, classroom teachers’ responses to questions about student learning were positive. In the area of writing over three-quarters (85%) chose agree and ten percent (10%) chose strongly agree when asked about improvement in their students’ writing (See Table 8). Seventy percent (70%) marked agree and twenty percent (20%) marked strongly agree when asked about improvement in their students’ enjoyment of writing.
CENTER FOR APPLIED RESEARCH AND EDUCATIONAL IMPROVEMENT UNIVERSITY OF MINNESOTA 11
Table 8 Perceptions of Student Learning in Writing: May
(N=20)
Percent
From the beginning of the year to date, what changes have you observed in at least a majority of your students?
Strongly Disagree
Disagree Agree Strongly Agree
Students' enjoyment of writing has improved.
0% 10% 70% 20%
Student’s writing skills have improved. 0% 5% 85% 10%
Students are playful and creative in their Bridges writing.
0% 5% 65% 30%
In the area of retelling and dramatization, all of the classroom teachers (100%) marked agree or strongly agree for three items (See Table 9)
Students’ storytelling skills have improved.
Students have gained confidence when telling stories in front of the class.
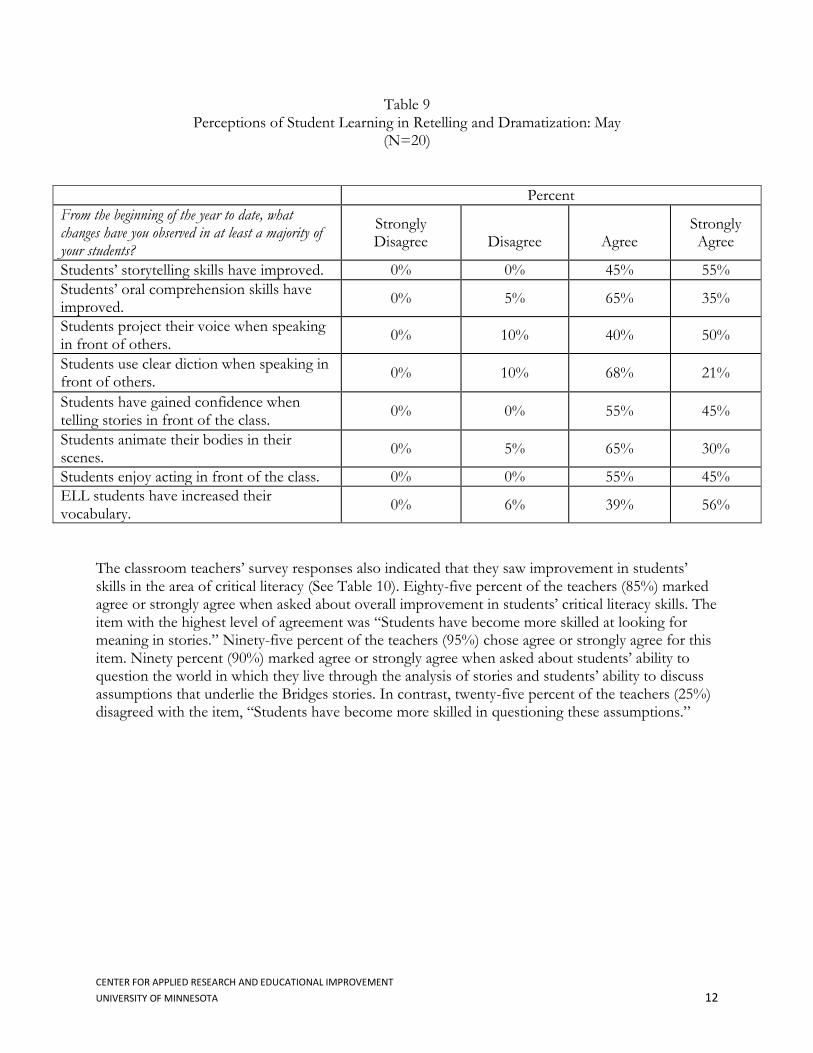
Students enjoy acting in front of the class. Ninety-five percent of the teachers (95%) chose agree or strongly agree when asked about improvement in students’ oral storytelling skills and students’ ability to animate their bodies in their scenes. And ninety-four percent (94%) marked agree or strongly agree in response to the item, “ELL students have increased their vocabulary. The two items with the lowest level of agreement were the items about students using projection and diction when they speak. Although ninety-percent of the teachers (90%) chose agree or strongly agree for these items,
CENTER FOR APPLIED RESEARCH AND EDUCATIONAL IMPROVEMENT UNIVERSITY OF MINNESOTA 12
Table 9 Perceptions of Student Learning in Retelling and Dramatization: May
(N=20)
Percent
From the beginning of the year to date, what changes have you observed in at least a majority of your students?
Strongly Disagree
Disagree
Agree
Strongly Agree
Students’ storytelling skills have improved. 0% 0% 45% 55%
Students’ oral comprehension skills have improved.
0% 5% 65% 35%
Students project their voice when speaking in front of others.
0% 10% 40% 50%
Students use clear diction when speaking in front of others.
0% 10% 68% 21%
Students have gained confidence when telling stories in front of the class.
0% 0% 55% 45%
Students animate their bodies in their scenes.
0% 5% 65% 30%
Students enjoy acting in front of the class. 0% 0% 55% 45%
ELL students have increased their vocabulary.
0% 6% 39% 56%
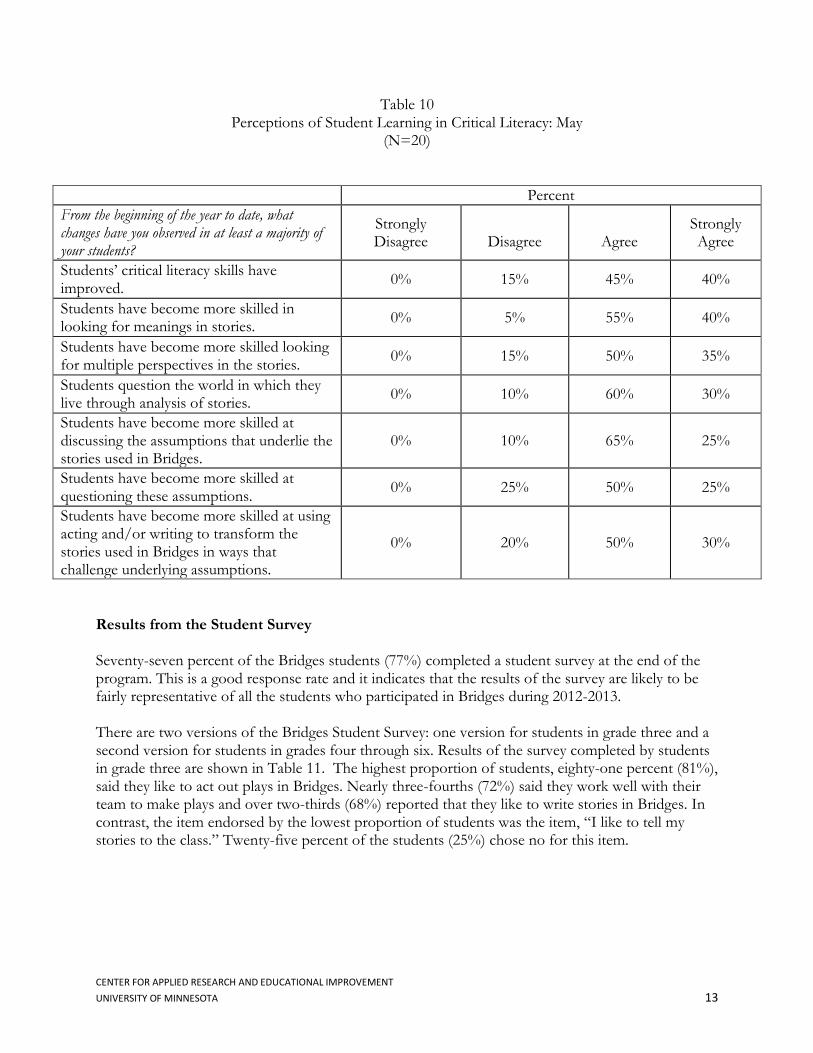
The classroom teachers’ survey responses also indicated that they saw improvement in students’ skills in the area of critical literacy (See Table 10). Eighty-five percent of the teachers (85%) marked agree or strongly agree when asked about overall improvement in students’ critical literacy skills. The item with the highest level of agreement was “Students have become more skilled at looking for meaning in stories.” Ninety-five percent of the teachers (95%) chose agree or strongly agree for this item. Ninety percent (90%) marked agree or strongly agree when asked about students’ ability to question the world in which they live through the analysis of stories and students’ ability to discuss assumptions that underlie the Bridges stories. In contrast, twenty-five percent of the teachers (25%) disagreed with the item, “Students have become more skilled in questioning these assumptions.”
CENTER FOR APPLIED RESEARCH AND EDUCATIONAL IMPROVEMENT UNIVERSITY OF MINNESOTA 13
Table 10 Perceptions of Student Learning in Critical Literacy: May
(N=20)
Percent
From the beginning of the year to date, what changes have you observed in at least a majority of your students?
Strongly Disagree
Disagree
Agree
Strongly Agree
Students’ critical literacy skills have improved.
0% 15% 45% 40%
Students have become more skilled in looking for meanings in stories.
0% 5% 55% 40%
Students have become more skilled looking for multiple perspectives in the stories.
0% 15% 50% 35%
Students question the world in which they live through analysis of stories.
0% 10% 60% 30%
Students have become more skilled at discussing the assumptions that underlie the stories used in Bridges.
0% 10% 65% 25%
Students have become more skilled at questioning these assumptions.
0% 25% 50% 25%
Students have become more skilled at using acting and/or writing to transform the stories used in Bridges in ways that challenge underlying assumptions.
0% 20% 50% 30%
Results from the Student Survey
Seventy-seven percent of the Bridges students (77%) completed a student survey at the end of the program. This is a good response rate and it indicates that the results of the survey are likely to be fairly representative of all the students who participated in Bridges during 2012-2013. There are two versions of the Bridges Student Survey: one version for students in grade three and a second version for students in grades four through six. Results of the survey completed by students in grade three are shown in Table 11. The highest proportion of students, eighty-one percent (81%), said they like to act out plays in Bridges. Nearly three-fourths (72%) said they work well with their team to make plays and over two-thirds (68%) reported that they like to write stories in Bridges. In contrast, the item endorsed by the lowest proportion of students was the item, “I like to tell my stories to the class.” Twenty-five percent of the students (25%) chose no for this item.

CENTER FOR APPLIED RESEARCH AND EDUCATIONAL IMPROVEMENT UNIVERSITY OF MINNESOTA 14
Table 11 Students’ Reflections on their Learning: Grade Three
(N=168)
Percent of Students
No
Maybe
Yes
I am a better writer. 5% 34% 61%
I add details to my stories when I write. 4% 42% 53%
I describe the setting (where my stories take place) when I write stories.
11% 38% 51%
I describe characters when I write stories.
11% 31% 57%
My words can create pictures in people’s minds.
5% 34% 60%
I like to tell my stories to my class. 25% 25% 51%
I like to write stories in Neighborhood Bridges.
10% 22% 68%
I like to act out plays in Neighborhood Bridges.
5% 14% 81%
I work well with my team to make plays. 5% 23% 72%
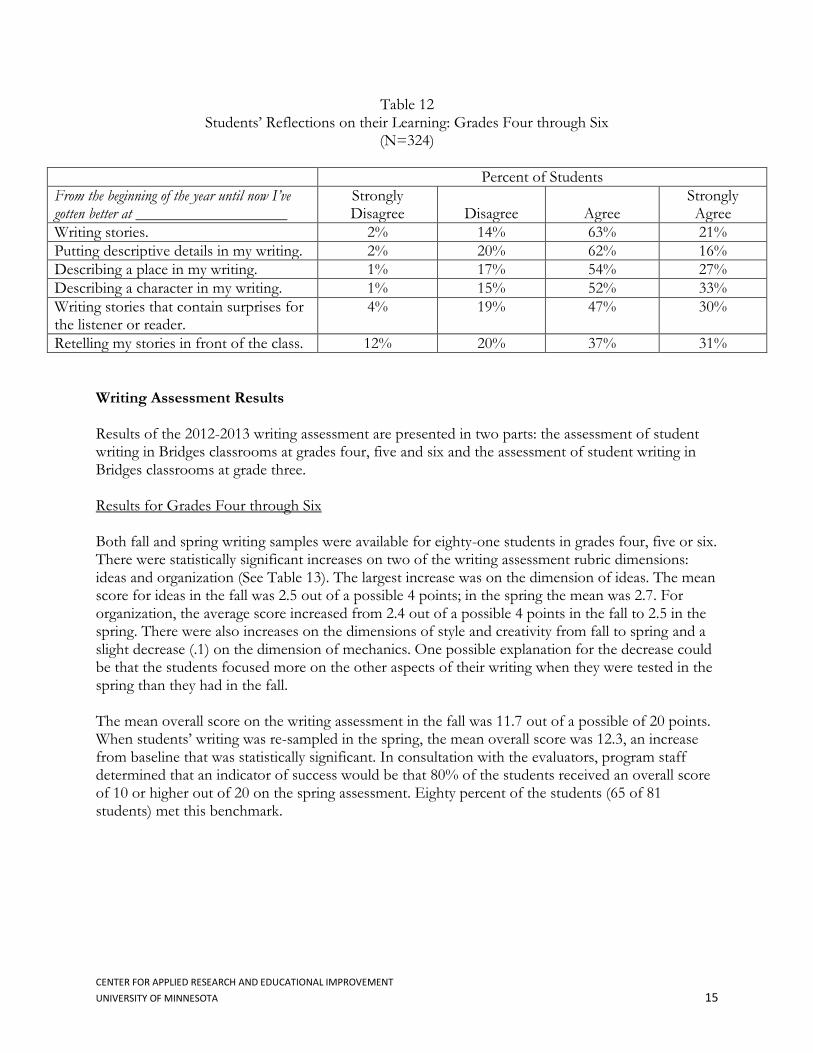
Table 12 shows the results of the survey completed by Bridges students in grades four through six. The students were most likely to agree that their skills in writing stories and describing a character in their writing had improved since the beginning of the year. Eighty-four percent of the students (84%) chose agree or strongly agree for these two items. Students also said they had gotten better at describing a place in their writing since the beginning of the year. Eighty-two percent of the students (82%) marked agree or strongly agree for this item. The students were least likely to agree that their skills had improved in retelling their stories in front of the class. Although sixty-eight percent marked agree or strongly agree for this item, almost one-third (32%) chose disagree or strongly disagree.
CENTER FOR APPLIED RESEARCH AND EDUCATIONAL IMPROVEMENT UNIVERSITY OF MINNESOTA 15
Table 12 Students’ Reflections on their Learning: Grades Four through Six
(N=324)
Percent of Students
From the beginning of the year until now I’ve gotten better at ___________________
Strongly Disagree
Disagree
Agree
Strongly Agree
Writing stories. 2% 14% 63% 21%
Putting descriptive details in my writing. 2% 20% 62% 16%
Describing a place in my writing. 1% 17% 54% 27%
Describing a character in my writing. 1% 15% 52% 33%
Writing stories that contain surprises for the listener or reader.
4% 19% 47% 30%
Retelling my stories in front of the class. 12% 20% 37% 31%
Writing Assessment Results Results of the 2012-2013 writing assessment are presented in two parts: the assessment of student writing in Bridges classrooms at grades four, five and six and the assessment of student writing in Bridges classrooms at grade three. Results for Grades Four through Six Both fall and spring writing samples were available for eighty-one students in grades four, five or six. There were statistically significant increases on two of the writing assessment rubric dimensions: ideas and organization (See Table 13). The largest increase was on the dimension of ideas. The mean score for ideas in the fall was 2.5 out of a possible 4 points; in the spring the mean was 2.7. For organization, the average score increased from 2.4 out of a possible 4 points in the fall to 2.5 in the spring. There were also increases on the dimensions of style and creativity from fall to spring and a slight decrease (.1) on the dimension of mechanics. One possible explanation for the decrease could be that the students focused more on the other aspects of their writing when they were tested in the spring than they had in the fall. The mean overall score on the writing assessment in the fall was 11.7 out of a possible of 20 points. When students’ writing was re-sampled in the spring, the mean overall score was 12.3, an increase from baseline that was statistically significant. In consultation with the evaluators, program staff determined that an indicator of success would be that 80% of the students received an overall score of 10 or higher out of 20 on the spring assessment. Eighty percent of the students (65 of 81 students) met this benchmark.

CENTER FOR APPLIED RESEARCH AND EDUCATIONAL IMPROVEMENT UNIVERSITY OF MINNESOTA 16
Table 13 Writing Assessment Grades Four through Six:
Rubric Dimensions (N=81)
Fall Mean Spring Mean
Ideas** 2.5 2.7
Organization* 2.4 2.5
Style 2.3 2.4
Mechanics 2.3 2.2
Creativity 2.3 2.4
Overall Score* 11.7 12.3 *The change from fall to spring was statistically significant at p<.10 on a matched-pairs t-test. **The change from fall to spring was statistically significant at p < .05 on a matched-pairs t-test.
Figure 1 Writing Assessment Grades Four through Six: Rubric Dimensions
CENTER FOR APPLIED RESEARCH AND EDUCATIONAL IMPROVEMENT UNIVERSITY OF MINNESOTA 17
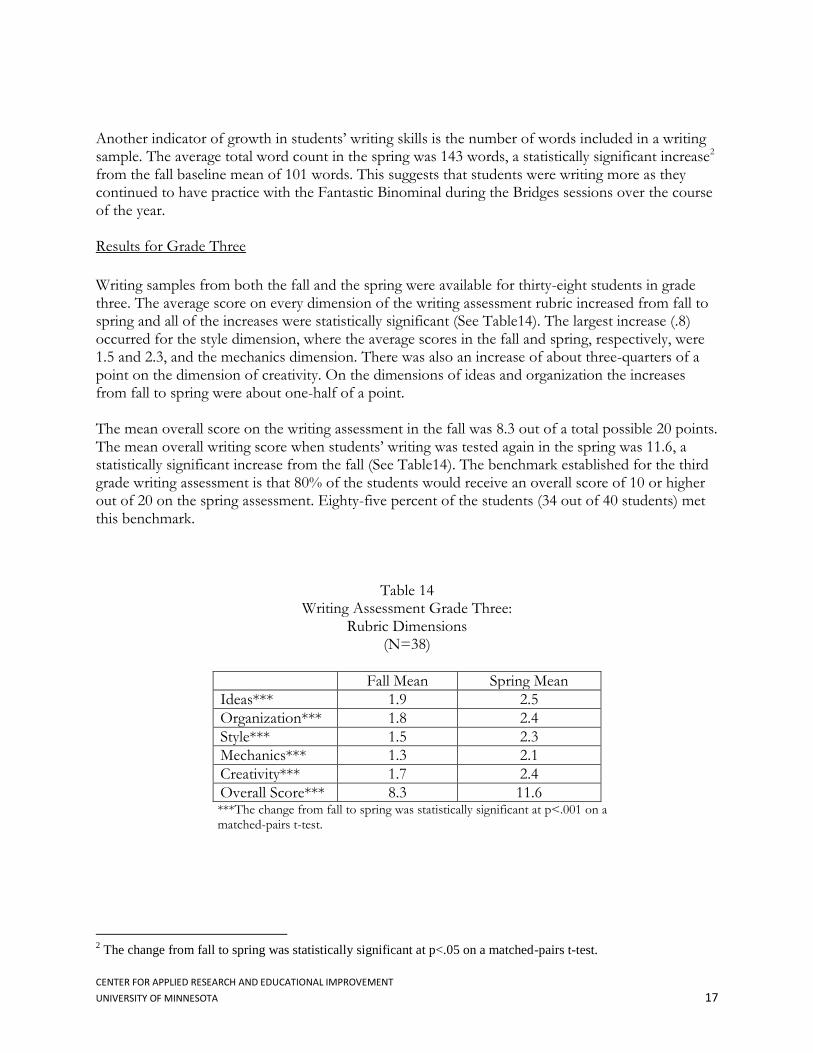
Another indicator of growth in students’ writing skills is the number of words included in a writing sample. The average total word count in the spring was 143 words, a statistically significant increase2 from the fall baseline mean of 101 words. This suggests that students were writing more as they continued to have practice with the Fantastic Binominal during the Bridges sessions over the course of the year. Results for Grade Three
Writing samples from both the fall and the spring were available for thirty-eight students in grade three. The average score on every dimension of the writing assessment rubric increased from fall to spring and all of the increases were statistically significant (See Table14). The largest increase (.8) occurred for the style dimension, where the average scores in the fall and spring, respectively, were 1.5 and 2.3, and the mechanics dimension. There was also an increase of about three-quarters of a point on the dimension of creativity. On the dimensions of ideas and organization the increases from fall to spring were about one-half of a point. The mean overall score on the writing assessment in the fall was 8.3 out of a total possible 20 points. The mean overall writing score when students’ writing was tested again in the spring was 11.6, a statistically significant increase from the fall (See Table14). The benchmark established for the third grade writing assessment is that 80% of the students would receive an overall score of 10 or higher out of 20 on the spring assessment. Eighty-five percent of the students (34 out of 40 students) met this benchmark.
Table 14 Writing Assessment Grade Three:
Rubric Dimensions (N=38)
Fall Mean Spring Mean
Ideas*** 1.9 2.5
Organization*** 1.8 2.4
Style*** 1.5 2.3
Mechanics*** 1.3 2.1
Creativity*** 1.7 2.4
Overall Score*** 8.3 11.6 ***The change from fall to spring was statistically significant at p<.001 on a matched-pairs t-test.
2 The change from fall to spring was statistically significant at p<.05 on a matched-pairs t-test.

CENTER FOR APPLIED RESEARCH AND EDUCATIONAL IMPROVEMENT UNIVERSITY OF MINNESOTA 18
Figure 2 Writing Assessment Grade Three: Rubric Dimensions
The mean total word count in the spring was 94 words, an increase from the fall baseline mean of 62 words, which is a statistically significant3 increase. This result indicates that students were writing more as they continued to have practice with the Fantastic Binominal during the Bridges sessions over the course of the year. Responding to a Play Assessment Results The Neighborhood Bridges Responding to a Play Assessment was designed to measure students’ ability to use theatre arts concepts and vocabulary to respond to a theatre performance. In February 2013, Bridges students attended a performance of Jackie and Me at CTC. Students then completed the assessment worksheet when they returned to their classrooms.
3 The change from fall to spring was statistically significant at p<.001 on a matched-pairs t-test.
CENTER FOR APPLIED RESEARCH AND EDUCATIONAL IMPROVEMENT UNIVERSITY OF MINNESOTA 19
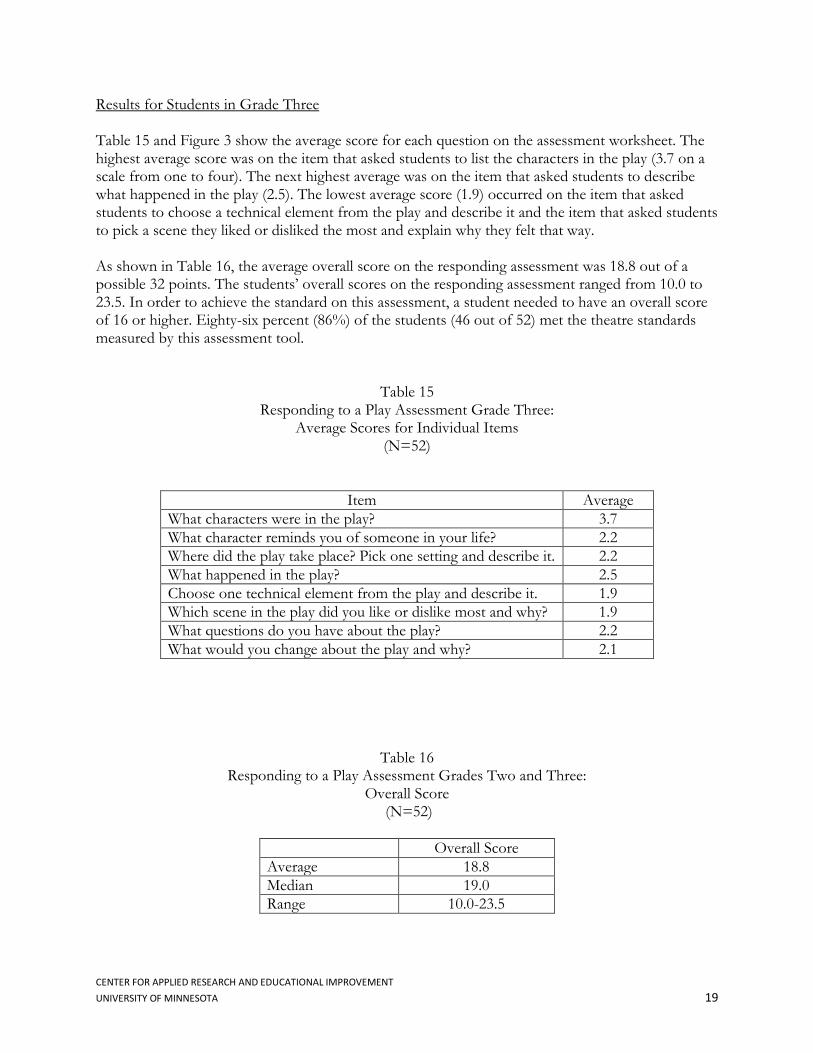
Results for Students in Grade Three Table 15 and Figure 3 show the average score for each question on the assessment worksheet. The highest average score was on the item that asked students to list the characters in the play (3.7 on a scale from one to four). The next highest average was on the item that asked students to describe what happened in the play (2.5). The lowest average score (1.9) occurred on the item that asked students to choose a technical element from the play and describe it and the item that asked students to pick a scene they liked or disliked the most and explain why they felt that way. As shown in Table 16, the average overall score on the responding assessment was 18.8 out of a possible 32 points. The students’ overall scores on the responding assessment ranged from 10.0 to 23.5. In order to achieve the standard on this assessment, a student needed to have an overall score of 16 or higher. Eighty-six percent (86%) of the students (46 out of 52) met the theatre standards measured by this assessment tool.
Table 15
Responding to a Play Assessment Grade Three: Average Scores for Individual Items
(N=52)
Item Average
What characters were in the play? 3.7
What character reminds you of someone in your life? 2.2
Where did the play take place? Pick one setting and describe it. 2.2
What happened in the play? 2.5
Choose one technical element from the play and describe it. 1.9
Which scene in the play did you like or dislike most and why? 1.9
What questions do you have about the play? 2.2
What would you change about the play and why? 2.1
Table 16 Responding to a Play Assessment Grades Two and Three:
Overall Score (N=52)
Overall Score
Average 18.8
Median 19.0
Range 10.0-23.5

CENTER FOR APPLIED RESEARCH AND EDUCATIONAL IMPROVEMENT UNIVERSITY OF MINNESOTA 20
Figure 3 Responding to a Play Assessment Grades Two and Three:
Average Scores for Individual Items
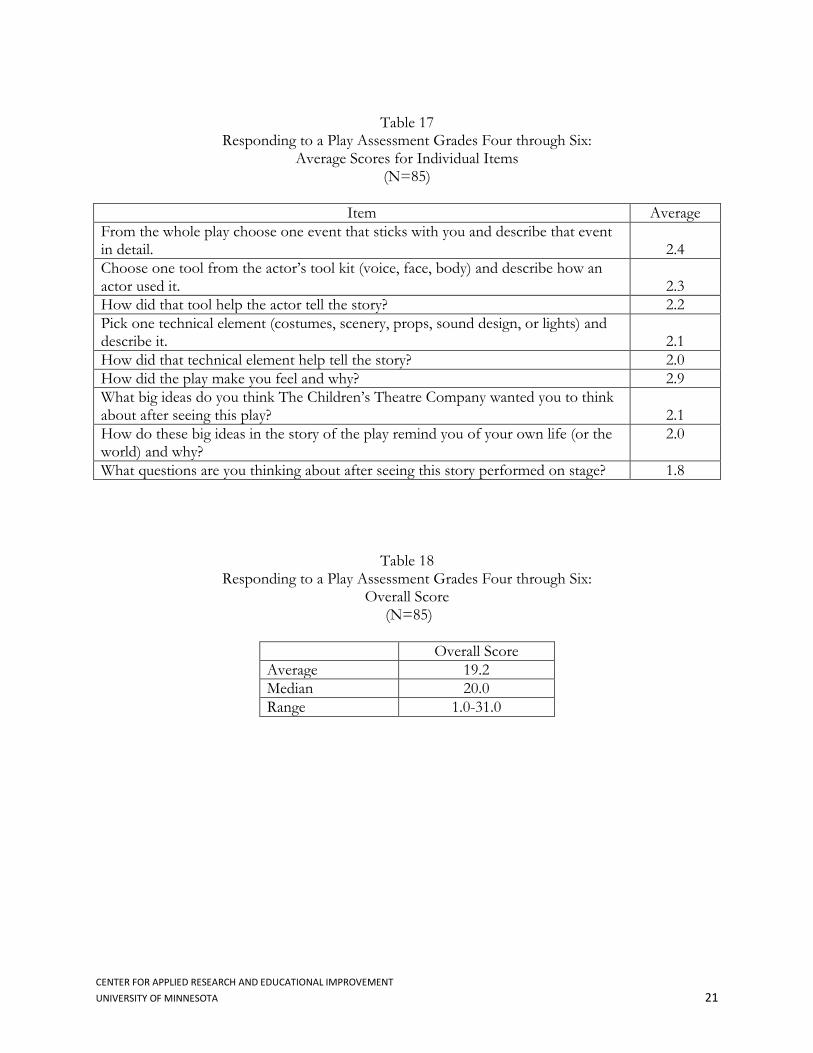
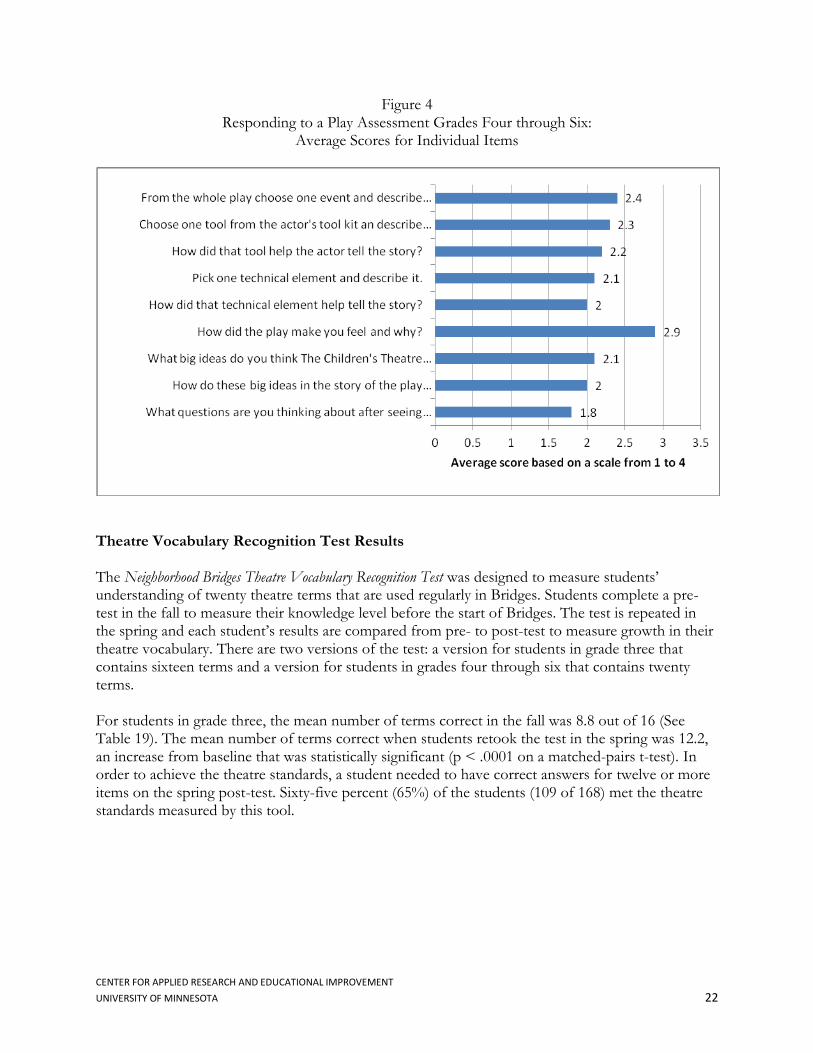
Results for Students in Grades Four through Six Table 17 and Figure 4 show the average score for each item on the responding to a play assessment worksheet for students in grades four through six. The average scores ranged from 1.8 to 2.9. The highest average score was on the item that asked students to describe how they play made they feel and explain why it made them feel that way. The lowest average score (1.8) occurred on the item that asked students what questions they were thinking about after seeing the story performed on stage. As shown in Table 18, the average overall score on the responding assessment was 19.2 out of a possible 36 points. The students’ overall scores on the responding assessment ranged from 1.0 to 31.0. In order to achieve the standard set by program staff in consultation with the evaluator, a student needed to have an overall score of 18 or higher. Sixty-seven percent (67%) of the students (57 of 85) met the theatre standards measured by this assessment tool.
CENTER FOR APPLIED RESEARCH AND EDUCATIONAL IMPROVEMENT UNIVERSITY OF MINNESOTA 21
Table 17
Responding to a Play Assessment Grades Four through Six: Average Scores for Individual Items
(N=85)
Item Average
From the whole play choose one event that sticks with you and describe that event in detail.
2.4
Choose one tool from the actor’s tool kit (voice, face, body) and describe how an actor used it.
2.3
How did that tool help the actor tell the story? 2.2
Pick one technical element (costumes, scenery, props, sound design, or lights) and describe it.
2.1
How did that technical element help tell the story? 2.0
How did the play make you feel and why? 2.9
What big ideas do you think The Children’s Theatre Company wanted you to think about after seeing this play?
2.1
How do these big ideas in the story of the play remind you of your own life (or the world) and why?
2.0
What questions are you thinking about after seeing this story performed on stage? 1.8
Table 18 Responding to a Play Assessment Grades Four through Six:
Overall Score (N=85)
Overall Score
Average 19.2
Median 20.0
Range 1.0-31.0
CENTER FOR APPLIED RESEARCH AND EDUCATIONAL IMPROVEMENT UNIVERSITY OF MINNESOTA 22
Figure 4 Responding to a Play Assessment Grades Four through Six:
Average Scores for Individual Items
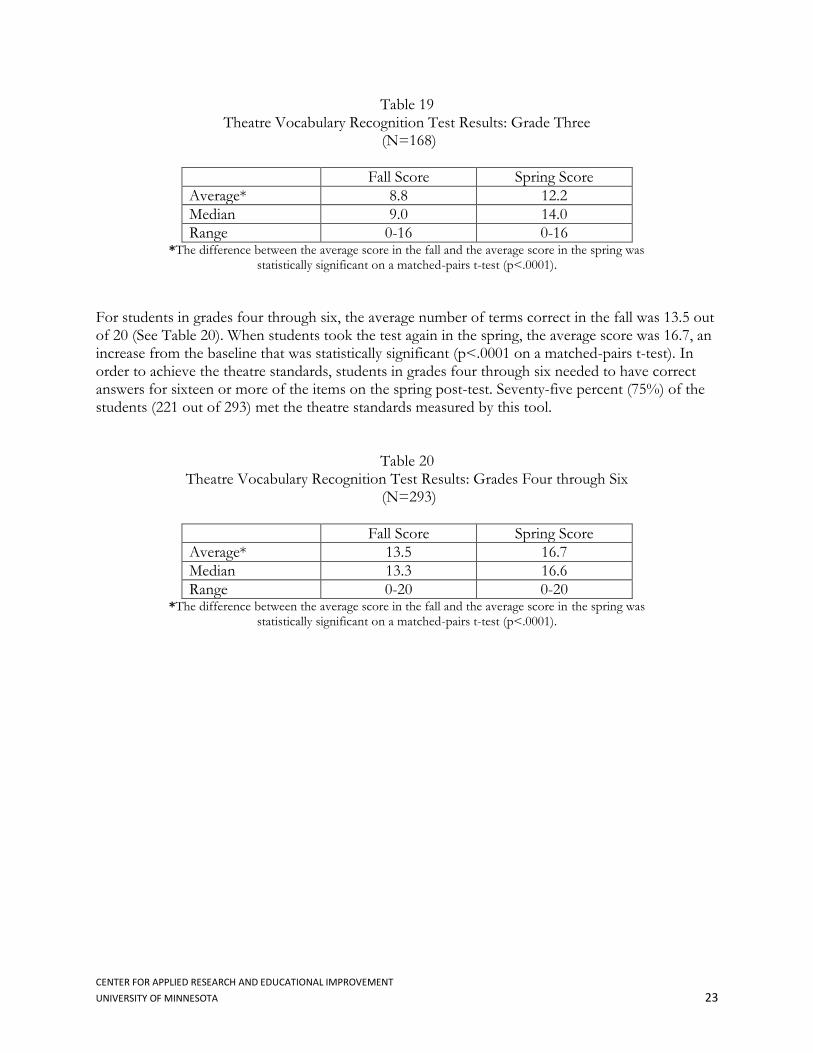
Theatre Vocabulary Recognition Test Results The Neighborhood Bridges Theatre Vocabulary Recognition Test was designed to measure students’ understanding of twenty theatre terms that are used regularly in Bridges. Students complete a pre-test in the fall to measure their knowledge level before the start of Bridges. The test is repeated in the spring and each student’s results are compared from pre- to post-test to measure growth in their theatre vocabulary. There are two versions of the test: a version for students in grade three that contains sixteen terms and a version for students in grades four through six that contains twenty terms. For students in grade three, the mean number of terms correct in the fall was 8.8 out of 16 (See Table 19). The mean number of terms correct when students retook the test in the spring was 12.2, an increase from baseline that was statistically significant (p < .0001 on a matched-pairs t-test). In order to achieve the theatre standards, a student needed to have correct answers for twelve or more items on the spring post-test. Sixty-five percent (65%) of the students (109 of 168) met the theatre standards measured by this tool.
CENTER FOR APPLIED RESEARCH AND EDUCATIONAL IMPROVEMENT UNIVERSITY OF MINNESOTA 23
Table 19 Theatre Vocabulary Recognition Test Results: Grade Three
(N=168)
Fall Score Spring Score
Average* 8.8 12.2
Median 9.0 14.0
Range 0-16 0-16 *The difference between the average score in the fall and the average score in the spring was
statistically significant on a matched-pairs t-test (p<.0001).
For students in grades four through six, the average number of terms correct in the fall was 13.5 out of 20 (See Table 20). When students took the test again in the spring, the average score was 16.7, an increase from the baseline that was statistically significant (p<.0001 on a matched-pairs t-test). In order to achieve the theatre standards, students in grades four through six needed to have correct answers for sixteen or more of the items on the spring post-test. Seventy-five percent (75%) of the students (221 out of 293) met the theatre standards measured by this tool.
Table 20 Theatre Vocabulary Recognition Test Results: Grades Four through Six
(N=293)
Fall Score Spring Score
Average* 13.5 16.7
Median 13.3 16.6
Range 0-20 0-20 *The difference between the average score in the fall and the average score in the spring was
statistically significant on a matched-pairs t-test (p<.0001).
CENTER FOR APPLIED RESEARCH AND EDUCATIONAL IMPROVEMENT UNIVERSITY OF MINNESOTA 24
Summary and Discussion The purpose of the evaluation was to measure the quality of Bridges implementation and assess student learning in the areas of writing; theatre; retelling and dramatization; and critical literacy. This section of the report highlights the results in each area of the study and discusses the study’s implications for further program development and evaluation. Implementation of Bridges Data from surveys of classroom teachers indicate that Bridges was implemented very well in the twenty-three classrooms that participated in the program during 2012-2013. For example, classroom teachers were satisfied with Bridges events, such as the Crossing Bridges Festival, and the logistics of carrying out the program. For example, in May all of the classroom teachers (100%) marked agree or strongly agree in response to statements such as
“I have a collaborative relationship with my teaching artist” “The weekly planning meetings with my teaching artist are effective in preparing me for our Bridges sessions.” “Attending the Bridges Day performance was a valuable experience for my students.” “Performing in the Crossing Bridges Festival was a valuable experience for my students.”
The classroom teachers also indicated that the Bridges curriculum components were effective in improving students’ skills. For example, all of the classroom teachers (100%) marked effective or very effective when asked how effective the theatre games and warm-ups and story discussions were for building students’ skills. Ninety-five percent (95%) marked effective or very effective when asked how effective it was for students to retell their stories to the class and for students to provide feedback on scenes as audience members. In addition, Bridges classroom teachers reported that the Bridges strategies were useful for instruction beyond the Bridges sessions themselves. All of the teachers (100%) reported that they had used Bridges oral communication tools outside of Bridges sessions. Ninety-five percent (95%) and ninety percent (90%) said they had used the focus and community building tools and the discussion, questioning, and comprehension tools, respectively. Although the survey data indicate that Bridges was implemented very well during the past year, to further strengthen the program CTC staff may want to examine program aspects that classroom teachers rated low relative to other aspects of the program. For example, ten percent (10%) of the classroom teachers marked disagree for the item, “The January meeting was helpful in deepening my understanding of how to implement Bridges.” Sixteen percent (16%) of the teachers marked somewhat effective for other Bridges writing games and sixteen percent (16%) marked somewhat effective for students rehearsing short scenes with their peers. CTC staff and the researchers could look more closely at the survey data to determine if the effectiveness of these Bridges components varied by the grade level of students or perhaps the number of years that a classroom teacher has

CENTER FOR APPLIED RESEARCH AND EDUCATIONAL IMPROVEMENT UNIVERSITY OF MINNESOTA 25
been involved in Bridges. The data may indicate that targeted professional development or coaching for classroom teachers related to these areas of the program would be useful. Student Learning in Writing Information from the classroom teacher and student surveys, along with information from the Neighborhood Bridges Writing Assessment indicate that students’ writing skills improved during their participation in Bridges. For example, on the May survey ninety-five percent (95%) of the classroom teachers marked agree or strongly agree for the statement, “Students’ writing skills have improved.” Ninety percent of the teachers (90%) reported that students’ enjoyment of writing had improved. Students also reported that their writing skills had improved since the fall. Eighty-four percent (84%) of the students in grades four through six chose a response of agree or strongly agree for the survey item, “From the beginning of the year until now I’ve gotten better at writing stories.” In addition, ninety-two percent (61%) of the students in grade three marked yes when asked if they were a better writer. The writing assessment measures student’s skills in five areas: ideas, organization, style, mechanics, and creativity, along with a count of the number of words each student has written. On the grade three writing assessment there were statistically significant increases from fall to spring on each of the five dimensions. The overall score increased from an average of 8.3 points to an average of 11.6 points (out of a total possible twenty points). This change was also statistically significant. Eighty-five percent of the third grade students met the benchmark by having an overall score of ten points or higher on the spring writing assessment. Students in grades four through six showed a statistically significant increase from fall to spring on the writing dimension of ideas and the dimension of organization. The overall score increased from an average of 11.7 points in the fall to an average of 12.3 points in the spring, a statistically significant difference. Eighty percent of the students in grades four through six met the benchmark established for the writing assessment. Students’ Knowledge and Skills in Theatre The evaluation data provide multiple forms of evidence to indicate that students’ knowledge and skills in theatre increase during the course of their participation in Bridges. Results from the classroom teacher survey indicate that teachers noticed increases in at least a majority of their students’ theatre skills over the course of the year. At least ninety percent (90%) of the classroom teachers marked agree or strongly agree when asked about improvements in the seven skills which make up the learning area of retelling and dramatization on the May survey. Examples of these skills are students’ ability to use clear diction when speaking in front of others and students’ ability to animate their bodies in the scenes they perform in Bridges. On the student survey, the students also reported growth in their theatre skills. Almost three-fourths (72%) of the third grade students responded yes to the statement, “I work well with my team to make plays.” Sixty-eight percent (68%) of the students in grades four through six reported that their skills in retelling a story in front of the class had improved. The Neighborhood Bridges Responding to a Play Assessment measures students’ ability to use theatre arts vocabulary and concepts to respond to a theatre performance. Data from this assessment show that
CENTER FOR APPLIED RESEARCH AND EDUCATIONAL IMPROVEMENT UNIVERSITY OF MINNESOTA 26
Bridges students were successful in preparing a response to the performance of Jackie and Me that they attended at CTC. The average overall score for third grade students was 18.8 (out of a total possible thirty-two points). Eighty-six percent of the students (86%) in grade three met the benchmark of sixteen points or higher on the responding assessment. The average overall score on the responding assessment for students in grades four through six was 19.2 (out of a total possible thirty-six points) Sixty-seven percent (67%) of the students in grades four through six met the benchmark score of eighteen points or higher. On the Neighborhood Bridges Theatre Vocabulary Recognition Test, students in grades three through six showed a statistically significant increase from fall to spring in the number of terms they identified correctly. In addition, sixty-five percent (65%) of the students in grade three met the benchmark set for their spring post-test and seventy-five percent (75%) of the students in grades four through six met the benchmark set for their spring post-test.4 Students’ Skills in Critical Literacy The May survey asked classroom teachers whether they had seen changes in their students’ critical literacy skills during their participation in Bridges and their survey responses indicate that students developed skills in this area. Eighty-five percent (85%) of the teachers chose agree or strongly agree in response to the statement, “Students’ critical literacy skills have increased” and fifteen percent (15%) marked disagree. Among the six specific critical literacy skills listed on the survey, the highest proportion of classroom teachers (95%) marked agree or strongly agree for the item, “Students have become more skilled in looking for meaning in stories.” In addition, ninety percent (90%) of the teachers chose agree or strongly agree in response to the item, “Students question the world in which they live through analysis of stories” and the item, “Students have become more skilled at discussing the assumptions that underlie the stories used in Bridges.” In closing, as a whole, the results of the evaluation study indicate that Bridges was implemented successfully in twenty-three classrooms of students in grades three through six during the 2012-2013 school year. Data from surveys of classroom teachers and students who participated in Bridges along with data from assessment tools administered by the researchers provide evidence of what students learned during their participation in Bridges. Students increased their skills in writing, their knowledge and skills in theatre, and their knowledge in the areas of critical literacy and retelling and dramatization.
4 There are two versions of the vocabulary test: one for students in grade three and one for students in grades four
through six.