Embed Size (px)
Citation preview
NATIONAL CENTER FOR EDUCATION STATISTICS
Technical Report March 1997
NELS:88 Survey Item Evaluation Report
U.S. Department of EducationOffice of Educational Research and Improvement NCES 97-052

NATIONAL CENTER FOR EDUCATION STATISTICS
Technical Report March 1997
NELS:88 Survey Item Evaluation Report
Donald H. McLaughlinJon CohenAmerican Institutes for Research
Ralph Lee, Project OfficerNational Center for Education Statistics
U.S. Department of EducationOffice of Educational Research and Improvement NCES 97-052
U.S. Department of EducationRichard W. RileySecretary
Office of Educational Research and ImprovementMarshall S. SmithActing Assistant Secretary
National Center for Education StatisticsPascal D. Forgione, Jr.Commissioner
Data Development and Longitudinal Studies GroupMary J. FraseActing Associate Commissioner
Longitudinal Studies ProgramJeffrey A. OwingsProgram Director
The National Center for Education Statistics (NCES) is the primary federal entity for collecting, analyzing, andreporting data related to education in the United States and other nations. It fulfills a congressional mandate tocollect, collate, analyze, and report full and complete statistics on the condition of education in the UnitedStates; conduct and publish reports and specialized analyses of the meaning and significance of such statistics;assist state and local education agencies in improving their statistical systems; and review and report oneducation activities in foreign countries.
NCES activities are designed to address high priority education data needs; provide consistent, reliable,complete, and accurate indicators of education status and trends; and report timely, useful, and high quality datato the U.S. Department of Education, the Congress, the states, other education policymakers, practitioners, datausers, and the general public.
We strive to make our products available in a variety of formats and in language that is appropriate to a varietyof audiences. You, as our customer, are the best judge of our success in communicating information effectively.If you have any comments or suggestions about this or any other NCES product or report, we would like tohear from you. Please direct your comments to:
National Center for Education StatisticsOffice of Educational Research and ImprovementU.S. Department of Education555 New Jersey Avenue, NWWashington, DC 20208-5574
March 1997
Contact:Ralph Lee (202) 219-1732
For sale by the U.S. Government Printing OfficeSuperintendent of Documents, Mail Stop: SSOP, Washington, DC 20402-9328
ISBN ???????
iii
Acknowledgments
This report grew from the need for documentation of the quality of the follow-up data collectedby the National Educational Longitudinal Study of 1988 (NELS:88). Although previous reports ondata quality have focused on the reliability and validity of responses and on errors in measurement,NELS:88 offers a uniquely rich crosswalk of items asked of different sources and at different times.Because of this, it is possible to use the relations among measures to identify survey factors, such assubjectivity of ratings, that affect the convergence of meanings of teenagers’ responses. Thus, thisreport is not so much a report of which items have greatest errors in measurement as it is a report ofwhich items are most sensitive to changes in the source of the information.
Many people contributed to this report. Mary Anne Arcilla, data librarian for the AmericanInstitutes for Research, compiled and maintained the data files, manuals, and references needed forthe study. Ixtlac Duenas prepared the item crosswalk that became the basis for selecting the 188item-pairs to be studied. Grace Wu prepared (and as the authors became ever more familiar with theNELS:88 database) repeatedly revised tables and figures and inserted Student’s t-test valuesthroughout the text as needed.
At NCES, Ralph Lee and Jeffrey Owings saw the need for this report and provided guidance andfeedback as the report evolved to its present state. The authors gratefully acknowledge theirfeedback, as well as the helpful feedback of reviewers both within and outside NCES, including EllenBradburn, Robert Burton, Mary Frase, Phil Kaufman, Tim Madigan, Richard Snow, and Shi-ChangWu.
Finally, this report would not have been possible without the contributions of the manyresearchers who contributed to the creation of the NELS:88 database and of the tens of thousandsof students, parents, and teachers who took time to complete the multiple waves of the survey. Wehope that the report will help future researchers make best use of that database.
iv
Table of Contents
Acknowledgments . . . . . . . . . . . . . . . . . . . . . . . . . . . . . . . . . . . . . . . . . . . . . . . . . . . . . . . . . iii
List of Figures . . . . . . . . . . . . . . . . . . . . . . . . . . . . . . . . . . . . . . . . . . . . . . . . . . . . . . . . . . . . vi
List of Tables . . . . . . . . . . . . . . . . . . . . . . . . . . . . . . . . . . . . . . . . . . . . . . . . . . . . . . . . . . . . vii
1 Introduction . . . . . . . . . . . . . . . . . . . . . . . . . . . . . . . . . . . . . . . . . . . . . . . . . . . . . . . . . . . . 1
The National Education Longitudinal Study of 1988. . . . . . . . . . . . . . . . . . . . . . . . . . . . . . 1Purposes of This Report . . . . . . . . . . . . . . . . . . . . . . . . . . . . . . . . . . . . . . . . . . . . . . . . . . . 2Organization of This Report . . . . . . . . . . . . . . . . . . . . . . . . . . . . . . . . . . . . . . . . . . . . . . . . . 4
2 Methodology . . . . . . . . . . . . . . . . . . . . . . . . . . . . . . . . . . . . . . . . . . . . . . . . . . . . . . . . . . . 7
Overview . . . . . . . . . . . . . . . . . . . . . . . . . . . . . . . . . . . . . . . . . . . . . . . . . . . . . . . . . . . . . . . 7Selection of the Study Sample . . . . . . . . . . . . . . . . . . . . . . . . . . . . . . . . . . . . . . . . . . . . . . 13Weighting of Cases . . . . . . . . . . . . . . . . . . . . . . . . . . . . . . . . . . . . . . . . . . . . . . . . . . . . . . 17Definition of Omission Rates . . . . . . . . . . . . . . . . . . . . . . . . . . . . . . . . . . . . . . . . . . . . . . . 18
3 Comparison of Student and Parent Responses . . . . . . . . . . . . . . . . . . . . . . . . . . . . . . . . 21
Number of Siblings . . . . . . . . . . . . . . . . . . . . . . . . . . . . . . . . . . . . . . . . . . . . . . . . . . . . . . 21Student Jobs . . . . . . . . . . . . . . . . . . . . . . . . . . . . . . . . . . . . . . . . . . . . . . . . . . . . . . . . . . . 25Use of Non-English Languages . . . . . . . . . . . . . . . . . . . . . . . . . . . . . . . . . . . . . . . . . . . . . 29Parents' Education . . . . . . . . . . . . . . . . . . . . . . . . . . . . . . . . . . . . . . . . . . . . . . . . . . . . . . . 33People at Home After School . . . . . . . . . . . . . . . . . . . . . . . . . . . . . . . . . . . . . . . . . . . . . . . 36Ratings of the School . . . . . . . . . . . . . . . . . . . . . . . . . . . . . . . . . . . . . . . . . . . . . . . . . . . . . 39Parent-Student Discussions of Issues . . . . . . . . . . . . . . . . . . . . . . . . . . . . . . . . . . . . . . . . . 42Parent-Student Decisions on Drinking and Substance Problems . . . . . . . . . . . . . . . . . . . . . 46Enrollment, Suspension, and Dropout Status. . . . . . . . . . . . . . . . . . . . . . . . . . . . . . . . . . . 50Educational Aspirations and Expectations . . . . . . . . . . . . . . . . . . . . . . . . . . . . . . . . . . . . . 52College Choice Factors . . . . . . . . . . . . . . . . . . . . . . . . . . . . . . . . . . . . . . . . . . . . . . . . . . . 55Occupational Expectations . . . . . . . . . . . . . . . . . . . . . . . . . . . . . . . . . . . . . . . . . . . . . . . . . 60Summary . . . . . . . . . . . . . . . . . . . . . . . . . . . . . . . . . . . . . . . . . . . . . . . . . . . . . . . . . . . . . . 63
4 Comparison of Teacher and Student Responses . . . . . . . . . . . . . . . . . . . . . . . . . . . . . . 77
Student English Proficiency . . . . . . . . . . . . . . . . . . . . . . . . . . . . . . . . . . . . . . . . . . . . . . . . 77Practices in the Classroom . . . . . . . . . . . . . . . . . . . . . . . . . . . . . . . . . . . . . . . . . . . . . . . . . 82Student’s High School Track . . . . . . . . . . . . . . . . . . . . . . . . . . . . . . . . . . . . . . . . . . . . . . . 87Summary . . . . . . . . . . . . . . . . . . . . . . . . . . . . . . . . . . . . . . . . . . . . . . . . . . . . . . . . . . . . . . 91

v
5 Comparison of Second Follow-up Student Responses with Earlier Responses . . . . . . . 97
Television Viewing Habits . . . . . . . . . . . . . . . . . . . . . . . . . . . . . . . . . . . . . . . . . . . . . . . . . 98English Language Competency . . . . . . . . . . . . . . . . . . . . . . . . . . . . . . . . . . . . . . . . . . . . 102Religious Attitude . . . . . . . . . . . . . . . . . . . . . . . . . . . . . . . . . . . . . . . . . . . . . . . . . . . . . . 105Views on Parental Trust . . . . . . . . . . . . . . . . . . . . . . . . . . . . . . . . . . . . . . . . . . . . . . . . . . 107Discussions with Parents . . . . . . . . . . . . . . . . . . . . . . . . . . . . . . . . . . . . . . . . . . . . . . . . . 111Self-Esteem and Locus of Control Items . . . . . . . . . . . . . . . . . . . . . . . . . . . . . . . . . . . . . 114Educational Expectations . . . . . . . . . . . . . . . . . . . . . . . . . . . . . . . . . . . . . . . . . . . . . . . . . 121Expected Occupation . . . . . . . . . . . . . . . . . . . . . . . . . . . . . . . . . . . . . . . . . . . . . . . . . . . . 124Quality of Life Expectations . . . . . . . . . . . . . . . . . . . . . . . . . . . . . . . . . . . . . . . . . . . . . . . 126Views on Importance of Life Attainments . . . . . . . . . . . . . . . . . . . . . . . . . . . . . . . . . . . . 131High School Program . . . . . . . . . . . . . . . . . . . . . . . . . . . . . . . . . . . . . . . . . . . . . . . . . . . 135Students’ Evaluation of School Atmosphere . . . . . . . . . . . . . . . . . . . . . . . . . . . . . . . . . . 138Crime at School . . . . . . . . . . . . . . . . . . . . . . . . . . . . . . . . . . . . . . . . . . . . . . . . . . . . . . . . 142Student Participation in Special Programs . . . . . . . . . . . . . . . . . . . . . . . . . . . . . . . . . . . . 144Homework . . . . . . . . . . . . . . . . . . . . . . . . . . . . . . . . . . . . . . . . . . . . . . . . . . . . . . . . . . . 148Cutting Classes . . . . . . . . . . . . . . . . . . . . . . . . . . . . . . . . . . . . . . . . . . . . . . . . . . . . . . . . 151Students’ Preparedness for Class . . . . . . . . . . . . . . . . . . . . . . . . . . . . . . . . . . . . . . . . . . . 154Participation in Extracurricular Activities . . . . . . . . . . . . . . . . . . . . . . . . . . . . . . . . . . . . . 156Summary . . . . . . . . . . . . . . . . . . . . . . . . . . . . . . . . . . . . . . . . . . . . . . . . . . . . . . . . . . . . . 159
6 Summary and Conclusions . . . . . . . . . . . . . . . . . . . . . . . . . . . . . . . . . . . . . . . . . . . . . . 185
Meta-analysis of polychoric correlations . . . . . . . . . . . . . . . . . . . . . . . . . . . . . . . . . . . . . . 192Meta-analysis of percentages of omissions . . . . . . . . . . . . . . . . . . . . . . . . . . . . . . . . . . . 195
References . . . . . . . . . . . . . . . . . . . . . . . . . . . . . . . . . . . . . . . . . . . . . . . . . . . . . . . . . . . . . . 198
Appendix A: Index of Measures and Univariate Unweighted Distributions . . . . . . . . . . . . . . 199Appendix B: Recodings of Measures for Comparisons . . . . . . . . . . . . . . . . . . . . . . . . . . . . 225Appendix C: Statistical Measures of Association and Omission Bias . . . . . . . . . . . . . . . . . . 233
vi
List of Figures
Figure 3.1: Joint distribution of polychoric correlations and mean differences for student—parent item pairs . . . . . . . . . . . . . . . . . . . . . . . . . . . . . . . . . . . . . . . . 64
Figure 4.1: Joint distribution of polychoric correlations and mean differences for student—teacher item pairs. . . . . . . . . . . . . . . . . . . . . . . . . . . . . . . . . . . . . . . 93
Figure 5.1: Joint distribution of polychoric correlations and mean differences for second follow-up and earlier student responses to personal and family background items . . . . . . . . . . . . . . . . . . . . . . . . . . . . . . . . . . . . . . . . . . . . . . 161
Figure 5.2: Joint distribution of polychoric correlations and mean differences for second follow-up and earlier student responses to school-related items . . . . . 162
Figure 6.1: Comparison of polychoric correlations between parent and student and between 2nd follow-up and earlier responses . . . . . . . . . . . . . . . . . . . . . . . . . 187
Figure 6.2: Comparison between second follow-up and base year parent-student polychoric correlations . . . . . . . . . . . . . . . . . . . . . . . . . . . . . . . . . . . . . . . . . . 188
Figure 6.3: Comparison between base year to second follow-up and first to second follow-up polychoric correlations . . . . . . . . . . . . . . . . . . . . . . . . . . . . . . . . . . 190
Figure 6.4: Polychoric correlations for high and low 8th grade reading ability students . . . 191
vii
List of Tables
Table 2.1A: First and second follow-up status of NELS:88 cases with positive second follow-up panel weights . . . . . . . . . . . . . . . . . . . . . . . . . . . . . . . . . . . . . . . . . . 14
Table 2.1B: First and second follow-up status of NELS:88 cases with positive base year weights and zero second follow-up panel weights. . . . . . . . . . . . . . . . . . . . 15
Table 2.2: Number of students expected to have corresponding math and science teacher records, by teacher participation. . . . . . . . . . . . . . . . . . . . . . . . . . . . . . 16
Table 2.3: Comparison of statistics using panel weights and context weights for some key statistics . . . . . . . . . . . . . . . . . . . . . . . . . . . . . . . . . . . . . . . . . . . . . . . . . . . 16
Table 2.4: Unweighted frequencies of subpopulations on which items were compared . . . . 17
Table 2.5: Weighted and unweighted means and standard deviations for five NELS:88 measures . . . . . . . . . . . . . . . . . . . . . . . . . . . . . . . . . . . . . . . . . . . . . . . . . . . . . 18
Table 3.1A: Comparison of parent and student responses to items about numbers ofsiblings . . . . . . . . . . . . . . . . . . . . . . . . . . . . . . . . . . . . . . . . . . . . . . . . . . . . . . . 22
Table 3.1B: Comparison of parent and student nonresponse rates to items about numbers of siblings . . . . . . . . . . . . . . . . . . . . . . . . . . . . . . . . . . . . . . . . . . . . . . . . . . . . . 22
Table 3.1C: Response characteristics on items about numbers of siblings, for population subgroups . . . . . . . . . . . . . . . . . . . . . . . . . . . . . . . . . . . . . . . . . . . . 23
Table 3.1D: Statistically significant associations of sibling counts, based on parent and student responses, with selected NELS:88 outcomes . . . . . . . . . . . . . . . . . . . . 24
Table 3.2A: Comparison of parent and student responses to items about student jobs . . . . . 26
Table 3.2B: Comparison of parent and student nonresponse rates to items about student jobs . . . . . . . . . . . . . . . . . . . . . . . . . . . . . . . . . . . . . . . . . . . . . . . . . . . . . . . . . 27
Table 3.2C: Response characteristics on items about student jobs, for population subgroups . . . . . . . . . . . . . . . . . . . . . . . . . . . . . . . . . . . . . . . . . . . . . . . . . . . . . 28
Table 3.2D: Statistically significant associations of working on a job, based on parent and student responses, with selected NELS:88 outcomes . . . . . . . . . . . . . . . . . . . . 28
viii
Table 3.3A: Comparison of parent and student responses to items about use of non-English languages . . . . . . . . . . . . . . . . . . . . . . . . . . . . . . . . . . . . . . . . . . . 30
Table 3.3B: Comparison of parent and student nonresponse rates to items about use of non-English languages . . . . . . . . . . . . . . . . . . . . . . . . . . . . . . . . . . . . . . . . . . . 31
Table 3.3C: Response characteristics on items about use of non-English languages, for population subgroups . . . . . . . . . . . . . . . . . . . . . . . . . . . . . . . . . . . . . . . . . . . . 32
Table 3.3D: Statistically significant associations of English use in the home, based on parent and student responses, with selected NELS:88 outcomes . . . . . . . . . . . . 33
Table 3.4A: Comparison of parent and student responses to items about parents’ education. . . . . . . . . . . . . . . . . . . . . . . . . . . . . . . . . . . . . . . . . . . . . . . . . . . . . . . . . . . . 34
Table 3.4B: Comparison of parent and student nonresponse rates to items about parents’ education . . . . . . . . . . . . . . . . . . . . . . . . . . . . . . . . . . . . . . . . . . . . . . . . . . . . . 34
Table 3.4C: Response characteristics on items about parents’ education, for population subgroups . . . . . . . . . . . . . . . . . . . . . . . . . . . . . . . . . . . . . . . . . . . . . . . . . . . . . 35
Table 3.4D: Statistically significant associations of parents’ education, based on parent and student responses, with selected NELS:88 outcomes . . . . . . . . . . . . . . . . . . . . 35
Table 3.5A: Comparison of parent and student responses to items about people at home after school . . . . . . . . . . . . . . . . . . . . . . . . . . . . . . . . . . . . . . . . . . . . . . . . . . . . 36
Table 3.5B: Comparison of parent and student nonresponse rates to items about people at home after school . . . . . . . . . . . . . . . . . . . . . . . . . . . . . . . . . . . . . . . . . . . . . . . 37
Table 3.5C: Response characteristics on items about people at home after school, for population subgroups . . . . . . . . . . . . . . . . . . . . . . . . . . . . . . . . . . . . . . . . . . . . 38
Table 3.5D: Statistically significant associations of people at home after school, based on parent and student responses, with selected NELS:88 outcomes . . . . . . . . . . . . 39
Table 3.6A: Comparison of parent and student responses to items about ratings of the school . . . . . . . . . . . . . . . . . . . . . . . . . . . . . . . . . . . . . . . . . . . . . . . . . . . . . . . . 40
Table 3.6B: Comparison of parent and student nonresponse rates to items about ratings of the school . . . . . . . . . . . . . . . . . . . . . . . . . . . . . . . . . . . . . . . . . . . . . . . . . . . . . 40
ix
Table 3.6C: Response characteristics on items about ratings of the school, for population subgroups . . . . . . . . . . . . . . . . . . . . . . . . . . . . . . . . . . . . . . . . . . . . 41
Table 3.6D: Statistically significant associations of school factors, based on parent and student ratings, with selected NELS:88 outcomes . . . . . . . . . . . . . . . . . . . . . . . 41
Table 3.7A: Comparison of parent and student responses to items about parent-student discussion of issues . . . . . . . . . . . . . . . . . . . . . . . . . . . . . . . . . . . . . . . . . . . . . . 43
Table 3.7B: Comparison of parent and student nonresponse rates to items about parent-student discussion of issues . . . . . . . . . . . . . . . . . . . . . . . . . . . . . . . . . . 44
Table 3.7C: Response characteristics on items about parent-student discussions, for population subgroups . . . . . . . . . . . . . . . . . . . . . . . . . . . . . . . . . . . . . . . . . . . . 44
Table 3.7D: Statistically significant associations of parent-student discussions, based on parent and student ratings, with selected NELS:88 outcomes . . . . . . . . . . . . . . 45
Table 3.8A: Comparison of parent and student responses to items about substance use decisionmaking . . . . . . . . . . . . . . . . . . . . . . . . . . . . . . . . . . . . . . . . . . . . . . 47
Table 3.8B: Comparison of student and parent and student nonresponse rates to items about substance use decisionmaking . . . . . . . . . . . . . . . . . . . . . . . . . . . . . . . . . 48
Table 3.8C: Response characteristics on items about substance use decisionmaking, for population subgroups . . . . . . . . . . . . . . . . . . . . . . . . . . . . . . . . . . . . . . . . . 49
Table 3.8D: Statistically significant associations of substance use decisionmaking, based on parent and student responses, with selected NELS:88 outcomes . . . . . . . . . 49
Table 3.9A: Comparison of parent and student responses to items about suspensions and dropping out . . . . . . . . . . . . . . . . . . . . . . . . . . . . . . . . . . . . . . . . . . . . . . . . . . . 51
Table 3.9B: Comparison of parent and student nonresponse rates to items about suspensions and dropping out . . . . . . . . . . . . . . . . . . . . . . . . . . . . . . . . . . . . . . 51
Table 3.9C: Response characteristics on items about suspensions and dropping out, for population subgroups . . . . . . . . . . . . . . . . . . . . . . . . . . . . . . . . . . . . . . . . . . . . 51
Table 3.9D: Statistically significant associations of suspensions and enrollment status, based on parent and student responses, with selected NELS:88 outcomes . . . . . 52

x
Table 3.10A: Comparison of parent and student responses to items about educational aspirations and expectations . . . . . . . . . . . . . . . . . . . . . . . . . . . . . . . . . . . . . . . 53
Table 3.10B: Comparison of parent and student nonresponse rates to items about educational aspirations and expectations . . . . . . . . . . . . . . . . . . . . . . . . . . . . . . 54
Table 3.10C: Response characteristics on items about educational aspirations and expectations, for population subgroups . . . . . . . . . . . . . . . . . . . . . . . . . . . . . . . 54
Table 3.10D: Statistically significant associations of educational aspirations and expectations, based on parent and student responses, with selected NELS:88 outcomes . . . . . . . . . . . . . . . . . . . . . . . . . . . . . . . . . . . . . . . . . . . . . 55
Table 3.11A: Comparison of parent and student responses to items about college choice factors . . . . . . . . . . . . . . . . . . . . . . . . . . . . . . . . . . . . . . . . . . . . . . . . . . . . . . . 56
Table 3.11B: Comparison of parent and student nonresponse rates to items about college choice factors . . . . . . . . . . . . . . . . . . . . . . . . . . . . . . . . . . . . . . . . . . . . . . . . . . 57
Table 3.11C: Response characteristics on items about college choice factors, for population subgroups . . . . . . . . . . . . . . . . . . . . . . . . . . . . . . . . . . . . . . . . . . . . 58
Table 3.11D: Statistically significant associations of college choice factors, based on parent and student responses, with selected NELS:88 outcomes . . . . . . . . . . . . . . . . . 60
Table 3.12A: Comparison of parent and student responses to items about occupational expectations . . . . . . . . . . . . . . . . . . . . . . . . . . . . . . . . . . . . . . . . . . . . . . . . . . . 61
Table 3.12B: Comparison of parent and student nonresponse rates to items about occupational expectations . . . . . . . . . . . . . . . . . . . . . . . . . . . . . . . . . . . . . . . . . 62
Table 3.12C: Response characteristics on items about occupational expectations, for population subgroups . . . . . . . . . . . . . . . . . . . . . . . . . . . . . . . . . . . . . . . . . . . . 62
Table 3.12D: Statistically significant associations of occupational expectations, based on parent and student responses, with selected NELS:88 outcomes . . . . . . . . . . . . 62
Table 3.13A: Comparison of parent and student responses to NELS:88 items. . . . . . . . . . . . . 65
Table 3.13B: Comparison of parent and student nonresponse rates to NELS:88 items . . . . . . 67
Table 3.14: Polychoric correlations between parent and student responses, for population subgroups . . . . . . . . . . . . . . . . . . . . . . . . . . . . . . . . . . . . . . . . . . . . 69

xi
Table 3.15: Average parent-student response differences, for population subgroups . . . . . . 71
Table 3.16: Percentage of student nonresponse for student-parent item-pairs, for population subgroups . . . . . . . . . . . . . . . . . . . . . . . . . . . . . . . . . . . . . . . . . . . . 73
Table 3.17: Statistically significant associations of parent and student measures with selected NELS:88 outcomes . . . . . . . . . . . . . . . . . . . . . . . . . . . . . . . . . . . . . . . 75
Table 4.1A: Comparison of teacher and student responses to items about students’ native language and English language proficiency . . . . . . . . . . . . . . . . . . . . . . . . . . . . 78
Table 4.1B: Comparison of teacher and student nonresponse rates to items reflecting students’ English proficiency . . . . . . . . . . . . . . . . . . . . . . . . . . . . . . . . . . . . . . 79
Table 4.1C: Response characteristics on items about students’ English proficiency, for population subgroups . . . . . . . . . . . . . . . . . . . . . . . . . . . . . . . . . . . . . . . . . . . . 80
Table 4.1D: Statistically significant associations of students’ English proficiency, based on teacher and student reports, with selected NELS:88 outcomes. . . . . . . . . . . 81
Table 4.2A: Comparison of teacher and student responses to items about instructional practices in math and science classrooms . . . . . . . . . . . . . . . . . . . . . . . . . . . . . 84
Table 4.2B: Comparison of teacher and student nonresponse rates to items about classroom practices . . . . . . . . . . . . . . . . . . . . . . . . . . . . . . . . . . . . . . . . . . . . . . 84
Table 4.2C: Response characteristics on items about classroom practices, for population subgroups . . . . . . . . . . . . . . . . . . . . . . . . . . . . . . . . . . . . . . . . . . . . 86
Table 4.2D: Statistically significant associations of classroom practices, based on teacher and student reports, with selected NELS:88 outcomes . . . . . . . . . . . . . . . . . . . 87
Table 4.3A: Comparison of teacher and student responses to items about students’ high school track . . . . . . . . . . . . . . . . . . . . . . . . . . . . . . . . . . . . . . . . . . . . . . . . . . . 89
Table 4.3B: Comparison of teacher and student nonresponse rates to items about students’ high school track . . . . . . . . . . . . . . . . . . . . . . . . . . . . . . . . . . . . . . . . . . . . . . . 89
Table 4.3C: Response characteristics on items about students’ high school track, for population subgroups . . . . . . . . . . . . . . . . . . . . . . . . . . . . . . . . . . . . . . . . . . . . 90

xii
Table 4.3D: Statistically significant associations of students’ high school track, based on teacher and student reports, with selected NELS:88 outcomes. . . . . . . . . . . . . 90
Table 4.4A: Comparison of student and teacher responses to NELS:88 items. . . . . . . . . . . 94
Table 4.4B: Comparison of teacher and student nonresponse rates to NELS:88 items. . . . . 94
Table 4.5: Polychoric correlations between student and teacher responses, for population subgroups . . . . . . . . . . . . . . . . . . . . . . . . . . . . . . . . . . . . . . . . . . . . 95
Table 4.6: Average teacher-student response differences, for population subgroups. . . . . . 95
Table 4.7: Percentage of student nonresponse for student-teacher item pairs, for population subgroups . . . . . . . . . . . . . . . . . . . . . . . . . . . . . . . . . . . . . . . . . . . . 96
Table 4.8: Comparison of significant associations of teacher and student measures with selected NELS:88 outcomes . . . . . . . . . . . . . . . . . . . . . . . . . . . . . . . . . . . . . . . 96
Table 5.1A: Comparison of second follow-up and base year student responses to items about television viewing . . . . . . . . . . . . . . . . . . . . . . . . . . . . . . . . . . . . . . . . . . 99
Table 5.1B: Comparison of second follow-up and base year student nonresponse rates to items about television viewing . . . . . . . . . . . . . . . . . . . . . . . . . . . . . . . . . . . . 100
Table 5.1C: Response characteristics on items about television viewing, for population subgroups . . . . . . . . . . . . . . . . . . . . . . . . . . . . . . . . . . . . . . . . . . . . . . . . . . . . 100
Table 5.1D: Statistically significant associations of base year and second follow-up student responses about television viewing with selected NELS:88 outcomes . 101
Table 5.2A: Comparison of second follow-up and base year student responses to items about English language competence . . . . . . . . . . . . . . . . . . . . . . . . . . . . . . . . 103
Table 5.2B: Comparison of second follow-up and base year student nonresponse rates to items about English language competence . . . . . . . . . . . . . . . . . . . . . . . . . . . . 104
Table 5.2C: Response characteristics on items about English language competence, for population subgroups . . . . . . . . . . . . . . . . . . . . . . . . . . . . . . . . . . . . . . . . . . . 104
Table 5.2D: Statistically significant associations of base year and second follow-up student responses about English language competence with selected NELS:88 outcomes . . . . . . . . . . . . . . . . . . . . . . . . . . . . . . . . . . . . . . . . . . . . . . . . . . . . 105
xiii
Table 5.3A: Comparison of first and second follow-up student responses to items about religious attitudes . . . . . . . . . . . . . . . . . . . . . . . . . . . . . . . . . . . . . . . . . . . . . . 106
Table 5.3B: Comparison of first and second follow-up student nonresponse rates to items about religious attitudes . . . . . . . . . . . . . . . . . . . . . . . . . . . . . . . . . . . . . . . . . 106
Table 5.3C: Response characteristics on items about religious attitudes, for population subgroups . . . . . . . . . . . . . . . . . . . . . . . . . . . . . . . . . . . . . . . . . . . . . . . . . . . . 107
Table 5.3D: Statistically significant associations of first and second follow-up student responses about religious attitudes with selected NELS:88 outcomes . . . . . . . 107
Table 5.4A: Comparison of second follow-up and base year student responses to items about views on parental trust . . . . . . . . . . . . . . . . . . . . . . . . . . . . . . . . . . . . . 109
Table 5.4B: Comparison of second follow-up and base year student nonresponse rates to items about views on parental trust . . . . . . . . . . . . . . . . . . . . . . . . . . . . . . . . . 109
Table 5.4C: Response characteristics on items about views on parental trust, for population subgroups . . . . . . . . . . . . . . . . . . . . . . . . . . . . . . . . . . . . . . . . . . . 110
Table 5.4D: Statistically significant associations of base year and second follow-up student responses about views on parental trust with selected NELS:88 outcomes . . . . . . . . . . . . . . . . . . . . . . . . . . . . . . . . . . . . . . . . . . . . . . . . . . . . 110
Table 5.5A: Comparison of second follow-up and earlier student responses to items about discussions with parents . . . . . . . . . . . . . . . . . . . . . . . . . . . . . . . . . . . . 112
Table 5.5B: Comparison of second follow-up and earlier student nonresponse rates to items about discussions with parents . . . . . . . . . . . . . . . . . . . . . . . . . . . . . . . . . . . . 112
Table 5.5C: Response characteristics on items about discussions with parents, for population subgroups . . . . . . . . . . . . . . . . . . . . . . . . . . . . . . . . . . . . . . . . . . . 113
Table 5.5D: Statistically significant associations of earlier and later student responses about discussions with parents with selected NELS:88 outcomes . . . . . . . . . . 114
Table 5.6A: Comparison of second follow-up and earlier student responses to items about self-esteem and locus of control . . . . . . . . . . . . . . . . . . . . . . . . . . . . . . . . . . . 116
Table 5.6B: Comparison of second follow-up and earlier student nonresponse rates to items about self-esteem and locus of control . . . . . . . . . . . . . . . . . . . . . . . . . . 117

xiv
Table 5.6C: Response characteristics on items about self-esteem and locus of control, for population subgroups . . . . . . . . . . . . . . . . . . . . . . . . . . . . . . . . . . . . . . . . 118
Table 5.6D: Statistically significant associations of earlier and later student responses about self-esteem and locus of control with selected NELS:88 outcomes . . . . . . . . . 120
Table 5.7A: Comparison of second follow-up and base year student responses to items about educational expectations . . . . . . . . . . . . . . . . . . . . . . . . . . . . . . . . . . . . 122
Table 5.7B: Comparison of second follow-up and base year student nonresponse rates to items about educational expectations . . . . . . . . . . . . . . . . . . . . . . . . . . . . . . . 122
Table 5.7C: Response characteristics on items about educational expectations, for population subgroups . . . . . . . . . . . . . . . . . . . . . . . . . . . . . . . . . . . . . . . . . . . 123
Table 5.7D: Statistically significant associations of base year and second follow-up student responses about educational expectations with selected NELS:88 outcomes . . . . . . . . . . . . . . . . . . . . . . . . . . . . . . . . . . . . . . . . . . . . . . . . . . . . 123
Table 5.8A: Comparison of second follow-up and earlier student responses to items about expected occupation at 30 . . . . . . . . . . . . . . . . . . . . . . . . . . . . . . . . . . . 125
Table 5.8B: Comparison of second follow-up and earlier student nonresponse rates toitems about expected occupation at 30 . . . . . . . . . . . . . . . . . . . . . . . . . . . . . . 125
Table 5.8C: Response characteristics on items about expected occupation at 30, for population subgroups . . . . . . . . . . . . . . . . . . . . . . . . . . . . . . . . . . . . . . . . . . . 125
Table 5.8D: Statistically significant associations of base year and second follow-up student responses about expected occupation at 30 with selected NELS:88 outcomes . . . . . . . . . . . . . . . . . . . . . . . . . . . . . . . . . . . . . . . . . . . . . . . . . . . . 126
Table 5.9A: Comparison of second follow-up and earlier student responses to items about quality of life . . . . . . . . . . . . . . . . . . . . . . . . . . . . . . . . . . . . . . . . . . . . . . . . . 127
Table 5.9B: Comparison of second follow-up and earlier student nonresponse rates to items about quality of life . . . . . . . . . . . . . . . . . . . . . . . . . . . . . . . . . . . . . . . . . . . . . 128
Table 5.9C: Response characteristics on items about quality of life, for population subgroups . . . . . . . . . . . . . . . . . . . . . . . . . . . . . . . . . . . . . . . . . . . . . . . . . . . . 129
xv
Table 5.9D: Statistically significant associations of earlier and later student responses about quality of life with selected NELS:88 outcomes . . . . . . . . . . . . . . . . . . 130
Table 5.10A: Comparison of first and second follow-up student responses to items about importance of life attainments . . . . . . . . . . . . . . . . . . . . . . . . . . . . . . . . 132
Table 5.10B: Comparison of first and second follow-up student nonresponse rates to items about importance of life attainments . . . . . . . . . . . . . . . . . . . . . . . . . . . . . . . . 132
Table 5.10C: Response characteristics on items about importance of life attainments, for population subgroups . . . . . . . . . . . . . . . . . . . . . . . . . . . . . . . . . . . . . . . . 134
Table 5.10D: Statistically significant associations of first and second follow-up student responses about importance of life attainments with selected NELS:88 outcomes . . . . . . . . . . . . . . . . . . . . . . . . . . . . . . . . . . . . . . . . . . . . . . . . . . . . 135
Table 5.11A: Comparison of first and second follow-up student responses to items about students’ high school program . . . . . . . . . . . . . . . . . . . . . . . . . . . . . . . . . . . . 136
Table 5.11B: Comparison of first and second follow-up student nonresponse rates to items about students’ high school program . . . . . . . . . . . . . . . . . . . . . . . . . . . . . . . . 137
Table 5.11C: Response characteristics on items about students’ high school program, for population subgroups . . . . . . . . . . . . . . . . . . . . . . . . . . . . . . . . . . . . . . . . 137
Table 5.11D: Statistically significant associations of first and second follow-up student responses about students’ high school program with selected NELS:88 outcomes . . . . . . . . . . . . . . . . . . . . . . . . . . . . . . . . . . . . . . . . . . . . . . . . . . . . 138
Table 5.12A: Comparison of second follow-up and earlier student responses to items about the school climate.. . . . . . . . . . . . . . . . . . . . . . . . . . . . . . . . . . . . . . . . . . . . . 139
Table 5.12B: Comparison of second follow-up and earlier student nonresponse rates to items about the school climate.. . . . . . . . . . . . . . . . . . . . . . . . . . . . . . . . . . . . . . . . 140
Table 5.12C: Response characteristics on items about the school climate, for population subgroups . . . . . . . . . . . . . . . . . . . . . . . . . . . . . . . . . . . . . . . . . . . . . . . . . . . . 141
Table 5.12D: Statistically significant associations of earlier and later student responses about the school climate with selected NELS:88 outcomes. . . . . . . . . . . . . . . 142
Table 5.13A: Comparison of second follow-up and base year student responses to items about crime at school. . . . . . . . . . . . . . . . . . . . . . . . . . . . . . . . . . . . . . . . . . . . 143

xvi
Table 5.13B: Comparison of second follow-up and base year student nonresponse rates to items about crime at school. . . . . . . . . . . . . . . . . . . . . . . . . . . . . . . . . . . . . . . 143
Table 5.13C: Response characteristics on items about crime at school, for population subgroups . . . . . . . . . . . . . . . . . . . . . . . . . . . . . . . . . . . . . . . . . . . . . . . . . . . . 144
Table 5.13D: Statistically significant associations of base year and second follow-up student responses about crime at school with selected NELS:88 outcomes . . . 144
Table 5.14A: Comparison of second follow-up and base year student responses to items about special educational programs. . . . . . . . . . . . . . . . . . . . . . . . . . . . . . . . . 146
Table 5.14B: Comparison of second follow-up and base year student nonresponse rates to items about special educational programs. . . . . . . . . . . . . . . . . . . . . . . . . . . . . 146
Table 5.14C: Response characteristics on items about special educational programs, for population subgroups . . . . . . . . . . . . . . . . . . . . . . . . . . . . . . . . . . . . . . . . . . . 147
Table 5.14D: Statistically significant associations of base year and second follow-up student responses about special educational programs with selected NELS:88 outcomes . . . . . . . . . . . . . . . . . . . . . . . . . . . . . . . . . . . . . . . . . . . . . . . . . . . . 147
Table 5.15A: Comparison of second follow-up and base year student responses to items about homework. . . . . . . . . . . . . . . . . . . . . . . . . . . . . . . . . . . . . . . . . . . . . . . 149
Table 5.15B: Comparison of second follow-up and base year student nonresponse rates to items about homework. . . . . . . . . . . . . . . . . . . . . . . . . . . . . . . . . . . . . . . . . . 150
Table 5.15C: Response characteristics on items about homework, for population subgroups. . . . . . . . . . . . . . . . . . . . . . . . . . . . . . . . . . . . . . . . . . . . . . . . . . . . . . . . . . . 150
Table 5.15D: Statistically significant associations of base year and second follow-up student responses about homework with selected NELS:88 outcomes . . . . . . 151
Table 5.16A: Comparison of second follow-up and base year student responses to items about cutting class. . . . . . . . . . . . . . . . . . . . . . . . . . . . . . . . . . . . . . . . . . . . . . 152
Table 5.16B: Comparison of second follow-up and base year student nonresponse rates toitems about cutting class. . . . . . . . . . . . . . . . . . . . . . . . . . . . . . . . . . . . . . . . . 153
Table 5.16C: Response characteristics on items about cutting class, for population subgroups . . . . . . . . . . . . . . . . . . . . . . . . . . . . . . . . . . . . . . . . . . . . . . . . . . . . 153
xvii
Table 5.16D: Statistically significant associations of base year and second follow-up student responses about cutting class with selected NELS:88 outcomes . . . . . 153
Table 5.17A: Comparison of second follow-up and base year student responses to items about preparing for class. . . . . . . . . . . . . . . . . . . . . . . . . . . . . . . . . . . . . . . . . 154
Table 5.17B: Comparison of second follow-up and base year student nonresponse rates to items about preparing for class. . . . . . . . . . . . . . . . . . . . . . . . . . . . . . . . . . . . . 155
Table 5.17C: Response characteristics on items about preparing for class, for population subgroups . . . . . . . . . . . . . . . . . . . . . . . . . . . . . . . . . . . . . . . . . . . . . . . . . . . . 155
Table 5.17D: Statistically significant associations of base year and second follow-up student responses about preparing for class with selected NELS:88 outcomes.. 156
Table 5.18A: Comparison of second follow-up and base year student responses to items about extracurricular activities. . . . . . . . . . . . . . . . . . . . . . . . . . . . . . . . . . . . . 157
Table 5.18B: Comparison of second follow-up and base year student nonresponse rates to items about extracurricular activities. . . . . . . . . . . . . . . . . . . . . . . . . . . . . . . . 158
Table 5.18C: Response characteristics on items about extracurricular activities, for population subgroups . . . . . . . . . . . . . . . . . . . . . . . . . . . . . . . . . . . . . . . . . . . 158
Table 5.18D: Statistically significant associations of base year and second follow-up student responses about extracurricular activities with selected NELS:88 outcomes . . . . . . . . . . . . . . . . . . . . . . . . . . . . . . . . . . . . . . . . . . . . . . . . . . . . 159
Table 5.19A: Comparison of second follow-up and earlier student responses to items about personal and family attitudes and behaviors. . . . . . . . . . . . . . . . . . . . . . 163
Table 5.19B: Comparison of second follow-up and earlier student responses to items about school events . . . . . . . . . . . . . . . . . . . . . . . . . . . . . . . . . . . . . . . . . . . . . . . . . 165
Table 5.20A: Comparison of second follow-up and earlier student nonresponse to items about personal and family attitudes and behaviors. . . . . . . . . . . . . . . . . . . . . . 167
Table 5.20B: Comparison of second follow-up and earlier student nonresponses to items about school events . . . . . . . . . . . . . . . . . . . . . . . . . . . . . . . . . . . . . . . . . . . . 169
xviii
Table 5.21: Subpopulation comparisons of polychoric correlations between second follow-up and earlier years for items about personal and family attitudes and behaviors . . . . . . . . . . . . . . . . . . . . . . . . . . . . . . . . . . . . . . . . . . . . . . . . . 171
Table 5.22: Subpopulation comparisons of polychoric correlations between second follow-up and earlier responses for items about school events . . . . . . . . . . . . . 173
Table 5.23: Subpopulation comparisons of average response differences between second follow-up and earlier years for items about personal and family attitudes and behaviors . . . . . . . . . . . . . . . . . . . . . . . . . . . . . . . . . . . . . . . . . . . . . . . . . 174
Table 5.24: Subpopulation comparisons of average second follow-up and earlier student responses differences for school-related items . . . . . . . . . . . . . . . . . . . 176
Table 5.25: Subpopulation comparisons of percentage of student nonresponses at second follow-up for items about personal and family attitudes and behavior.. . . . . . . 177
Table 5.26: Subpopulation comparisons of student nonresponse at second follow-up on items about school events . . . . . . . . . . . . . . . . . . . . . . . . . . . . . . . . . . . . . . . . 179
Table 5.27: Statistically significant associations of second follow-up and earlier student responses to items about personal and family attitudes and behavior with selected NELS:88 outcomes . . . . . . . . . . . . . . . . . . . . . . . . . . . . . . . . . . . . . . 181
Table 5.28: Statistically significant associations of earlier and later student responses about the school events with selected NELS:88 outcomes . . . . . . . . . . . . . . . 183
A fourth follow-up is tentatively scheduled for 1998.1
1
Chapter 1Introduction
The National Education Longitudinal Study of 1988
In accordance with its congressional mandate to collect and disseminate statistics andstatistical analyses, and in response to the need for policy-relevant longitudinal data on nationallyrepresentative samples of elementary and secondary students, the National Center for EducationStatistics (NCES) initiated a continuing, long-term program called the National EducationLongitudinal Studies (NELS). The overall goal of this program is “to study the educational,vocational, and personal development of students at various grade levels, and the personal, familial,social, institutional, and cultural factors that may affect that development” (NCES 1994a). NELS:88represents the third major study in the NELS program, and follows the National Longitudinal Studyof the High School Class of 1972 (NLS-72) and the High School and Beyond Study (HS&B) startedin 1980.
NELS:88 began with a base year survey of eighth grade students in 1988, followed up at 2-year intervals in 1990, 1992, and 1994 (when most sample members would be in college orworking). NELS:88 collected data from more than 20,000 students, as well as their parents,1
teachers, school principals, and high school transcripts. The study entails a complex sampling design,which includes such features as augmentation (through “freshening”) to provide a representativesample of students at each phase of the survey through high school (i.e., to represent the tenth gradepopulation in 1990 and the twelfth grade population in 1992); the follow-up and subsequent inclusionof students who were not eligible to participate during the base year (base year ineligible, or BYIstudents) or who dropped out of school; and a complex set of case weights that support longitudinalanalyses and combinations of data from student, parent, and teacher surveys.
Because of its broad scope and longitudinal design, the NELS:88 data set allows forcomprehensive examination of change in young people’s lives and the roles that school and homeenvironments play in promoting growth and positive (or negative) outcomes. It also enablesresearchers to classify and describe students according to various characteristics, such as sex, race,socioeconomic status (SES), and disability status; and provides an extensive set of user manuals,technical reports, and CD-ROM data files to help researchers access and use the data effectively. Inshort, NELS:88 provides a unique and rich source of data by which to examine the status andexperiences of students as they progress from middle school through the high school years.

To provide a uniform context for comparing responses to a variety of base year and follow-up items, NELS:882
participants included in this report are limited to cases with positive weights for the base year to secondfollow-up panel (F2PNLWT > 0).
2
Purposes of This Report
This report is designed for researchers who may use the NELS:88 data to study thelongitudinal progress of eighth graders through their next four years. Its purpose is to conveyinformation about the measurement characteristics of the survey items in the base year and first andsecond follow-ups—in particular, about the nature of nonresponse and about convergence ofinformation from alternative sources. The analysis of measurement characteristics is necessarybecause substantive research depends on the ability to generalize from responses to items on a paper-and-pencil form to tests of models and theories about how schools work and students learn.Percentages of responses depend on both the state of the individual (the so-called “true value”) andthe processes by which the individual interprets the item wording and decides which of severalresponses to make. All of the items in NELS:88 are multiple choice (bubble-coded) items, and thewording of both the question and the response alternatives affects the response generation process.
Nine separate sources of NELS:88 information are covered in this report: student responsesin the base year, first follow-up, and second follow-up; dropout responses in the first and secondfollow-ups; parent responses in the base year and second follow-up; teacher responses at the secondfollow-up; and transcript records. Even if questions are worded identically and understood2
identically by different respondents, discrepancies emerge because each individual has uniqueknowledge and a unique perspective on the situation specified by the item (e.g., “Is the school safe?”).These discrepancies can be interpreted in several different ways, and in most cases, data are notsufficient to determine which interpretation is more accurate.
One interpretation of discrepancies, or lack of convergence of responses to the same item(about the same student) from two sources, is in terms of reliability . If we assume that responsesfrom two “judges” are “measuring” the same “construct,” then the correlation of responses betweenjudges indicates the extent to which the construct is being reliably measured. It is often called theinter-judge reliability . If the two responses are from the same judge at two different points in time,the correlation indicates the test-retest reliability. Underlying this interpretation is the assumptionthat the two responses are each measuring the same construct, each with some “measurement error”that leads to discrepancies.
A second interpretation of convergence is in terms of validity . If we assume that one of themeasures is an “accurate” (or criterion) measure of a construct and the other is an indicator or apredictor of that construct, then the correlation of responses indicates the validity of the predictor.The concept of validity is employed when carrying out research in which one measure (the predictor)is available but the other (the construct) is not. For example, eighth grade achievement scores might
3
be considered predictors of twelfth grade achievement scores, and high school grades and test scoresmight be considered predictors of success in college. Underlying this interpretation is the assumptionthat variation in predictor values is a sum of (a) variation on the underlying construct and(b) measurement error. The square of the correlation coefficient indicates the proportion of thevariance in the predictor that reflects variation in the underlying construct; however, the assumptionthat an observed “criterion” is identical to (or a perfect measure of) the construct of interest is oftenrelaxed in practice, and validity coefficients are adjusted (upward) for criterion unreliability, orattenuation.
The third interpretation of discrepancies is in terms of communality between separateconstructs, each measured by a questionnaire response. Two discrepant responses to the same itemabout the same subject may both be reliable and valid—but they are measuring different things, andthe phenomenon of their discrepancy can be a topic for substantive psychological or sociologicalresearch. In fact, lack of communality between apparently similar measures can provide new insightsinto processes under study.
For example, in NELS:88, indicators of student disability were obtained from students,parents, teachers, and school officials. Each indicator was worded differently, but all were ostensiblyrelated to an underlying construct of student disability. Results of comparisons of these measuresshowed that there was very little overlap (far less than 50 percent) in the population of studentsidentified as disabled by these separate sources (Rossi and Wolman 1996). Rather than interpret thisphenomenon as an indicator of unreliability or lack of validity, Rossi et al. interpreted the results interms of different item wordings and the different perspectives that students, teachers, and parentshave on a student's disability, developing a multidimensional picture of disability of high schoolstudents.
Other examples abound. To the extent that teenagers and their parents provide differentreports on the frequency of non-English language use in the home, both may be accurately viewingthe same language use, but from different contexts. To the extent that teenagers and teachers differon the extent to which they report that students do experiments in class, both may be accuratelyviewing the same classroom experiences, but from different contexts. To the extent that a studentreports different expectations for college graduation between base year and second follow-up surveys,the base year measure may capture more variation related to choices the student makes in ninth andtenth grades (e.g., course selection), while the second follow-up measure captures more variationrelated to student achievement during high school (e.g., GPA, test scores).
To decide among these interpretations requires an independent source of information—eithera separate, accurate measure of the reliability of the items or a logical argument that one of themeasures can be treated as identical to the construct (i.e., as a criterion) for a researcher's purposes.This information is generally not available for measures in NELS:88 or any other survey. However,that is not critical for the value of information about convergence: researchers who might useNELS:88 for substantive research on educational policy and practice can take lack of convergence
4
into account in their interpretations of results, no matter which of the explanations of discrepanciesis accurate. The approach taken in this report is to describe the extent of discrepancies (or lack ofconvergence), and in some cases to suggest possible reasons for discrepancy patterns.
Organization of This Report
The remainder of this report is organized around key topics and related research questionsthat must be addressed to achieve the objectives described above. Each chapter is described brieflybelow:
Chapter 2. Methodology describes the data used in this report and the analytical methodsthat are used to address research questions regarding NELS:88 data quality.
Chapter 3. Comparison of Student and Parent Responses describes the characteristics of64 item pairs, covering the base year and second follow-up surveys. These item pairs range fromobjective information, such as the number of siblings, to subjective judgments about school and thestudent's future. Information is provided about both convergence and nonresponse, including break-outs by type of student and exhibits of the impact of these factors on relations to outcome variables.In this and other chapters, responses to appropriate items on the dropout questionnaire are includedin the analyses.
Chapter 4. Comparison of Teacher and Student Responses describes the characteristicsof 12 item pairs, comparing responses of teachers and students at the time of the second NELS:88follow-up. The items include estimates of the student’s English language proficiency and estimatesof the prevalence of different teaching strategies in math and science classrooms, as well as indicatorsof the program track the student is in.
Chapter 5. Comparison of Second Follow-up Student Responses with Earlier Responsesdescribes changes in 112 item pairs between base year or first follow-up and the second follow-up.These items cover general student characteristics, behaviors, and attitudes, as well as specificallyschool-related attitudes and behavior.
Chapter 6. Summary and Conclusions summarizes the key findings of this report relatedto the measurement characteristics of NELS:88 items. It includes meta-analyses of factors related toconvergence of item pairs and to item nonresponse.
Technical Appendices are included at the end of the report to assist researchers who useNELS:88 data to apply the results of this report to their analyses.
Appendix A. Index of Measures and Univariate Unweighted Distributions provides aquick index to the NELS:88 measures examined in this report and information about the univariatedistribution of each of the items.

5
Appendix B. Recodings of Measures for Comparisons specifies the item recodings usedfor the purpose of comparing different items in this report. Items with similar content but differentresponse options, such as students' and parents' expectations for the student's occupation, requiredrecoding to construct meaningful comparisons.
Appendix C. Statistical Measures of Association and Omission Bias provides detailedspecifications of the measures of convergence and bias reported in this study.

6
7
Chapter 2Methodology
Overview
In most surveys, there is only one source of information for each measure, and as a result,there are severe limits on the evaluation of the items as measures. NELS:88, in contrast, hascollected multiple sources of information on many important constructs. Thus, NELS:88 providesa unique resource for evaluating the performance of survey items. Four main research questionsabout NELS:88 base year and follow-up survey measures are addressed in this report:
1. To what extent do responses to the same items vary by (a) different respondents or (b) thesame respondent over time?
2. How do individuals who omit an item differ from those who respond to it?
3. To what extent does variation in responses to the same item occur in particularsubpopulations of students?
4. How much of an impact does variation between sources in responses to the same itemhave on estimated relations with outcome measures?
Each of these questions can be addressed for a wide variety of items included in the NELS:88surveys. A series of uniform displays of particular measures was selected in order to provide the basisfor readers to compare the quality of responses across a variety of different items included in thesurveys. The following sections describe the measures used to address these four research questionsin chapter 3 of this report (for items in common to parent and student surveys), in chapter 4 (for itemsin common to teacher and student surveys), and in chapter 5 (for items presented to students in morethan one of the surveys).
1. To what extent do responses to the same items vary by (a) different respondents or(b) the same respondent over time?
The empirical basis for addressing this question is a cross-tabulation of responses from twosources. The simplest measure of convergence is the percentage of individuals for whom theresponses constitute an exact match. That measure has flaws, however, in that aspects of theresponse distribution that do not conceptually represent convergence can dramatically affect thepercent match. For example, an item in which a single response alternative is selected by a largepercentage of respondents, such as a question about language usually used in the home, to whichmost American parents and teenagers would respond “English,” or a question about whether thestudent had ever been suspended from school, to which most parents and teenagers would respond“no,” would exhibit a high percentage matching even if the responses from the two sources were

For example, if parent and student agree perfectly on an underlying concept, such as quality of teaching at the3
school, but have different threshold standards for “good”, so that 75 percent of parents respond “good” and 25 percent ofstudents respond “good”, the maximum value that the product-moment correlation can take on is 1/3, not 1. Thepolychoric correlation can take on the value 1 in this case (if no student responds “good” while her parent responds “notgood”).
8
unrelated. Also, breaking a variable into finer distinctions changes the measure—the larger thenumber of response categories, the smaller will be the expected percentage of exact matches. Forexample, the percentage match on expected education level would be lower if there were sevenresponse alternatives than if the responses were collapsed to three levels, even though level ofagreement on the construct was unchanged.
Therefore, although the percentage match is a meaningful concept for readers, anothermeasure that is relatively impervious to distortions caused by skewness and fineness of breakdownsis needed. The most commonly used quantitative measure of association between responses to twoitems is the Pearson product-moment correlation coefficient. If the responses can be codednumerically (e.g., assigned values such as 1, 2, 3, and 4, for never, rarely, frequently, and always) insuch a way that the ordering of the numbers matches the ordering of the response category labels,then this coefficient gives an index that is not severely distorted by skewness (if the skewness issimilar for both items) or by fineness of breakdowns. Values of a correlation coefficient greater than.80 might be said to indicate a high level of convergence between items; a coefficient between .40 and.80 might be said to indicate a moderate level of convergence; and values less than .40 indicate lowlevels of convergence—the pair of items are primarily tapping different sources of variation (either“measurement error” or different constructs).
For most items in NELS:88, response options are ordered in a natural way. In cases wherethey are not, an ordering can be developed. For example, occupations expected at age 30 can beordered on level of professional training required or on prestige; and language usually used in thehome can be collapsed into two categories: English or other. Therefore, a correlation coefficient isan appropriate measure of convergence for use in this examination of NELS:88 items.
The product-moment correlation coefficient is, however, distorted by differential skewness.Two respondents, parents and students for example, might tend to “use a different part of the scale,”because they have a different criterion for the construct (e.g., whether teaching in the school is good),but otherwise might agree perfectly (e.g., that teaching at one school is better than at another). Thatis, their responses represent the same underlying construct, but the response scale (i.e., the dividingline or lines between high and low categories) is shifted for one of the respondents relative to theother. The product-moment correlation coefficient is affected (i.e., reduced) by this shift ofthresholds, as well as by differences in agreement about the construct . To separate the effects of3
such a shift, or differential skewness, from the effects of lack of convergence on the construct,another measure is needed.

(se / sd) 1 r
In terms used in other data quality reports, such as A Study of Nonsampling Errors in the 1991 Survey of Recent4
College Graduates 1991 (Brick et al. 1994), measurement error is the square root of the “simple response variance”(SRV). However, other data quality reports have not used the polychoric estimate of the underlying correlation.
9
One such measure is the polychoric correlation coefficient, which is the correlationassociated with the bivariate normal distribution that matches the two observed marginal distributionsand best fits the observed bivariate response frequencies (Drasgow 1984). In the special case inwhich the two measures are both dichotomies, the polychoric correlation is the well-knowntetrachoric correlation. The procedure for estimating the polychoric correlation is described inAppendix C. Two item pairs with the same underlying relation but different skewness can have verydifferent percentage matches but the same polychoric correlation. The polychoric correlationcoefficient, it should be noted, does not depend on the assignment of (interval-scale) numbers to theresponse alternatives, merely on their ordinality.
To complement the polychoric correlation coefficient, a measure is needed of the extent towhich responses to an item from two sources are shifted, relative to each other. In the present report,the mean score is computed for each measure, and differences are presented for mean scores; that is,differences in the mean (ordinal) position of response alternatives. For example, for athree-alternative item with relative response frequencies of .2, .3, and .5 for parents and .5, .3, .2 forstudents, the mean score for parents would be .2(1)+.3(2)+.5(3) = 2.3 and for students would be.5(1)+.3(2)+.2(3) = 1.7, for a difference of 2.3-1.7 = 0.6. If a researcher were to consider themeasure from one source (e.g., a parent) to be the construct of interest, this difference would beequivalent to the bias incurred by using the measure from the other source (e.g., a student) as theindicator.
When a measure is a dichotomy, such as whether English is the teenager’s native language,the responses are scored as 1 (yes) and 0 (no), or the reverse. This means, for example, that if 70percent of the respondents reply “yes” and 30 percent respond “no,” then the mean response scoreis .70. Tabular presentations in this report uniformly display mean scores and differences in means;but when appropriate, these are discussed in the text as differences in percentages of responses ofparticular types.
Another measure of convergence that would be appropriate if the measures from two sourceswere considered only as two separate imperfect measures of the same underlying construct is the rootmean squared error of measurement, or measurement error, sometimes referred to as the standarderror of measurement. If two measures of the same construct are observed and measured on the4
same scale, measurement error can be estimated from the correlation between the two separatemeasures. If both measures are assumed to share equally the measurement error, the ratio of thestandard error of measurement, se, to the overall standard deviation of the distribution of responses,sd, is equal to the square root of 1 minus the correlation coefficient: . Forexample, if the correlation coefficient is 0.75, then the standard error of measurement is one half of

0.5 1 0.75
(se / sd) 1 r 2
10
the overall standard deviation ( ). In this terminology, r is the reliability of themeasure(s). On the other hand, if one measure is assumed to be the underlying construct (i.e., thecriterion measure), the relation is .
The concept of measurement error carries with if the notion of an equal interval scale, whichis not appropriate for many ordinal survey items. Furthermore, the concept is not appropriate for twomeasures that are considered as measuring different but related constructs. Therefore, this reportpresents correlations, rather than measurement errors. In summary, the three statistics— polychoriccorrelation, percentage match, and mean difference—provide the basic summary data to address thefirst research question.
2. How do individuals who omit an item differ from those who respond to it?
Next, this report examines whether there is substantial nonresponse bias in variables on theNELS:88 file. To the extent that individuals fail to respond to items on the survey, there is potentialfor bias in population estimates based on the sample survey: individuals who fail to respond may differfrom respondents on the construct measured by the item. One check on the potential for nonresponsebias is the percentage of omissions. If the percentage of omissions is very low (e.g., less than 5percent), then nonresponse bias is probably not severe. However, if the percentage of omissions ismoderate or higher, estimates based only on respondents may or may not be biased. A simpleexamination of the percentage of missing data is not sufficient, because the impact of missing datadepends on whether nonrespondents would have responded differently from respondents. Ifnonrespondents have the same distribution of characteristics as respondents, then there is nononresponse bias.
Normally, it is very difficult to estimate how nonrespondents might have responded to asurvey item they omit. However, NELS:88 possesses data that are unusually effective for addressingthe omission bias issue—those items whose convergence is studied in this report. To the extent thatthere is convergence, responses from one source can be used to provide insights into the responsetendencies of the other source, whether or not the other source responded. For example, if parentsof students who leave an item blank about drug use in school indicate that they think their teenagermay have a drug problem more frequently than parents of students who respond to the item do, onecan infer that omission by students is at least a weak indicator of drug use in school. The assumptionstill must be made, of course, that nonrespondents are similar to respondents who have matchedresponses from another source; but that assumption is easier to accept than an assumption that theyare similar based on arbitrary other variables, such as race/ethnicity, sex, and socioeconomic status(SES).
Missing data on an item can arise either because a selected individual fails to return aquestionnaire or because he or she returns a questionnaire leaving that item blank (or otherwiseunscorable). To adjust for failure to return a questionnaire, NELS:88 identifies similar cases in thesample and reweights these cases to represent nonrespondents, thus reducing potential nonresponse

11
bias to the extent that the characteristics of matched respondents and nonrespondents are similar.Because the data analyzed in this report include only cases with a positive second follow-up panelweight (F2PNLWT), students’ failure to return a follow-up survey is not reflected in percentages ofmissing data. Specific item omission remains, however, and “omission bias” can occur when selectiveitem omission occurs. Moreover, parent and teacher failures to return a questionnaire are includedin missing data estimates in this report, because the corresponding student panel weights remaingreater than zero—other weights included in the NELS:88 database adjust for parent and teachernonresponse. In order to base all results in this report on the same set of cases, analyses of parentand teacher item omissions have not been restricted to parents and teachers who returnedquestionnaires.
Even when a survey instrument is available, data may be missing on some items because therespondent left an item out, refused to answer an item, marked multiple responses on a single-response item, or selected an “I don't know” option. In all of these cases, one can assume that theinformation that would have been conveyed in the response could have been valid. On the otherhand, some items may be missing because the item was inappropriate, as indicated by an explicit orimplicit skip pattern in the survey instrument. For this report, all of the cases except for legitimateskips are combined into a single category of “omission” because they all have the effect of potentiallybiasing research that ignores them.
In this report, the percentages of missing data are computed for selected variables, and thedifferences in distributions between nonrespondents and respondents on the same item from a secondsource are presented. These differences are referred to in the report as “omission bias.” For example,in comparing student and parent response, “parent omission bias” is estimated as the mean differencebetween responses of students whose parents omitted the item and responses of students whoseparents responded to the item. Conversely, “student omission bias” is estimated as the differencebetween responses of parents whose students omitted the item and responses of parents whosestudents responded to the item. The sizes of these differences, or estimates of “omission bias,” canbe compared to the sizes of differences found in other analyses of the quality of item responses, eitherbetween different sources or between population subgroups.
3. To what extent does variation in responses to the same item occur in particularsubpopulations of students?
Many research studies focus on a particular category of students, such as one sex, or one levelof SES, or students with particular proficiency levels. It may well be that the convergence of an itemdiffers between population groups. To take an obvious example, students with lower reading scorescan be expected to make more errors interpreting the survey items than students who obtain higherreading scores.
The number of potential comparisons is virtually unlimited. In order to provide a broadpicture of the amount of variation between population subgroups, a sample of critical dimensions that

12
would be likely to show such variation was selected. The major groupings of students and dropoutswere dichotomizations based on (a) the student's eighth grade reading score, (b) family SES, and (c)student sex. For comparisons with parent responses, two additional dichotomizations that might beexpected to affect family response differences on a survey about education were included: (d)whether the student attended a public or private school at the time of the survey and (e) whether theparent who responded was living in the home with the student all of the time. Similarly, forcomparisons with teacher responses, one additional dichotomization was included: (f) the subject ofthe course in which the teacher taught the student (mathematics or science).
Differences between population subgroups might be found on any of the measures used toaddress research questions 1 and 2, but to reduce the volume of statistics included in this report,variation in the performance of items between population subgroups was measured using three of themeasures used to address the first two questions: the polychoric correlation coefficient, meandifference, and percentage of missing student data. For each item analyzed, a three-part table isincluded, whose columns refer to the particular subpopulations. Each part of the table presentsresults for one of the three measures.
4. How much of an impact does variation in responses to the same items have on estimatedrelations with outcome measures?
The exceptional value of a multifaceted longitudinal survey like NELS:88 lies in the richnessof the data—the simultaneous availability of background data, experiential data, and outcome dataon the same representative sample of individuals. Policy questions can be sharply addressed byestimating the relations between background factors and experiences and between experiences andoutcomes. In this context, it is important for researchers to know the extent to which relationsobserved in the data are a function of the particular ways in which data were gathered, as opposedto a function of underlying constructs measured by the items on the survey.
Although students and parents may respond differently to an item, it may well be that bothare responding in ways that measure an underlying factor that affects some outcomes. That is, eventhough convergence may be low, the same relations to outcomes are observed, no matter whichsource is used. To put it simply—do the differences matter, for a particular research problem? Orcould one of the measures be substituted for the other if the need arose?
To address this question, a series of seven to ten “dependent” variables were selected, andsimple tests of hypotheses about the effects of variation on NELS:88 items on those dependentvariables were carried out, first using the NELS:88 item from one source, then using the item froma second source. For example, a student’s self-concept, measured in twelfth grade, might be expectedto be related to whether “teachers are interested in students,” and this can be tested using either thestudent’s or his/her parent’s ratings of whether teachers are interested in students. To the extent thatresults of such a test vary by the source of the rating information, researchers must restrict their

13
interpretations to “students’ [or parents’] perceptions that teachers are interested in students” and nottranslate measures of perceptions of interest into measures of actual interest.
The dependent measures used in these analyses include the student’s mathematics test scoresin grade 12 (F22XMTH); the academic difficulty of his/her high school program (F2RTRPRG);average grades in core courses (F2RHENG2, F2RMAG2, F2RHSG2, F2RHSOG2); enrollmentstatus (F2RTROUT); locus of control (F2LOCUS1) and self concept measures (F2CNCPT1);expected educational attainment (F2S43); and the socioeconomic index coding of the occupationexpected at age 30 (F2S64). Average grade in core courses was used rather than the overall gradepoint average, because examination of the overall measure reveals that it is an undifferentiatedaggregation of grades on a 4-point scale, a 100-point scale, and some other scales. For thecomparisons between student and teacher responses, enrollment status was not used; and forcomparisons between student and parent responses, mathematics scores in grades 8 and 10(BY2XMTH and F12XMTH) were also examined.
The statistical tests performed represent those that might occur in substantive research. Theitem whose convergence is of concern is used to create two groups (e.g., high vs. low ratings of thesafety of the school), first based on one source (e.g., the student response), then based on the othersource (e.g., the parent response). Two Student's t-tests are carried out, one for each of the responsesources; and tables are constructed to show when it makes a difference which source is used andwhen it does not (i.e., when either both or neither of the definitions of the group is significantlyrelated to the dependent variable). The t-tests make use of the appropriate sampling weights, in thiscase, F2PNLWT, and they take into account the complex sample design of NELS:88, as describedin Appendix C.
Selection of the Study Sample
Because this report is aimed at researchers who would use NELS:88 to study the longitudinalprogress of eighth graders through their next four years, all results presented in the report pertain toonly those students who were included in the NELS:88 base year and first and second follow-ups;that is, the set of students for whom the longitudinal panel weight (F2PNLWT) is greater than zero.These are the only students whose data have any impact on appropriate longitudinal analyses acrossthe high school years. This decision was made in order to limit the complexity of the report—readerswill find many questions to raise about the different results in this report without having to factor invariation in populations from one section to the next.
The primary groups omitted from this report by this decision are the base year ineligiblestudents (BYI), the freshened samples, students not followed-up, and students whose status becomesunknown in follow-ups. Because these groups are relatively small, it would be difficult to carry outseparate studies of the NELS:88 data quality for them. In addition, including them in some analysesbut not others would reduce the comparability of results presented in different sections of the report.
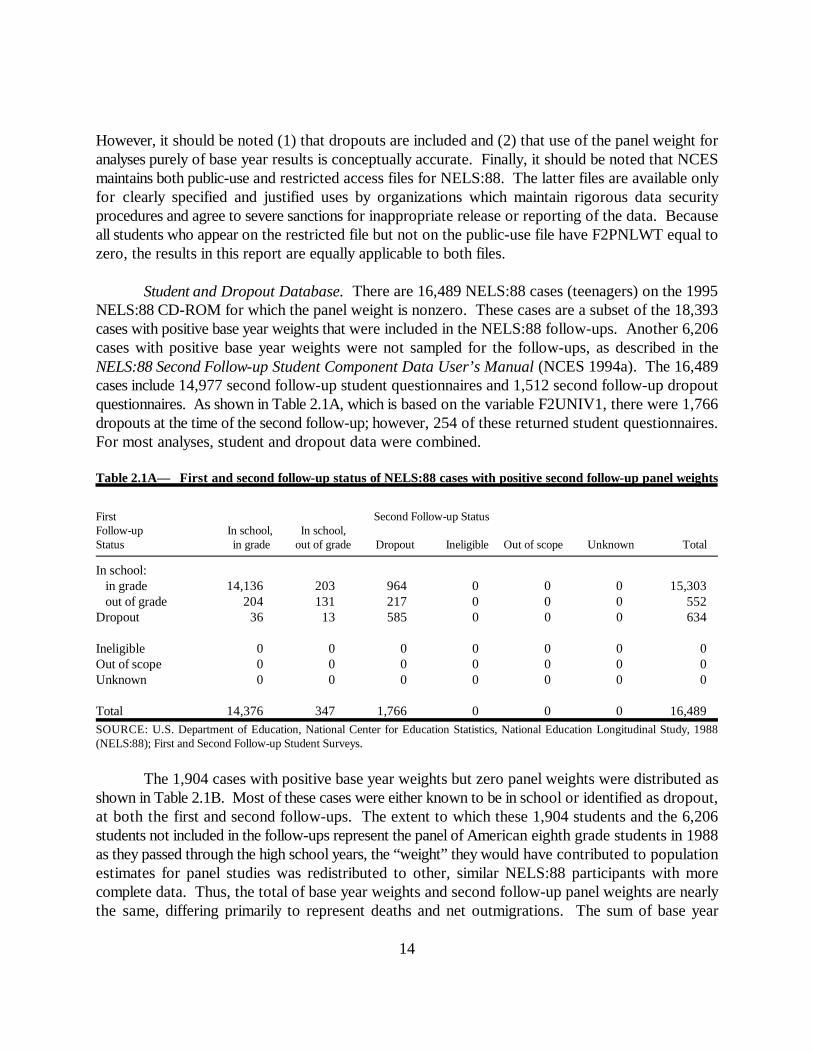
14
However, it should be noted (1) that dropouts are included and (2) that use of the panel weight foranalyses purely of base year results is conceptually accurate. Finally, it should be noted that NCESmaintains both public-use and restricted access files for NELS:88. The latter files are available onlyfor clearly specified and justified uses by organizations which maintain rigorous data securityprocedures and agree to severe sanctions for inappropriate release or reporting of the data. Becauseall students who appear on the restricted file but not on the public-use file have F2PNLWT equal tozero, the results in this report are equally applicable to both files.
Student and Dropout Database. There are 16,489 NELS:88 cases (teenagers) on the 1995NELS:88 CD-ROM for which the panel weight is nonzero. These cases are a subset of the 18,393cases with positive base year weights that were included in the NELS:88 follow-ups. Another 6,206cases with positive base year weights were not sampled for the follow-ups, as described in theNELS:88 Second Follow-up Student Component Data User’s Manual (NCES 1994a). The 16,489cases include 14,977 second follow-up student questionnaires and 1,512 second follow-up dropoutquestionnaires. As shown in Table 2.1A, which is based on the variable F2UNIV1, there were 1,766dropouts at the time of the second follow-up; however, 254 of these returned student questionnaires.For most analyses, student and dropout data were combined.
Table 2.1A— First and second follow-up status of NELS:88 cases with positive second follow-up panel weights
First Second Follow-up StatusFollow-up In school, In school,Status in grade out of grade Dropout Ineligible Out of scope Unknown Total
In school: in grade 14,136 203 964 0 0 0 15,303 out of grade 204 131 217 0 0 0 552Dropout 36 13 585 0 0 0 634
Ineligible 0 0 0 0 0 0 0Out of scope 0 0 0 0 0 0 0Unknown 0 0 0 0 0 0 0
Total 14,376 347 1,766 0 0 0 16,489SOURCE: U.S. Department of Education, National Center for Education Statistics, National Education Longitudinal Study, 1988(NELS:88); First and Second Follow-up Student Surveys.
The 1,904 cases with positive base year weights but zero panel weights were distributed asshown in Table 2.1B. Most of these cases were either known to be in school or identified as dropout,at both the first and second follow-ups. The extent to which these 1,904 students and the 6,206students not included in the follow-ups represent the panel of American eighth grade students in 1988as they passed through the high school years, the “weight” they would have contributed to populationestimates for panel studies was redistributed to other, similar NELS:88 participants with morecomplete data. Thus, the total of base year weights and second follow-up panel weights are nearlythe same, differing primarily to represent deaths and net outmigrations. The sum of base year

15
weights, which is an estimate of the number of Americans in eighth grade in 1988, is 3,008,080; andthe sum of NELS:88 second follow-up panel weights is 2,970,835.
Table 2.1B— First and second follow-up status of NELS:88 cases with positive base year weights and zero secondfollow-up panel weights
First Second Follow-up StatusFollow-up In school, In school,Status in grade out of grade Dropout Ineligible Out of scope Unknown Total
In school: in grade 611 30 177 4 72 157 1,051 out of grade 24 8 38 2 5 30 107Dropout 11 3 108 0 7 71 200
Ineligible 11 0 7 19 0 0 37Out of scope 9 1 15 0 56 15 96Unknown 302 14 57 1 1 38 413
Total 968 56 402 26 141 311 1,904
SOURCE: U.S. Department of Education, National Center for Education Statistics, National Education Longitudinal Study, 1988(NELS:88); First and Second Follow-up Student Surveys.
Parent Database. For the purpose of comparison of student responses to parent responses,the panel weight does not adjust for parent nonresponse (a different weight does). There were 1,370students in the panel sample whose parents were not included in the second follow-up survey.Parents of both students and dropouts were included in the analyses. For most analyses, student anddropout data were combined; however, the parent-student comparisons excluded dropouts for fouritems: ratings of schools, college planning factors, occupational expectations, and an item oneducation-related family discussions.
Teacher Database. The teacher sample included one mathematics or one science teacher foreach student who was (a) in the context sample, the sub-sample of high schools from which NCESgathered contextual data; and (b) enrolled in a mathematics or science course at the time of thesecond follow-up. Therefore, the sample size for analyses involving teacher measures is substantiallysmaller than for other analyses in this report. The data file contains data only from teachers who werepaired with a participating student, but because the data include records for students matched withteacher nonparticipants, teacher unit-level nonresponse can be identified along with item nonresponse.
The sample of students who might have corresponding teacher responses included 9,853records with teacher responses and 1,008 records with no teacher responses. Not all of the studentsrepresented in these 10,861 records participated in the second follow-up panel, however—9,832 ofthem are included. Table 2.2 summarizes the distribution of records.

16
Table 2.2— Number of students expected to have corresponding math and science teacher records, by teacherparticipation
Total Teacher Participants Teacher Nonparticipants
All 10,861 9,853 1,008In 2nd Follow-up panel 9,832 8,945 887
Math 5,819 5,304 515Science 4,013 3,641 372
SOURCE: U.S. Department of Education, National Center for Education Statistics, National Education Longitudinal Study, 1988(NELS:88); Teacher and Second Follow-up Student Surveys.
Because only slightly more than half of the students were included in the context sample forwhich teacher data were collected, there might be concern that the student-teacher responsecomparisons presented in this report do not represent the entire population of students in the cohort.To test this, values of key statistics were computed using both the panel weights (F2PNLWT) andthe context weights (F2CXTWT). Table 2.3 tabulates some key statistics using the panel weightsand context weights.
Table 2.3— Comparison of statistics using panel weights and context weights for some key statistics
Key Statistics Key StatisticsStudent Using Panel Using ContextCharacteristics Weights Weights
Percentage male (F2SEX) 50.2 50.8Race (F2RACE1, percentage)
Asian/Pacific Islander 3.6 4.3Hispanic 10.4 10.4Black, non-Hispanic 13.1 12.6White, non-Hispanic 71.5 71.5American Indian 1.4 1.2
SES composite (F2SES2, mean) 0.00 0.08Parents’ education (F2PARED, mean)3.02 3.12PSAT score available (F2RPSATV,M percentage) 25.7 31.6Standardized test composite (F22XCOMP, mean) 50.60 50.94SOURCE: U.S. Department of Education, National Center for Education Statistics, National Education Longitudinal Study, 1988
(NELS:88); Second Follow-up Parent and Student Surveys.
For the most part, this table reveals only small differences in the key statistics using the panelweights and the context weights. Therefore, the results presented in this report, which are notweighted to represent students not included in the context sample in the student-teacher comparisons,are meaningful.
Sample Sizes of Comparison Subpopulations. The numbers of cases in the subpopulationgroups for which item comparisons were made are shown in Table 2.4. The numbers of cases werebalanced except for (a) whether the parent respondent was living in the home with the student all ofthe time and (b) whether the student was enrolled in a public or private school. The sums are less
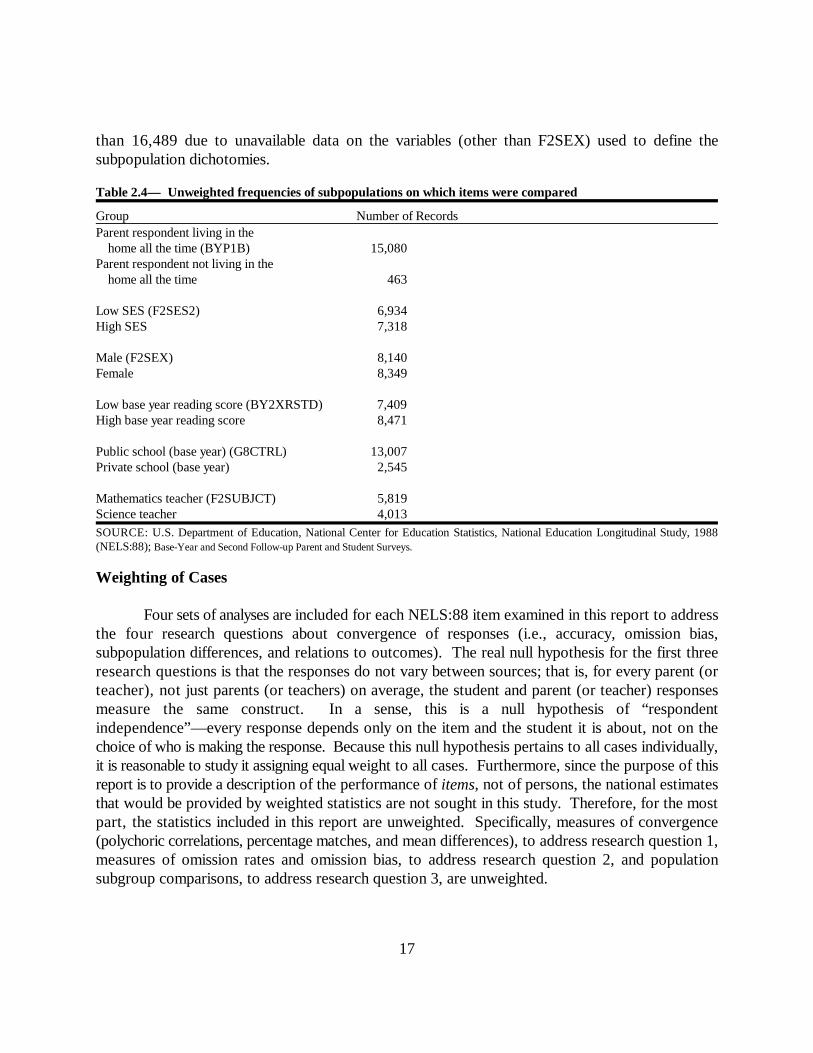
17
than 16,489 due to unavailable data on the variables (other than F2SEX) used to define thesubpopulation dichotomies.
Table 2.4— Unweighted frequencies of subpopulations on which items were compared
Group Number of RecordsParent respondent living in the
home all the time (BYP1B) 15,080Parent respondent not living in the
home all the time 463
Low SES (F2SES2) 6,934High SES 7,318
Male (F2SEX) 8,140Female 8,349
Low base year reading score (BY2XRSTD) 7,409High base year reading score 8,471
Public school (base year) (G8CTRL) 13,007Private school (base year) 2,545
Mathematics teacher (F2SUBJCT) 5,819Science teacher 4,013SOURCE: U.S. Department of Education, National Center for Education Statistics, National Education Longitudinal Study, 1988(NELS:88); Base-Year and Second Follow-up Parent and Student Surveys.
Weighting of Cases
Four sets of analyses are included for each NELS:88 item examined in this report to addressthe four research questions about convergence of responses (i.e., accuracy, omission bias,subpopulation differences, and relations to outcomes). The real null hypothesis for the first threeresearch questions is that the responses do not vary between sources; that is, for every parent (orteacher), not just parents (or teachers) on average, the student and parent (or teacher) responsesmeasure the same construct. In a sense, this is a null hypothesis of “respondentindependence”—every response depends only on the item and the student it is about, not on thechoice of who is making the response. Because this null hypothesis pertains to all cases individually,it is reasonable to study it assigning equal weight to all cases. Furthermore, since the purpose of thisreport is to provide a description of the performance of items, not of persons, the national estimatesthat would be provided by weighted statistics are not sought in this study. Therefore, for the mostpart, the statistics included in this report are unweighted. Specifically, measures of convergence(polychoric correlations, percentage matches, and mean differences), to address research question 1,measures of omission rates and omission bias, to address research question 2, and populationsubgroup comparisons, to address research question 3, are unweighted.
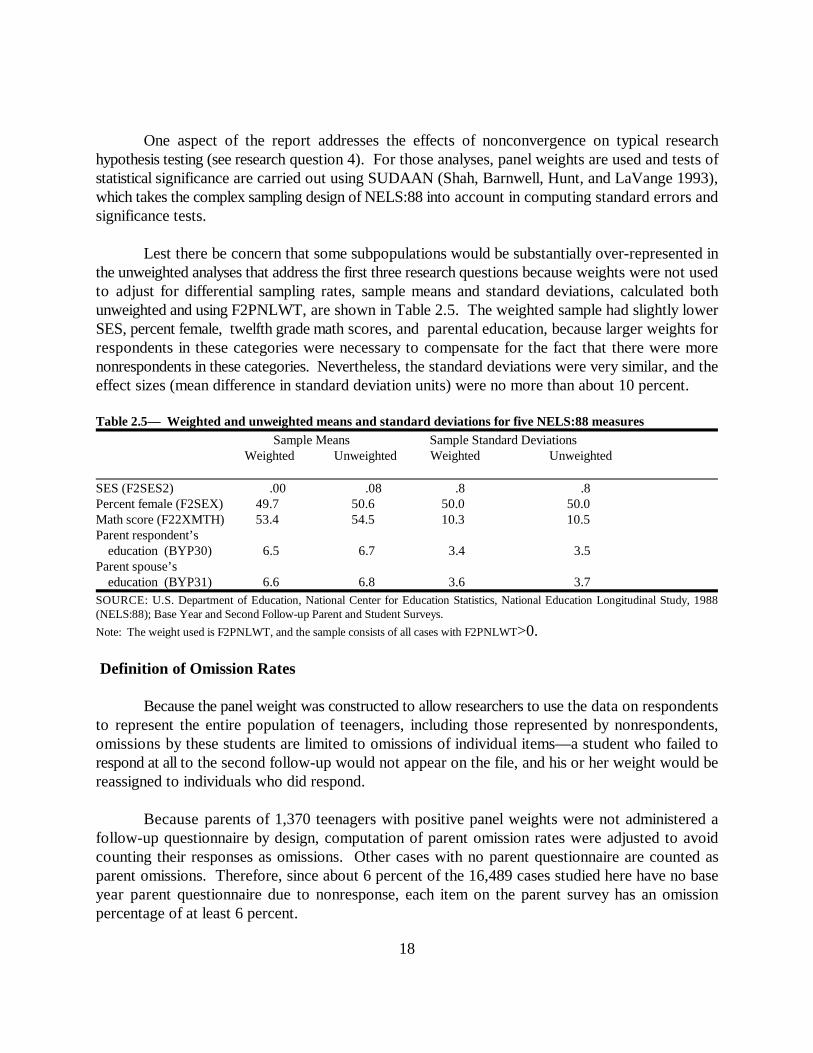
18
One aspect of the report addresses the effects of nonconvergence on typical researchhypothesis testing (see research question 4). For those analyses, panel weights are used and tests ofstatistical significance are carried out using SUDAAN (Shah, Barnwell, Hunt, and LaVange 1993),which takes the complex sampling design of NELS:88 into account in computing standard errors andsignificance tests.
Lest there be concern that some subpopulations would be substantially over-represented inthe unweighted analyses that address the first three research questions because weights were not usedto adjust for differential sampling rates, sample means and standard deviations, calculated bothunweighted and using F2PNLWT, are shown in Table 2.5. The weighted sample had slightly lowerSES, percent female, twelfth grade math scores, and parental education, because larger weights forrespondents in these categories were necessary to compensate for the fact that there were morenonrespondents in these categories. Nevertheless, the standard deviations were very similar, and theeffect sizes (mean difference in standard deviation units) were no more than about 10 percent.
Table 2.5— Weighted and unweighted means and standard deviations for five NELS:88 measuresSample Means Sample Standard Deviations
Weighted Unweighted Weighted Unweighted
SES (F2SES2) .00 .08 .8 .8Percent female (F2SEX) 49.7 50.6 50.0 50.0Math score (F22XMTH) 53.4 54.5 10.3 10.5Parent respondent’s
education (BYP30) 6.5 6.7 3.4 3.5Parent spouse’s
education (BYP31) 6.6 6.8 3.6 3.7SOURCE: U.S. Department of Education, National Center for Education Statistics, National Education Longitudinal Study, 1988(NELS:88); Base Year and Second Follow-up Parent and Student Surveys.
Note: The weight used is F2PNLWT, and the sample consists of all cases with F2PNLWT>0.
Definition of Omission Rates
Because the panel weight was constructed to allow researchers to use the data on respondentsto represent the entire population of teenagers, including those represented by nonrespondents,omissions by these students are limited to omissions of individual items—a student who failed torespond at all to the second follow-up would not appear on the file, and his or her weight would bereassigned to individuals who did respond.
Because parents of 1,370 teenagers with positive panel weights were not administered afollow-up questionnaire by design, computation of parent omission rates were adjusted to avoidcounting their responses as omissions. Other cases with no parent questionnaire are counted asparent omissions. Therefore, since about 6 percent of the 16,489 cases studied here have no baseyear parent questionnaire due to nonresponse, each item on the parent survey has an omissionpercentage of at least 6 percent.

19
Teacher omission rates were based only on the 9,832 second follow-up panel students in thesample for whom teacher data were planned to be collected. Of these, 887 teachers failed to returna questionnaire at the second follow-up. As a result, omission rates for teachers were all at least 9percent.

20

See Chapter 2 for an explanation of analysis and usage of polychoric correlations as a measure of convergence5
between paired items.
21
Chapter 3
Comparison of Parent and Student Responses
A great deal of research has focused on the role of the family in a child’s educational progress,and NELS:88 has supplemented this research with an extensive parent questionnaire. Both parentsand students were asked for information about family factors that have been hypothesized to affecteducational outcomes in order to provide a sound empirical basis for valid and reliable educationalresearch and policy analysis. The items on the parent and student questionnaires were distinct butoverlapping. They ranged from objective information, such as what language was spoken mostfrequently in the household; to perceptions about family interactions and school; to plans, aspirations,and expectations related to college and career. As shown in this chapter, which compares parent andstudent responses related to these topics, the convergence of item responses by parents and studentsvaries from very high to very low.
Number of Siblings
In the base year survey, both parents and students were asked to indicate the number ofsiblings of the eighth grade student who was participating in NELS:88. Although the questions hadsimilar meaning, they were not identical:
Parent Question3A (BY) We would like to know how many brothers and sisters your eighth
grader has. Please consider all siblings, including half- and step- andadoptive brothers and sisters.
Student Question32A (BY) How many brothers and sisters do you have? Please include any
stepbrothers and/or stepsisters if they live or have lived in your home.
In both surveys, the respondent indicated None, One, Two, Three, Four, Five, or Six or more. Items4 (parent) and 33 (student) also asked about the number of older siblings.
The results from unweighted comparisons of parent and student responses for cases withpositive second follow-up panel weights are shown in Table 3.1A. The polychoric correlations werehigh for total siblings and older siblings (.89 and .92, respectively); and the raw percentages ofmatched responses were 84.1 percent and 87.7 percent. Over half of the remainder (an additional5
9.8 percent and 7.7 percent) differed by one in one direction or the other. Differences of one might

22
be due to careless responses, including the student in a count of the children in the family, by eitherthe student or the parent. In addition, the item presented to students had an additional printedqualifier—living in the home—so students were not instructed to count step-siblings living in aseparate home whereas parents were. Nevertheless, there was virtually no overall bias in source ofresponse: the average number of siblings was 2.23 according to either source, the average numberof older siblings was 1.21 according to parents, and 1.27 according to students; a small but significantdifference [t=-8.53]. It should be noted that the two mean responses shown in Table 3.1A areunweighted and are based on the same cases (i.e., those for which both sources are nonmissing).
Table 3.1A— Comparison of parent and student responses to items about numbers of siblings
Number of Polychoric Percent Mean Parent Mean Student Parent-StudentResponse Pairs Correlation Match Response Response Difference
Siblings 15,239 .886 84.1 2.23 2.23 .000Older siblings 14,157 .924 87.7 1.21 1.27 -.052SOURCE: U.S. Department of Education, National Center for Education Statistics, National Education Longitudinal Study, 1988(NELS:88); Base Year Parent and Student Surveys.
As unweighted statistics in Table 3.1B indicate, 99 percent of students responded to theseitems, and 92 to 93 percent of parents responded to them. Since about 6 percent of parents failedto return a questionnaire, the percentage who omitted these specific items was small, similar to thestudent omission percentage. With 7 percent parent omissions, the question arises of whetherstudents with missing parent responses had more or fewer siblings than students whose parentsanswered the item. As indicated in the column labeled “parent omission bias,” the average responseof students whose parents failed to return a questionnaire or omitted the item on number of siblingswas .253 greater than the response of other students. On average, according to data from thestudents, about one-quarter of the nonresponding parents had one more child than responding parentsdid, on average. Over the whole sample (unweighted), assuming that very few NELS:88 families hadmore than six children, this would create a nonresponse bias of .253 times 7 percent, or about .02siblings per respondent, if the parent data were used. The “parent omission bias” for the second item,number of older siblings, is much smaller (.020) and suggests that parents who omitted this itemprobably had about as many children older than the NELS:88 student as those who responded.Finally, because student omissions were rare, student omission bias is not a critical problem.
Table 3.1B— Comparison of parent and student nonresponse rates to items about numbers of siblings
Percent Student Student Percent Parent ParentOmissions Omission Bias Omissions Omission Bias
Siblings .6 .421 7.0 .253Older siblings 1.1 -.642 7.8 .020SOURCE: U.S. Department of Education, National Center for Education Statistics, National Education Longitudinal Study, 1988(NELS:88); Base Year Parent and Student Surveys.

23
If either nonmatch or nonresponse were located in some particular subpopulation, it couldaffect research results focusing on that group. The relative frequencies of these differential responsesamong different types of student-parent combinations are shown in Table 3.1C, which displays threeof the measures shown in Tables 3.1A and 3.1B, broken out by subgroup. The high correlationsbetween parent and student counts of numbers of siblings appear to be fairly uniform, with thesmallest polychoric correlation being .85. However, the correlations were somewhat higher for thefollowing subpopulations compared to their counterparts in Table 3.1C: high SES students [t=6.06],students with high reading scores [t=7.20], and private school students [t=4.99]. The only noticeablevariation in response among subpopulations was that the mean count of older siblings by the parentrespondent was slightly lower than by the student in the low reading [t=3.62] and low SES [t=3.73]subpopulations. Student nonresponse rates to these items were low in all groups, the highestfrequency of nonresponse being 2.2 percent, for counts of older siblings by students who did not livewith the parent respondent all of the time [t=2.51]. (Each Student’s t test is for the comparison withthe complementary subsample.)
Table 3.1C— Response characteristics on items about numbers of siblings, for population subgroups
Student Lives With 8th GradeParent Respondent SES Sex Reading School
All the time Not all the time Low High Male Female Low High Public Private
Polychoric CorrelationsSiblings .89 .85 .86 .91 .88 .89 .85 .91 .88 .92
a a a
Older siblings .92 .90 .91 .94 .91 .93 .90 .94 .92 .95a a a
Differences in Mean CountSiblings .00 -.01 .00 .01 -.01 .01 -.03 .03 .00 -.02Older siblings -.04 -.06 -.06 -.01 -.05 -.05 -.10 -.01 -.05 -.04
Pct. Student NonresponseSiblings .6 .6 .9 .4 .8 .5 .7 .3 .7 .2Older siblings 1.0 2.2 1.2 1.0 1.0 1.2 .7 1.0 .9 1.5
(a) A few high correlations are based on a Pearson correlation approximation. In those few cases in which the Pearson correlation was closeto 1.0, the polychoric correlation computation in SAS failed to converge for a subpopulation, although it did converge for the total. In thosecases, the approximation (1 - R ) x ((1 - R ) / (1 - R )) was used for (1 - R ). The2 2 2 2
(Pearson) subpopulation (polychoric) total (Pearson) total (polychoric) subpopulation
Pearson approximation was accurate for cases for which the computation converged.SOURCE: U.S. Department of Education, National Center for Education Statistics, National Education Longitudinal Study, 1988(NELS:88); Base Year Parent and Student Surveys.
Number of siblings and number of older siblings have been hypothesized as important factorsin various models of educational achievement. Table 3.1D displays the significance of differencesbetween students with either fewer than three siblings, or with no older siblings, and other studentson twelfth grade mathematics scores and other outcome measures. (The NELS:88 variables used foroutcome measures are specified in Chapter 2.) There are nine potential entries in the table:
P+ parent item shows a significant positive relation P parent item shows a significant negative relation S+ student item shows a significant positive relation S student item shows a significant negative relation

24
+ both items show a significant positive relation both items show a significant negative relation PS+ parent item shows a significant negative relation, student item shows a
positive relationP+S parent item shows a significant positive relation, student item shows a
negative relationship.. neither source shows a significant relation
The significance of the relation was based, in each case, on a Student’s t-test, between “high” and“low” on the number of siblings (or number of older siblings), using the indicated NELS:88 measureas the dependent variable. In testing a hypothesis, “significance” refers to the unlikelihood (p < .05)of the observed differences in means between “high” and “low” groups if the null hypothesis that thetwo groups have the same mean were true. For these t-tests, appropriate adjustments for designeffects were implemented and differential case weights were taken into account, using SUDAAN;however, each was treated as a single test, with no adjustment for multiple tests, because the entriesin the table were to be considered predictive of what researchers might find if they were studying aparticular phenomenon, not as the basis for substantive inferences based on their inclusion in thisreport on survey item response quality.
The number of siblings was dichotomized between 2 and 3, and the number of older siblingswas dichotomized between 0 and 1. The negative signs in Table 3.1D indicate that the relationsbetween having more than two siblings or at least one older sibling and various outcomes weresignificantly negative.
Table 3.1D— Statistically significant associations of sibling counts, based on parent and student responses, withselected NELS:88 outcomes
8th 10th 12th Educ. Occu- Course Grade Locus Self- Enroll-Grade Grade Grade Aspr.& pation Diffi- Point of Con- mentMath Math Math Expect Expect culty Avg. Control cept Status
Siblings (3+) .. Older sibling (1+) S S .. .. S Note: “+” and “-” refer to the direction of relation, P and S indicate that the relation is significant only for data from that source (parentor student), and “. .” indicates that no significant relation was found.SOURCE: U.S. Department of Education, National Center for Education Statistics, National Education Longitudinal Study, 1988(NELS:88); Base Year, First Follow-up, and Second Follow-up Parent and Student Surveys.
As can be seen in the table, the effects of having at least three siblings are negative for the same 9 of10 dependent measures whether counts are from parents or students. The results were more mixedwhen the measure was the number of older siblings. For three of the measures—current enrollmentstatus (i.e., not being a dropout), educational attainment expectations, and prestige rating of theexpected occupation—the student-based indicator that there was an older sibling was significant (thethree Student’s t-values for differences between the groups with one or more versus no older siblingsranged from -2.0 to -3.0), while the parent-based indicator was not (Student’s t-values ranged from
25
-1.0 to -1.5). Because the sample sizes for parent and student data were nearly the same, it appearsthat whatever the difference in parent and student responses, the student’s perception is more closelyrelated to aspects of educational achievement. This does not indicate that the parent-based indicatorhas “error,” only that its variation includes factors unrelated to the student’s progress (e.g., inclusionof children from other marriages with whom the student has not lived).
In sum, researchers can be confident about using the responses provided by either parents orstudents to NELS:88 items related to sibling counts. The measures of convergence and match arehigh, the levels of nonresponse are low, and relations with outcomes appear to be generallyconsistent.
Student Jobs
A second objective question that was asked of both parents and students concerned whether,and when, the student had held a job. The items, which were asked on the second follow-up, were:
Parent Questions71 (F2) Has your teen ever worked for pay?
72 (F2) When did your teenager last work for pay, not counting work aroundthe house? (IF YOUR TEENAGER IS CURRENTLY WORKING,PLEASE ENTER THE CURRENT MONTH AND YEAR.)
73 (F2) When did your teenager start working at the job in which he/she lastworked for pay?
Student Questions86A (F2) Have you ever worked for pay, not counting work around the
house?
86B (F2) When did you last work for pay, not counting work around the house?
87 (F2) When did you start your current or most recent job?
For the parent, the first of these questions was simply “yes-no,” with a skip-pattern omitting the nexttwo questions if the parent replied “no” to item 71. For the student, a skip pattern based on theresponse to item 86A omitted item 86B if the student indicated that he/she was currently working.For these analyses, “yes” was recoded as 1 and “no” as 0. The response alternatives for the time ofstarting and stopping the job were discrete years and months; the year and month responses areanalyzed separately here.

The difference between 1990.65 and 1990.87 refers to the fact that more parents than students reported a later6
year (e.g., 1991) and does not indicate that they reported a later time in 1990. The responses to the “month”items indicate the average time of year given as a response.
26
For the question of whether the student had held a job, there was substantial, although nothigh, convergence: a polychoric correlation of .65 and an overall agreement of 88.1 percent as shownin Table 3.2A. Slightly more parents (90 percent) than students (87 percent) indicated that the studenthad held a job [t=11.44].
Table 3.2A— Comparison of parent and student responses to items about student jobs
Number of Polychoric Percent Mean Parent Mean Student Parent-StudentResponse Pairs Correlation Match Response Response Difference
Ever worked 12,774 .652 88.1 0.90 0.87 .035Year started last job 8,819 .458 50.6 1990.87 1990.65 .216Month started last job 8,996 .320 29.3 6.31 6.46 -.152Year last worked 3,831 .307 44.1 1991.53 1991.01 .520Month last worked 3,870 .195 22.3 7.24 7.08 .164Note: For purposes of consistency across all tabular analyses in this report, data on years and months are reported as numerical means.SOURCE: U.S. Department of Education, National Center for Education Statistics, National Education Longitudinal Study, 1988(NELS:88); Second Follow-up Parent and Student Surveys.
There was noticeably less agreement concerning the exact month and year that the studenthad last worked or had started the most recent job. First, students who were currently working leftthe “last worked” question blank, per instructions, while parents responded with the “current monthand year” per instructions. Thus, fewer than half as many students were included in analyses of the“when last worked” question as in the analyses of the “when started job” question. With theexception of a polychoric correlation of .46 for the year started work, the convergence of these itemswas low (i.e., .31 for the last year worked, .32 for the month started, and .20 for the last monthworked). The mean year started was estimated to be 1990.87, according to parents, versus1990.65 , according to students; and the mean year last worked was 1991.53, according to parents,6
versus 1991.01, according to students. The estimated year last worked, according to parents,included parent responses for students who were currently working at the time the survey wasconducted, while the estimate for students did not. The modal month started (not shown in Table3.2A) was June, according to both parents and students, and the modal month last worked wasAugust, according to both students and those parents whose students indicated that they had stoppedworking.
A substantial percentage of students omitted these items, as shown in Table 3.2B, andalthough few parents who returned a questionnaire omitted the item on whether the student had everworked for pay, many omitted the items specifying dates. The omission rates for dates are probablysufficient to introduce noticeable bias, because parents’ reports were of somewhat later years (.139and .113) for students who omitted the items.
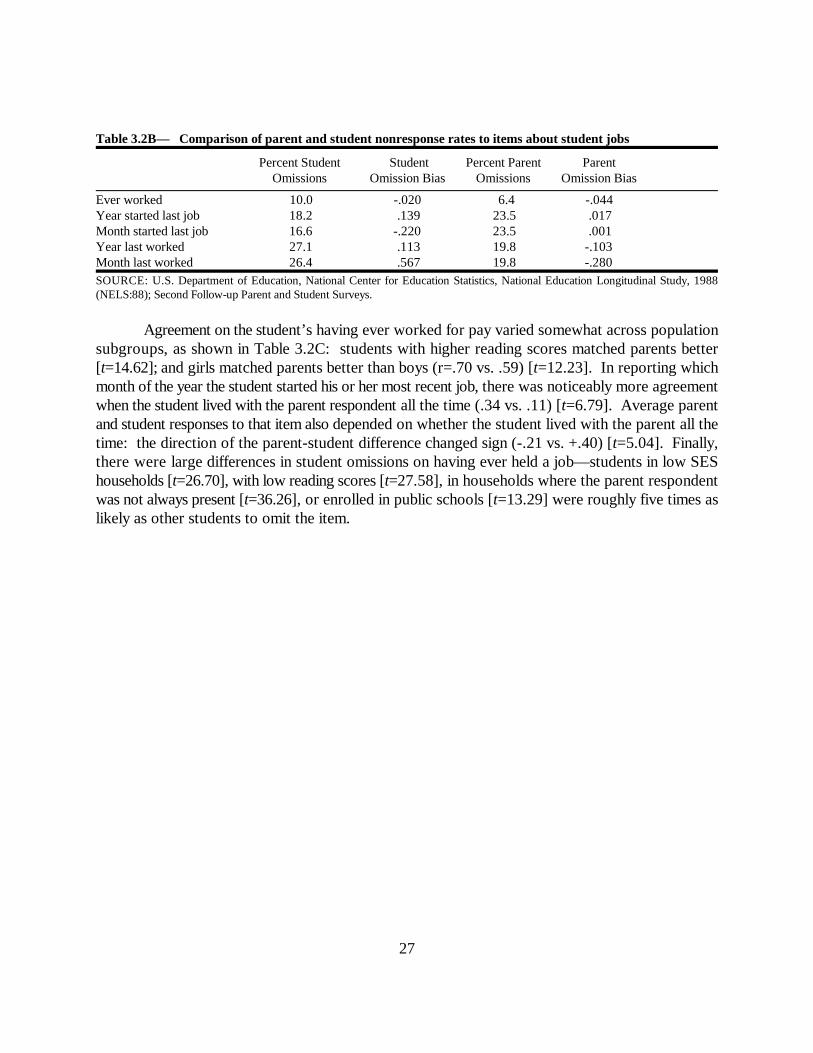
27
Table 3.2B— Comparison of parent and student nonresponse rates to items about student jobs
Percent Student Student Percent Parent ParentOmissions Omission Bias Omissions Omission Bias
Ever worked 10.0 -.020 6.4 -.044Year started last job 18.2 .139 23.5 .017Month started last job 16.6 -.220 23.5 .001Year last worked 27.1 .113 19.8 -.103Month last worked 26.4 .567 19.8 -.280SOURCE: U.S. Department of Education, National Center for Education Statistics, National Education Longitudinal Study, 1988(NELS:88); Second Follow-up Parent and Student Surveys.
Agreement on the student’s having ever worked for pay varied somewhat across populationsubgroups, as shown in Table 3.2C: students with higher reading scores matched parents better[t=14.62]; and girls matched parents better than boys (r=.70 vs. .59) [t=12.23]. In reporting whichmonth of the year the student started his or her most recent job, there was noticeably more agreementwhen the student lived with the parent respondent all the time (.34 vs. .11) [t=6.79]. Average parentand student responses to that item also depended on whether the student lived with the parent all thetime: the direction of the parent-student difference changed sign (-.21 vs. +.40) [t=5.04]. Finally,there were large differences in student omissions on having ever held a job—students in low SEShouseholds [t=26.70], with low reading scores [t=27.58], in households where the parent respondentwas not always present [t=36.26], or enrolled in public schools [t=13.29] were roughly five times aslikely as other students to omit the item.
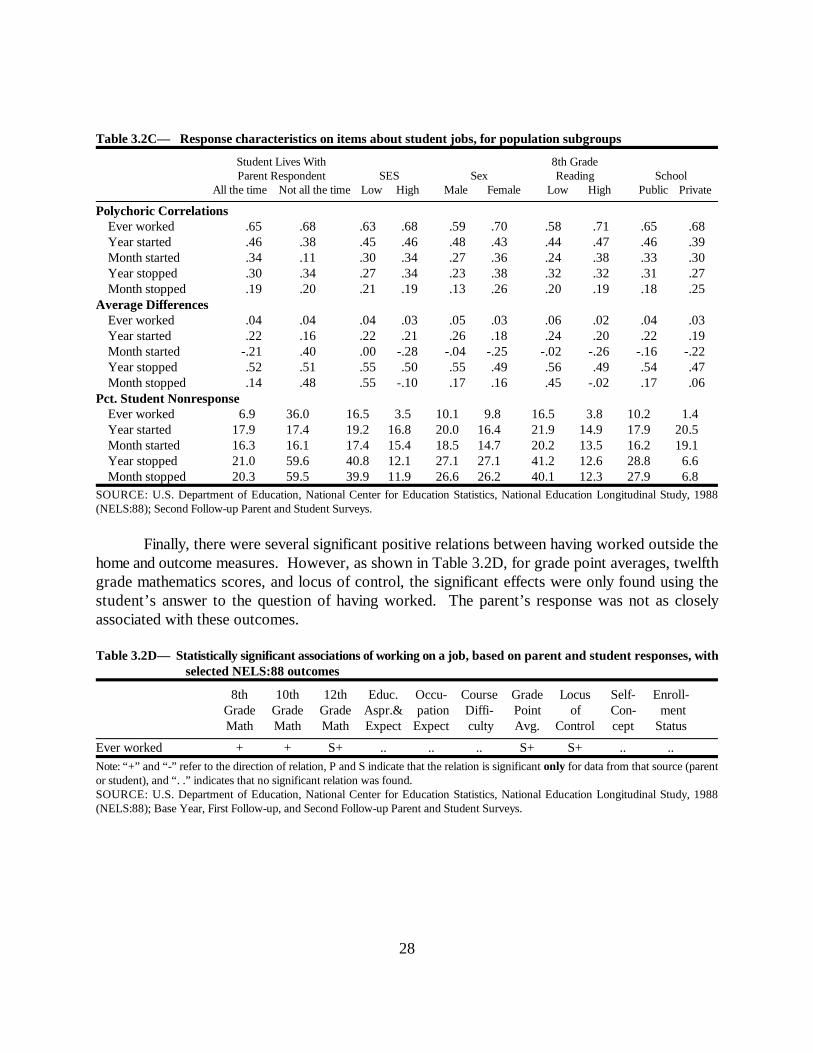
28
Table 3.2C— Response characteristics on items about student jobs, for population subgroups
Student Lives With 8th GradeParent Respondent SES Sex Reading School
All the time Not all the time Low High Male Female Low High Public Private
Polychoric CorrelationsEver worked .65 .68 .63 .68 .59 .70 .58 .71 .65 .68Year started .46 .38 .45 .46 .48 .43 .44 .47 .46 .39 Month started .34 .11 .30 .34 .27 .36 .24 .38 .33 .30Year stopped .30 .34 .27 .34 .23 .38 .32 .32 .31 .27Month stopped .19 .20 .21 .19 .13 .26 .20 .19 .18 .25
Average DifferencesEver worked .04 .04 .04 .03 .05 .03 .06 .02 .04 .03Year started .22 .16 .22 .21 .26 .18 .24 .20 .22 .19Month started -.21 .40 .00 -.28 -.04 -.25 -.02 -.26 -.16 -.22Year stopped .52 .51 .55 .50 .55 .49 .56 .49 .54 .47Month stopped .14 .48 .55 -.10 .17 .16 .45 -.02 .17 .06
Pct. Student NonresponseEver worked 6.9 36.0 16.5 3.5 10.1 9.8 16.5 3.8 10.2 1.4Year started 17.9 17.4 19.2 16.8 20.0 16.4 21.9 14.9 17.9 20.5Month started 16.3 16.1 17.4 15.4 18.5 14.7 20.2 13.5 16.2 19.1Year stopped 21.0 59.6 40.8 12.1 27.1 27.1 41.2 12.6 28.8 6.6Month stopped 20.3 59.5 39.9 11.9 26.6 26.2 40.1 12.3 27.9 6.8
SOURCE: U.S. Department of Education, National Center for Education Statistics, National Education Longitudinal Study, 1988(NELS:88); Second Follow-up Parent and Student Surveys.
Finally, there were several significant positive relations between having worked outside thehome and outcome measures. However, as shown in Table 3.2D, for grade point averages, twelfthgrade mathematics scores, and locus of control, the significant effects were only found using thestudent’s answer to the question of having worked. The parent’s response was not as closelyassociated with these outcomes.
Table 3.2D— Statistically significant associations of working on a job, based on parent and student responses, withselected NELS:88 outcomes
8th 10th 12th Educ. Occu- Course Grade Locus Self- Enroll-Grade Grade Grade Aspr.& pation Diffi- Point of Con- mentMath Math Math Expect Expect culty Avg. Control cept Status
Ever worked + + S+ .. .. .. S+ S+ .. ..
Note: “+” and “-” refer to the direction of relation, P and S indicate that the relation is significant only for data from that source (parentor student), and “. .” indicates that no significant relation was found.SOURCE: U.S. Department of Education, National Center for Education Statistics, National Education Longitudinal Study, 1988(NELS:88); Base Year, First Follow-up, and Second Follow-up Parent and Student Surveys.
Question 23 refers to question 23 on the second follow-up parent survey (F2), not question 23 above, which is7
from the base year parent survey (BY). Parents’ follow-up question 23 asks for the respondent’s native language.
29
Use of Non-English Languages
A third objective item that was asked of both parents and students concerned the use of non-English languages in the home. Different aspects of this question were asked at the base year andsecond follow-up. The items analyzed were:
Parent Questions22A (BY) Is any language other than English spoken in your home?
23 (BY) What is the main language people in your home usually speak? (12specific options, plus “other”)
24B (F2) How often is the language you referred to in question 23 used with7
<your child/children>? (Always or most of the time, About half ofthe time, Sometimes, or Never)
Student Questions21 (BY) Is any language other than English spoken in your home?
22 (BY) What language do people in your home USUALLY speak? (12specific options, plus “other”)
108A,B (F2) How often do you use your native language with <yourmother (A), your father (B)> (Always or most of the time,About half of the time, Sometimes, or Never)
Because the second follow-up parent question (F2P24B) only asked about language use bythe respondent, not his or her spouse, the choice of which second follow-up student question(F2S108A or B) to match to the parent response depended on whether the respondent was father orstepfather, or mother or stepmother. Agreement was assessed separately for those students whosemother or stepmother was the parent respondent and for those whose father or stepfather was therespondent. Like the corresponding parent question (F2P24B), this question was only asked of thosestudents who indicated that English was not their native language. 955 cases satisfied theseconstraints for the maternal respondent, and 311 for the paternal respondent.
There was quite high agreement between parent and student on the base year question ofwhether a language other than English was spoken in the home—a .96 polychoric correlation and a93.4 percent response match. Twenty-one percent of students and 19 percent of parents indicated

The variables were coded 1 for English and 0 for another language for these analyses, so the values for the means8
in Table 3.3A, times 100, give the percentage of respondents who indicated that only English was used.
30
that another language was used, and these respondents were asked to identify the language “usually”8
spoken in the home. That 13-alternative question was recoded for these analyses as 1 for English and0 for any other language; the correlation was .74, and the percent matching on this dichotomy was73.2 percent. That there was virtually complete agreement between parent and student as to whichnon-English language was used is indicated by the fact that among all 13 language alternatives, thepercent match was 72.5 percent—nearly all of the 27 or 28 percent disagreements concerned whetherEnglish was the language usually spoken. The variations in wording between the parent and studentitems (“main” and “usually,” versus “USUALLY”) should be considered in interpreting thediscrepancy. As indicated by the parent-student mean difference in Table 3.3A, in families in whichEnglish was not the only language used, parents were more likely than students to say that Englishwas the main language usually spoken in the home [t=9.64] (as indicated by the comparison betweenthe mean parent response, 0.54, indicating that 54 percent of parents thought that English was themain language usually spoken, and the mean student response, 0.37, indicating that 37 percent ofteenagers thought that English was the language usually spoken at home).
The second follow-up questions (24B for parent and 108 for student) called for more subtlejudgments between four levels of frequency, and the wordings of the questions were not parallel, inthat the parent was asked about the language spoken “with children,” not specifically “with the[NELS:88 participant].” As a result, the level of convergence between parent and student was lower.The polychoric correlation was .52 when the respondent was the mother and .61 when it was thefather, and the percentage matches were 58 percent and 51 percent, respectively. Both parents andstudents who responded to this question indicated usual use of the other language: the mean valuesof 1.64, 1.78, 1.72, and 1.82 in Table 3.3A are on a 1-to-4 scale, in which 1 indicates use of the otherlanguage “always or most of the time.” (That is, a higher value indicates greater use of English.)There is a slight tendency for students to indicate use of English at home more than their mothers[t=2.41]. Examination of the unweighted frequency distributions (not shown in Table 3.3A) onwhich these means are based indicates that about 56 percent of the students and parents in familiesin which a non-English language is spoken use that language always or most of the time(response = 1, on the 1-to-4 scale).
Table 3.3A—Comparison of parent and student responses to items about use of non-English languages
Number of Polychoric Percent Mean Parent Mean Student Parent-StudentResponse Pairs Correlation Match Response Response Difference
Base Year English only 15,503 .958 93.4 0.81 0.79 .020 Usual language is English 2,320 .741 73.2 0.54 0.37 .164Second Follow-up Use English w/ mother 727 .523 57.6 1.64 1.72 -.079 Use English w/ father 267 .612 50.9 1.78 1.82 -.044SOURCE: U.S. Department of Education, National Center for Education Statistics, National Education Longitudinal Study, 1988(NELS:88); Base Year and Second Follow-up Parent and Student Surveys.
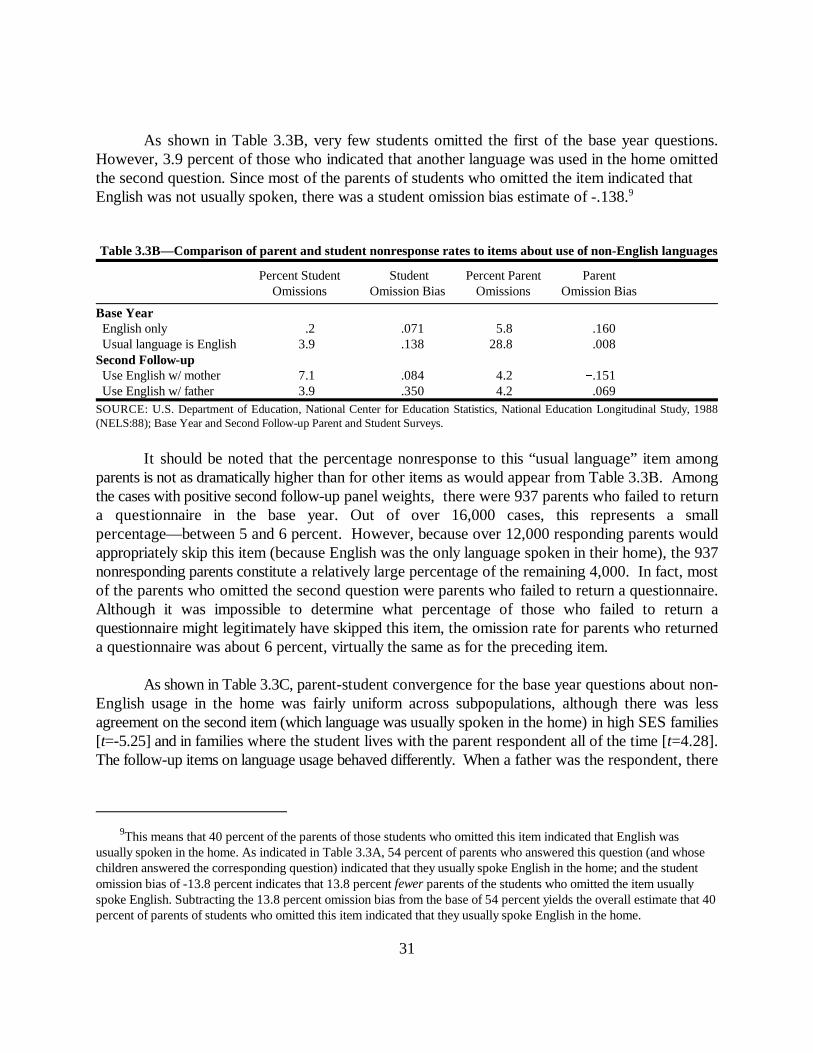
This means that 40 percent of the parents of those students who omitted this item indicated that English was9
usually spoken in the home. As indicated in Table 3.3A, 54 percent of parents who answered this question (and whosechildren answered the corresponding question) indicated that they usually spoke English in the home; and the studentomission bias of -13.8 percent indicates that 13.8 percent fewer parents of the students who omitted the item usuallyspoke English. Subtracting the 13.8 percent omission bias from the base of 54 percent yields the overall estimate that 40percent of parents of students who omitted this item indicated that they usually spoke English in the home.
31
As shown in Table 3.3B, very few students omitted the first of the base year questions.However, 3.9 percent of those who indicated that another language was used in the home omittedthe second question. Since most of the parents of students who omitted the item indicated that English was not usually spoken, there was a student omission bias estimate of -.138.9
Table 3.3B—Comparison of parent and student nonresponse rates to items about use of non-English languages
Percent Student Student Percent Parent ParentOmissions Omission Bias Omissions Omission Bias
Base Year English only .2 .071 5.8 .160 Usual language is English 3.9 .138 28.8 .008Second Follow-up Use English w/ mother 7.1 .084 4.2 .151 Use English w/ father 3.9 .350 4.2 .069SOURCE: U.S. Department of Education, National Center for Education Statistics, National Education Longitudinal Study, 1988(NELS:88); Base Year and Second Follow-up Parent and Student Surveys.
It should be noted that the percentage nonresponse to this “usual language” item amongparents is not as dramatically higher than for other items as would appear from Table 3.3B. Amongthe cases with positive second follow-up panel weights, there were 937 parents who failed to returna questionnaire in the base year. Out of over 16,000 cases, this represents a smallpercentage—between 5 and 6 percent. However, because over 12,000 responding parents wouldappropriately skip this item (because English was the only language spoken in their home), the 937nonresponding parents constitute a relatively large percentage of the remaining 4,000. In fact, mostof the parents who omitted the second question were parents who failed to return a questionnaire.Although it was impossible to determine what percentage of those who failed to return aquestionnaire might legitimately have skipped this item, the omission rate for parents who returneda questionnaire was about 6 percent, virtually the same as for the preceding item.
As shown in Table 3.3C, parent-student convergence for the base year questions about non-English usage in the home was fairly uniform across subpopulations, although there was lessagreement on the second item (which language was usually spoken in the home) in high SES families[t=-5.25] and in families where the student lives with the parent respondent all of the time [t=4.28].The follow-up items on language usage behaved differently. When a father was the respondent, there

The orderings of the measures in Table 3.3D have been defined so that a positive sign (“+”) indicates that greater10
use of English is positively related to the outcome. In all but two cases in which the effect was significant, it was in thedirection that greater use of English in the home was positively related to educational outcomes.
32
was greater convergence for high SES [t=2.80] and for private school students [t=2.26], whenmeasured by the polychoric correlation.
The largest base year discrepancies in the average differences occurred when the student didnot live with the parent respondent all of the time [t=4.28]; however, the results at follow-up wereinconsistent—fathers, but not mothers, tended to say they used English in communications Table 3.3C— Response characteristics on items about use of non-English languages, for population subgroups
Student Lives With 8th GradeParent Respondent SES Sex Reading School
All the time Not all Low High Male Female Low High Public Private
Polychoric CorrelationsEnglish only .96 .95 .97 .95 .95 .97 .96 .96 .96 .93a
Usual lang. is English .73 .89 .78 .66 .74 .74 .73 .73 .74 .71 Use English with mother .52 .46 .51 .42 .44 .58 .48 .62 .53 .45 Use English with father .52 .46 .44 .68 .57 .60 .55 .69 .56 .78Average Differences
English only .02 .05 .01 .03 .02 .02 .01 .03 .02 .03Usual lang. is English .17 .03 .16 .15 .19 .14 .20 .13 .17 .16
Use English with mother -.09 -.19 -.09 -.12 -.10 -.09 -.05 -.11 -.12 .17 Use English with father -.10 .50 -.12 .02 .01 -.13 .04 -.12 -.06 -.14Pct. Student Nonresponse
English only 0.2 0.4 0.3 0.1 0.3 0.1 0.3 0.1 0.2 0.2 Usual lang. is English 3.9 4.6 3.7 4.1 4.2 3.6 4.3 3.6 3.6 5.3
Use English with mother 6.6 9.7 6.5 8.2 8.7 5.3 8.3 5.0 6.7 5.8 Use English with father 3.4 8.7 1.7 6.3 6.0 1.3 3.8 3.3 3.0 6.5(a) A few high correlations are based on a Pearson correlation approximation. In those cases in which the Pearson correlation was closeto 1.0, the polychoric correlation computation in SAS failed to converge for a subpopulation, although it did converge for the total. In thosecases, the approximation (1 - R ) x ((1 - R ) / (1 - R )) was used for (1 - R ). The2 2 2 2
(Pearson) subpopulation (polychoric) total (Pearson) total (polychoric) subpopulation
Pearson approximation was accurate for cases for which the computation converged.SOURCE: U.S. Department of Education, National Center for Education Statistics, National Education Longitudinal Study, 1988(NELS:88); Base Year and Second Follow-up Parent and Student Surveys.
with their teenager more than students did [t=2.70]. It appears that different information was beinggathered from parents and students on these language usage questions.
Finally, as shown in Table 3.3D, the base year question on whether English was the usuallanguage in homes where it was not the only language spoken, and the follow-up question on nativelanguage usage in these homes, were differently related to some important educational outcomes,depending on the source of the information. First, in homes in which a non-English language was10
used in the base year, an indication that English was the usual language spoken was positively relatedto students’ educational and occupational expectations, course difficulty level, grade point average,
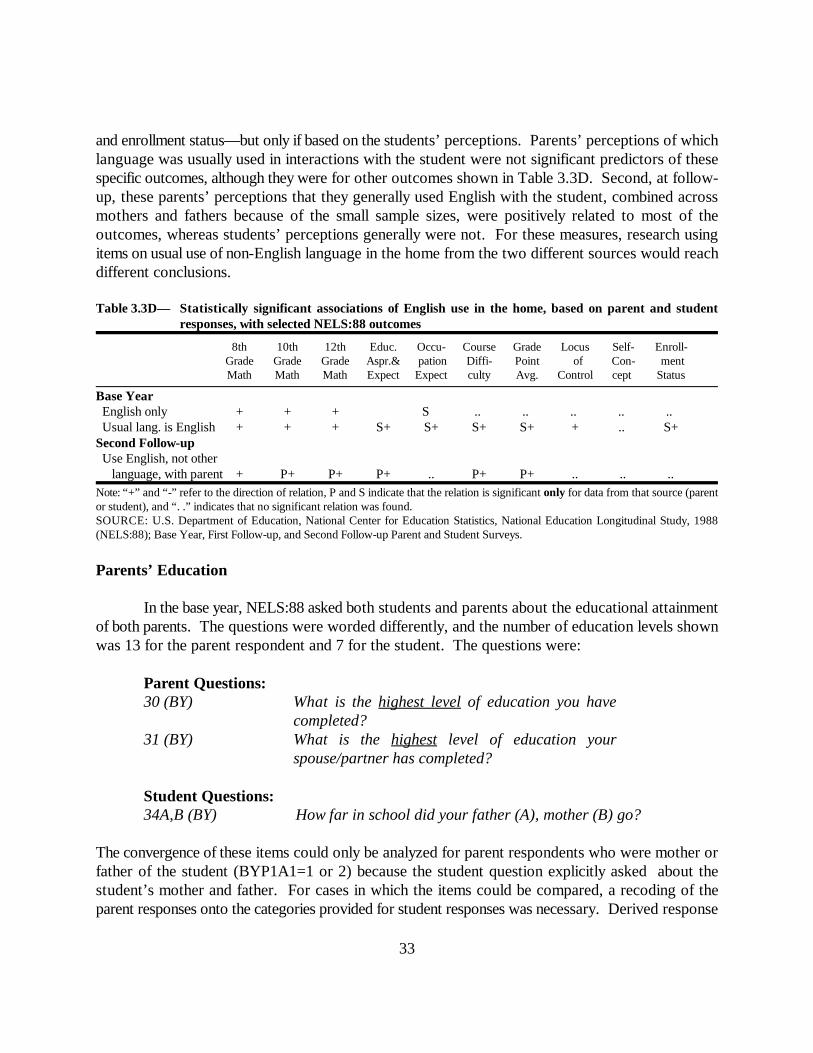
33
and enrollment status—but only if based on the students’ perceptions. Parents’ perceptions of whichlanguage was usually used in interactions with the student were not significant predictors of thesespecific outcomes, although they were for other outcomes shown in Table 3.3D. Second, at follow-up, these parents’ perceptions that they generally used English with the student, combined acrossmothers and fathers because of the small sample sizes, were positively related to most of theoutcomes, whereas students’ perceptions generally were not. For these measures, research usingitems on usual use of non-English language in the home from the two different sources would reachdifferent conclusions.
Table 3.3D— Statistically significant associations of English use in the home, based on parent and studentresponses, with selected NELS:88 outcomes
8th 10th 12th Educ. Occu- Course Grade Locus Self- Enroll-Grade Grade Grade Aspr.& pation Diffi- Point of Con- mentMath Math Math Expect Expect culty Avg. Control cept Status
Base Year English only + + + S .. .. .. .. .. Usual lang. is English + + + S+ S+ S+ S+ + .. S+Second Follow-up Use English, not other language, with parent + P+ P+ P+ .. P+ P+ .. .. ..Note: “+” and “-” refer to the direction of relation, P and S indicate that the relation is significant only for data from that source (parentor student), and “. .” indicates that no significant relation was found.SOURCE: U.S. Department of Education, National Center for Education Statistics, National Education Longitudinal Study, 1988(NELS:88); Base Year, First Follow-up, and Second Follow-up Parent and Student Surveys.
Parents’ Education
In the base year, NELS:88 asked both students and parents about the educational attainmentof both parents. The questions were worded differently, and the number of education levels shownwas 13 for the parent respondent and 7 for the student. The questions were:
Parent Questions:30 (BY) What is the highest level of education you have
completed?31 (BY) What is the highest level of education your
spouse/partner has completed?
Student Questions:34A,B (BY) How far in school did your father (A), mother (B) go?
The convergence of these items could only be analyzed for parent respondents who were mother orfather of the student (BYP1A1=1 or 2) because the student question explicitly asked about thestudent’s mother and father. For cases in which the items could be compared, a recoding of theparent responses onto the categories provided for student responses was necessary. Derived response
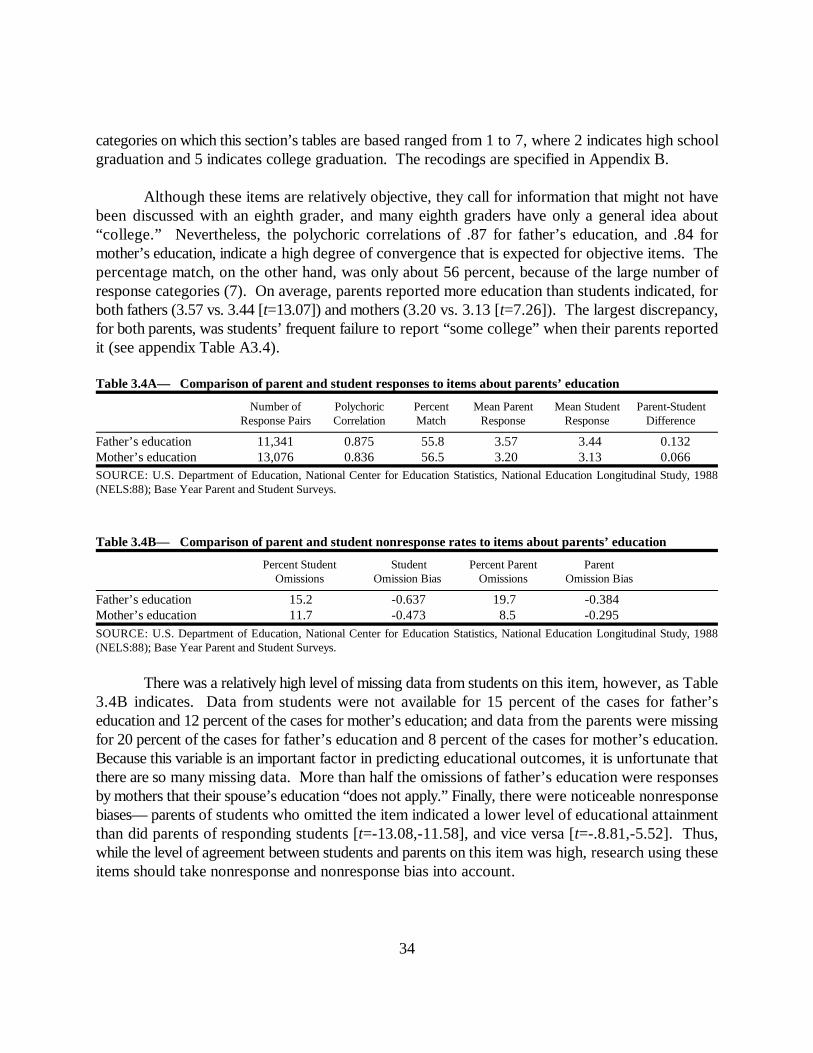
34
categories on which this section’s tables are based ranged from 1 to 7, where 2 indicates high schoolgraduation and 5 indicates college graduation. The recodings are specified in Appendix B.
Although these items are relatively objective, they call for information that might not havebeen discussed with an eighth grader, and many eighth graders have only a general idea about“college.” Nevertheless, the polychoric correlations of .87 for father’s education, and .84 formother’s education, indicate a high degree of convergence that is expected for objective items. Thepercentage match, on the other hand, was only about 56 percent, because of the large number ofresponse categories (7). On average, parents reported more education than students indicated, forboth fathers (3.57 vs. 3.44 [t=13.07]) and mothers (3.20 vs. 3.13 [t=7.26]). The largest discrepancy,for both parents, was students’ frequent failure to report “some college” when their parents reportedit (see appendix Table A3.4).
Table 3.4A— Comparison of parent and student responses to items about parents’ education
Number of Polychoric Percent Mean Parent Mean Student Parent-StudentResponse Pairs Correlation Match Response Response Difference
Father’s education 11,341 0.875 55.8 3.57 3.44 0.132Mother’s education 13,076 0.836 56.5 3.20 3.13 0.066SOURCE: U.S. Department of Education, National Center for Education Statistics, National Education Longitudinal Study, 1988(NELS:88); Base Year Parent and Student Surveys.
Table 3.4B— Comparison of parent and student nonresponse rates to items about parents’ education
Percent Student Student Percent Parent ParentOmissions Omission Bias Omissions Omission Bias
Father’s education 15.2 -0.637 19.7 -0.384Mother’s education 11.7 -0.473 8.5 -0.295SOURCE: U.S. Department of Education, National Center for Education Statistics, National Education Longitudinal Study, 1988(NELS:88); Base Year Parent and Student Surveys.
There was a relatively high level of missing data from students on this item, however, as Table3.4B indicates. Data from students were not available for 15 percent of the cases for father’seducation and 12 percent of the cases for mother’s education; and data from the parents were missingfor 20 percent of the cases for father’s education and 8 percent of the cases for mother’s education.Because this variable is an important factor in predicting educational outcomes, it is unfortunate thatthere are so many missing data. More than half the omissions of father’s education were responsesby mothers that their spouse’s education “does not apply.” Finally, there were noticeable nonresponsebiases— parents of students who omitted the item indicated a lower level of educational attainmentthan did parents of responding students [t=-13.08,-11.58], and vice versa [t=-.8.81,-5.52]. Thus,while the level of agreement between students and parents on this item was high, research using theseitems should take nonresponse and nonresponse bias into account.
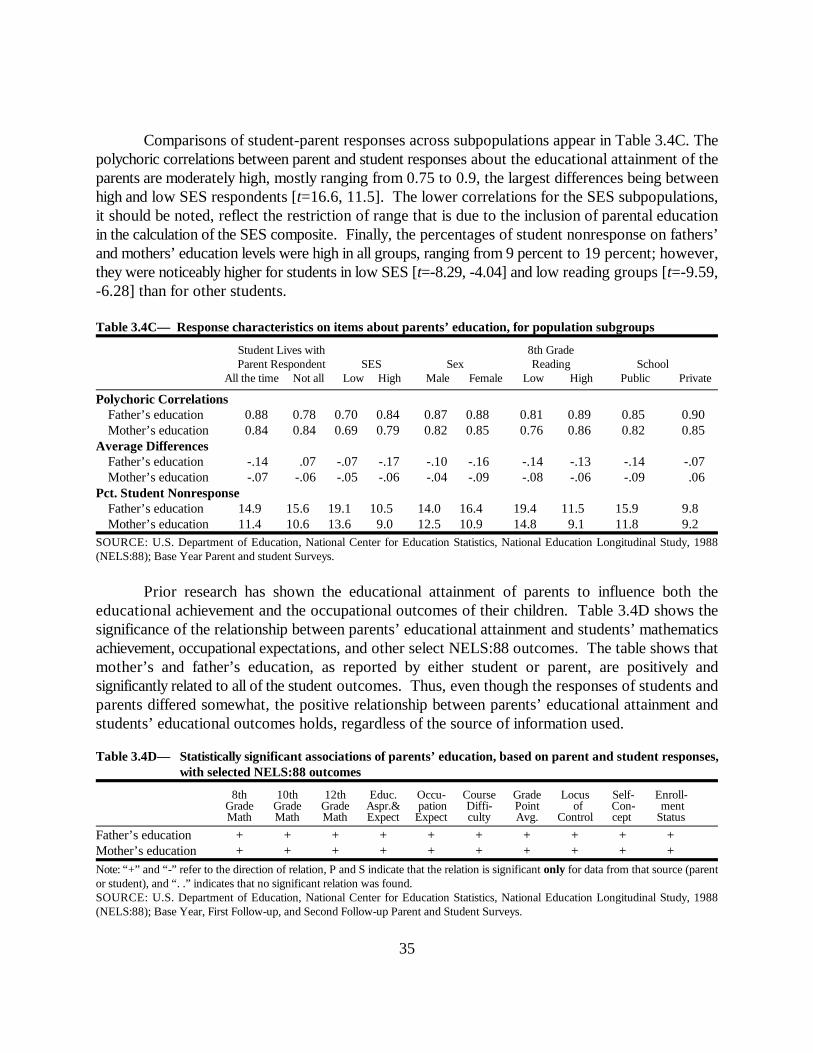
35
Comparisons of student-parent responses across subpopulations appear in Table 3.4C. Thepolychoric correlations between parent and student responses about the educational attainment of theparents are moderately high, mostly ranging from 0.75 to 0.9, the largest differences being betweenhigh and low SES respondents [t=16.6, 11.5]. The lower correlations for the SES subpopulations,it should be noted, reflect the restriction of range that is due to the inclusion of parental educationin the calculation of the SES composite. Finally, the percentages of student nonresponse on fathers’and mothers’ education levels were high in all groups, ranging from 9 percent to 19 percent; however,they were noticeably higher for students in low SES [t=-8.29, -4.04] and low reading groups [t=-9.59,-6.28] than for other students.
Table 3.4C— Response characteristics on items about parents’ education, for population subgroups
Student Lives with 8th GradeParent Respondent SES Sex Reading School
All the time Not all Low High Male Female Low High Public Private
Polychoric CorrelationsFather’s education 0.88 0.78 0.70 0.84 0.87 0.88 0.81 0.89 0.85 0.90Mother’s education 0.84 0.84 0.69 0.79 0.82 0.85 0.76 0.86 0.82 0.85
Average DifferencesFather’s education -.14 .07 -.07 -.17 -.10 -.16 -.14 -.13 -.14 -.07Mother’s education -.07 -.06 -.05 -.06 -.04 -.09 -.08 -.06 -.09 .06
Pct. Student NonresponseFather’s education 14.9 15.6 19.1 10.5 14.0 16.4 19.4 11.5 15.9 9.8Mother’s education 11.4 10.6 13.6 9.0 12.5 10.9 14.8 9.1 11.8 9.2
SOURCE: U.S. Department of Education, National Center for Education Statistics, National Education Longitudinal Study, 1988(NELS:88); Base Year Parent and student Surveys.
Prior research has shown the educational attainment of parents to influence both theeducational achievement and the occupational outcomes of their children. Table 3.4D shows thesignificance of the relationship between parents’ educational attainment and students’ mathematicsachievement, occupational expectations, and other select NELS:88 outcomes. The table shows thatmother’s and father’s education, as reported by either student or parent, are positively andsignificantly related to all of the student outcomes. Thus, even though the responses of students andparents differed somewhat, the positive relationship between parents’ educational attainment andstudents’ educational outcomes holds, regardless of the source of information used.
Table 3.4D— Statistically significant associations of parents’ education, based on parent and student responses,with selected NELS:88 outcomes
8th 10th 12th Educ. Occu- Course Grade Locus Self- Enroll-Grade Grade Grade Aspr.& pation Diffi- Point of Con- mentMath Math Math Expect Expect culty Avg. Control cept Status
Father’s education + + + + + + + + + +Mother’s education + + + + + + + + + +
Note: “+” and “-” refer to the direction of relation, P and S indicate that the relation is significant only for data from that source (parentor student), and “. .” indicates that no significant relation was found.SOURCE: U.S. Department of Education, National Center for Education Statistics, National Education Longitudinal Study, 1988(NELS:88); Base Year, First Follow-up, and Second Follow-up Parent and Student Surveys.
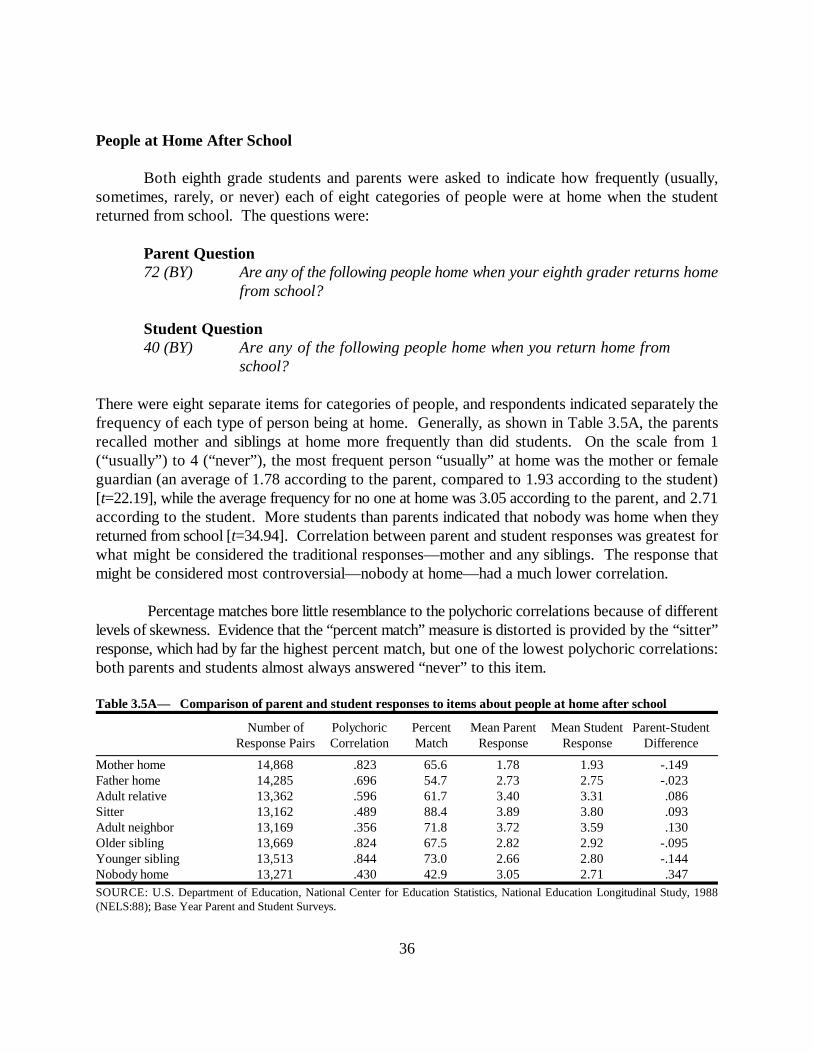
36
People at Home After School
Both eighth grade students and parents were asked to indicate how frequently (usually,sometimes, rarely, or never) each of eight categories of people were at home when the studentreturned from school. The questions were:
Parent Question 72 (BY) Are any of the following people home when your eighth grader returns home
from school?
Student Question 40 (BY) Are any of the following people home when you return home from
school?
There were eight separate items for categories of people, and respondents indicated separately thefrequency of each type of person being at home. Generally, as shown in Table 3.5A, the parentsrecalled mother and siblings at home more frequently than did students. On the scale from 1(“usually”) to 4 (“never”), the most frequent person “usually” at home was the mother or femaleguardian (an average of 1.78 according to the parent, compared to 1.93 according to the student)[t=22.19], while the average frequency for no one at home was 3.05 according to the parent, and 2.71according to the student. More students than parents indicated that nobody was home when theyreturned from school [t=34.94]. Correlation between parent and student responses was greatest forwhat might be considered the traditional responses—mother and any siblings. The response thatmight be considered most controversial—nobody at home—had a much lower correlation.
Percentage matches bore little resemblance to the polychoric correlations because of differentlevels of skewness. Evidence that the “percent match” measure is distorted is provided by the “sitter”response, which had by far the highest percent match, but one of the lowest polychoric correlations:both parents and students almost always answered “never” to this item.
Table 3.5A— Comparison of parent and student responses to items about people at home after school
Number of Polychoric Percent Mean Parent Mean Student Parent-StudentResponse Pairs Correlation Match Response Response Difference
Mother home 14,868 .823 65.6 1.78 1.93 -.149Father home 14,285 .696 54.7 2.73 2.75 -.023Adult relative 13,362 .596 61.7 3.40 3.31 .086Sitter 13,162 .489 88.4 3.89 3.80 .093Adult neighbor 13,169 .356 71.8 3.72 3.59 .130Older sibling 13,669 .824 67.5 2.82 2.92 -.095Younger sibling 13,513 .844 73.0 2.66 2.80 -.144Nobody home 13,271 .430 42.9 3.05 2.71 .347SOURCE: U.S. Department of Education, National Center for Education Statistics, National Education Longitudinal Study, 1988(NELS:88); Base Year Parent and Student Surveys.
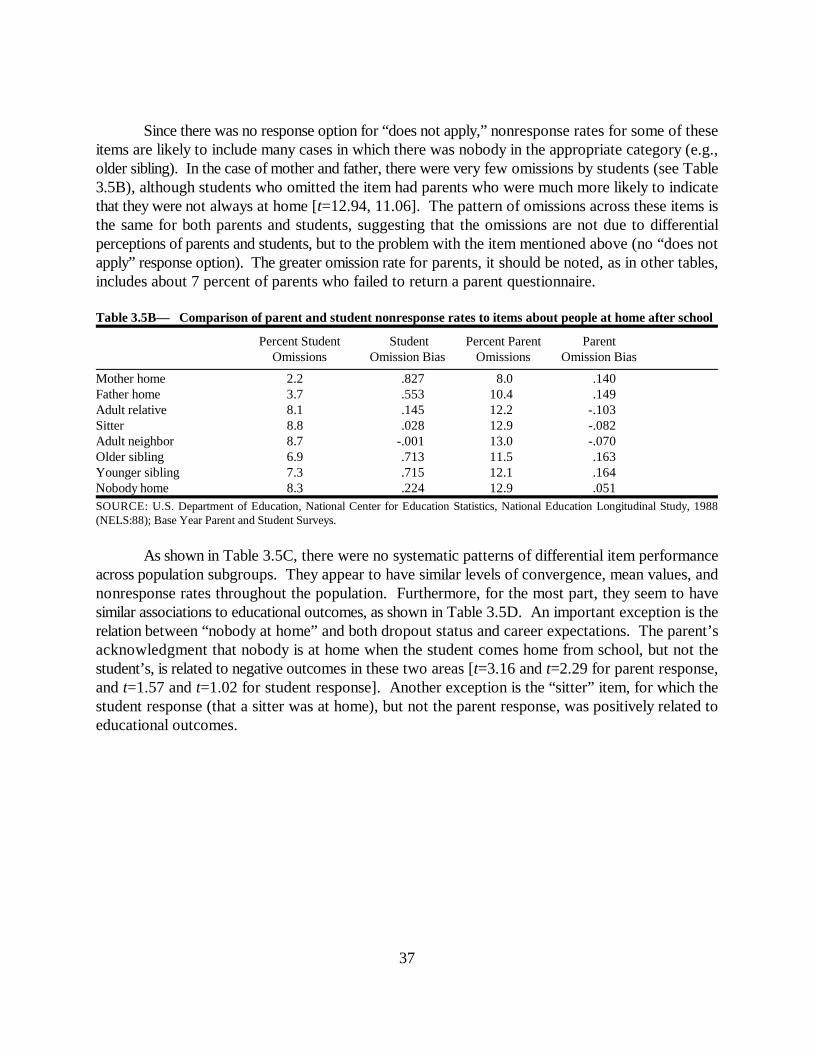
37
Since there was no response option for “does not apply,” nonresponse rates for some of theseitems are likely to include many cases in which there was nobody in the appropriate category (e.g.,older sibling). In the case of mother and father, there were very few omissions by students (see Table3.5B), although students who omitted the item had parents who were much more likely to indicatethat they were not always at home [t=12.94, 11.06]. The pattern of omissions across these items isthe same for both parents and students, suggesting that the omissions are not due to differentialperceptions of parents and students, but to the problem with the item mentioned above (no “does notapply” response option). The greater omission rate for parents, it should be noted, as in other tables,includes about 7 percent of parents who failed to return a parent questionnaire.
Table 3.5B— Comparison of parent and student nonresponse rates to items about people at home after school
Percent Student Student Percent Parent ParentOmissions Omission Bias Omissions Omission Bias
Mother home 2.2 .827 8.0 .140Father home 3.7 .553 10.4 .149Adult relative 8.1 .145 12.2 -.103Sitter 8.8 .028 12.9 -.082Adult neighbor 8.7 -.001 13.0 -.070Older sibling 6.9 .713 11.5 .163Younger sibling 7.3 .715 12.1 .164Nobody home 8.3 .224 12.9 .051SOURCE: U.S. Department of Education, National Center for Education Statistics, National Education Longitudinal Study, 1988(NELS:88); Base Year Parent and Student Surveys.
As shown in Table 3.5C, there were no systematic patterns of differential item performanceacross population subgroups. They appear to have similar levels of convergence, mean values, andnonresponse rates throughout the population. Furthermore, for the most part, they seem to havesimilar associations to educational outcomes, as shown in Table 3.5D. An important exception is therelation between “nobody at home” and both dropout status and career expectations. The parent’sacknowledgment that nobody is at home when the student comes home from school, but not thestudent’s, is related to negative outcomes in these two areas [t=3.16 and t=2.29 for parent response,and t=1.57 and t=1.02 for student response]. Another exception is the “sitter” item, for which thestudent response (that a sitter was at home), but not the parent response, was positively related toeducational outcomes.
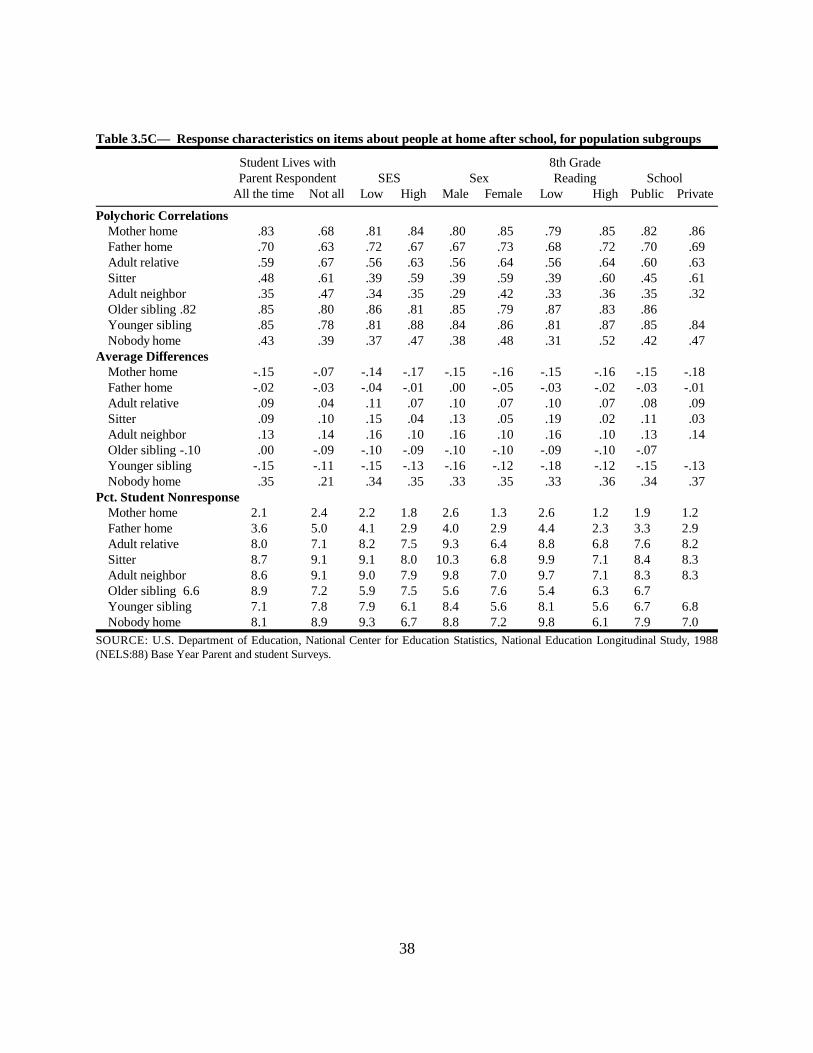
38
Table 3.5C— Response characteristics on items about people at home after school, for population subgroups
Student Lives with 8th GradeParent Respondent SES Sex Reading School
All the time Not all Low High Male Female Low High Public Private
Polychoric CorrelationsMother home .83 .68 .81 .84 .80 .85 .79 .85 .82 .86Father home .70 .63 .72 .67 .67 .73 .68 .72 .70 .69Adult relative .59 .67 .56 .63 .56 .64 .56 .64 .60 .63Sitter .48 .61 .39 .59 .39 .59 .39 .60 .45 .61Adult neighbor .35 .47 .34 .35 .29 .42 .33 .36 .35 .32Older sibling .82 .85 .80 .86 .81 .85 .79 .87 .83 .86Younger sibling .85 .78 .81 .88 .84 .86 .81 .87 .85 .84Nobody home .43 .39 .37 .47 .38 .48 .31 .52 .42 .47
Average DifferencesMother home -.15 -.07 -.14 -.17 -.15 -.16 -.15 -.16 -.15 -.18Father home -.02 -.03 -.04 -.01 .00 -.05 -.03 -.02 -.03 -.01Adult relative .09 .04 .11 .07 .10 .07 .10 .07 .08 .09Sitter .09 .10 .15 .04 .13 .05 .19 .02 .11 .03Adult neighbor .13 .14 .16 .10 .16 .10 .16 .10 .13 .14Older sibling -.10 .00 -.09 -.10 -.09 -.10 -.10 -.09 -.10 -.07Younger sibling -.15 -.11 -.15 -.13 -.16 -.12 -.18 -.12 -.15 -.13Nobody home .35 .21 .34 .35 .33 .35 .33 .36 .34 .37
Pct. Student NonresponseMother home 2.1 2.4 2.2 1.8 2.6 1.3 2.6 1.2 1.9 1.2Father home 3.6 5.0 4.1 2.9 4.0 2.9 4.4 2.3 3.3 2.9Adult relative 8.0 7.1 8.2 7.5 9.3 6.4 8.8 6.8 7.6 8.2Sitter 8.7 9.1 9.1 8.0 10.3 6.8 9.9 7.1 8.4 8.3Adult neighbor 8.6 9.1 9.0 7.9 9.8 7.0 9.7 7.1 8.3 8.3Older sibling 6.6 8.9 7.2 5.9 7.5 5.6 7.6 5.4 6.3 6.7Younger sibling 7.1 7.8 7.9 6.1 8.4 5.6 8.1 5.6 6.7 6.8Nobody home 8.1 8.9 9.3 6.7 8.8 7.2 9.8 6.1 7.9 7.0
SOURCE: U.S. Department of Education, National Center for Education Statistics, National Education Longitudinal Study, 1988(NELS:88) Base Year Parent and student Surveys.
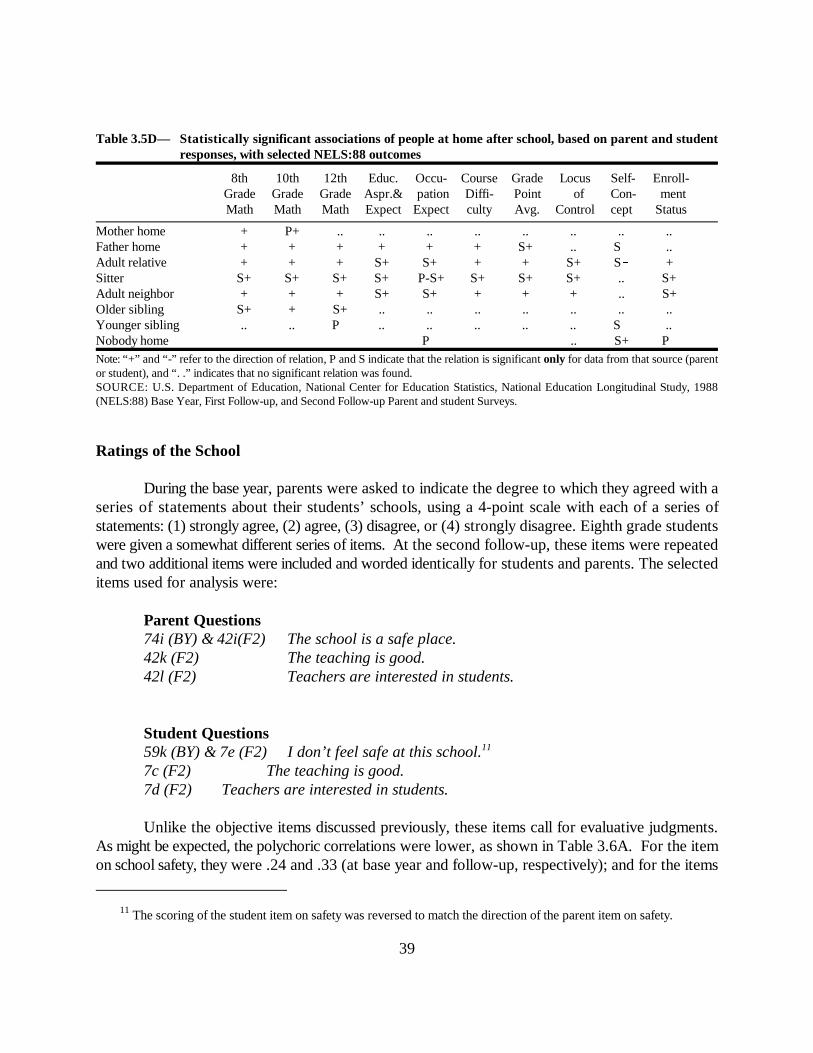
The scoring of the student item on safety was reversed to match the direction of the parent item on safety.11
39
Table 3.5D— Statistically significant associations of people at home after school, based on parent and studentresponses, with selected NELS:88 outcomes
8th 10th 12th Educ. Occu- Course Grade Locus Self- Enroll-Grade Grade Grade Aspr.& pation Diffi- Point of Con- mentMath Math Math Expect Expect culty Avg. Control cept Status
Mother home + P+ .. .. .. .. .. .. .. .. Father home + + + + + + S+ .. S .. Adult relative + + + S+ S+ + + S+ S + Sitter S+ S+ S+ S+ P-S+ S+ S+ S+ .. S+ Adult neighbor + + + S+ S+ + + + .. S+ Older sibling S+ + S+ .. .. .. .. .. .. .. Younger sibling .. .. P .. .. .. .. .. S .. Nobody home P .. S+ P Note: “+” and “-” refer to the direction of relation, P and S indicate that the relation is significant only for data from that source (parentor student), and “. .” indicates that no significant relation was found.SOURCE: U.S. Department of Education, National Center for Education Statistics, National Education Longitudinal Study, 1988(NELS:88) Base Year, First Follow-up, and Second Follow-up Parent and student Surveys.
Ratings of the School
During the base year, parents were asked to indicate the degree to which they agreed with aseries of statements about their students’ schools, using a 4-point scale with each of a series ofstatements: (1) strongly agree, (2) agree, (3) disagree, or (4) strongly disagree. Eighth grade studentswere given a somewhat different series of items. At the second follow-up, these items were repeatedand two additional items were included and worded identically for students and parents. The selecteditems used for analysis were:
Parent Questions 74i (BY) & 42i(F2) The school is a safe place.42k (F2) The teaching is good.42l (F2) Teachers are interested in students.
Student Questions 59k (BY) & 7e (F2) I don’t feel safe at this school.11
7c (F2) The teaching is good.7d (F2) Teachers are interested in students.
Unlike the objective items discussed previously, these items call for evaluative judgments.As might be expected, the polychoric correlations were lower, as shown in Table 3.6A. For the itemon school safety, they were .24 and .33 (at base year and follow-up, respectively); and for the items

40
on teaching and teachers, they were .37 and .35. The corresponding percentage matches were 48percent and 45 percent for the safety item and 59 percent and 53 percent for the other two items. Forthe items on teaching and teachers, the mean responses of parents and students were virtuallyidentical, but for the “safety” items, there were substantial mean differences (of .16 at base year and.35 at follow-up, on a 1-to-4 scale), indicating that students believed their schools to be safer thanparents did [t=22.34, 44.97]. The different performance of the “safety” item, compared to the itemson teaching and teachers, should not be interpreted as an indicator of discrepancies in parent andstudent views on safety, however. Another plausible explanation is that the relative lack ofconvergence is due to the wording change and reversal of the scale for students—strongly agreeingthat one does not feel safe at school is not the same as strongly disagreeing that the school is a safeplace.
Table 3.6A— Comparison of parent and student responses to items about ratings of the school
Number of Polychoric Percent Mean Parent Mean Student Parent-StudentResponse Pairs Correlation Match Response Response Difference
Base Year School safe 14,726 .238 47.6 1.89 1.73 .164Second Follow-up School safe 12,594 .331 44.7 2.00 1.65 .351 Teaching good 12,533 .366 58.6 2.02 2.00 .026 Teachers interested 12,499 .351 53.3 2.05 2.02 .030SOURCE: U.S. Department of Education, National Center for Education Statistics, National Education Longitudinal Study, 1988(NELS:88) Base Year and Second Follow-up Parent and Student Surveys.
As can be seen from Table 3.6B, these items had low nonresponse rates, other than the6 percent of parents who failed to return a questionnaire. Both students and parents were willing toprovide ratings of their schools and teachers.
Table 3.6B— Comparison of parent and student nonresponse rates to items about ratings of the school
Percent Student Student Percent Parent ParentOmissions Omission Bias Omissions Omission Bias
Base Year School safe 2.4 .152 8.6 .033Second Follow-up School safe 1.5 -.013 7.1 .120 Teaching good 1.6 -.087 7.5 .033 Teachers interested 1.6 -.031 7.8 .021SOURCE: U.S. Department of Education, National Center for Education Statistics, National Education Longitudinal Study, 1988(NELS:88) Base Year and Second Follow-up Parent and Student Surveys.
There was somewhat more agreement between parents and students in the high SES [t=4.23,8.44, 12.10, 10.41] and high reading [t=8.96, 7.76, 10.90, 7.69] subpopulations, as indicated in Table3.6C. As might be expected, the parent-student mean discrepancies in the safety measures were muchgreater among low SES [t=6.81, 6.27] and public school students [t=16.01, 13.54] than among high

41
SES and private school students. Finally, the low student nonresponse rates on these items appearedto be similar throughout the population.
Table 3.6C— Response characteristics on items about ratings of the school, for population subgroups
Student Lives With 8th GradeParent Respondent SES Sex Reading School
All the time Not all the time Low High Male Female Low High Public Private
Polychoric Correlations School safe (Base year) .24 .32 .18 .25 .21 .27 .14 .28 .19 .17 School safe (Follow-up) .33 .32 .24 .38 .29 .37 .24 .37 .27 .26 Teaching good .37 .37 .24 .44 .34 .39 .25 .43 .28 .39 Teachers interested .35 .39 .24 .41 .32 .38 .26 .39 .24 .41Average Differences School safe (Base year) .17 .08 .22 .11 .11 .22 .14 .19 .22 -.09 School safe (Follow-up) .35 .35 .41 .31 .35 .36 .36 .35 .40 .11 Teaching good .02 .07 .04 .01 .02 .03 .04 .02 .04 -.07 Teachers interested .03 .03 .08 -.01 .02 .04 .06 .01 .05 -.10Pct. Student Nonresponse School safe (Base year) 2.3 3.0 3.2 1.6 2.9 2.0 3.4 1.1 2.8 .9 School safe (Follow-up) 1.4 2.1 1.4 1.5 1.9 1.1 1.9 1.2 1.4 1.8 Teaching good 1.5 2.2 1.6 1.6 2.0 1.3 2.0 1.3 1.5 1.7 Teachers interested 1.5 2.2 1.5 1.5 1.9 1.3 1.9 1.3 1.4 1.9SOURCE: U.S. Department of Education, National Center for Education Statistics, National Education Longitudinal Study, 1988(NELS:88) Base Year and Second Follow-up Parent and Student Surveys.
Both parent and student ratings of schools were positively related to educational outcomes,almost without exception. Only the relations (a) between school safety ratings and student self-concept and (b) between teacher interest in students and occupational expectations depended on thesource of the ratings. In summary, the ratings of teachers and schools by parents and students,although not highly convergent, had few missing data and performed in a similar manner with respectto educational outcomes across the range of population subgroups.
Table 3.6D— Statistically significant associations of school factors, based on parent and student ratings, withselected NELS:88 outcomes
8th 10th 12th Educ. Occu- Course Grade Locus Self- Enroll-Grade Grade Grade Aspr.& pation Diffi- Point of Con- mentMath Math Math Expect Expect culty Avg. Control cept Status
Base Year School safe + + + + + + + + S+ + Second Follow-up School safe + + + + + + + + S+ + Teaching good + + + + + + + + + + Teachers interested + + + + P+ + + + + +
Note: “+” and “-” refer to the direction of relation, P and S indicate that the relation is significant only for data from that source (parentor student), and “. .” indicates that no significant relation was found.SOURCE: U.S. Department of Education, National Center for Education Statistics, National Education Longitudinal Study, 1988(NELS:88) Base Year, First Follow-up, and Second Follow-up Parent and student Surveys.

42
Parent-Student Discussions of Issues
Several questions on the NELS:88 second follow-up were designed to create a picture offamily interactions that might affect educational progress. Parents and students both responded toquestions about the frequency of student-parent discussions on nine different topics. Each topic wasscored 1 for “never,” 2 for “sometimes,” and 3 for “often.” The questions and topics analyzed were:
Parent Question:49 (F2) How frequently during the past two years have you
and your spouse/partner talked about the followingwith your teenager?
Student Question:99 (F2) In the first term or semester of this school year, how
often did you discuss the following with either orboth of your parents or guardians?
Common Topics:a. Selecting courses or programs at schoolb. School activities or events of particular interest to your teenager/youc. Things your teenager/you have studied in class d. Your teen’s/your gradese. Plans and preparation for the ACT, SAT tests (or ASVAB—on the
parent survey only)f. Applying for colleges or other schools after high schoolg. Specific jobs your teen/you might apply for after high schoolh. Community, national, and world eventsi. Things that are troubling your teenager/you
Parent and student responses to these questions were not very correlated, as shown in Table3.7A. The polychoric correlations ranged from .13 for jobs after school, to .19 for grades, to .31 forschool activities, to .46, for applying to colleges or other schools after high school. The percentagesof matches were between 36 percent and 53 percent, low values for a three-point scale; and responsesfrom parents, ranging from 2.37 to 2.74 on the 3-point scale, generally indicated more frequentdiscussions than did responses from students, which ranged from 1.88 to 2.33 [9 t’s ranged from-51.08 to -83.91].
The lack of convergence should be attributed at least in part to the differences in item-wording. Parents were asked to consider the past two years, while students were asked to considerthe past few months. For example, it is quite plausible that in many families, discussions about oneof these topics might occur one to five times in a year, and that respondents would rate the frequencyof discussions based on the ability to recall specific discussions, setting the dividing line between“sometimes” and “often” anywhere from 3 to 20 conversations. Since three to four times as manyconversations would have been in the time scope of the parent question as in the time scope of the
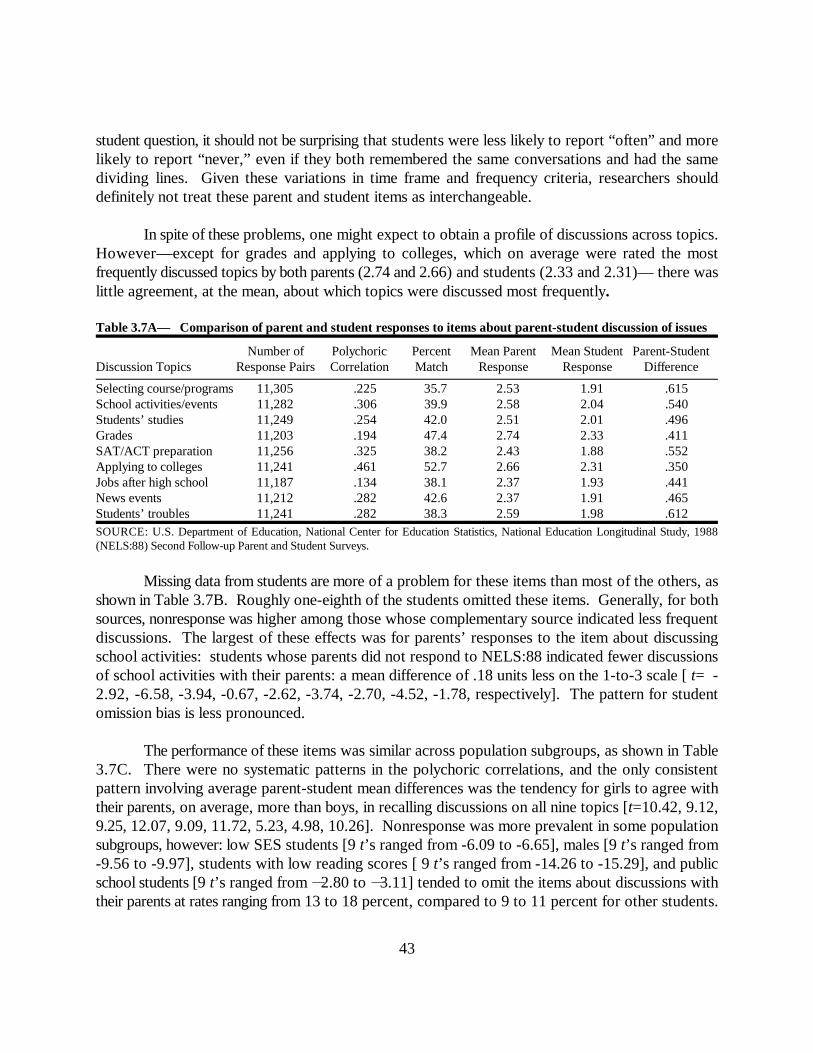
43
student question, it should not be surprising that students were less likely to report “often” and morelikely to report “never,” even if they both remembered the same conversations and had the samedividing lines. Given these variations in time frame and frequency criteria, researchers shoulddefinitely not treat these parent and student items as interchangeable.
In spite of these problems, one might expect to obtain a profile of discussions across topics.However—except for grades and applying to colleges, which on average were rated the mostfrequently discussed topics by both parents (2.74 and 2.66) and students (2.33 and 2.31)— there waslittle agreement, at the mean, about which topics were discussed most frequently.
Table 3.7A— Comparison of parent and student responses to items about parent-student discussion of issues
Number of Polychoric Percent Mean Parent Mean Student Parent-StudentDiscussion Topics Response Pairs Correlation Match Response Response Difference
Selecting course/programs 11,305 .225 35.7 2.53 1.91 .615School activities/events 11,282 .306 39.9 2.58 2.04 .540Students’ studies 11,249 .254 42.0 2.51 2.01 .496Grades 11,203 .194 47.4 2.74 2.33 .411SAT/ACT preparation 11,256 .325 38.2 2.43 1.88 .552Applying to colleges 11,241 .461 52.7 2.66 2.31 .350Jobs after high school 11,187 .134 38.1 2.37 1.93 .441News events 11,212 .282 42.6 2.37 1.91 .465Students’ troubles 11,241 .282 38.3 2.59 1.98 .612SOURCE: U.S. Department of Education, National Center for Education Statistics, National Education Longitudinal Study, 1988(NELS:88) Second Follow-up Parent and Student Surveys.
Missing data from students are more of a problem for these items than most of the others, asshown in Table 3.7B. Roughly one-eighth of the students omitted these items. Generally, for bothsources, nonresponse was higher among those whose complementary source indicated less frequentdiscussions. The largest of these effects was for parents’ responses to the item about discussingschool activities: students whose parents did not respond to NELS:88 indicated fewer discussionsof school activities with their parents: a mean difference of .18 units less on the 1-to-3 scale [ t= -2.92, -6.58, -3.94, -0.67, -2.62, -3.74, -2.70, -4.52, -1.78, respectively]. The pattern for studentomission bias is less pronounced.
The performance of these items was similar across population subgroups, as shown in Table3.7C. There were no systematic patterns in the polychoric correlations, and the only consistentpattern involving average parent-student mean differences was the tendency for girls to agree withtheir parents, on average, more than boys, in recalling discussions on all nine topics [t=10.42, 9.12,9.25, 12.07, 9.09, 11.72, 5.23, 4.98, 10.26]. Nonresponse was more prevalent in some populationsubgroups, however: low SES students [9 t’s ranged from -6.09 to -6.65], males [9 t’s ranged from-9.56 to -9.97], students with low reading scores [ 9 t’s ranged from -14.26 to -15.29], and publicschool students [9 t’s ranged from �2.80 to �3.11] tended to omit the items about discussions withtheir parents at rates ranging from 13 to 18 percent, compared to 9 to 11 percent for other students.
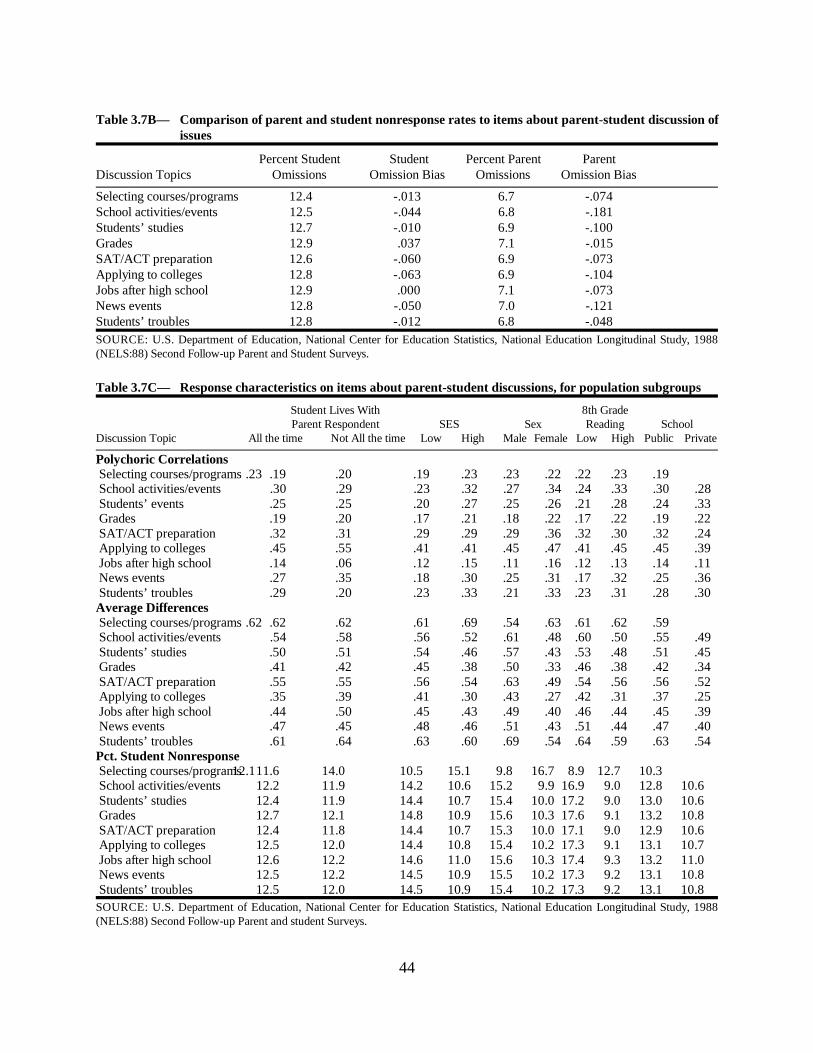
44
Table 3.7B— Comparison of parent and student nonresponse rates to items about parent-student discussion ofissues
Percent Student Student Percent Parent ParentDiscussion Topics Omissions Omission Bias Omissions Omission Bias
Selecting courses/programs 12.4 -.013 6.7 -.074School activities/events 12.5 -.044 6.8 -.181Students’ studies 12.7 -.010 6.9 -.100Grades 12.9 .037 7.1 -.015SAT/ACT preparation 12.6 -.060 6.9 -.073Applying to colleges 12.8 -.063 6.9 -.104Jobs after high school 12.9 .000 7.1 -.073News events 12.8 -.050 7.0 -.121Students’ troubles 12.8 -.012 6.8 -.048SOURCE: U.S. Department of Education, National Center for Education Statistics, National Education Longitudinal Study, 1988(NELS:88) Second Follow-up Parent and Student Surveys.
Table 3.7C— Response characteristics on items about parent-student discussions, for population subgroups
Student Lives With 8th GradeParent Respondent SES Sex Reading School
Discussion Topic All the time Not All the time Low High Male Female Low High Public Private
Polychoric Correlations Selecting courses/programs .23 .19 .20 .19 .23 .23 .22 .22 .23 .19 School activities/events .30 .29 .23 .32 .27 .34 .24 .33 .30 .28 Students’ events .25 .25 .20 .27 .25 .26 .21 .28 .24 .33 Grades .19 .20 .17 .21 .18 .22 .17 .22 .19 .22 SAT/ACT preparation .32 .31 .29 .29 .29 .36 .32 .30 .32 .24 Applying to colleges .45 .55 .41 .41 .45 .47 .41 .45 .45 .39 Jobs after high school .14 .06 .12 .15 .11 .16 .12 .13 .14 .11 News events .27 .35 .18 .30 .25 .31 .17 .32 .25 .36 Students’ troubles .29 .20 .23 .33 .21 .33 .23 .31 .28 .30Average Differences Selecting courses/programs .62 .62 .62 .61 .69 .54 .63 .61 .62 .59 School activities/events .54 .58 .56 .52 .61 .48 .60 .50 .55 .49 Students’ studies .50 .51 .54 .46 .57 .43 .53 .48 .51 .45 Grades .41 .42 .45 .38 .50 .33 .46 .38 .42 .34 SAT/ACT preparation .55 .55 .56 .54 .63 .49 .54 .56 .56 .52 Applying to colleges .35 .39 .41 .30 .43 .27 .42 .31 .37 .25 Jobs after high school .44 .50 .45 .43 .49 .40 .46 .44 .45 .39 News events .47 .45 .48 .46 .51 .43 .51 .44 .47 .40 Students’ troubles .61 .64 .63 .60 .69 .54 .64 .59 .63 .54Pct. Student Nonresponse Selecting courses/programs12.111.6 14.0 10.5 15.1 9.8 16.7 8.9 12.7 10.3 School activities/events 12.2 11.9 14.2 10.6 15.2 9.9 16.9 9.0 12.8 10.6 Students’ studies 12.4 11.9 14.4 10.7 15.4 10.0 17.2 9.0 13.0 10.6 Grades 12.7 12.1 14.8 10.9 15.6 10.3 17.6 9.1 13.2 10.8 SAT/ACT preparation 12.4 11.8 14.4 10.7 15.3 10.0 17.1 9.0 12.9 10.6 Applying to colleges 12.5 12.0 14.4 10.8 15.4 10.2 17.3 9.1 13.1 10.7 Jobs after high school 12.6 12.2 14.6 11.0 15.6 10.3 17.4 9.3 13.2 11.0 News events 12.5 12.2 14.5 10.9 15.5 10.2 17.3 9.2 13.1 10.8 Students’ troubles 12.5 12.0 14.5 10.9 15.4 10.2 17.3 9.2 13.1 10.8SOURCE: U.S. Department of Education, National Center for Education Statistics, National Education Longitudinal Study, 1988(NELS:88) Second Follow-up Parent and student Surveys.
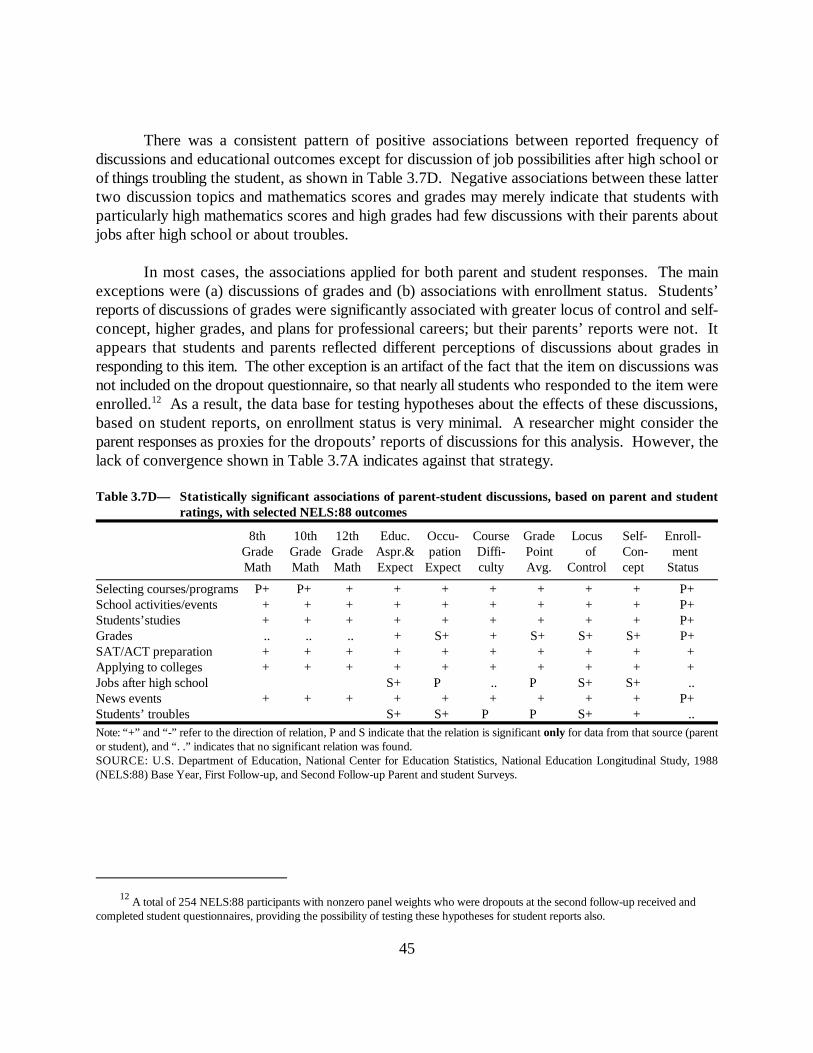
A total of 254 NELS:88 participants with nonzero panel weights who were dropouts at the second follow-up received and12
completed student questionnaires, providing the possibility of testing these hypotheses for student reports also.
45
There was a consistent pattern of positive associations between reported frequency ofdiscussions and educational outcomes except for discussion of job possibilities after high school orof things troubling the student, as shown in Table 3.7D. Negative associations between these lattertwo discussion topics and mathematics scores and grades may merely indicate that students withparticularly high mathematics scores and high grades had few discussions with their parents aboutjobs after high school or about troubles.
In most cases, the associations applied for both parent and student responses. The mainexceptions were (a) discussions of grades and (b) associations with enrollment status. Students’reports of discussions of grades were significantly associated with greater locus of control and self-concept, higher grades, and plans for professional careers; but their parents’ reports were not. Itappears that students and parents reflected different perceptions of discussions about grades inresponding to this item. The other exception is an artifact of the fact that the item on discussions wasnot included on the dropout questionnaire, so that nearly all students who responded to the item wereenrolled. As a result, the data base for testing hypotheses about the effects of these discussions,12
based on student reports, on enrollment status is very minimal. A researcher might consider theparent responses as proxies for the dropouts’ reports of discussions for this analysis. However, thelack of convergence shown in Table 3.7A indicates against that strategy.
Table 3.7D— Statistically significant associations of parent-student discussions, based on parent and studentratings, with selected NELS:88 outcomes
8th 10th 12th Educ. Occu- Course Grade Locus Self- Enroll-Grade Grade Grade Aspr.& pation Diffi- Point of Con- mentMath Math Math Expect Expect culty Avg. Control cept Status
Selecting courses/programs P+ P+ + + + + + + + P+School activities/events + + + + + + + + + P+Students’studies + + + + + + + + + P+Grades .. .. .. + S+ + S+ S+ S+ P+SAT/ACT preparation + + + + + + + + + +Applying to colleges + + + + + + + + + +Jobs after high school S+ P .. P S+ S+ ..News events + + + + + + + + + P+Students’ troubles S+ S+ P P S+ + ..Note: “+” and “-” refer to the direction of relation, P and S indicate that the relation is significant only for data from that source (parentor student), and “. .” indicates that no significant relation was found. SOURCE: U.S. Department of Education, National Center for Education Statistics, National Education Longitudinal Study, 1988(NELS:88) Base Year, First Follow-up, and Second Follow-up Parent and student Surveys.

46
Parent-Student Decisions on Drinking and Substance Problems
Another NELS:88 second follow-up item aimed to create a picture of family decisionmaking,asking who made decisions on a variety of topics about the student’s activities (parents alone, parentsafter discussion with student, parents and student together, student after discussion with parents, orstudent alone). Two were selected for analysis here; whether the student may drink alcohol whenparents are present and whether the student may drink alcohol at social gatherings at which theparents are not present. The question was:
Parent Question:48 (F2) In your family, who makes most of the decisions about each of the
following topics?
Student Question:98 (F2) In your family, who makes most of the decisions about each of the
following topics?
The response alternatives ranged from (1) parents decide alone to (5) student decides alone anddiffered only in the use of pronouns (“I” refers to the respondent in each case).
Also at the second follow-up, both parents and students were asked questions about studentuse of alcohol and drugs. The specific questions were:
Parent Question57 (F2) My teenager has a drinking problem.
My teenager has a drug problem.
(1) Strongly agree, (2) agree, (3) disagree, (4) strongly disagree, and (5) don’tknow)
Student Question85 (F2) Since the beginning of the school year, on how many occasions (if any) have you
been under the influence of the following on school grounds?AlcoholMarijuana or hashishCocaine (including crack)
The response alternatives for the student question were 0, 1-2, 3-19 and 20+ occasions, scaledfrom 0 to 3. The parent question was also placed on the same 4-point scale, treating “don’t know”as an omission of information. Both parent and student questions are sensitive and have quitedifferent response scales, but they address similar topics. Although the parent questions refer togeneral “problems” and the student questions refer to specific behaviors at school, they both address

47
drugs and alcohol, and it is important to know the extent to which they might be substitutable foreach other. The student question about “alcohol” was compared to the parent question on “adrinking problem,” and the student questions on “marijuana” and “cocaine” were separately comparedto the parent question on “a drug problem.”
The results shown in Table 3.8A suggest that the parent and student items on decisionmakingin the family are not measuring the same events. The polychoric correlations for the two items ondrinking were between .14 and .15. The percentages of matches were 37 for drinking with parents,and 30 for drinking elsewhere. On a scale from 1 (parent decision alone) to 5 (student decisionalone), the mean scores according to parents were 1.97 and 2.81, compared to 2.56 and 3.64according to students [t=31.23, 40.26]. Researchers who would include locus of familydecisionmaking in educational achievement models should be cautious about interpreting theseNELS:88 items as more than the individual opinions of students and parents about decisionmaking.
The polychoric correlations of the items about student substance abuse were also low (.26 foralcohol, .31 for marijuana, and .19 for cocaine), but they are higher than for the subjective item ondecisionmaking about drinking. Because the items are highly skewed (most students and parentsacknowledge no drinking or drug abuse or problem), the percentages of matches (67 percent,75 percent, and 77 percent) fail to convey the lack of convergence. Of course, the comparison ofmean scores on these scales only serves to indicate the differences between the response options forthe items.
Table 3.8A— Comparison of parent and student responses to items about substance use decisionmaking
Number of Polychoric Percent Mean Parent Mean Student Parent-StudentResponse Pairs Correlation Match Response Response Difference
Decide drinking alcoholwhen with parents 11,237 .148 36.7 1.97 2.56 -.585
Decide drinking alcoholwhen not with parents 11,336 .143 29.8 2.81 3.64 -.826
Alcohol at school 12,712 .258 67.4 .34 .18 .161Marijuana at school 12,128 .313 74.7 .27 .12 .149Cocaine at school 12,110 .194 77.1 .27 .02 .248SOURCE: U.S. Department of Education, National Center for Education Statistics, National Education Longitudinal Study, 1988(NELS:88) Second Follow-up Parent and Student Surveys.
Many students omitted the item on family decisionmaking, possibly because it was item 98on the questionnaire. By comparison, there was 8.0 to 9.5 percent nonresponse by parents on theseitems, due in part to overall follow-up attrition in parent responses. The nonresponse rate was similarfor both the alcohol and drug problem items. Students, on the other hand, were more likely to leavethe items on drugs unanswered than the item on drinking (13 percent vs. 9 percent). Students whoomitted the items on drug and alcohol use at school were more likely than those who answered them

48
to have parents who said they thought their teenager had a drinking or drug problem. Takentogether, these results suggest that student nonresponse to these items may be an indicator of adrinking or drug problem [t= 4.13, 5.00, 5.29, for alcohol, marijuana, cocaine].
Table 3.8B— Comparison of parent and student nonresponse rates to items about substance use decisionmaking
Percent Student Student Percent Parent ParentOmissions Omission Bias Omissions Omission Bias
Decide drinking alcoholwhen with parents 18.8 -.016 9.5 .254
Decide drinking alcoholwhen not with parents 18.3 .061 9.2 .039
Alcohol at school 8.9 .077 8.0 .012Marijuana at school 13.4 .072 8.3 .090Cocaine at school 13.6 .076 8.3 .018SOURCE: U.S. Department of Education, National Center for Education Statistics, National Education Longitudinal Study, 1988(NELS:88) Second Follow-up Parent and Student Surveys.
As shown in Table 3.8C, the low convergence on these items was found in all of thepopulation subgroups studied; however, the mean parent-student differences on who decides aboutdrinking when parents are present varied. The mean discrepancy between parent and studentresponses was greater when the student did not live with the parent respondent all of the time[t=6.50], when SES [t=9.47] and reading scores were low [t=11.94], when the student was male[t=4.43], and when the student was in public school [t=2.46]. Finally, all but the smallestsubpopulation difference in student nonresponse were significant, the largest being the differences ondecisionmaking related to whether the student was living with the parent respondent all the time[t=17.24, 17.53] and the differences on substance use/problems between students with low and highreading scores [t=13.71, 16.42, 17.27].
The relations between these items and educational outcome measures follow distinctivepatterns, as shown in Table 3.8D. For the three substance abuse items, the source of the informationdoes not alter the significance of the negative effect (the lack of a significant student finding forenrollment status is an artifact of not including the items on the dropout questionnaire). The twodecisionmaking items have different patterns. In both cases, student reports that the student makesthe decisions are negatively associated with educational outcomes. For decisions about drinkingwhen parents are present, however, the same reports from parents are positively associated withoutcomes. The conclusion to be drawn is that these decisionmaking items must be considered asparents’ and teenagers’ perceptions of behavior, rather than actual behavior.

49
Table 3.8C— Response characteristics on items about substance use decisionmakingStudent Lives with 8th GradeParent Respondent SES Sex Reading School
All the time Not all the time Low High Male Female Low High Public Private
Polychoric Correlations Decide drinking alcohol when with parents .14 .22 .15 .16 .14 .15 .11 .19 .13 .23 Decide drinking alcohol when not with parents .14 .19 .13 .16 .13 .15 .10 .17 .14 .18 Alcohol at school .24 .21 .20 .28 .25 .21 .21 .26 .25 .23 Marijuana at school .29 .33 .28 .36 .32 .29 .29 .33 .32 .26 Cocaine at school .18 .18 .17 .18 .14 .26 .18 .19 .19 .16Average Differences Decide drinking alcohol when with parents -.55 -1.00 -.77 -.42 -.67 -.50 -.85 -.39 -.59 -.46Decide drinking alcohol when not with parents -.80 -1.10 -.83 -.82 -.89 -.76 -.82 -.83 -.82 -.80 Alcohol at school .22 .52 .34 .16 .22 .27 .32 .18 .25 .14 Marijuana at school .21 .44 .33 .15 .22 .24 .31 .17 .24 .15 Cocaine at school .30 .63 .42 .25 .36 .31 .43 .26 .34 .24Pct. Student Nonresponse Decide drinking alcohol when with parents 16.3 34.9 21.5 15.1 20.3 17.3 24.1 14.0 19.0 14.6Decide drinking alcohol when not with parents 15.8 34.5 20.9 14.8 19.8 16.8 23.8 13.3 18.5 14.0 Alcohol at school 8.6 9.0 9.9 7.5 11.0 6.9 11.9 6.1 9.3 6.5 Marijuana at school 12.4 15.3 13.9 11.6 15.9 11.1 17.1 10.0 13.6 11.0 Cocaine at school 12.5 15.4 14.1 11.6 16.1 11.2 17.4 10.0 13.7 11.2SOURCE: U.S. Department of Education, National Center for Education Statistics, National Education Longitudinal Study, 1988(NELS:88) Second Follow-up Parent and student Surveys.
Table 3.8D— Statistically significant associations of substance use decisionmaking, based on parent and studentresponses, with selected NELS:88 outcomes
8th 10th 12th Educ. Occu- Course Grade Locus Self- Enroll-Grade Grade Grade Aspr.& pation Diffi- Point of Con- mentMath Math Math Expect Expect culty Avg. Control cept Status
Parents decide drinking when with parents P+S P+S P+S P+S S P+S P+S P+S .. P+S Parents decide drinking when not with parents .. P+ .. .. S S S S .. S Alcohol at school .. P Marijuana at school S P Cocaine at school S P
Note: “+” and “-” refer to the direction of relation, P and S indicate that the relation is significant only for data from that source (parentor student), and “. .” indicates that no significant relation was found.SOURCE: U.S. Department of Education, National Center for Education Statistics, National Education Longitudinal Study, 1988(NELS:88) Base Year, First Follow-up, and Second Follow-up Parent and student Surveys.
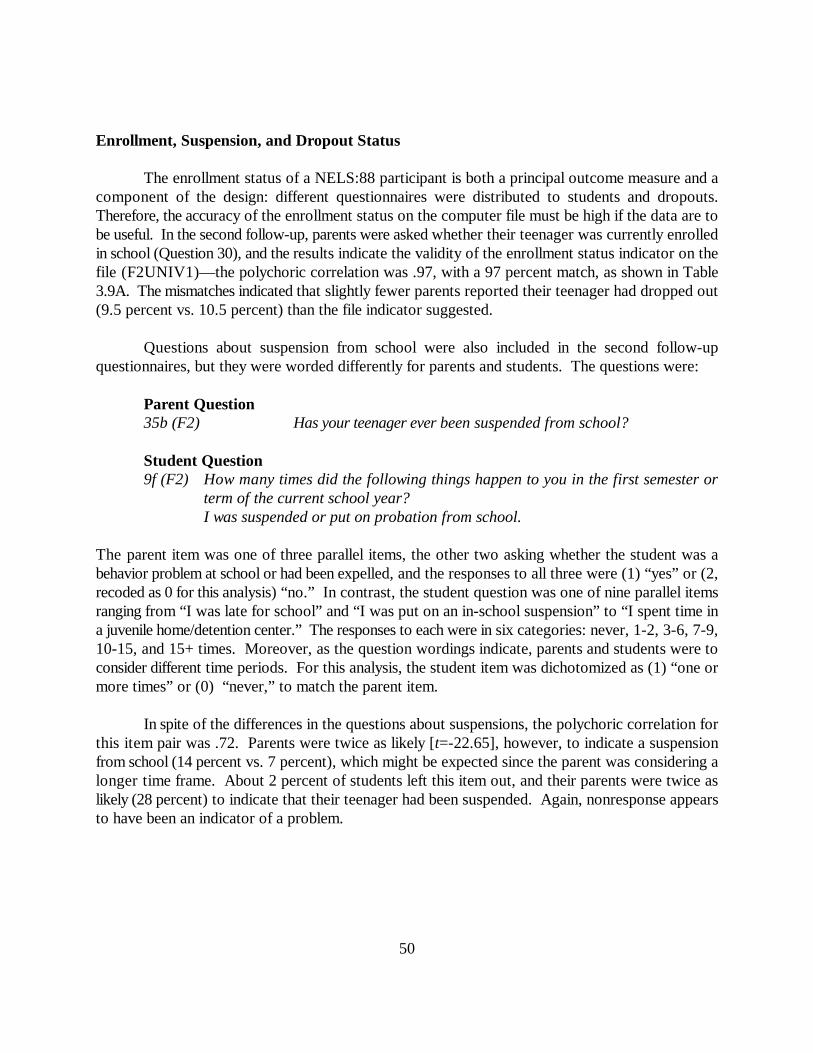
50
Enrollment, Suspension, and Dropout Status
The enrollment status of a NELS:88 participant is both a principal outcome measure and acomponent of the design: different questionnaires were distributed to students and dropouts.Therefore, the accuracy of the enrollment status on the computer file must be high if the data are tobe useful. In the second follow-up, parents were asked whether their teenager was currently enrolledin school (Question 30), and the results indicate the validity of the enrollment status indicator on thefile (F2UNIV1)—the polychoric correlation was .97, with a 97 percent match, as shown in Table3.9A. The mismatches indicated that slightly fewer parents reported their teenager had dropped out(9.5 percent vs. 10.5 percent) than the file indicator suggested.
Questions about suspension from school were also included in the second follow-upquestionnaires, but they were worded differently for parents and students. The questions were:
Parent Question35b (F2) Has your teenager ever been suspended from school?
Student Question9f (F2) How many times did the following things happen to you in the first semester or
term of the current school year? I was suspended or put on probation from school.
The parent item was one of three parallel items, the other two asking whether the student was abehavior problem at school or had been expelled, and the responses to all three were (1) “yes” or (2,recoded as 0 for this analysis) “no.” In contrast, the student question was one of nine parallel itemsranging from “I was late for school” and “I was put on an in-school suspension” to “I spent time ina juvenile home/detention center.” The responses to each were in six categories: never, 1-2, 3-6, 7-9,10-15, and 15+ times. Moreover, as the question wordings indicate, parents and students were toconsider different time periods. For this analysis, the student item was dichotomized as (1) “one ormore times” or (0) “never,” to match the parent item.
In spite of the differences in the questions about suspensions, the polychoric correlation forthis item pair was .72. Parents were twice as likely [t=-22.65], however, to indicate a suspensionfrom school (14 percent vs. 7 percent), which might be expected since the parent was considering alonger time frame. About 2 percent of students left this item out, and their parents were twice aslikely (28 percent) to indicate that their teenager had been suspended. Again, nonresponse appearsto have been an indicator of a problem.

51
Table 3.9A— Comparison of parent and student responses to items about suspensions and dropping outNumber of Polychoric Percent Mean Parent Mean Student Parent-Student
Response Pairs Correlation Match Response Response DifferenceEnrolled 14,223 .973 96.6 0.91 0.88 .029Suspended 13,763 .718 88.4 0.14 0.07 .064Note: For enrollment, the student response is the file indicator variable, not a student response to an item.SOURCE: U.S. Department of Education, National Center for Education Statistics, National Education Longitudinal Study, 1988(NELS:88) Second Follow-up Parent and Student Surveys.
Table 3.9B— Comparison of parent and student nonresponse rates to items about suspensions and dropping out
Percent Student Student Percent Parent ParentOmissions Omission Bias Omissions Omission Bias
Enrolled -- -- 5.9 -.150Suspended 1.9 .145 7.3 .040Note: “ - -” indicates that the comparison would not be appropriate because the predictor and outcome measures are the same.SOURCE: U.S. Department of Education, National Center for Education Statistics, National Education Longitudinal Study, 1988(NELS:88) Second Follow-up Parent and Student Surveys.
There was a sharp difference in parent-student agreement on suspensions depending onwhether the student was in a public or private school [t=11.84]: students enrolled in private schoolswere less likely to be in agreement. Also, students with lower SES, with lower eighth grade readingscores, enrolled in public school, and not always living with the parent respondent, were more likelythan their parents to indicate having been suspended [t=7.87, 7.26, 8.78, 5.49].
Table 3.9C— Response characteristics on items about suspensions and dropping out, for population subgroups
Student Lives with 8th GradeParent Respondent SES Sex Reading School
All the time Not all the time Low High Male Female Low High Public Private
Polychoric Correlations Enrolled .97 .96 .97 .95 .97 .97 .97 .95 .98 .93 Suspended .72 .66 .69 .72 .70 .70 .68 .71 .73 .56Average Differences Enrolled -.01 -.04 -.01 -.00 -.01 -.01 -.02 -.00 .00 .00 Suspended -.06 -.11 -.09 -.04 -.08 -.05 -.09 -.04 -.07 .00Pct. Student Nonresponse Enrolled -- -- -- -- -- -- -- -- -- -- Suspended 1.6 3.8 2.1 1.5 2.4 1.4 2.5 1.3 1.7 1.7Note: “ - -” indicates that statistics is not meaningful because it is based on a file indicator measure.SOURCE: U.S. Department of Education, National Center for Education Statistics, National Education Longitudinal Study, 1988(NELS:88) Second Follow-up Parent and student Surveys.
The information displayed in Table 3.9D indicates significant relations between enrollmentstatus and educational outcomes for both parent and student reports. Furthermore, because the items
52
are so highly correlated, parent information on enrollment status appears to be an acceptablesubstitute for more complete information. Suspensions are significantly negatively related to outcomemeasures, with the exception that the association with student self-concept was only significant whenthe report was from parents.
Table 3.9D— Statistically significant associations of suspensions and enrollment status, based on parent andstudent responses, with selected NELS:88 outcomes
8th 10th 12th Educ. Occu- Course Grade Locus Self- Enroll-Grade Grade Grade Aspr.& pation Diffi- Point of Con- mentMath Math Math Expect Expect culty Avg. Control cept Status
Enrolled + + + + + + + + + + Suspended P Note: “+” and “-” refer to the direction of relation, P and S indicate that the relation is significant only for data from that source (parentor student), and “. .” indicates that no significant relation was found.SOURCE: U.S. Department of Education, National Center for Education Statistics, National Education Longitudinal Study, 1988(NELS:88) Base Year, First Follow-up, and Second Follow-up Parent and student Surveys.
Educational Aspirations and Expectations
The second follow-up included questions to students about what level of education thestudent’s mother and father wanted their teenager to attain and a question to parents about what levelof education they wanted their teenager to attain. The base year and second follow-up studentquestionnaires also included a question asking about how far the student would go in school. For thisanalysis, students’ expectations were compared to parents’ aspirations for them. The base yearquestions were in different units, and it was necessary to collapse the parent response alternatives tomatch the eighth grade student item, which was scored from 1 to 6. The second follow-up items, onthe other hand, were scored from 1 to 12.
Parent Questions
76 (BY) How far in school do you want your eighth grader to get?61 (F2) How far in school do you want your teenager to go?
Student Questions
45 (BY) & 43 (F2) As things stand now, how far in school do you think you will get? 42a (F2) How far in school do you think your father (or male guardian) wants you to go?
42b (F2) How far in school do you think your mother (or female guardian) wants you to go?
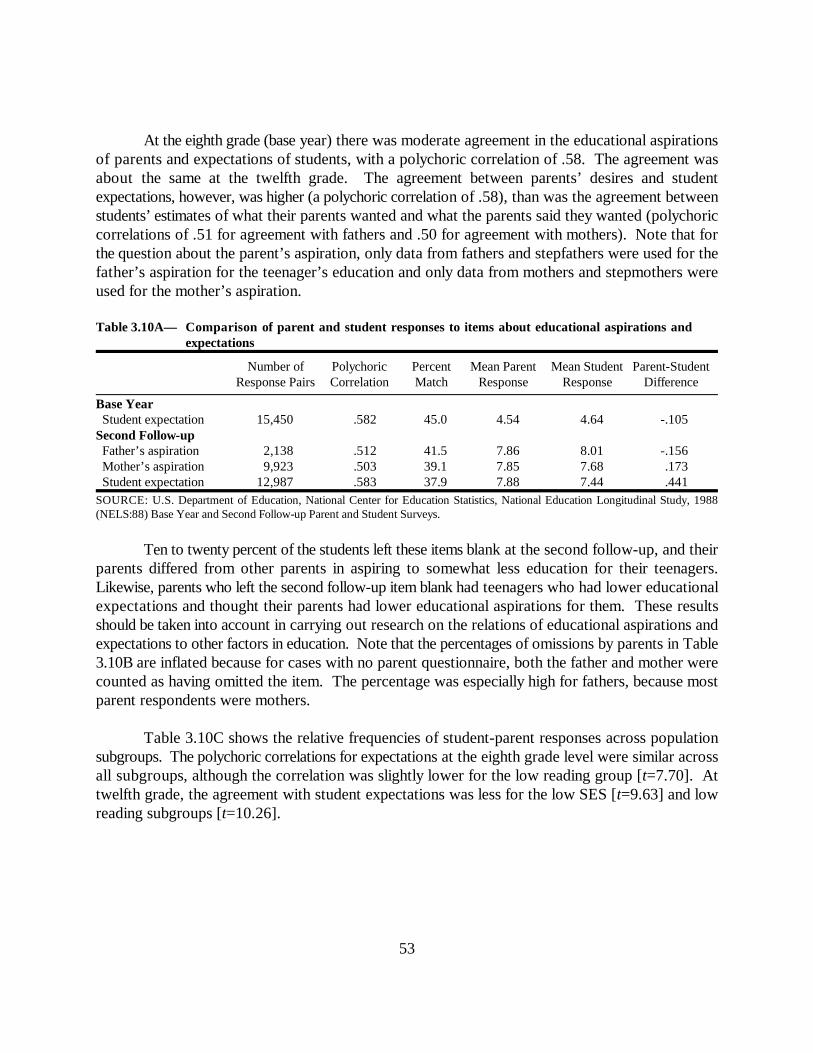
53
At the eighth grade (base year) there was moderate agreement in the educational aspirationsof parents and expectations of students, with a polychoric correlation of .58. The agreement wasabout the same at the twelfth grade. The agreement between parents’ desires and studentexpectations, however, was higher (a polychoric correlation of .58), than was the agreement betweenstudents’ estimates of what their parents wanted and what the parents said they wanted (polychoriccorrelations of .51 for agreement with fathers and .50 for agreement with mothers). Note that forthe question about the parent’s aspiration, only data from fathers and stepfathers were used for thefather’s aspiration for the teenager’s education and only data from mothers and stepmothers wereused for the mother’s aspiration.
Table 3.10A— Comparison of parent and student responses to items about educational aspirations and expectations
Number of Polychoric Percent Mean Parent Mean Student Parent-StudentResponse Pairs Correlation Match Response Response Difference
Base Year Student expectation 15,450 .582 45.0 4.54 4.64 -.105Second Follow-up Father’s aspiration 2,138 .512 41.5 7.86 8.01 -.156 Mother’s aspiration 9,923 .503 39.1 7.85 7.68 .173 Student expectation 12,987 .583 37.9 7.88 7.44 .441SOURCE: U.S. Department of Education, National Center for Education Statistics, National Education Longitudinal Study, 1988(NELS:88) Base Year and Second Follow-up Parent and Student Surveys.
Ten to twenty percent of the students left these items blank at the second follow-up, and theirparents differed from other parents in aspiring to somewhat less education for their teenagers.Likewise, parents who left the second follow-up item blank had teenagers who had lower educationalexpectations and thought their parents had lower educational aspirations for them. These resultsshould be taken into account in carrying out research on the relations of educational aspirations andexpectations to other factors in education. Note that the percentages of omissions by parents in Table3.10B are inflated because for cases with no parent questionnaire, both the father and mother werecounted as having omitted the item. The percentage was especially high for fathers, because mostparent respondents were mothers.
Table 3.10C shows the relative frequencies of student-parent responses across populationsubgroups. The polychoric correlations for expectations at the eighth grade level were similar acrossall subgroups, although the correlation was slightly lower for the low reading group [t=7.70]. Attwelfth grade, the agreement with student expectations was less for the low SES [t=9.63] and lowreading subgroups [t=10.26].

54
Table 3.10B— Comparison of parent and student nonresponse rates to items about educational aspirations andexpectations
Percent Student Student Percent Parent ParentOmissions Omission Bias Omissions Omission Bias
Base Year Student expectation .7 -.496 5.7 .001Second Follow-up Father’s aspiration 17.4 -1.097 25.6 -.940 Mother’s aspiration 14.6 -.921 7.0 -.552 Student expectation 9.1 -.606 5.9 -.893SOURCE: U.S. Department of Education, National Center for Education Statistics, National Education Longitudinal Study, 1988(NELS:88) Base Year and Second Follow-up Parent and Student Surveys.
Table 3.10C— Response characteristics on items about educational aspirations and expectations, for populationsubgroups
Student Lives with 8th GradeParent Respondent SES Sex Reading School
All the time Not all the time Low High Male Female Low High Public Private
Polychoric Correlations Education expected (BY) .59 .60 .51 .54 .59 .59 .48 .57 .57 .54 Father’s aspiration .52 .41 .45 .48 .52 .50 .43 .51 .52 .39 Mother’s aspiration .50 .47 .42 .51 .51 .49 .42 .50 .48 .51 Student expectation .58 .53 .48 .60 .59 .57 .47 .60 .56 .61Average Differences Education expected (BY) -.12 -.06 -.15 -.08 -.07 -.16 -.11 -.12 -.13 -.06 Father’s aspiration -.14 -.27 -.10 -.19 -.07 -.25 -.21 -.11 -.18 -.05 Mother’s aspiration .18 .11 .27 .08 .16 .18 .21 .14 .18 .18 Student expectation .42 .65 .67 .23 .48 .40 .69 .25 .47 .19Pct. Student Nonresponse Education expected (BY) .7 .4 1.0 .5 .8 .6 .8 .2 .8 .3 Father’s aspiration 16.2 23.5 23.8 10.9 18.7 16.1 24.4 11.2 18.2 10.6 Mother’s aspiration 13.6 18.5 18.9 9.6 16.6 12.6 20.7 9.0 15.2 9.6 Student expectation 8.4 12.4 10.9 6.8 10.8 7.4 12.6 6.1 9.2 7.0SOURCE: U.S. Department of Education, National Center for Education Statistics, National Education Longitudinal Study, 1988(NELS:88) Base Year and Second Follow-up Parent and student Surveys.
At the eighth grade level, average parent aspirations were lower than student expectations,and this discrepancy was larger for low SES students [t=-3.17] and for girls [t=4.55]. In contrast, atthe twelfth grade the differences between parents’ desires for their teenagers and student expectationswere positive in all subgroups—in these cases, parents’ desires exceeded students’ personalexpectations. The parent-student difference was especially large for the low SES [t=12.00] and lowreading [t=11.84] groups (parent-student differences of more than .6 for both groups). Studentnonresponse rates at the eighth grade level were low across all subgroups. Nonresponse rates at the

55
twelfth grade level, however, were somewhat higher, and higher for students in the low reading group[t=-21.50, -21.02, -13.51] and low SES group [t=-20.12, -15.96, -8.66] than other students.
Research in educational psychology suggests that educational expectations may influencestudents’ educational achievement. Table 3.10D displays the significance of educational expectationsin relation to select NELS:88 outcomes. Uniformly, educational expectations at the eighth grade levelare positively and significantly related to the outcome measures. This relation holds true regardlessof whether one uses educational expectation information from the student or aspiration informationfrom parent surveys. Educational expectations at the twelfth grade level show similar (positive andsignificant) relations to the outcome measures. Again, either source of information produces theseresults.
Table 3.10D— Statistically significant associations of educational aspirations and expectations, based on parentand student responses, with selected NELS:88 outcomes
8th 10th 12th Educ. Occu- Course Grade Locus Self- Enroll-Grade Grade Grade Aspr.& pation Diffi- Point of Con- mentMath Math Math Expect Expect culty Avg. Control cept Status
Base Year Education expected + + + + + + + + + + Second Follow-up Education expected + + + -- + + + + + + Note: “+” and “-” refer to the direction of relation, P and S indicate that the relation is significant only for data from that source (parentor student), and “. .” indicates that no significant relation was found.“ --” indicates that the comparison would not be appropriate because the predictor and outcome measures are the same.SOURCE: U.S. Department of Education, National Center for Education Statistics, National Education Longitudinal Study, 1988(NELS:88) Base Year, First Follow-up, and Second Follow-up Parent and student Surveys.
College Choice Factors
Both students and parents of students who were considering college were asked a questionon the second follow-up about the importance of 18 different factors in selecting a college. Thequestion was:
Parent Question66 (F2) How important is or was each of the following to you in your teenager’s choice
of a school to attend after high school?
Student Question59 (F2) How important is or was each of the following in choosing a school you would like
to attend?
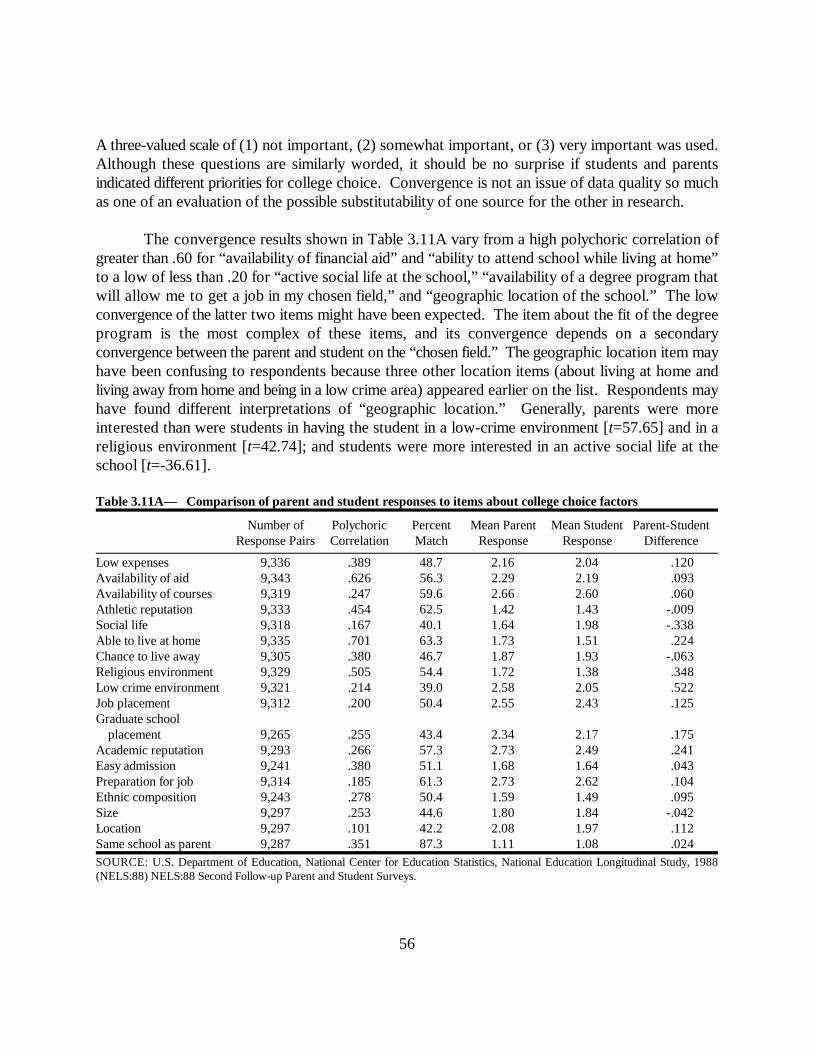
56
A three-valued scale of (1) not important, (2) somewhat important, or (3) very important was used.Although these questions are similarly worded, it should be no surprise if students and parentsindicated different priorities for college choice. Convergence is not an issue of data quality so muchas one of an evaluation of the possible substitutability of one source for the other in research.
The convergence results shown in Table 3.11A vary from a high polychoric correlation ofgreater than .60 for “availability of financial aid” and “ability to attend school while living at home”to a low of less than .20 for “active social life at the school,” “availability of a degree program thatwill allow me to get a job in my chosen field,” and “geographic location of the school.” The lowconvergence of the latter two items might have been expected. The item about the fit of the degreeprogram is the most complex of these items, and its convergence depends on a secondaryconvergence between the parent and student on the “chosen field.” The geographic location item mayhave been confusing to respondents because three other location items (about living at home andliving away from home and being in a low crime area) appeared earlier on the list. Respondents mayhave found different interpretations of “geographic location.” Generally, parents were moreinterested than were students in having the student in a low-crime environment [t=57.65] and in areligious environment [t=42.74]; and students were more interested in an active social life at theschool [t=-36.61].
Table 3.11A— Comparison of parent and student responses to items about college choice factors
Number of Polychoric Percent Mean Parent Mean Student Parent-StudentResponse Pairs Correlation Match Response Response Difference
Low expenses 9,336 .389 48.7 2.16 2.04 .120Availability of aid 9,343 .626 56.3 2.29 2.19 .093Availability of courses 9,319 .247 59.6 2.66 2.60 .060Athletic reputation 9,333 .454 62.5 1.42 1.43 -.009Social life 9,318 .167 40.1 1.64 1.98 -.338Able to live at home 9,335 .701 63.3 1.73 1.51 .224Chance to live away 9,305 .380 46.7 1.87 1.93 -.063Religious environment 9,329 .505 54.4 1.72 1.38 .348Low crime environment 9,321 .214 39.0 2.58 2.05 .522Job placement 9,312 .200 50.4 2.55 2.43 .125Graduate school
placement 9,265 .255 43.4 2.34 2.17 .175Academic reputation 9,293 .266 57.3 2.73 2.49 .241Easy admission 9,241 .380 51.1 1.68 1.64 .043Preparation for job 9,314 .185 61.3 2.73 2.62 .104Ethnic composition 9,243 .278 50.4 1.59 1.49 .095Size 9,297 .253 44.6 1.80 1.84 -.042Location 9,297 .101 42.2 2.08 1.97 .112Same school as parent 9,287 .351 87.3 1.11 1.08 .024SOURCE: U.S. Department of Education, National Center for Education Statistics, National Education Longitudinal Study, 1988(NELS:88) NELS:88 Second Follow-up Parent and Student Surveys.
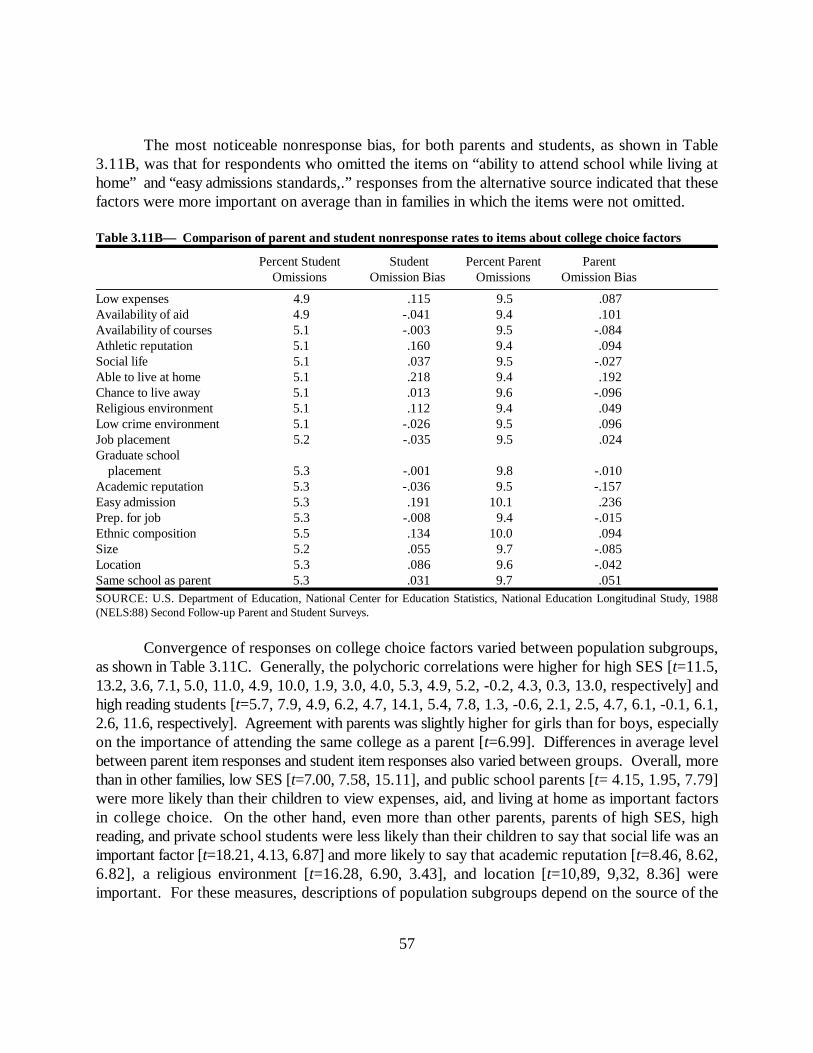
57
The most noticeable nonresponse bias, for both parents and students, as shown in Table3.11B, was that for respondents who omitted the items on “ability to attend school while living athome” and “easy admissions standards,.” responses from the alternative source indicated that thesefactors were more important on average than in families in which the items were not omitted.
Table 3.11B— Comparison of parent and student nonresponse rates to items about college choice factors
Percent Student Student Percent Parent ParentOmissions Omission Bias Omissions Omission Bias
Low expenses 4.9 .115 9.5 .087Availability of aid 4.9 -.041 9.4 .101Availability of courses 5.1 -.003 9.5 -.084Athletic reputation 5.1 .160 9.4 .094Social life 5.1 .037 9.5 -.027Able to live at home 5.1 .218 9.4 .192Chance to live away 5.1 .013 9.6 -.096Religious environment 5.1 .112 9.4 .049Low crime environment 5.1 -.026 9.5 .096Job placement 5.2 -.035 9.5 .024Graduate school
placement 5.3 -.001 9.8 -.010Academic reputation 5.3 -.036 9.5 -.157Easy admission 5.3 .191 10.1 .236Prep. for job 5.3 -.008 9.4 -.015Ethnic composition 5.5 .134 10.0 .094Size 5.2 .055 9.7 -.085Location 5.3 .086 9.6 -.042Same school as parent 5.3 .031 9.7 .051SOURCE: U.S. Department of Education, National Center for Education Statistics, National Education Longitudinal Study, 1988(NELS:88) Second Follow-up Parent and Student Surveys.
Convergence of responses on college choice factors varied between population subgroups,as shown in Table 3.11C. Generally, the polychoric correlations were higher for high SES [t=11.5,13.2, 3.6, 7.1, 5.0, 11.0, 4.9, 10.0, 1.9, 3.0, 4.0, 5.3, 4.9, 5.2, -0.2, 4.3, 0.3, 13.0, respectively] andhigh reading students [t=5.7, 7.9, 4.9, 6.2, 4.7, 14.1, 5.4, 7.8, 1.3, -0.6, 2.1, 2.5, 4.7, 6.1, -0.1, 6.1,2.6, 11.6, respectively]. Agreement with parents was slightly higher for girls than for boys, especiallyon the importance of attending the same college as a parent [t=6.99]. Differences in average levelbetween parent item responses and student item responses also varied between groups. Overall, morethan in other families, low SES [t=7.00, 7.58, 15.11], and public school parents [t= 4.15, 1.95, 7.79]were more likely than their children to view expenses, aid, and living at home as important factorsin college choice. On the other hand, even more than other parents, parents of high SES, highreading, and private school students were less likely than their children to say that social life was animportant factor [t=18.21, 4.13, 6.87] and more likely to say that academic reputation [t=8.46, 8.62,6.82], a religious environment [t=16.28, 6.90, 3.43], and location [t=10,89, 9,32, 8.36] wereimportant. For these measures, descriptions of population subgroups depend on the source of the
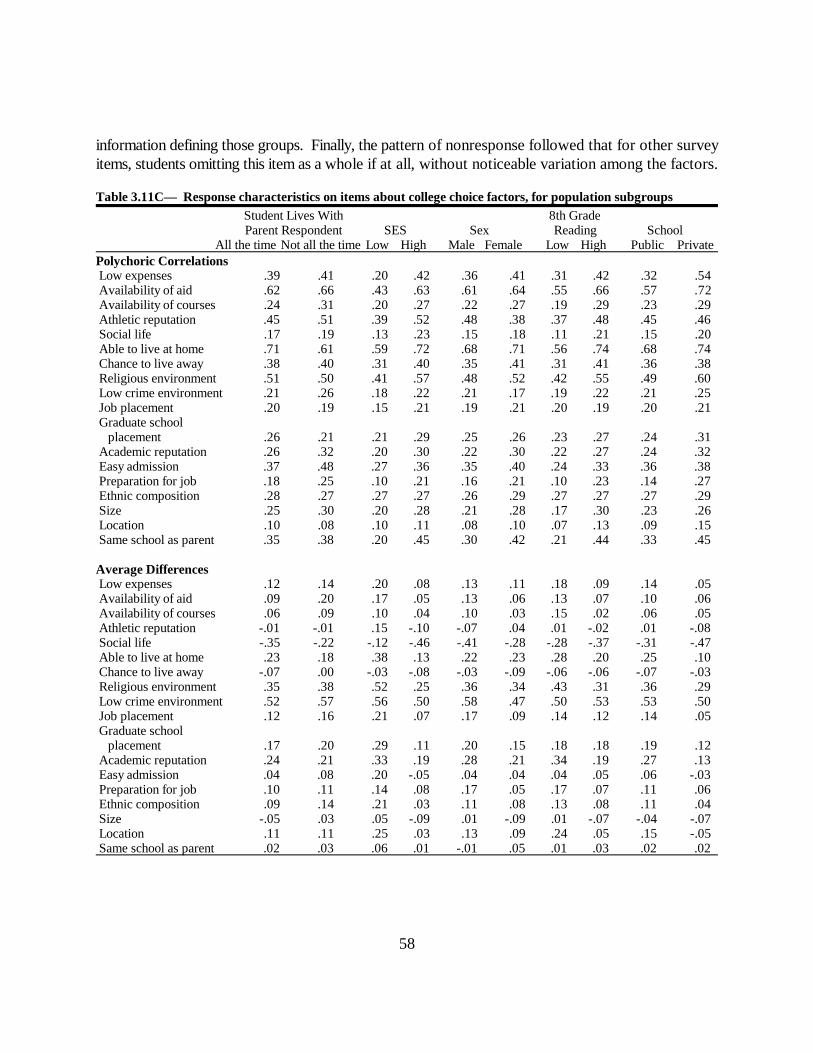
58
information defining those groups. Finally, the pattern of nonresponse followed that for other surveyitems, students omitting this item as a whole if at all, without noticeable variation among the factors.
Table 3.11C— Response characteristics on items about college choice factors, for population subgroupsStudent Lives With 8th GradeParent Respondent SES Sex Reading School
All the time Not all the time Low High Male Female Low High Public PrivatePolychoric Correlations Low expenses .39 .41 .20 .42 .36 .41 .31 .42 .32 .54 Availability of aid .62 .66 .43 .63 .61 .64 .55 .66 .57 .72 Availability of courses .24 .31 .20 .27 .22 .27 .19 .29 .23 .29 Athletic reputation .45 .51 .39 .52 .48 .38 .37 .48 .45 .46 Social life .17 .19 .13 .23 .15 .18 .11 .21 .15 .20 Able to live at home .71 .61 .59 .72 .68 .71 .56 .74 .68 .74 Chance to live away .38 .40 .31 .40 .35 .41 .31 .41 .36 .38 Religious environment .51 .50 .41 .57 .48 .52 .42 .55 .49 .60 Low crime environment .21 .26 .18 .22 .21 .17 .19 .22 .21 .25 Job placement .20 .19 .15 .21 .19 .21 .20 .19 .20 .21 Graduate school
placement .26 .21 .21 .29 .25 .26 .23 .27 .24 .31 Academic reputation .26 .32 .20 .30 .22 .30 .22 .27 .24 .32 Easy admission .37 .48 .27 .36 .35 .40 .24 .33 .36 .38 Preparation for job .18 .25 .10 .21 .16 .21 .10 .23 .14 .27 Ethnic composition .28 .27 .27 .27 .26 .29 .27 .27 .27 .29 Size .25 .30 .20 .28 .21 .28 .17 .30 .23 .26 Location .10 .08 .10 .11 .08 .10 .07 .13 .09 .15 Same school as parent .35 .38 .20 .45 .30 .42 .21 .44 .33 .45 Average Differences Low expenses .12 .14 .20 .08 .13 .11 .18 .09 .14 .05 Availability of aid .09 .20 .17 .05 .13 .06 .13 .07 .10 .06 Availability of courses .06 .09 .10 .04 .10 .03 .15 .02 .06 .05 Athletic reputation -.01 -.01 .15 -.10 -.07 .04 .01 -.02 .01 -.08 Social life -.35 -.22 -.12 -.46 -.41 -.28 -.28 -.37 -.31 -.47 Able to live at home .23 .18 .38 .13 .22 .23 .28 .20 .25 .10 Chance to live away -.07 .00 -.03 -.08 -.03 -.09 -.06 -.06 -.07 -.03 Religious environment .35 .38 .52 .25 .36 .34 .43 .31 .36 .29 Low crime environment .52 .57 .56 .50 .58 .47 .50 .53 .53 .50 Job placement .12 .16 .21 .07 .17 .09 .14 .12 .14 .05 Graduate school
placement .17 .20 .29 .11 .20 .15 .18 .18 .19 .12 Academic reputation .24 .21 .33 .19 .28 .21 .34 .19 .27 .13 Easy admission .04 .08 .20 -.05 .04 .04 .04 .05 .06 -.03 Preparation for job .10 .11 .14 .08 .17 .05 .17 .07 .11 .06 Ethnic composition .09 .14 .21 .03 .11 .08 .13 .08 .11 .04 Size -.05 .03 .05 -.09 .01 -.09 .01 -.07 -.04 -.07 Location .11 .11 .25 .03 .13 .09 .24 .05 .15 -.05 Same school as parent .02 .03 .06 .01 -.01 .05 .01 .03 .02 .02

59
Table 3.11C— Response characteristics on items about college choice factors, for populationsubgroups—Continued
Student Lives With 8th GradeParent Respondent SES Sex Reading School
All the time Not all the time Low High Male Female Low High Public Private
Pct. Student Nonresponse Low expenses 4.5 5.8 5.7 3.8 6.4 3.4 7.1 3.0 5.0 3.2 Availability of aid 4.6 5.8 5.8 3.9 6.5 3.5 7.2 3.0 5.1 3.3 Availability of courses 4.8 6.1 6.0 4.0 6.7 3.6 7.5 3.1 5.3 3.5 Athletic reputation 4.7 5.9 6.0 3.9 6.6 3.6 7.4 3.1 5.2 3.3 Social life 4.7 5.9 5.9 4.0 6.6 3.6 7.4 3.2 5.2 3.5 Able to live at home 4.7 5.9 6.0 3.9 6.6 3.6 7.4 3.1 5.2 3.3 Chance to live far away 4.7 6.2 6.0 4.0 6.7 3.6 7.6 3.1 5.3 3.4 Religious environment 4.8 5.9 6.0 4.0 6.7 3.6 7.5 3.1 5.3 3.4 Low crime environment 4.8 5.9 6.0 4.0 6.7 3.6 7.4 3.2 5.3 3.3 Job placement 4.8 6.0 6.0 4.1 6.8 3.6 7.5 3.2 5.4 3.4 Graduate school placement 5.0 6.1 6.3 4.2 6.9 3.8 7.6 3.4 5.5 3.5 Academic reputation 5.0 6.1 6.3 4.2 7.0 3.8 7.7 3.3 5.5 3.6 Easy admissions 4.9 6.1 6.3 4.1 6.9 3.8 7.8 3.3 5.5 3.6 Preparation for job 4.9 6.0 6.2 4.1 6.9 3.8 7.7 3.3 5.5 3.6 Ethnic composition 5.1 6.3 6.5 4.3 7.2 3.9 8.0 3.4 5.6 3.7 Size 4.9 6.1 6.1 4.1 6.9 3.6 7.6 3.3 5.4 3.5 Location 5.0 6.0 6.4 4.1 7.0 3.8 7.8 3.3 5.5 3.4 Same school as parent 4.9 6.0 6.2 4.1 7.0 3.6 7.7 3.3 5.4 3.5SOURCE: U.S. Department of Education, National Center for Education Statistics, National Education Longitudinal Study, 1988(NELS:88) Second Follow-up Parent and student Surveys.
Whether students or parents provide the ratings on college choice factors can make animportant difference in the results of research on educational outcomes, as shown in Table 3.11D.The importance of course offerings, preparation for job, and college location in choosing a collegeare positively related to outcome measures, but for the most part only if based on student ratings.On the other hand, the importance of availability of college aid, college social life, and job placementsare negatively related to these outcomes, but for the most part only if based on parent ratings.Because of this symmetry—each source is significantly related to some outcomes to which the otheris not—it is not reasonable to assume that one source is merely a less reliable or valid measure of theother. Each source represents a different, although related, construct.
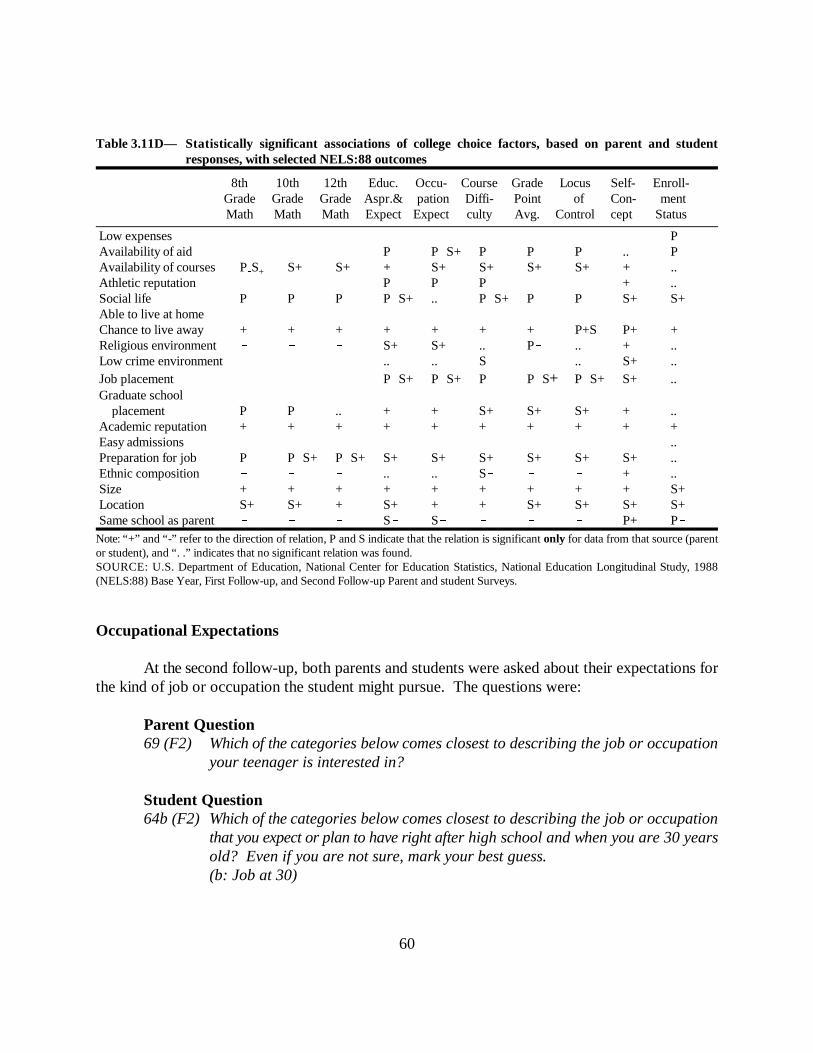
60
Table 3.11D— Statistically significant associations of college choice factors, based on parent and studentresponses, with selected NELS:88 outcomes
8th 10th 12th Educ. Occu- Course Grade Locus Self- Enroll-Grade Grade Grade Aspr.& pation Diffi- Point of Con- mentMath Math Math Expect Expect culty Avg. Control cept Status
Low expenses P Availability of aid P PS+ P P P .. P Availability of courses P S S+ S+ + S+ S+ S+ S+ + ..
+ Athletic reputation P P P + .. Social life P P P PS+ .. PS+ P P S+ S+ Able to live at home Chance to live away + + + + + + + P+S P+ + Religious environment S+ S+ .. P .. + .. Low crime environment .. .. S .. S+ .. Job placement PS+ PS+ P PS+ PS+ S+ .. Graduate school placement P P .. + + S+ S+ S+ + .. Academic reputation + + + + + + + + + + Easy admissions .. Preparation for job P PS+ PS+ S+ S+ S+ S+ S+ S+ .. Ethnic composition .. .. S + .. Size + + + + + + + + + S+ Location S+ S+ + S+ + + S+ S+ S+ S+ Same school as parent S S P+ P Note: “+” and “-” refer to the direction of relation, P and S indicate that the relation is significant only for data from that source (parentor student), and “. .” indicates that no significant relation was found.SOURCE: U.S. Department of Education, National Center for Education Statistics, National Education Longitudinal Study, 1988(NELS:88) Base Year, First Follow-up, and Second Follow-up Parent and student Surveys.
Occupational Expectations
At the second follow-up, both parents and students were asked about their expectations forthe kind of job or occupation the student might pursue. The questions were:
Parent Question69 (F2) Which of the categories below comes closest to describing the job or occupation
your teenager is interested in?
Student Question64b (F2) Which of the categories below comes closest to describing the job or occupation
that you expect or plan to have right after high school and when you are 30 yearsold? Even if you are not sure, mark your best guess. (b: Job at 30)

61
Sixteen categories were presented in alphabetical order. To study convergence, these were reorderedin terms of typical professional training requirements and socioeconomic status, as:
Professional, such as minister, ...; Professional, such as accountant, ...; School Teacher; Military; Manager; Technical; Office Worker; Sales; Full-Time Homemaker; Owner of a small business ...; Protective Service; Farmer; Tradesperson, such as baker, ...; Operator of machines ...; Service Worker; Laborer.
The level of agreement between the parent and student items was high, when compared toother subjective items, as shown in Table 3.12A—sufficiently high to warrant confidence that theyare measuring roughly the same concept. The polychoric correlation was .65, and the percentagematch of 55.6 percent was high for a 16-category response. The average responses were similar, withparents .27 units closer to the professional end of the scale (i.e., parents were somewhat more likely[t=�6.82] to think their teenager expects a professional career).
Table 3.12A— Comparison of parent and student responses to items about occupational expectations
Number of Polychoric Percent Mean Parent Mean Student Parent-StudentResponse Pairs Correlation Match Response Response Difference
Occupation expected 8,597 .648 55.6 4.00 4.27 -.271SOURCE: U.S. Department of Education, National Center for Education Statistics, National Education Longitudinal Study, 1988(NELS:88) Second Follow-up Parent and Student Surveys.
There was a substantial nonresponse rate, however, as seen in Table 3.12B. Moreover,students who failed to respond to this item tended to have parents who indicated that their teenagerwas not interested in a career in one of the professions, and vice versa. The average of parentresponses (on the scale from 1 to 16, with 1 and 2 indicating a professional career) was .85 unitshigher for students who failed to respond than for other parents [t=7.04]; and the average studentresponses were .71 units higher when parents did not respond [t=6.16].
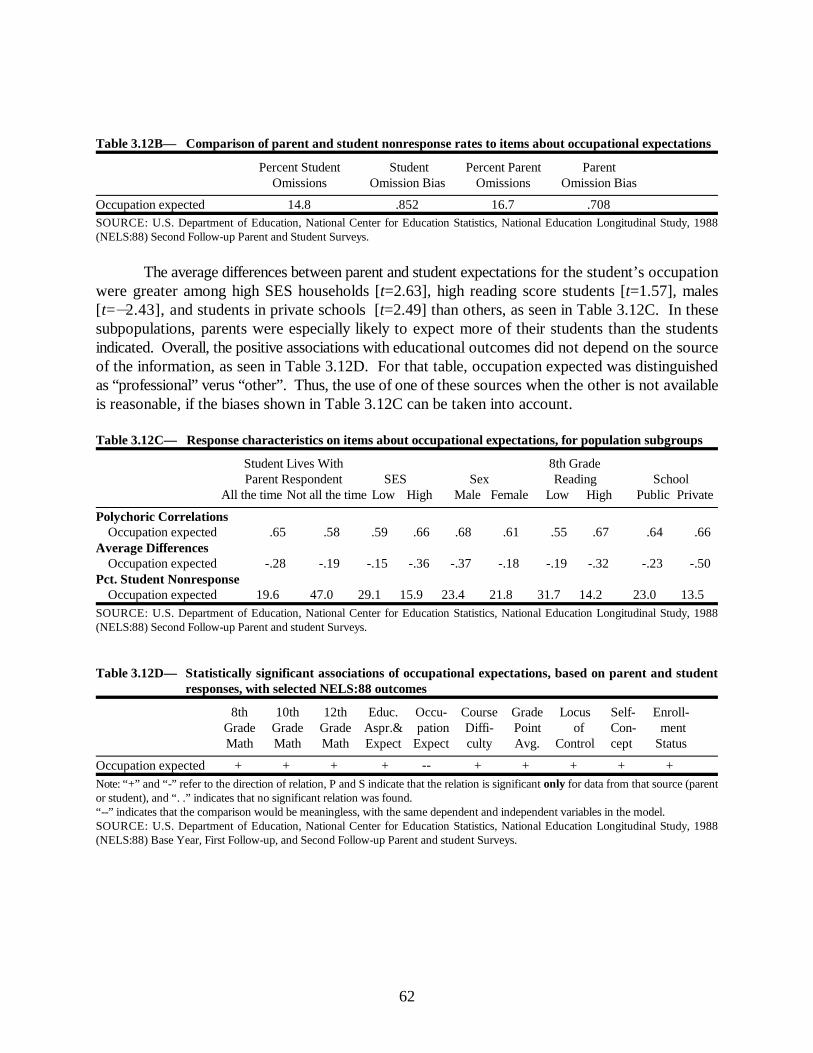
62
Table 3.12B— Comparison of parent and student nonresponse rates to items about occupational expectations
Percent Student Student Percent Parent ParentOmissions Omission Bias Omissions Omission Bias
Occupation expected 14.8 .852 16.7 .708SOURCE: U.S. Department of Education, National Center for Education Statistics, National Education Longitudinal Study, 1988(NELS:88) Second Follow-up Parent and Student Surveys.
The average differences between parent and student expectations for the student’s occupationwere greater among high SES households [t=2.63], high reading score students [t=1.57], males[t=�2.43], and students in private schools [t=2.49] than others, as seen in Table 3.12C. In thesesubpopulations, parents were especially likely to expect more of their students than the studentsindicated. Overall, the positive associations with educational outcomes did not depend on the sourceof the information, as seen in Table 3.12D. For that table, occupation expected was distinguishedas “professional” verus “other”. Thus, the use of one of these sources when the other is not availableis reasonable, if the biases shown in Table 3.12C can be taken into account.
Table 3.12C— Response characteristics on items about occupational expectations, for population subgroups
Student Lives With 8th GradeParent Respondent SES Sex Reading School
All the time Not all the time Low High Male Female Low High Public Private
Polychoric CorrelationsOccupation expected .65 .58 .59 .66 .68 .61 .55 .67 .64 .66
Average DifferencesOccupation expected -.28 -.19 -.15 -.36 -.37 -.18 -.19 -.32 -.23 -.50
Pct. Student NonresponseOccupation expected 19.6 47.0 29.1 15.9 23.4 21.8 31.7 14.2 23.0 13.5
SOURCE: U.S. Department of Education, National Center for Education Statistics, National Education Longitudinal Study, 1988(NELS:88) Second Follow-up Parent and student Surveys.
Table 3.12D— Statistically significant associations of occupational expectations, based on parent and studentresponses, with selected NELS:88 outcomes
8th 10th 12th Educ. Occu- Course Grade Locus Self- Enroll-Grade Grade Grade Aspr.& pation Diffi- Point of Con- mentMath Math Math Expect Expect culty Avg. Control cept Status
Occupation expected + + + + -- + + + + + Note: “+” and “-” refer to the direction of relation, P and S indicate that the relation is significant only for data from that source (parentor student), and “. .” indicates that no significant relation was found.“--” indicates that the comparison would be meaningless, with the same dependent and independent variables in the model.SOURCE: U.S. Department of Education, National Center for Education Statistics, National Education Longitudinal Study, 1988(NELS:88) Base Year, First Follow-up, and Second Follow-up Parent and student Surveys.
63
Summary
The combined results across the various topic areas discussed in this chapter are shown in thefollowing series of tables. First, in Figure 3.1, the scatter plot of items in terms of two measures ofconvergence, the mean difference and the polychoric correlation, are shown. The numbers in the plotin Figure 3.1 correspond to the items as numbered in Table 3.13A. Item response scales describedin this chapter, rather than the response standard deviations, are used for measuring the parent-student differences to facilitate interpretation of the differences.
As can be seen, the polychoric correlations vary from .10 to .97, and they provide a differentpicture than would be obtained by comparing the absolute matches. As might be expected, thepolychoric correlations were highest for objective items, for items that were worded similarly, andfor nonsensitive items. The mean differences, even when statistically significant, are not great. Inonly a few cases do they constitute more than one half unit on the response scale, and in no case arethey as much as a whole response unit. However, they must be compared in the context of the entirerange of the response scale. On a dichotomous item, a difference of .10, for example, wouldcorrespond to a shift of 10 percent of the sample from one response to the other.

64
Figure 3.1- Joint distribution of polychoric correlations and mean differences forstudent—parent item pairs
Source: U.S. Department of Education, National Center for Education Statistics, National EducationLongitudinal Study, 1988 (NELS:88) Base Year and Second Follow-up Parent and Student Surveys.
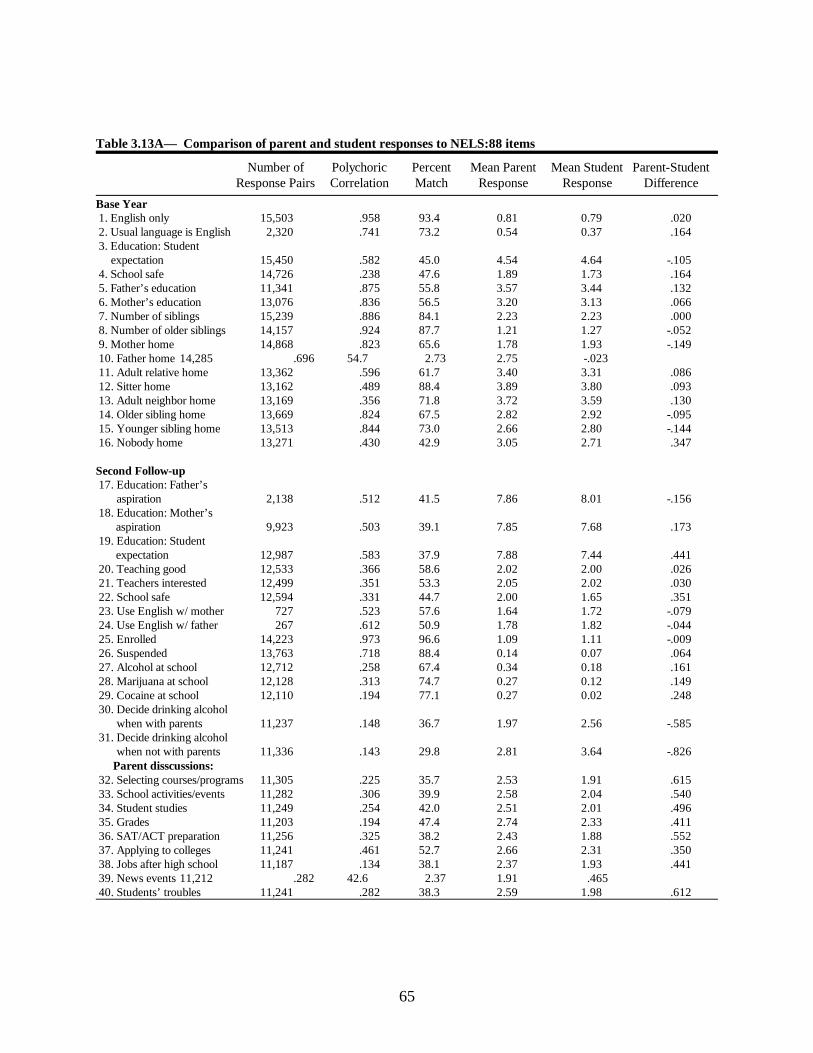
65
Table 3.13A— Comparison of parent and student responses to NELS:88 items
Number of Polychoric Percent Mean Parent Mean Student Parent-StudentResponse Pairs Correlation Match Response Response Difference
Base Year 1. English only 15,503 .958 93.4 0.81 0.79 .020 2. Usual language is English 2,320 .741 73.2 0.54 0.37 .164 3. Education: Student
expectation 15,450 .582 45.0 4.54 4.64 -.105 4. School safe 14,726 .238 47.6 1.89 1.73 .164 5. Father’s education 11,341 .875 55.8 3.57 3.44 .132 6. Mother’s education 13,076 .836 56.5 3.20 3.13 .066 7. Number of siblings 15,239 .886 84.1 2.23 2.23 .000 8. Number of older siblings 14,157 .924 87.7 1.21 1.27 -.052 9. Mother home 14,868 .823 65.6 1.78 1.93 -.149 10. Father home 14,285 .696 54.7 2.73 2.75 -.023 11. Adult relative home 13,362 .596 61.7 3.40 3.31 .086 12. Sitter home 13,162 .489 88.4 3.89 3.80 .093 13. Adult neighbor home 13,169 .356 71.8 3.72 3.59 .130 14. Older sibling home 13,669 .824 67.5 2.82 2.92 -.095 15. Younger sibling home 13,513 .844 73.0 2.66 2.80 -.144 16. Nobody home 13,271 .430 42.9 3.05 2.71 .347
Second Follow-up 17. Education: Father’s
aspiration 2,138 .512 41.5 7.86 8.01 -.156 18. Education: Mother’s aspiration 9,923 .503 39.1 7.85 7.68 .173 19. Education: Student expectation 12,987 .583 37.9 7.88 7.44 .441 20. Teaching good 12,533 .366 58.6 2.02 2.00 .026 21. Teachers interested 12,499 .351 53.3 2.05 2.02 .030 22. School safe 12,594 .331 44.7 2.00 1.65 .351 23. Use English w/ mother 727 .523 57.6 1.64 1.72 -.079 24. Use English w/ father 267 .612 50.9 1.78 1.82 -.044 25. Enrolled 14,223 .973 96.6 1.09 1.11 -.009 26. Suspended 13,763 .718 88.4 0.14 0.07 .064 27. Alcohol at school 12,712 .258 67.4 0.34 0.18 .161 28. Marijuana at school 12,128 .313 74.7 0.27 0.12 .149 29. Cocaine at school 12,110 .194 77.1 0.27 0.02 .248 30. Decide drinking alcohol when with parents 11,237 .148 36.7 1.97 2.56 -.585 31. Decide drinking alcohol
when not with parents 11,336 .143 29.8 2.81 3.64 -.826 Parent disscussions: 32. Selecting courses/programs 11,305 .225 35.7 2.53 1.91 .615 33. School activities/events 11,282 .306 39.9 2.58 2.04 .540 34. Student studies 11,249 .254 42.0 2.51 2.01 .496 35. Grades 11,203 .194 47.4 2.74 2.33 .411 36. SAT/ACT preparation 11,256 .325 38.2 2.43 1.88 .552 37. Applying to colleges 11,241 .461 52.7 2.66 2.31 .350 38. Jobs after high school 11,187 .134 38.1 2.37 1.93 .441 39. News events 11,212 .282 42.6 2.37 1.91 .465 40. Students’ troubles 11,241 .282 38.3 2.59 1.98 .612
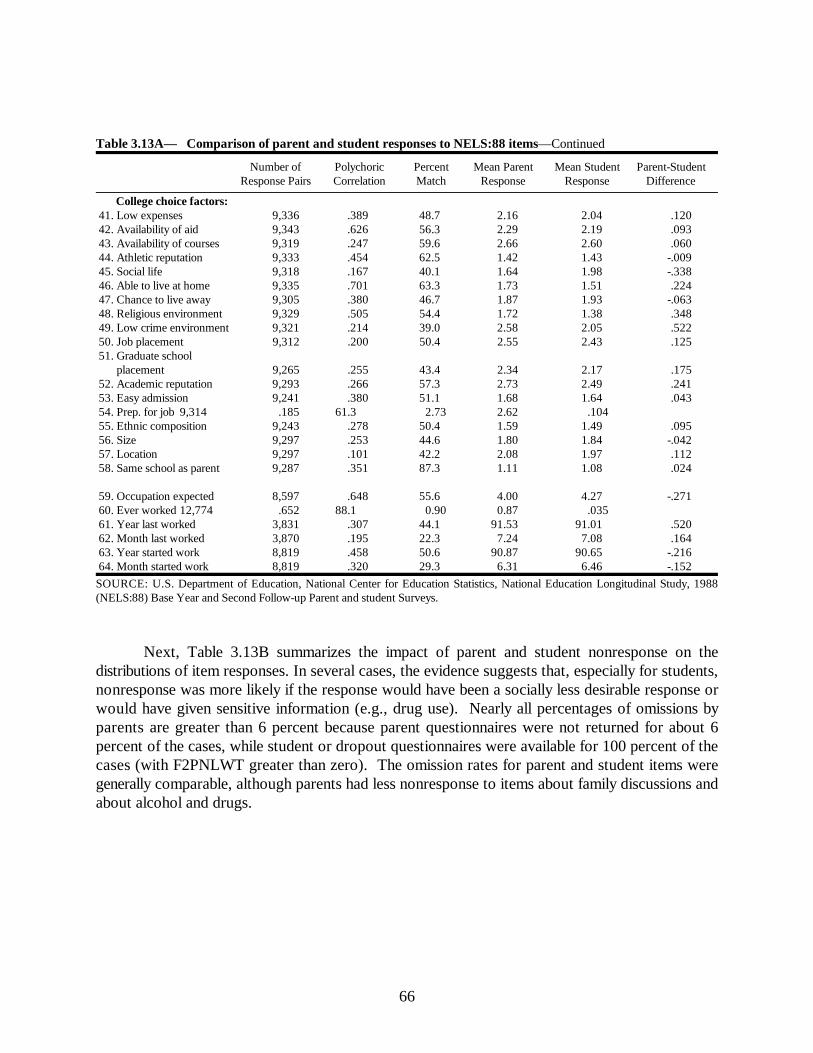
66
Table 3.13A— Comparison of parent and student responses to NELS:88 items—Continued
Number of Polychoric Percent Mean Parent Mean Student Parent-StudentResponse Pairs Correlation Match Response Response Difference
College choice factors: 41. Low expenses 9,336 .389 48.7 2.16 2.04 .120 42. Availability of aid 9,343 .626 56.3 2.29 2.19 .093 43. Availability of courses 9,319 .247 59.6 2.66 2.60 .060 44. Athletic reputation 9,333 .454 62.5 1.42 1.43 -.009 45. Social life 9,318 .167 40.1 1.64 1.98 -.338 46. Able to live at home 9,335 .701 63.3 1.73 1.51 .224 47. Chance to live away 9,305 .380 46.7 1.87 1.93 -.063 48. Religious environment 9,329 .505 54.4 1.72 1.38 .348 49. Low crime environment 9,321 .214 39.0 2.58 2.05 .522 50. Job placement 9,312 .200 50.4 2.55 2.43 .125 51. Graduate school placement 9,265 .255 43.4 2.34 2.17 .175 52. Academic reputation 9,293 .266 57.3 2.73 2.49 .241 53. Easy admission 9,241 .380 51.1 1.68 1.64 .043 54. Prep. for job 9,314 .185 61.3 2.73 2.62 .104 55. Ethnic composition 9,243 .278 50.4 1.59 1.49 .095 56. Size 9,297 .253 44.6 1.80 1.84 -.042 57. Location 9,297 .101 42.2 2.08 1.97 .112 58. Same school as parent 9,287 .351 87.3 1.11 1.08 .024 59. Occupation expected 8,597 .648 55.6 4.00 4.27 -.271 60. Ever worked 12,774 .652 88.1 0.90 0.87 .035 61. Year last worked 3,831 .307 44.1 91.53 91.01 .520 62. Month last worked 3,870 .195 22.3 7.24 7.08 .164 63. Year started work 8,819 .458 50.6 90.87 90.65 -.216 64. Month started work 8,819 .320 29.3 6.31 6.46 -.152
SOURCE: U.S. Department of Education, National Center for Education Statistics, National Education Longitudinal Study, 1988(NELS:88) Base Year and Second Follow-up Parent and student Surveys.
Next, Table 3.13B summarizes the impact of parent and student nonresponse on thedistributions of item responses. In several cases, the evidence suggests that, especially for students,nonresponse was more likely if the response would have been a socially less desirable response orwould have given sensitive information (e.g., drug use). Nearly all percentages of omissions byparents are greater than 6 percent because parent questionnaires were not returned for about 6percent of the cases, while student or dropout questionnaires were available for 100 percent of thecases (with F2PNLWT greater than zero). The omission rates for parent and student items weregenerally comparable, although parents had less nonresponse to items about family discussions andabout alcohol and drugs.
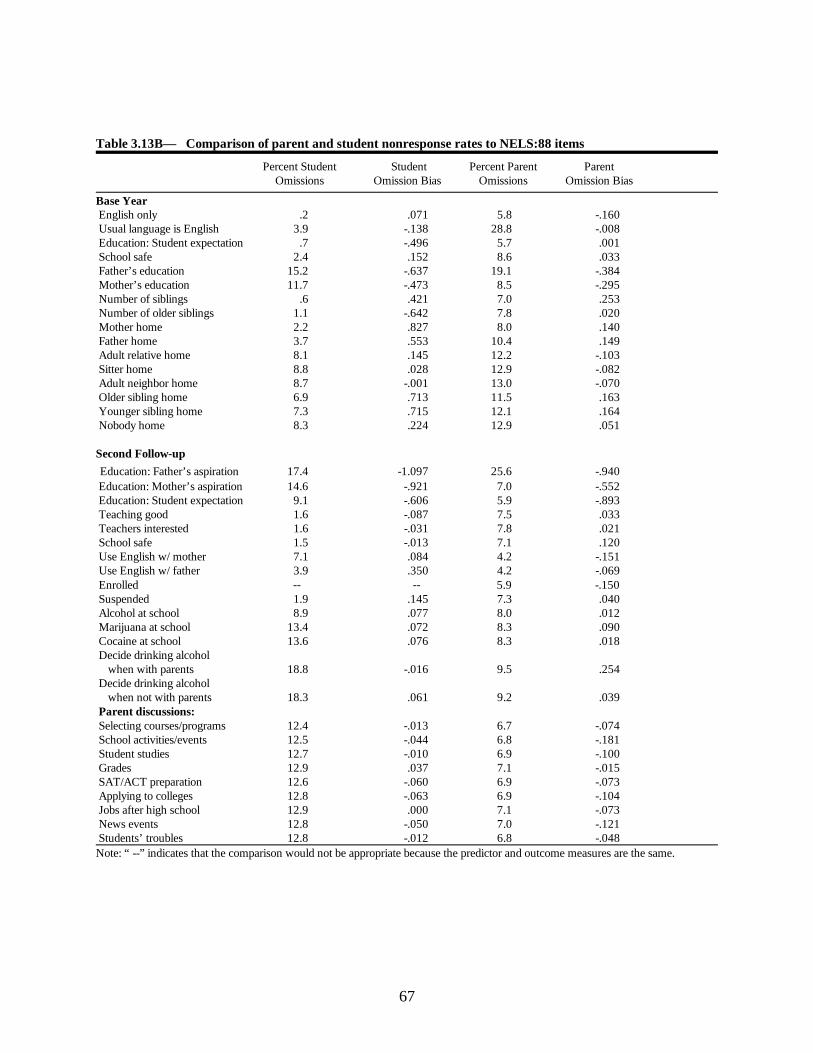
67
Table 3.13B— Comparison of parent and student nonresponse rates to NELS:88 items
Percent Student Student Percent Parent ParentOmissions Omission Bias Omissions Omission Bias
Base Year English only .2 .071 5.8 -.160 Usual language is English 3.9 -.138 28.8 -.008 Education: Student expectation .7 -.496 5.7 .001 School safe 2.4 .152 8.6 .033 Father’s education 15.2 -.637 19.1 -.384 Mother’s education 11.7 -.473 8.5 -.295 Number of siblings .6 .421 7.0 .253 Number of older siblings 1.1 -.642 7.8 .020 Mother home 2.2 .827 8.0 .140 Father home 3.7 .553 10.4 .149 Adult relative home 8.1 .145 12.2 -.103 Sitter home 8.8 .028 12.9 -.082 Adult neighbor home 8.7 -.001 13.0 -.070 Older sibling home 6.9 .713 11.5 .163 Younger sibling home 7.3 .715 12.1 .164 Nobody home 8.3 .224 12.9 .051
Second Follow-up
Education: Father’s aspiration 17.4 -1.097 25.6 -.940 Education: Mother’s aspiration 14.6 -.921 7.0 -.552 Education: Student expectation 9.1 -.606 5.9 -.893 Teaching good 1.6 -.087 7.5 .033 Teachers interested 1.6 -.031 7.8 .021 School safe 1.5 -.013 7.1 .120 Use English w/ mother 7.1 .084 4.2 -.151 Use English w/ father 3.9 .350 4.2 -.069 Enrolled -- -- 5.9 -.150 Suspended 1.9 .145 7.3 .040 Alcohol at school 8.9 .077 8.0 .012 Marijuana at school 13.4 .072 8.3 .090 Cocaine at school 13.6 .076 8.3 .018 Decide drinking alcohol when with parents 18.8 -.016 9.5 .254 Decide drinking alcohol when not with parents 18.3 .061 9.2 .039 Parent discussions: Selecting courses/programs 12.4 -.013 6.7 -.074 School activities/events 12.5 -.044 6.8 -.181 Student studies 12.7 -.010 6.9 -.100 Grades 12.9 .037 7.1 -.015 SAT/ACT preparation 12.6 -.060 6.9 -.073 Applying to colleges 12.8 -.063 6.9 -.104 Jobs after high school 12.9 .000 7.1 -.073 News events 12.8 -.050 7.0 -.121 Students’ troubles 12.8 -.012 6.8 -.048Note: “ --” indicates that the comparison would not be appropriate because the predictor and outcome measures are the same.
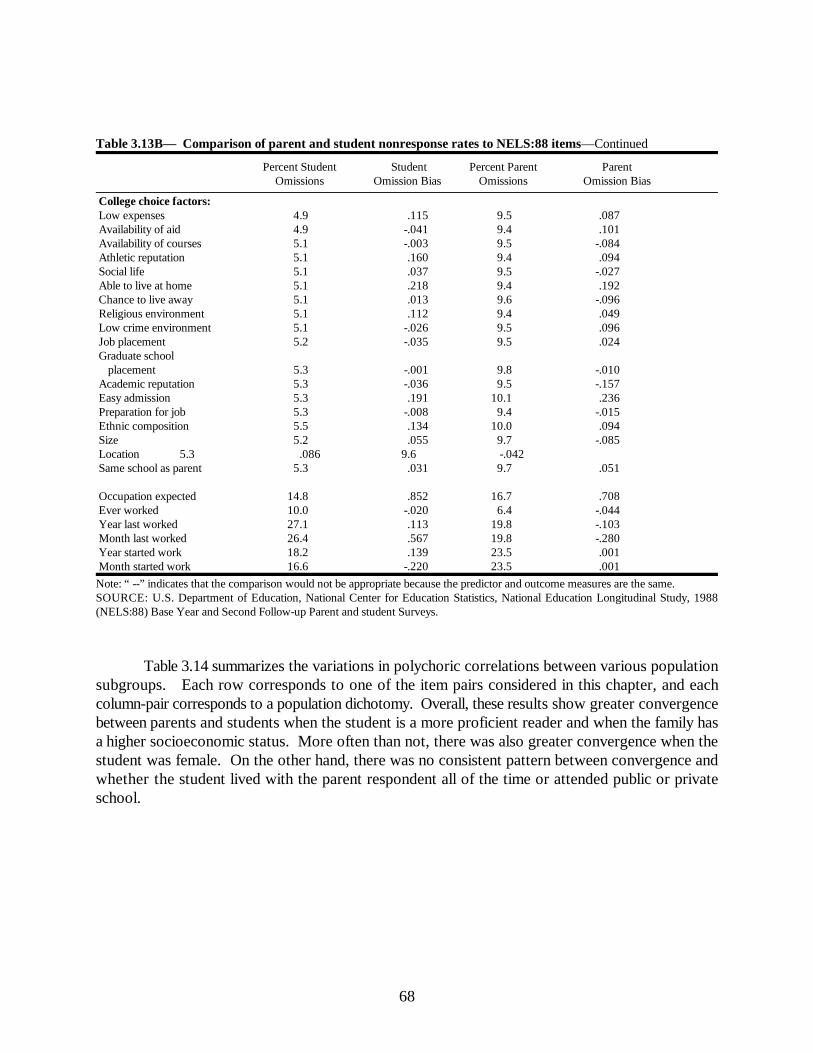
68
Table 3.13B— Comparison of parent and student nonresponse rates to NELS:88 items—Continued
Percent Student Student Percent Parent ParentOmissions Omission Bias Omissions Omission Bias
College choice factors: Low expenses 4.9 .115 9.5 .087 Availability of aid 4.9 -.041 9.4 .101 Availability of courses 5.1 -.003 9.5 -.084 Athletic reputation 5.1 .160 9.4 .094 Social life 5.1 .037 9.5 -.027 Able to live at home 5.1 .218 9.4 .192 Chance to live away 5.1 .013 9.6 -.096 Religious environment 5.1 .112 9.4 .049 Low crime environment 5.1 -.026 9.5 .096 Job placement 5.2 -.035 9.5 .024 Graduate school
placement 5.3 -.001 9.8 -.010 Academic reputation 5.3 -.036 9.5 -.157 Easy admission 5.3 .191 10.1 .236 Preparation for job 5.3 -.008 9.4 -.015 Ethnic composition 5.5 .134 10.0 .094 Size 5.2 .055 9.7 -.085 Location 5.3 .086 9.6 -.042 Same school as parent 5.3 .031 9.7 .051 Occupation expected 14.8 .852 16.7 .708 Ever worked 10.0 -.020 6.4 -.044 Year last worked 27.1 .113 19.8 -.103 Month last worked 26.4 .567 19.8 -.280 Year started work 18.2 .139 23.5 .001 Month started work 16.6 -.220 23.5 .001
Note: “ --” indicates that the comparison would not be appropriate because the predictor and outcome measures are the same.SOURCE: U.S. Department of Education, National Center for Education Statistics, National Education Longitudinal Study, 1988(NELS:88) Base Year and Second Follow-up Parent and student Surveys.
Table 3.14 summarizes the variations in polychoric correlations between various populationsubgroups. Each row corresponds to one of the item pairs considered in this chapter, and eachcolumn-pair corresponds to a population dichotomy. Overall, these results show greater convergencebetween parents and students when the student is a more proficient reader and when the family hasa higher socioeconomic status. More often than not, there was also greater convergence when thestudent was female. On the other hand, there was no consistent pattern between convergence andwhether the student lived with the parent respondent all of the time or attended public or privateschool.

69
Table 3.14— Polychoric correlations between parent and student responses, for population subgroups
Student Lives with 8th GradeParent Respondent SES Sex Reading School
All the time Not all the time Low High Male Female Low High Public Private
Base Year English only .96 .95 .97 .95 .95 .97 .96 .96 .96 .93a
Usual language is English .73 .89 .78 .66 .74 .74 .73 .73 .74 .71 Education: Student expectation .59 .60 .51 .54 .59 .59 .48 .57 .57 .54 School safe .24 .32 .18 .25 .21 .27 .14 .28 .19 .17 Father’s education .88 .78 .70 .84 .87 .88 .81 .89 .85 .90 Mother’s education .84 .84 .69 .79 .82 .85 .76 .86 .82 .85 Number of siblings .89 .85 .86 .91 .88 .89 .85 .91 .88 .92 a a a
Number of older siblings .92 .90 .91 .94 .91 .93 .90 .94 .92 .95 a a a
Mother home .83 .68 .81 .84 .80 .85 .79 .85 .82 .86 Father home .70 .63 .72 .67 .67 .73 .68 .72 .70 .69 Adult relative home .59 .67 .56 .63 .56 .64 .56 .64 .60 .63 Sitter home .48 .61 .39 .59 .39 .59 .39 .60 .45 .61 Adult neighbor home .35 .47 .34 .35 .29 .42 .33 .36 .35 .32 Older sibling home .82 .85 .80 .86 .81 .85 .79 .87 .83 .86 Younger sibling home .85 .78 .81 .88 .84 .86 .81 .87 .85 .84 Nobody home .43 .39 .37 .47 .38 .48 .31 .52 .42 .47
Second Follow-up Education: Father’s aspiration .52 .41 .45 .48 .52 .50 .43 .51 .52 .39 Education: Mother’s aspiration .50 .47 .42 .51 .51 .49 .42 .50 .48 .51 Education: Student expectation .58 .53 .48 .60 .59 .57 .47 .60 .56 .61 Teaching good .37 .37 .24 .44 .34 .39 .25 .43 .28 .39 Teachers interested .35 .39 .24 .41 .32 .38 .26 .39 .24 .41 School safe .33 .32 .24 .38 .29 .37 .24 .37 .27 .26 Use English w/ mother .52 .46 .51 .42 .44 .58 .48 .62 .53 .45 Use English w/ father .52 .46 .44 .68 .57 .60 .55 .69 .56 .78 Enrolled .97 .96 .97 .95 .97 .97 .97 .95 .98 .93 Suspended .72 .66 .69 .72 .70 .70 .68 .71 .73 .56 Alcohol at school .24 .21 .20 .28 .25 .21 .21 .26 .25 .23 Marijuana at school .29 .33 .28 .36 .32 .29 .29 .33 .32 .26 Cocaine at school .18 .18 .17 .18 .14 .26 .18 .19 .19 .16 Decide drinking alcohol when with parents .14 .22 .15 .16 .14 .15 .11 .19 .13 .23 Decide drinking alcohol when not with parents .14 .19 .13 .16 .13 .15 .10 .17 .14 .18
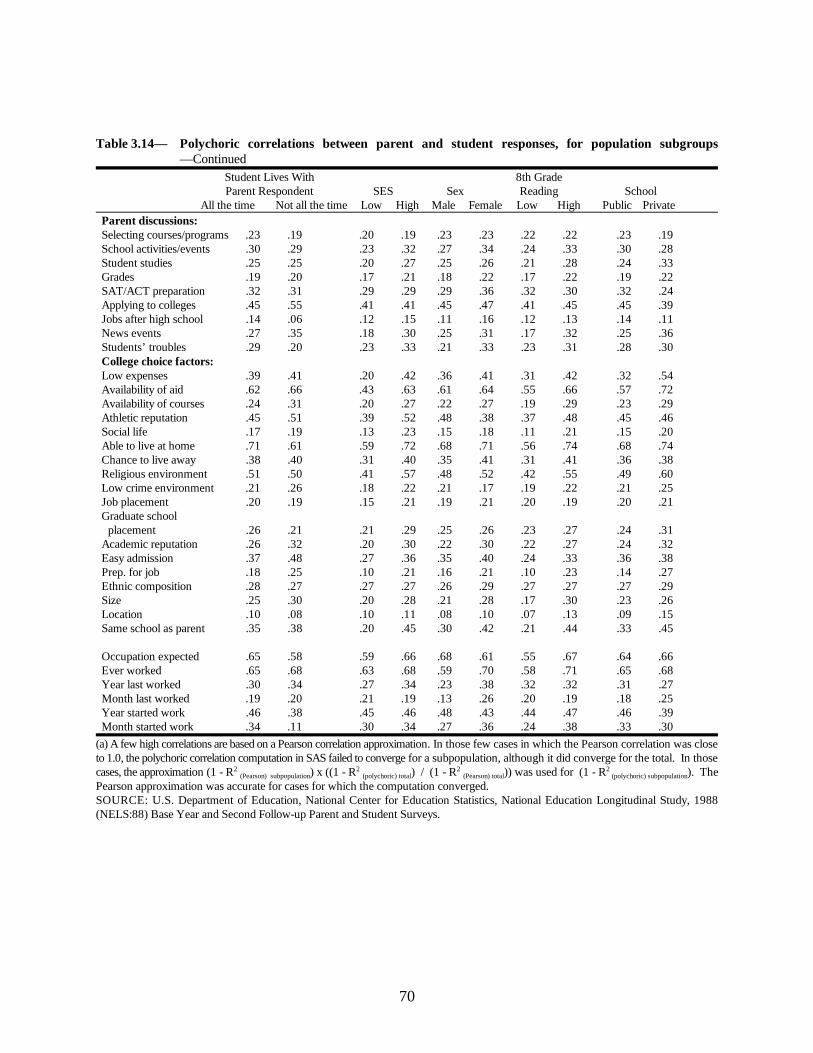
70
Table 3.14— Polychoric correlations between parent and student responses, for population subgroups—Continued
Student Lives With 8th GradeParent Respondent SES Sex Reading School
All the time Not all the time Low High Male Female Low High Public Private Parent discussions: Selecting courses/programs .23 .19 .20 .19 .23 .23 .22 .22 .23 .19 School activities/events .30 .29 .23 .32 .27 .34 .24 .33 .30 .28 Student studies .25 .25 .20 .27 .25 .26 .21 .28 .24 .33 Grades .19 .20 .17 .21 .18 .22 .17 .22 .19 .22 SAT/ACT preparation .32 .31 .29 .29 .29 .36 .32 .30 .32 .24 Applying to colleges .45 .55 .41 .41 .45 .47 .41 .45 .45 .39 Jobs after high school .14 .06 .12 .15 .11 .16 .12 .13 .14 .11 News events .27 .35 .18 .30 .25 .31 .17 .32 .25 .36 Students’ troubles .29 .20 .23 .33 .21 .33 .23 .31 .28 .30 College choice factors: Low expenses .39 .41 .20 .42 .36 .41 .31 .42 .32 .54 Availability of aid .62 .66 .43 .63 .61 .64 .55 .66 .57 .72 Availability of courses .24 .31 .20 .27 .22 .27 .19 .29 .23 .29 Athletic reputation .45 .51 .39 .52 .48 .38 .37 .48 .45 .46 Social life .17 .19 .13 .23 .15 .18 .11 .21 .15 .20 Able to live at home .71 .61 .59 .72 .68 .71 .56 .74 .68 .74 Chance to live away .38 .40 .31 .40 .35 .41 .31 .41 .36 .38 Religious environment .51 .50 .41 .57 .48 .52 .42 .55 .49 .60 Low crime environment .21 .26 .18 .22 .21 .17 .19 .22 .21 .25 Job placement .20 .19 .15 .21 .19 .21 .20 .19 .20 .21 Graduate school placement .26 .21 .21 .29 .25 .26 .23 .27 .24 .31 Academic reputation .26 .32 .20 .30 .22 .30 .22 .27 .24 .32 Easy admission .37 .48 .27 .36 .35 .40 .24 .33 .36 .38 Prep. for job .18 .25 .10 .21 .16 .21 .10 .23 .14 .27 Ethnic composition .28 .27 .27 .27 .26 .29 .27 .27 .27 .29 Size .25 .30 .20 .28 .21 .28 .17 .30 .23 .26 Location .10 .08 .10 .11 .08 .10 .07 .13 .09 .15 Same school as parent .35 .38 .20 .45 .30 .42 .21 .44 .33 .45 Occupation expected .65 .58 .59 .66 .68 .61 .55 .67 .64 .66 Ever worked .65 .68 .63 .68 .59 .70 .58 .71 .65 .68 Year last worked .30 .34 .27 .34 .23 .38 .32 .32 .31 .27 Month last worked .19 .20 .21 .19 .13 .26 .20 .19 .18 .25 Year started work .46 .38 .45 .46 .48 .43 .44 .47 .46 .39 Month started work .34 .11 .30 .34 .27 .36 .24 .38 .33 .30
(a) A few high correlations are based on a Pearson correlation approximation. In those few cases in which the Pearson correlation was closeto 1.0, the polychoric correlation computation in SAS failed to converge for a subpopulation, although it did converge for the total. In thosecases, the approximation (1 - R ) x ((1 - R ) / (1 - R )) was used for (1 - R ). The2 2 2 2
(Pearson) subpopulation (polychoric) total (Pearson) total (polychoric) subpopulation
Pearson approximation was accurate for cases for which the computation converged.SOURCE: U.S. Department of Education, National Center for Education Statistics, National Education Longitudinal Study, 1988(NELS:88) Base Year and Second Follow-up Parent and Student Surveys.

71
The question of convergence can also be addressed in terms of the “location” of theresponses, as indicated by the difference in the mean response by parents and students. If there is agreater difference between parents and students in some subpopulations, then research on thosesubpopulations must be especially cognizant of the source of the information used to developindicators. As shown in Table 3.15, although there was substantial variation across NELS:88 items,the general pattern was for closer agreement between parents and students when the socioeconomicstatus measure was high, when the respondent was female, when the student was a better reader, andwhen the student was enrolled in a private school.
Table 3.15— Average parent-student response differences, for population subgroups
Student Lives With 8th gradeParent Respondent SES Sex Reading School
Not all the time All the time Low High Male Female Low High Public Private
Base Year English only .02 .05 .01 .03 .02 .02 .01 .03 .02 .03 Usual language is English .17 .03 .16 .15 .19 .14 .20 .13 .17 .16 Education: Student expectation -.12 -.06 -.15 -.08 -.07 -.16 -.11 -.12 -.13 -.06 School safe .17 .08 .22 .11 .11 .22 .14 .19 .22 -.09 Father’s education -.14 .07 -.07 .17 -.10 -.16 -.14 -.13 -.14 -.07 Mother’s education -.07 -.06 -.05 -.06 -.04 -.09 -.08 -.06 -.09 .06 Number of Siblings .00 -.01 .00 .01 -.01 .01 -.03 .03 .00 -.02 Number of Older siblings -.04 -.06 -.06 -.01 -.05 -.05 -.10 -.01 -.05 -.04 Mother home -.15 -.07 -.14 -.17 -.15 -.16 -.15 -.16 -.15 -.18 Father home -.02 -.03 -.04 -.01 .00 -.05 -.03 -.02 -.03 -.01 Adult relative .09 .04 .11 .07 .10 .07 .10 .07 .08 .09 Sitter .09 .10 .15 .04 .13 .05 .19 .02 .11 .03 Adult neighbor .13 .14 .16 .10 .16 .10 .16 .10 .13 .14 Older sibling -.10 .00 -.09 -.10 -.09 -.10 -.10 -.09 -.10 -.07 Younger sibling -.15 -.11 -.15 -.13 -.16 -.12 -.18 -.12 -.15 -.13 Nobody home .35 .21 .34 .35 .33 .35 .33 .36 .34 .37
Second Follow-up Education: Father’s aspiration -.14 -.27 -.10 -.19 -.07 -.25 -.21 -.11 -.18 -.05 Education: Mother’s aspiration .18 .11 .27 .08 .16 .18 .21 .14 .18 .18 Education: Student expectation .42 .65 .67 .23 .48 .40 .69 .25 .47 .19 Teaching good .02 .07 .04 .01 .02 .03 .04 .02 .04 -.07 Teachers interested .03 .03 .08 -.01 .02 .04 .06 .01 .05 -.10 School safe .35 .35 .41 .31 .35 .36 .36 .35 .40 .11 Use English w/ mother -.09 -.19 -.09 -.12 -.10 -.09 -.05 -.11 -.12 .17 Use English w/ father -.10 .50 -.12 .02 .01 -.13 .04 -.12 -.06 -.14 Enrolled -.01 -.04 -.01 -.00 -.01 -.01 -.02 -.00 .00 .00 Suspended -.06 -.11 -.09 -.04 -.08 -.05 -.09 -.04 -.07 .00 Alcohol at school .22 .52 .34 .16 .22 .27 .32 .18 .25 .14 Marijuana at school .21 .44 .33 .15 .22 .24 .31 .17 .24 .15 Cocaine at school .30 .63 .42 .25 .36 .31 .43 .26 .34 .24 Decide drinking alcohol when with parents -.55 -1.0 -.77 -.42 -.67 -.50 -.85 -.39 -.59 -.46 Decide drinking alcohol when not with parents -.80 -1.1 -.83 -.82 -.89 -.76 .82 -.83 -.82 -.80

72
Table 3.15— Average parent-student response differences, for population subgroups—Continued
Student Lives With 8th GradeParent Respondent SES Sex Reading School
Not all the time All the time Low High Male Female Low High Public Private
Parent discussions: Selecting courses/programs .62 .62 .62 .61 .69 .54 .63 .61 .62 .59 School activities/events .54 .58 .56 .52 .61 .48 .60 .50 .55 .49 Student studies .50 .51 .54 .46 .57 .43 .53 .48 .51 .45 Grades .41 .42 .45 .38 .50 .33 .46 .38 .42 .34 SAT/ACT preparation .55 .55 .56 .54 .63 .49 .54 .56 .56 .52 Applying to colleges .35 .39 .41 .30 .43 .27 .42 .31 .37 .25 Jobs after high school .44 .50 .45 .43 .49 .40 .46 .44 .45 .39 News events .47 .45 .48 .46 .51 .43 .51 .44 .47 .40 Students’ troubles .61 .64 .63 .60 .69 .54 .64 .59 .63 .54 College choice factors: Low expenses .12 .14 .20 .08 .13 .11 .18 .09 .14 .05 Availability of aid .09 .20 .17 .05 .13 .06 .13 .07 .10 .06 Availability of courses .06 .09 .10 .04 .10 .03 .15 .02 .06 .05 Athletic reputation -.01 -.01 .15 -.10 -.07 .04 .01 -.02 .01 -.08 Social life -.35 -.22 -.12 -.46 -.41 -.28 -.28 -.37 -.31 -.47 Able to live at home .23 .18 .38 .13 .22 .23 .28 .20 .25 .10 Chance to live away -.07 .00 -.03 -.08 -.03 -.09 -.06 -.06 -.07 -.03 Religious environment .35 .38 .52 .25 .36 .34 .43 .31 .36 .29 Low crime environment .52 .57 .56 .50 .58 .47 .50 .53 .53 .50 Job placement .12 .16 .21 .07 .17 .09 .14 .12 .14 .05 Graduate school placement .17 .20 .29 .11 .20 .15 .18 .18 .19 .12 Academic reputation .24 .21 .33 .19 .28 .21 .34 .19 .27 .13 Easy admission .04 .08 .20 -.05 .04 .04 .04 .05 .06 -.03 Preparation for job .10 .11 .14 .08 .17 .05 .17 .07 .11 .06 Ethnic composition .09 .14 .21 .03 .11 .08 .13 .08 .11 .04 Size -.05 .03 .05 -.09 .01 -.09 .01 -.07 -.04 -.07 Location .11 .11 .25 .03 .13 .09 .24 .05 .15 -.05 Same school as parent .02 .03 .06 .01 -.01 .05 .01 .03 .02 .02 Occupation expected -.28 -.19 -.15 -.36 -.37 -.18 -.19 -.32 -.23 -.50 Ever worked .04 .04 .04 .03 .05 .03 .06 .02 .04 .03 Year last worked .52 .51 .55 .50 .55 .49 .56 .49 .54 .47 Month last worked .14 .48 .55 -.10 .17 .16 .45 -.02 .17 .06 Year started work .22 .16 .22 .21 .26 .18 .24 .20 .22 .19 Month started work -.21 .40 .00 -.28 -.04 -.25 -.02 -.26 -.16 -.22
SOURCE: U.S. Department of Education, National Center for Education Statistics, National Education Longitudinal Study, 1988(NELS:88) Base Year and Second Follow-up Parent and Student Surveys.

73
Differences in student nonresponse rates between subpopulations were more striking than thedifferences in convergence, as shown in Table 3.16. When differences were observed, percentageomissions were generally from 2 to 5 times as great in one of the subpopulation categories as in theother—more in families in which the student did not live with the parent respondent all of the time,more in low SES homes, among males, among poorer readers, and among public school students.While item omission rates for the complementary groups were sufficiently high to support researchon them without severe nonresponse bias, nonresponse bias in analyses of the groups listed abovemay substantially distort results.
Table 3.16— Percentage of student nonresponse for student-parent item pairs, for population subgroups
Student Lives With 8th GradeParent Respondent SES Sex Reading School
Not all the time All the time Low High Male Female Low High Public Private
Base Year English only .2 .4 .3 .1 .3 .1 .3 .1 .2 .2 Usual language is English 3.9 4.6 3.7 4.1 4.2 3.6 4.3 3.6 3.6 5.3 Education: Student expectation .7 .4 1.0 .5 .8 .6 .8 .2 .8 .3 School safe 2.3 3.0 3.2 1.6 2.9 2.0 3.4 1.1 2.8 .9 Father’s education 14.9 15.6 19.1 10.5 14.0 16.4 19.4 11.5 15.9 9.8 Mother’s education 11.4 10.6 13.6 9.0 12.5 10.9 14.8 9.1 11.8 9.2 Number of siblings .6 .6 .9 .4 .8 .5 .7 .3 .7 .3 Number of older siblings 1.0 2.2 1.2 1.0 1.0 1.2 .7 1.0 1.0 1.6 Mother home 2.1 2.4 2.2 1.8 2.6 1.3 2.6 1.2 1.9 1.2 Father home 3.6 5.0 4.1 2.9 4.0 2.9 4.4 2.3 3.3 2.9 Adult relative home 8.0 7.1 8.2 7.5 9.3 6.4 8.8 6.8 7.6 8.2 Sitter home 8.7 9.1 9.1 8.0 10.3 6.8 9.9 7.1 8.4 8.3 Adult neighbor home 8.6 9.1 9.0 7.9 9.8 7.0 9.7 7.1 8.3 8.3 Older sibling home 6.6 8.9 7.2 5.9 7.5 5.6 7.6 5.4 6.3 6.7 Younger sibling home 7.1 7.8 7.9 6.1 8.4 5.6 8.1 5.6 6.7 6.8 Nobody home 8.1 8.9 9.3 6.7 8.8 7.2 9.8 6.1 7.9 7.0
Second Follow-up Education: Father’s aspiration 16.2 23.5 23.8 10.9 18.7 16.1 24.4 11.2 18.2 10.6 Education: Mother’s aspiration 13.6 18.5 18.9 9.6 16.6 12.6 20.7 9.0 15.2 9.6 Education: Student expectation 8.4 12.4 10.9 6.8 10.8 7.4 12.6 6.1 9.2 7.0 Teaching good 1.5 2.2 1.6 1.6 2.0 1.3 2.0 1.3 1.5 1.7 Teachers interested 1.5 2.2 1.5 1.5 1.9 1.3 1.9 1.3 1.4 1.9 School safe 1.4 2.1 1.4 1.5 1.9 1.1 1.9 1.2 1.4 1.8 Use English w/ mother 6.6 9.7 6.5 8.2 8.7 5.3 8.3 5.0 6.7 5.8 Use English w/ father 3.4 8.7 1.7 6.3 6.0 1.3 3.8 3.3 3.0 6.5 Enrolled -- -- -- -- -- -- -- -- -- -- Suspended 1.6 3.8 2.1 1.5 2.4 1.4 2.5 1.3 1.7 1.7 Alcohol at school 8.6 9.0 9.9 7.5 11.0 6.9 11.9 6.1 9.3 6.5 Marijuana at school 12.4 15.3 13.9 11.6 15.9 11.1 17.1 10.0 13.6 11.0 Cocaine at school 12.5 15.4 14.1 11.6 16.1 11.2 17.4 10.0 13.7 11.2 Decide drinking alcohol when with parents 16.3 34.9 21.5 15.1 20.3 17.3 24.1 14.0 19.0 14.6 Decide drinking alcohol when not with parents 15.8 34.5 20.9 14.8 19.8 16.8 23.8 13.3 18.5 14.0
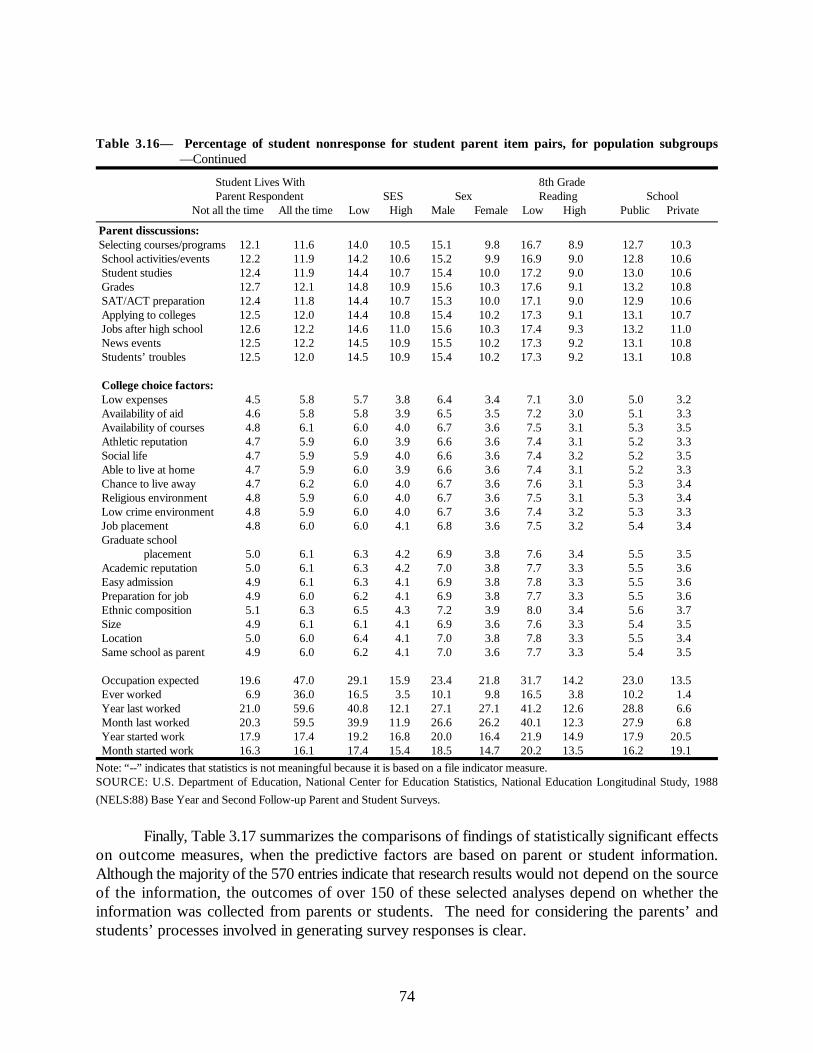
74
Table 3.16— Percentage of student nonresponse for student parent item pairs, for population subgroups—Continued
Student Lives With 8th GradeParent Respondent SES Sex Reading School
Not all the time All the time Low High Male Female Low High Public Private
Parent disscussions: Selecting courses/programs 12.1 11.6 14.0 10.5 15.1 9.8 16.7 8.9 12.7 10.3 School activities/events 12.2 11.9 14.2 10.6 15.2 9.9 16.9 9.0 12.8 10.6 Student studies 12.4 11.9 14.4 10.7 15.4 10.0 17.2 9.0 13.0 10.6 Grades 12.7 12.1 14.8 10.9 15.6 10.3 17.6 9.1 13.2 10.8 SAT/ACT preparation 12.4 11.8 14.4 10.7 15.3 10.0 17.1 9.0 12.9 10.6 Applying to colleges 12.5 12.0 14.4 10.8 15.4 10.2 17.3 9.1 13.1 10.7 Jobs after high school 12.6 12.2 14.6 11.0 15.6 10.3 17.4 9.3 13.2 11.0 News events 12.5 12.2 14.5 10.9 15.5 10.2 17.3 9.2 13.1 10.8 Students’ troubles 12.5 12.0 14.5 10.9 15.4 10.2 17.3 9.2 13.1 10.8 College choice factors: Low expenses 4.5 5.8 5.7 3.8 6.4 3.4 7.1 3.0 5.0 3.2 Availability of aid 4.6 5.8 5.8 3.9 6.5 3.5 7.2 3.0 5.1 3.3 Availability of courses 4.8 6.1 6.0 4.0 6.7 3.6 7.5 3.1 5.3 3.5 Athletic reputation 4.7 5.9 6.0 3.9 6.6 3.6 7.4 3.1 5.2 3.3 Social life 4.7 5.9 5.9 4.0 6.6 3.6 7.4 3.2 5.2 3.5 Able to live at home 4.7 5.9 6.0 3.9 6.6 3.6 7.4 3.1 5.2 3.3 Chance to live away 4.7 6.2 6.0 4.0 6.7 3.6 7.6 3.1 5.3 3.4 Religious environment 4.8 5.9 6.0 4.0 6.7 3.6 7.5 3.1 5.3 3.4 Low crime environment 4.8 5.9 6.0 4.0 6.7 3.6 7.4 3.2 5.3 3.3 Job placement 4.8 6.0 6.0 4.1 6.8 3.6 7.5 3.2 5.4 3.4 Graduate school
placement 5.0 6.1 6.3 4.2 6.9 3.8 7.6 3.4 5.5 3.5 Academic reputation 5.0 6.1 6.3 4.2 7.0 3.8 7.7 3.3 5.5 3.6 Easy admission 4.9 6.1 6.3 4.1 6.9 3.8 7.8 3.3 5.5 3.6 Preparation for job 4.9 6.0 6.2 4.1 6.9 3.8 7.7 3.3 5.5 3.6 Ethnic composition 5.1 6.3 6.5 4.3 7.2 3.9 8.0 3.4 5.6 3.7 Size 4.9 6.1 6.1 4.1 6.9 3.6 7.6 3.3 5.4 3.5 Location 5.0 6.0 6.4 4.1 7.0 3.8 7.8 3.3 5.5 3.4 Same school as parent 4.9 6.0 6.2 4.1 7.0 3.6 7.7 3.3 5.4 3.5 Occupation expected 19.6 47.0 29.1 15.9 23.4 21.8 31.7 14.2 23.0 13.5 Ever worked 6.9 36.0 16.5 3.5 10.1 9.8 16.5 3.8 10.2 1.4 Year last worked 21.0 59.6 40.8 12.1 27.1 27.1 41.2 12.6 28.8 6.6 Month last worked 20.3 59.5 39.9 11.9 26.6 26.2 40.1 12.3 27.9 6.8 Year started work 17.9 17.4 19.2 16.8 20.0 16.4 21.9 14.9 17.9 20.5 Month started work 16.3 16.1 17.4 15.4 18.5 14.7 20.2 13.5 16.2 19.1
Note: “--” indicates that statistics is not meaningful because it is based on a file indicator measure.SOURCE: U.S. Department of Education, National Center for Education Statistics, National Education Longitudinal Study, 1988
(NELS:88) Base Year and Second Follow-up Parent and Student Surveys.
Finally, Table 3.17 summarizes the comparisons of findings of statistically significant effectson outcome measures, when the predictive factors are based on parent or student information.Although the majority of the 570 entries indicate that research results would not depend on the sourceof the information, the outcomes of over 150 of these selected analyses depend on whether theinformation was collected from parents or students. The need for considering the parents’ andstudents’ processes involved in generating survey responses is clear.
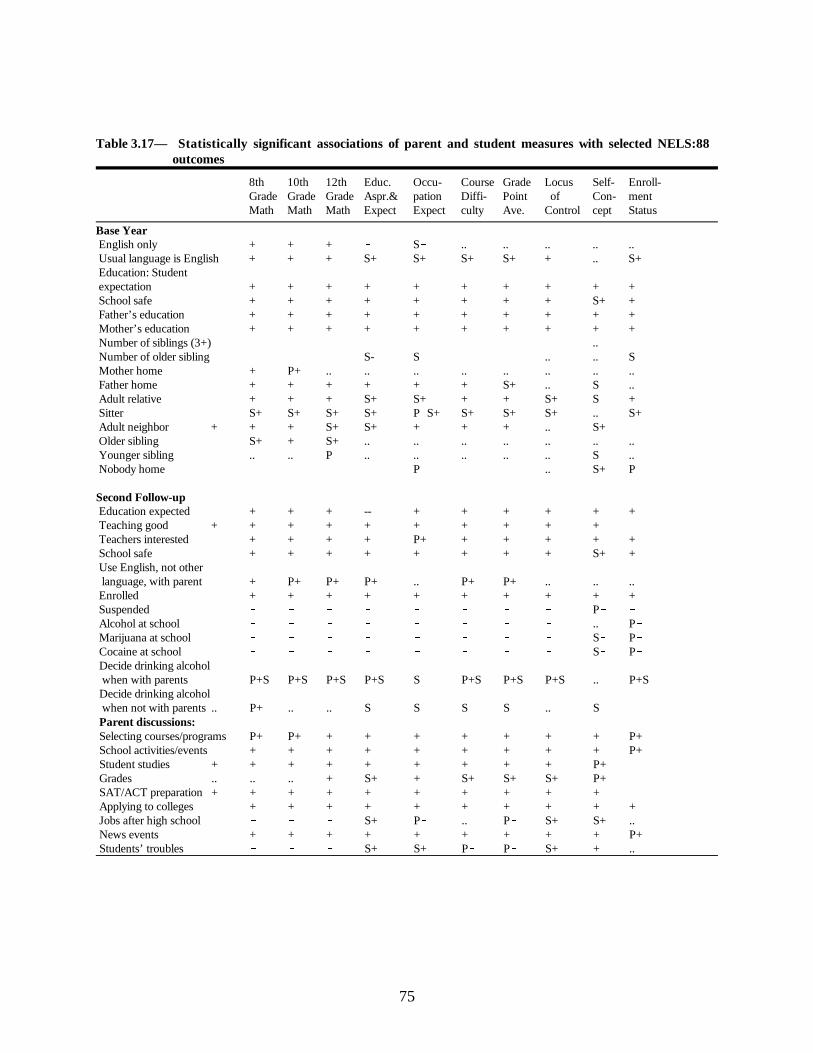
75
Table 3.17— Statistically significant associations of parent and student measures with selected NELS:88 outcomes
8th 10th 12th Educ. Occu- Course Grade Locus Self- Enroll-Grade Grade Grade Aspr.& pation Diffi- Point of Con- mentMath Math Math Expect Expect culty Ave. Control cept Status
Base Year English only + + + S .. .. .. .. .. Usual language is English + + + S+ S+ S+ S+ + .. S+ Education: Student expectation + + + + + + + + + + School safe + + + + + + + + S+ + Father’s education + + + + + + + + + + Mother’s education + + + + + + + + + + Number of siblings (3+) .. Number of older sibling S- S .. .. S Mother home + P+ .. .. .. .. .. .. .. .. Father home + + + + + + S+ .. S .. Adult relative + + + S+ S+ + + S+ S + Sitter S+ S+ S+ S+ PS+ S+ S+ S+ .. S+ Adult neighbor + + + S+ S+ + + + .. S+ Older sibling S+ + S+ .. .. .. .. .. .. .. Younger sibling .. .. P .. .. .. .. .. S .. Nobody home P .. S+ P
Second Follow-up Education expected + + + -- + + + + + + Teaching good + + + + + + + + + + Teachers interested + + + + P+ + + + + + School safe + + + + + + + + S+ + Use English, not other language, with parent + P+ P+ P+ .. P+ P+ .. .. .. Enrolled + + + + + + + + + + Suspended P Alcohol at school .. P Marijuana at school S P Cocaine at school S P Decide drinking alcohol when with parents P+S P+S P+S P+S S P+S P+S P+S .. P+S Decide drinking alcohol when not with parents .. P+ .. .. S S S S .. S Parent discussions: Selecting courses/programs P+ P+ + + + + + + + P+ School activities/events + + + + + + + + + P+ Student studies + + + + + + + + + P+ Grades .. .. .. + S+ + S+ S+ S+ P+ SAT/ACT preparation + + + + + + + + + + Applying to colleges + + + + + + + + + + Jobs after high school S+ P .. P S+ S+ .. News events + + + + + + + + + P+ Students’ troubles S+ S+ P P S+ + ..

76
Table 3.17— Statistically significant associations of parent and student measures with selected NELS:88 outcomes—Continued
8th 10th 12th Educ. Occu- Course Grade Locus Self-Grade Grade Grade Aspr.& pation Diffi- Point of Con- EnrollmentMath Math Math Expect Expect culty Ave. Control cept Status
Second Follow-up College choice factors: Low expenses P Availability of aid P PS+ P P P .. P Availability of courses PS+ S+ S+ + S+ S+ S+ S+ + .. Athletic reputation P P P + .. Social life P P P PS+ .. PS+ P P S+ S+ Able to live at home Chance to live away + + + + + + + P+S P+ + Religious environment S+ S+ .. P .. + .. Low crime environment .. .. S .. S+ .. Job placement PS+ PS+ P PS+ PS+ S+ .. Graduate school
placement P P .. + + S+ S+ S+ + .. Academic reputation + + + + + + + + + + Easy admission .. Preparation for job P PS+ PS+ S+ S+ S+ S+ S+ S+ .. Ethnic composition .. .. S + .. Size + + + + + + + + + S+ Location S+ S+ + S+ + + S+ S+ S+ S+ Same school as parent S S P+ P Occupation expected + + + + -- + + + + + Ever worked + + S+ .. .. .. S+ S+ .. ..
Note: “P” signifies that a significant effect would be found in the specified direction only for the parent measure; “S” signifies a significanteffect in the specified direction only for the student measure; “ + “ and “ “ signify that both are significant in the same direction; “P
S+” and “P+S “ signify significant parent and student effects in opposite directions, respectively; and “..” signifies no significant effects.Entries left blank were not estimatable.SOURCE: U.S. Department of Education, National Center for Education Statistics, National Education Longitudinal Study, 1988(NELS:88) Base Year, First Follow-up, and Second Follow-up Parent and Student Surveys.

77
Chapter 4
Comparison of Teacher and Student Responses
The NELS:88 data offer an opportunity to compare student and teacher reports about anumber of individual, classroom, and school characteristics. NELS:88 collected teacher data duringthe base year data collection and at each follow-up. Understanding the analyses of correspondencebetween teacher and student reports, but in particular the analyses of missing data presented here,requires understanding some aspects of the teacher sample design as described in Chapter 2. (A morecomplete discussion of the teacher sample is available in the Second Follow-Up: Teacher ComponentData File User’s Manual [NCES 1994b].)
In this chapter, comparisons between second follow-up student and teacher responses arepresented for three sets of items: ratings of the student’s English proficiency, perceptions of teachingpractices in the mathematics or science classroom, and specification of the student’s academicprogram. For each set of items, four tables are displayed, containing summary data relevant to thefour research questions stated in chapter 2 (relating to convergence, omissions, subpopulations, andimpact on outcomes). The first three tables in each case are computed without weights; the fourthpresents significance results that take into account both the survey design and differential weighting.
Student English Proficiency
Students and teachers were both asked to answer two items about students’ Englishproficiency: whether or not the student’s native language was English, and, for non-native speakers,whether the student’s English skills contributed to classroom difficulties.
Student Question107 (F2) Is English your native language (the first language you learned to speak when you were a child)?
Teacher Question9(F2) Is this student’s native language English?
The teachers’ question included a footnote indicating that the phrase “native language” referred tothe first language that the student learned to speak as a child. For these analyses, a positive responsewas scored as “1,” a negative response as “0.”
A follow-up item relied upon more subjective judgment, and this subjectivity shows clearlythe extent of disagreement between teachers and students. Students who reported that they were notnative speakers of English were asked:

78
Student Question:111(F2) Have your English skills made it difficult for you to
a. Write papers for class?b. Take essay exams?c. Take multiple choice exams?d. Understand what the teacher says in class?e. Take notes on the materials you learn in class?f. Participate in class discussions?g. Complete homework assignments?
Teachers were asked a much less detailed question:
Teacher Question10 (F2) Is this student’s academic performance in your class limited by his or her level
of English language proficiency?
Furthermore, this teacher item was asked about all students, while the corresponding studentitem was asked only of non-native speakers. For the current analysis, the comparison betweenteacher and student responses employs only those teacher responses that correspond to a student whoindicated that he or she was not a native English speaker. This restriction allowed a comparison ofthe reports on the teacher and student items for the same subsample of students.
To compare the teacher and student items, the student responses were collapsed into a binaryvariable that assumed a value of 1 if the student responded positively to any of the items (a throughg, above), and a value of 0 if he or she responded negatively to all of the items. This coding wascomparable to the yes/no format of the teacher item.
Table 4.1A summarizes key measures of correspondence between student and teacher reportson these items about students’ English proficiency.
Table 4.1A— Comparison of teacher and student responses to items about students’ native language andEnglish language proficiency
Number of Polychoric Percent Mean Teacher Mean Student StudentTeacherResponse Pairs Correlation Match Response Response Difference
Is native language English 7,791 0.86 94.5 0.95 0.92 0.03Limited English Proficiency 728 0.27 80.8 0.03 0.18 0.15SOURCE: U.S. Department of Education, National Center for Education Statistics, National Education Longitudinal Study, 1988(NELS:88); Second Follow-up Student and Teacher Surveys.
The similarity in wording allowed a direct comparison between the teacher’s and student’sreports of the student’s native language. As illustrated in Table 4.1A, students and teachersresponded fairly consistently. The polychoric correlation between the items was 0.86; however,
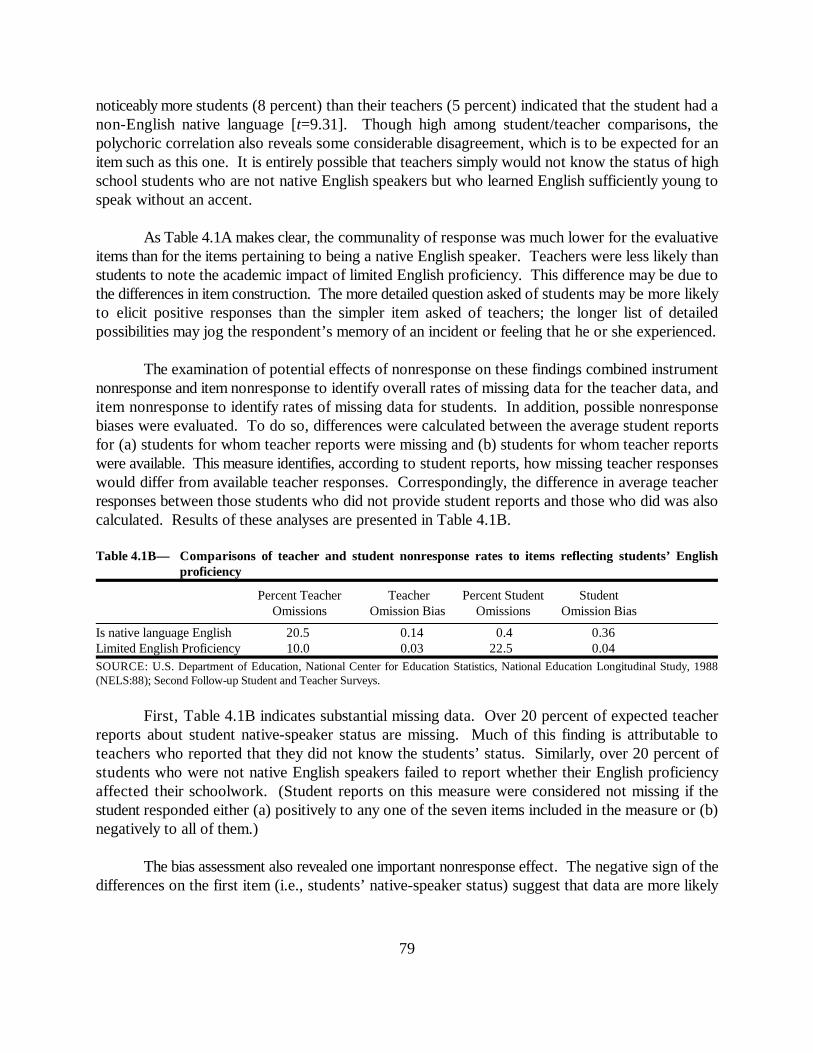
79
noticeably more students (8 percent) than their teachers (5 percent) indicated that the student had anon-English native language [t=9.31]. Though high among student/teacher comparisons, thepolychoric correlation also reveals some considerable disagreement, which is to be expected for anitem such as this one. It is entirely possible that teachers simply would not know the status of highschool students who are not native English speakers but who learned English sufficiently young tospeak without an accent.
As Table 4.1A makes clear, the communality of response was much lower for the evaluativeitems than for the items pertaining to being a native English speaker. Teachers were less likely thanstudents to note the academic impact of limited English proficiency. This difference may be due tothe differences in item construction. The more detailed question asked of students may be more likelyto elicit positive responses than the simpler item asked of teachers; the longer list of detailedpossibilities may jog the respondent’s memory of an incident or feeling that he or she experienced.
The examination of potential effects of nonresponse on these findings combined instrumentnonresponse and item nonresponse to identify overall rates of missing data for the teacher data, anditem nonresponse to identify rates of missing data for students. In addition, possible nonresponsebiases were evaluated. To do so, differences were calculated between the average student reportsfor (a) students for whom teacher reports were missing and (b) students for whom teacher reportswere available. This measure identifies, according to student reports, how missing teacher responseswould differ from available teacher responses. Correspondingly, the difference in average teacherresponses between those students who did not provide student reports and those who did was alsocalculated. Results of these analyses are presented in Table 4.1B.
Table 4.1B— Comparisons of teacher and student nonresponse rates to items reflecting students’ Englishproficiency
Percent Teacher Teacher Percent Student StudentOmissions Omission Bias Omissions Omission Bias
Is native language English 20.5 0.14 0.4 0.36Limited English Proficiency 10.0 0.03 22.5 0.04SOURCE: U.S. Department of Education, National Center for Education Statistics, National Education Longitudinal Study, 1988(NELS:88); Second Follow-up Student and Teacher Surveys.
First, Table 4.1B indicates substantial missing data. Over 20 percent of expected teacherreports about student native-speaker status are missing. Much of this finding is attributable toteachers who reported that they did not know the students’ status. Similarly, over 20 percent ofstudents who were not native English speakers failed to report whether their English proficiencyaffected their schoolwork. (Student reports on this measure were considered not missing if thestudent responded either (a) positively to any one of the seven items included in the measure or (b)negatively to all of them.)
The bias assessment also revealed one important nonresponse effect. The negative sign of thedifferences on the first item (i.e., students’ native-speaker status) suggest that data are more likely

80
to be missing for students who are not native English speakers [t=18.64, 7.53], and this bias isimportant in the case of teachers because of the substantial missing data. This result seems logical,especially with respect to the bias in the teacher reports. For example, it is plausible that teacherswould report they “don’t know” for high school students with Asian or Hispanic surnames who speakfluent English, many of whom learned English as a second language.
The correspondence between student and teacher responses to these two item-pairs wasexamined separately for groups defined by the following:
& Below median and above median socioeconomic status& Student sex& Below median and above median base year reading scores& Class subject (math or science) taught by teacher
Missing data rates were comparable across subgroups. While the potential bias from missingdata could be large for some groups, the limited amount of data made estimates too imprecise toreport differences with confidence. This analysis revealed no cross-group differences in either meandifferences between student and teacher reports or the percentage of nonresponses. However, theanalysis does reveal substantial variations in polychoric correlations for the estimates of the impactof limited English proficiency on schoolwork. These results are presented in Table 4.1C.
Table 4.1C— Response characteristics on items about student’s English proficiency, for population subgroups
8th Grade SES Sex Reading Subject
Low High Male Female Low High Math Science
Polychoric CorrelationsIs native language English 0.89 0.75 0.85 0.87 0.88 0.84 0.86 0.87
a
Limited English Proficiency 0.17 0.52 0.44 0.09 0.17 0.30 0.14 0.36Average Differences
Is native language English 0.03 0.02 0.02 0.03 0.03 0.02 0.02 0.03Limited English Proficiency 0.16 0.13 0.16 0.14 0.20 0.10 0.15 0.15
Pct. Student NonresponseIs native language English 0.5 0.3 0.5 0.3 0.7 0.2 0.4 0.4Limited English Proficiency 26.2 15.5 26.9 18.1 29.3 12.7 25.3 18.2
(a) A few high correlations are based on a Pearson correlation approximation. In those cases the polychoric correlation computation inSAS failed to converge for a subpopulation, although it did converge for the total. In those cases, the approximation (1 - R )2
(Pearson) subpopulation
x ((1 - R ) / (1 - R )) was used for (1 - R ). The Pearson approximation was accurate for cases for2 2 2 (polychoric) total (Pearson) total (polychoric) subpopulation
which the computation converged. SOURCE: U.S. Department of Education, National Center for Education Statistics, National Education Longitudinal Study, 1988(NELS:88); Second Follow-up Student and Teacher Surveys.
First, there was very little convergence between the answers given by the students who werebelow the median SES and those given by their teachers about the extent to which their English skillscontributed to any classroom difficulties [t=4.90]. There was also very little convergence betweenthe responses given by female students and their teachers [t=5.10] concerning how great an effectthe students’ English proficiency had on their academic performance. Finally, there was less
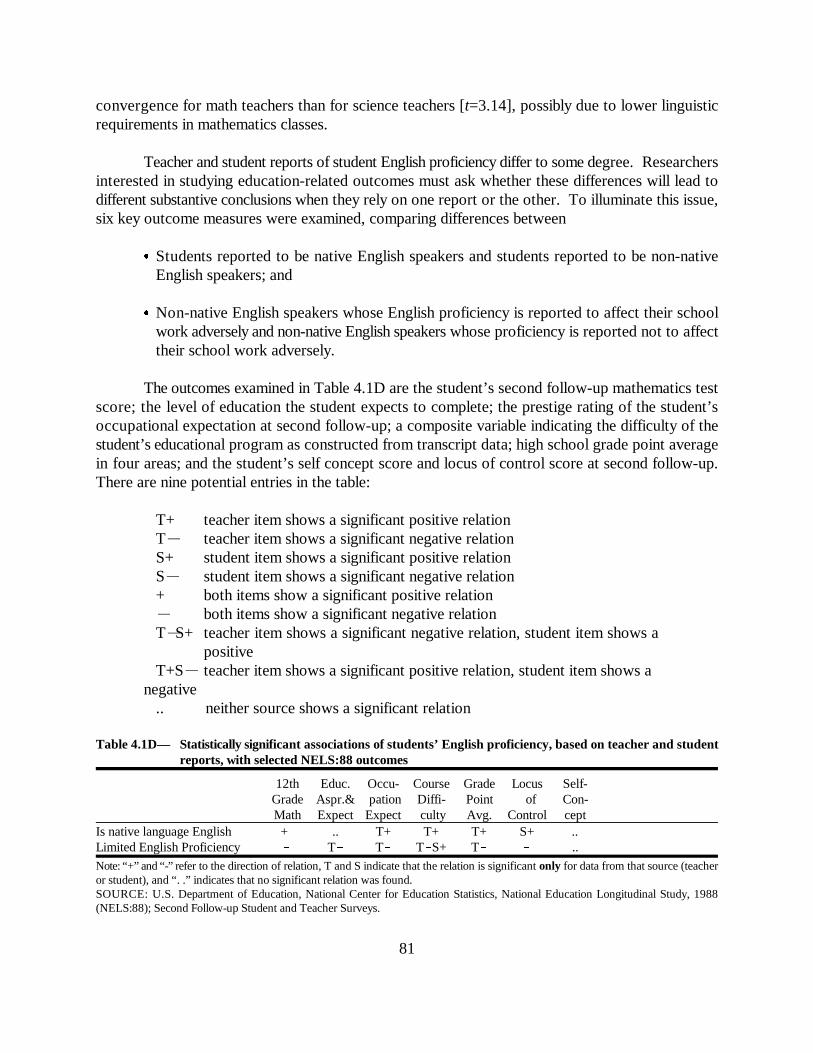
81
convergence for math teachers than for science teachers [t=3.14], possibly due to lower linguisticrequirements in mathematics classes.
Teacher and student reports of student English proficiency differ to some degree. Researchersinterested in studying education-related outcomes must ask whether these differences will lead todifferent substantive conclusions when they rely on one report or the other. To illuminate this issue,six key outcome measures were examined, comparing differences between
& Students reported to be native English speakers and students reported to be non-nativeEnglish speakers; and
& Non-native English speakers whose English proficiency is reported to affect their schoolwork adversely and non-native English speakers whose proficiency is reported not to affecttheir school work adversely.
The outcomes examined in Table 4.1D are the student’s second follow-up mathematics testscore; the level of education the student expects to complete; the prestige rating of the student’soccupational expectation at second follow-up; a composite variable indicating the difficulty of thestudent’s educational program as constructed from transcript data; high school grade point averagein four areas; and the student’s self concept score and locus of control score at second follow-up.There are nine potential entries in the table:
T+ teacher item shows a significant positive relation T teacher item shows a significant negative relation S+ student item shows a significant positive relation S student item shows a significant negative relation + both items show a significant positive relation both items show a significant negative relation TS+ teacher item shows a significant negative relation, student item shows a
positiveT+S teacher item shows a significant positive relation, student item shows a
negative.. neither source shows a significant relation
Table 4.1D— Statistically significant associations of students’ English proficiency, based on teacher and studentreports, with selected NELS:88 outcomes
12th Educ. Occu- Course Grade Locus Self-Grade Aspr.& pation Diffi- Point of Con-Math Expect Expect culty Avg. Control cept
Is native language English + .. T+ T+ T+ S+ .. Limited English Proficiency T T TS+ T ..
Note: “+” and “-” refer to the direction of relation, T and S indicate that the relation is significant only for data from that source (teacheror student), and “. .” indicates that no significant relation was found.SOURCE: U.S. Department of Education, National Center for Education Statistics, National Education Longitudinal Study, 1988(NELS:88); Second Follow-up Student and Teacher Surveys.

82
Table 4.1D indicates that there can be discrepancies in the conclusions that would be reachedconcerning the relations between English language use and outcome measures, depending on whetherstudent or teacher reports were the basis for the assessment. Teacher reports of whether English isthe student’s native language are positively related to the difficulty of a student’s program, gradepoint average, and level of the student’s occupational expectations, whereas student reports are not.On the other hand, students’ reports are positively associated with locus of control. Teachers’reports that students’ school performance is limited by English language proficiency are related,negatively, to the students’ educational aspirations and occupational expectations, curriculumdifficulty, and grade point average, whereas students’ perceptions are not. Clearly, differentconclusions about the relations between English language proficiency and educational outcomes willbe found, depending on whether the teacher or student is the source of the perception.
Practices in the Classroom
The NELS:88 second follow-up asked students and teachers about instructional practices inmath and science classes. This section examines the correspondence between student and teacherreports about what happens in the classroom. Responses of math and science teachers and theirstudents to the following items, which were on a 5-point scale ranging from (1) “never/rarely” to (5)“every day”, were analyzed:
Math Teacher Question13A (F2) How often do you use the following teaching methods or media?
a. Lecture?b. Use computers?f. Have student-led whole-group discussions?
Student Math Class Question19B (F2) In your current or most recent mathematics class, how often do/did you
b. Listen to the teacher lecture?g. Use computers in math class?i. Participate in student discussions?
The items on student discussions are included in the analysis even though they refer to somewhatdifferent activities, to assess how differently two items on classroom student discussions may operatein a research study.
Science Teacher Question19 (F2): How often do you do each of the following activities in this science
class?
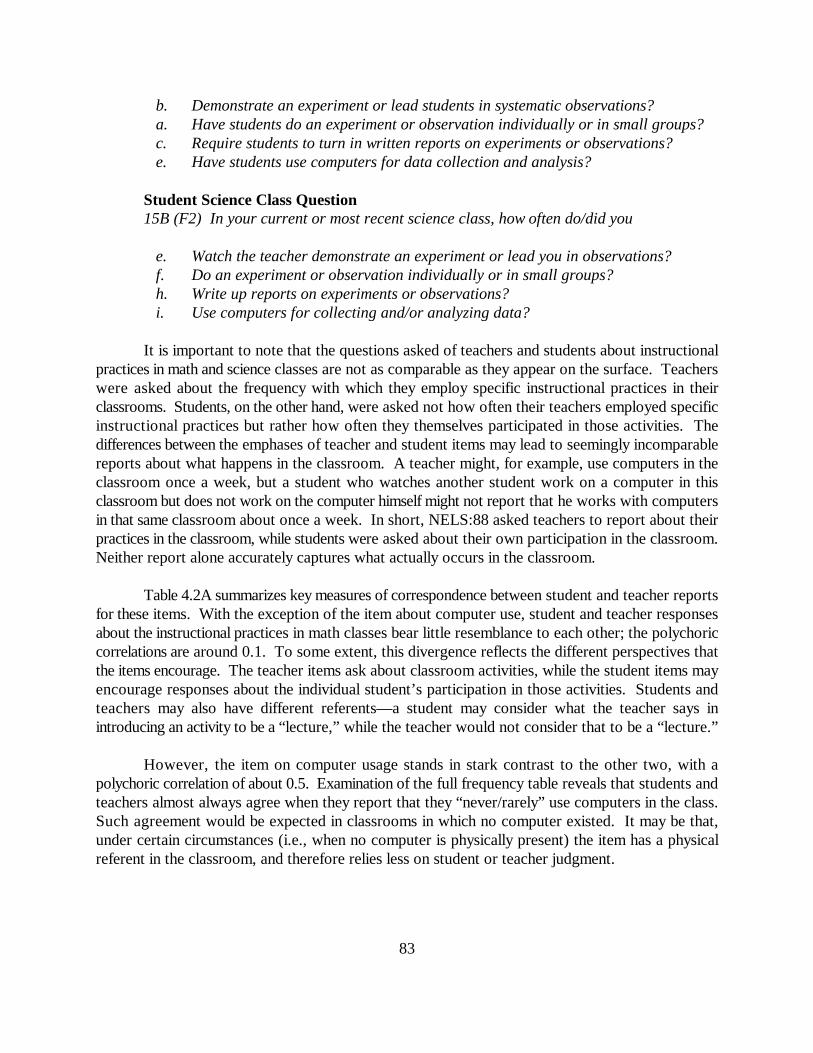
83
b. Demonstrate an experiment or lead students in systematic observations?a. Have students do an experiment or observation individually or in small groups?c. Require students to turn in written reports on experiments or observations?e. Have students use computers for data collection and analysis?
Student Science Class Question15B (F2) In your current or most recent science class, how often do/did you
e. Watch the teacher demonstrate an experiment or lead you in observations?f. Do an experiment or observation individually or in small groups?h. Write up reports on experiments or observations?i. Use computers for collecting and/or analyzing data?
It is important to note that the questions asked of teachers and students about instructionalpractices in math and science classes are not as comparable as they appear on the surface. Teacherswere asked about the frequency with which they employ specific instructional practices in theirclassrooms. Students, on the other hand, were asked not how often their teachers employed specificinstructional practices but rather how often they themselves participated in those activities. Thedifferences between the emphases of teacher and student items may lead to seemingly incomparablereports about what happens in the classroom. A teacher might, for example, use computers in theclassroom once a week, but a student who watches another student work on a computer in thisclassroom but does not work on the computer himself might not report that he works with computersin that same classroom about once a week. In short, NELS:88 asked teachers to report about theirpractices in the classroom, while students were asked about their own participation in the classroom.Neither report alone accurately captures what actually occurs in the classroom.
Table 4.2A summarizes key measures of correspondence between student and teacher reportsfor these items. With the exception of the item about computer use, student and teacher responsesabout the instructional practices in math classes bear little resemblance to each other; the polychoriccorrelations are around 0.1. To some extent, this divergence reflects the different perspectives thatthe items encourage. The teacher items ask about classroom activities, while the student items mayencourage responses about the individual student’s participation in those activities. Students andteachers may also have different referents—a student may consider what the teacher says inintroducing an activity to be a “lecture,” while the teacher would not consider that to be a “lecture.”
However, the item on computer usage stands in stark contrast to the other two, with apolychoric correlation of about 0.5. Examination of the full frequency table reveals that students andteachers almost always agree when they report that they “never/rarely” use computers in the class.Such agreement would be expected in classrooms in which no computer existed. It may be that,under certain circumstances (i.e., when no computer is physically present) the item has a physicalreferent in the classroom, and therefore relies less on student or teacher judgment.
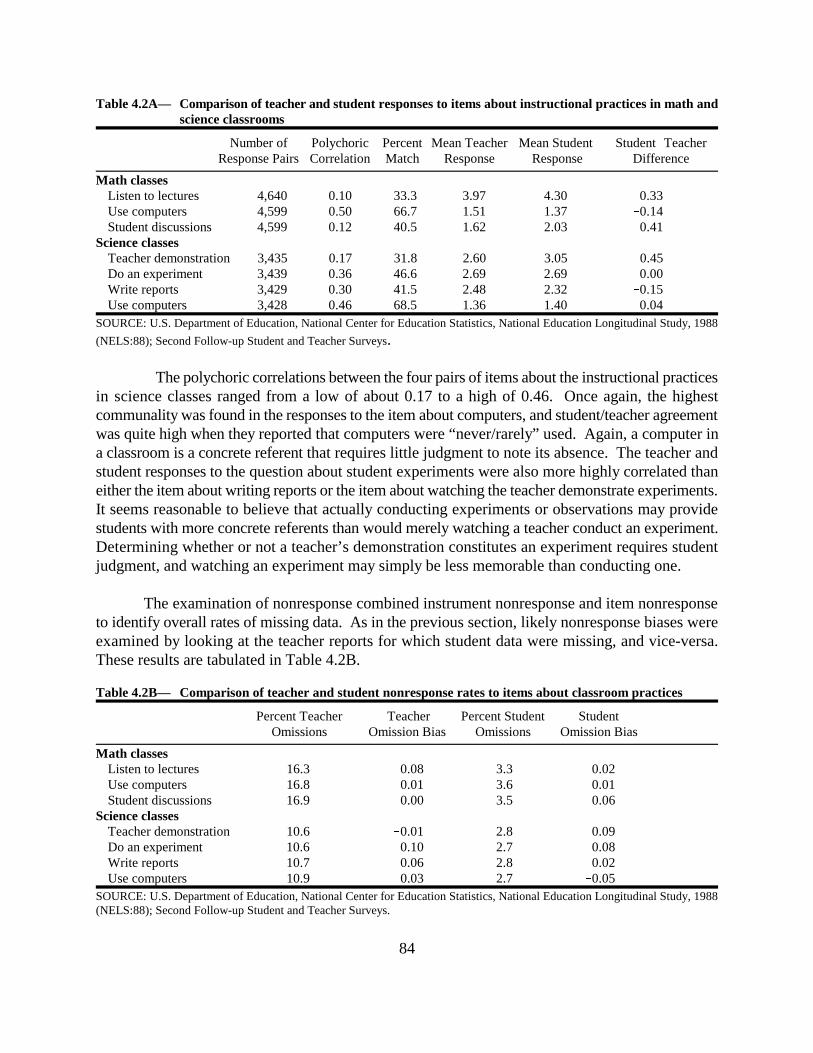
84
Table 4.2A— Comparison of teacher and student responses to items about instructional practices in math andscience classrooms
Number of Polychoric Percent Mean Teacher Mean Student StudentTeacherResponse Pairs Correlation Match Response Response Difference
Math classesListen to lectures 4,640 0.10 33.3 3.97 4.30 0.33Use computers 4,599 0.50 66.7 1.51 1.37 0.14Student discussions 4,599 0.12 40.5 1.62 2.03 0.41
Science classesTeacher demonstration 3,435 0.17 31.8 2.60 3.05 0.45Do an experiment 3,439 0.36 46.6 2.69 2.69 0.00Write reports 3,429 0.30 41.5 2.48 2.32 0.15Use computers 3,428 0.46 68.5 1.36 1.40 0.04
SOURCE: U.S. Department of Education, National Center for Education Statistics, National Education Longitudinal Study, 1988
(NELS:88); Second Follow-up Student and Teacher Surveys.
The polychoric correlations between the four pairs of items about the instructional practicesin science classes ranged from a low of about 0.17 to a high of 0.46. Once again, the highestcommunality was found in the responses to the item about computers, and student/teacher agreementwas quite high when they reported that computers were “never/rarely” used. Again, a computer ina classroom is a concrete referent that requires little judgment to note its absence. The teacher andstudent responses to the question about student experiments were also more highly correlated thaneither the item about writing reports or the item about watching the teacher demonstrate experiments.It seems reasonable to believe that actually conducting experiments or observations may providestudents with more concrete referents than would merely watching a teacher conduct an experiment.Determining whether or not a teacher’s demonstration constitutes an experiment requires studentjudgment, and watching an experiment may simply be less memorable than conducting one.
The examination of nonresponse combined instrument nonresponse and item nonresponseto identify overall rates of missing data. As in the previous section, likely nonresponse biases wereexamined by looking at the teacher reports for which student data were missing, and vice-versa.These results are tabulated in Table 4.2B.
Table 4.2B— Comparison of teacher and student nonresponse rates to items about classroom practices
Percent Teacher Teacher Percent Student StudentOmissions Omission Bias Omissions Omission Bias
Math classesListen to lectures 16.3 0.08 3.3 0.02Use computers 16.8 0.01 3.6 0.01Student discussions 16.9 0.00 3.5 0.06
Science classesTeacher demonstration 10.6 0.01 2.8 0.09Do an experiment 10.6 0.10 2.7 0.08Write reports 10.7 0.06 2.8 0.02Use computers 10.9 0.03 2.7 0.05
SOURCE: U.S. Department of Education, National Center for Education Statistics, National Education Longitudinal Study, 1988(NELS:88); Second Follow-up Student and Teacher Surveys.

85
As Table 4.2B illustrates, about 3 percent of the student data and between 11 and 17 percentof the teacher data were missing. The examination of potential biases revealed no obvious biases.This finding, however, does not necessarily suggest that respondents were substantially similar tononrespondents. The low communalities between the student and teacher reports could be taken asan indication of poor measurement of one or both items in each pair. If neither item provides a goodmeasure, then observed differences would be rare, especially in small samples (for instance, thesample in which a report from one source is available and a report from another source is missing).
The correspondence between student and teacher responses to each of the item-pairs wasexamined separately for groups defined by sex, SES, and base year reading scores. Analyses weredone separately for math classes and science classes. Table 4.2C summarizes the results of theseanalyses.
First, looking at the comparison of student responses with those of their math teachers,greater disagreement in the mean appears between females and their teachers than males and theirteachers. In particular, in comparison to males, females seem to report more frequent lectures in theirmath classes. The mean difference between the teachers’ and the girls’ reports is 0.42; the meandifference between the teachers’ and the boys’ reports is 0.25 [t=4.64]. However, the difference inthe wording of the teacher and student items may support the conclusion that girls were simplyreporting spending more time listening to lectures than boys were. At the same time, the differencebetween girls’ reports of the frequency of computer usage in math classes and their teachers’ reportsalso tends to be greater, in the opposite direction, than the difference between boys’ and teachers’reports [t=5.26]. This difference suggests that girls may be using the computers less frequently thanboys in the class.
A similar pattern emerges in the comparison between math teacher reports on lecturing andthe reports of students whose base year reading scores are above and below the median. Thedifferences between student and teacher reports tend to be larger for students with high eighth gradereading scores (0.39) than for other students (0.26) [t=3.57]. Again, on the question about listeningto lectures, higher eighth grade reading scores students may be reporting that they listen more, notnecessarily that the teacher lectures more. Also, students with higher eighth grade reading scoresreported less frequent computer usage in comparison with their teachers (-0.18) than other studentsdid (0.07) [t=3.55]. Whether this difference is related to differences (a) in the math classes thesestudents are taking, (b) in the experiences they are having with computers in the same classes, or (c)in their perceptions of the same experiences is not clear.
With respect to teacher and student reports on science classroom practices, students withlower eighth grade reading scores tended to report more of each of the four types of activities,relative to their teachers, than did those with higher eighth grade reading scores [t=4.81,4.50, 2.46,2.86]. Again, these may be differences in perception or differences in experience.
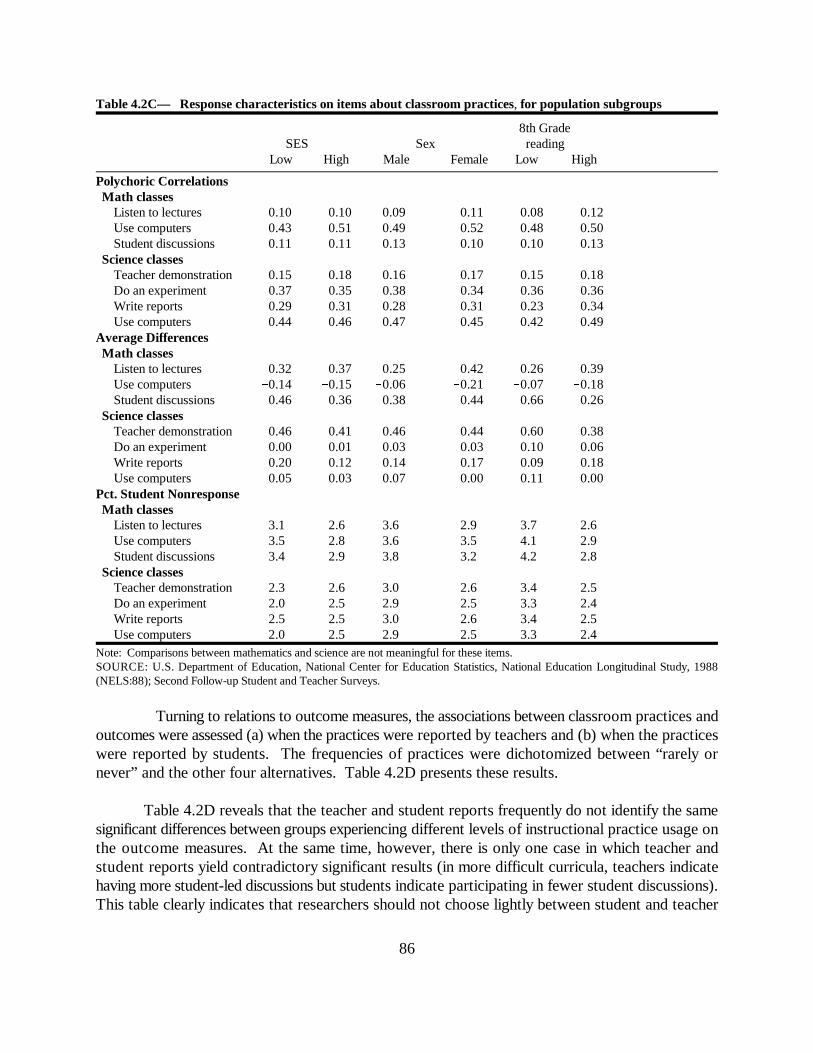
86
Table 4.2C— Response characteristics on items about classroom practices, for population subgroups
8th GradeSES Sex reading
Low High Male Female Low High
Polychoric CorrelationsMath classes
Listen to lectures 0.10 0.10 0.09 0.11 0.08 0.12Use computers 0.43 0.51 0.49 0.52 0.48 0.50Student discussions 0.11 0.11 0.13 0.10 0.10 0.13
Science classesTeacher demonstration 0.15 0.18 0.16 0.17 0.15 0.18Do an experiment 0.37 0.35 0.38 0.34 0.36 0.36Write reports 0.29 0.31 0.28 0.31 0.23 0.34Use computers 0.44 0.46 0.47 0.45 0.42 0.49
Average DifferencesMath classes
Listen to lectures 0.32 0.37 0.25 0.42 0.26 0.39Use computers 0.14 0.15 0.06 0.21 0.07 0.18Student discussions 0.46 0.36 0.38 0.44 0.66 0.26
Science classesTeacher demonstration 0.46 0.41 0.46 0.44 0.60 0.38Do an experiment 0.00 0.01 0.03 0.03 0.10 0.06Write reports 0.20 0.12 0.14 0.17 0.09 0.18Use computers 0.05 0.03 0.07 0.00 0.11 0.00
Pct. Student NonresponseMath classes
Listen to lectures 3.1 2.6 3.6 2.9 3.7 2.6Use computers 3.5 2.8 3.6 3.5 4.1 2.9Student discussions 3.4 2.9 3.8 3.2 4.2 2.8
Science classesTeacher demonstration 2.3 2.6 3.0 2.6 3.4 2.5Do an experiment 2.0 2.5 2.9 2.5 3.3 2.4Write reports 2.5 2.5 3.0 2.6 3.4 2.5Use computers 2.0 2.5 2.9 2.5 3.3 2.4
Note: Comparisons between mathematics and science are not meaningful for these items.SOURCE: U.S. Department of Education, National Center for Education Statistics, National Education Longitudinal Study, 1988(NELS:88); Second Follow-up Student and Teacher Surveys.
Turning to relations to outcome measures, the associations between classroom practices andoutcomes were assessed (a) when the practices were reported by teachers and (b) when the practiceswere reported by students. The frequencies of practices were dichotomized between “rarely ornever” and the other four alternatives. Table 4.2D presents these results.
Table 4.2D reveals that the teacher and student reports frequently do not identify the samesignificant differences between groups experiencing different levels of instructional practice usage onthe outcome measures. At the same time, however, there is only one case in which teacher andstudent reports yield contradictory significant results (in more difficult curricula, teachers indicatehaving more student-led discussions but students indicate participating in fewer student discussions).This table clearly indicates that researchers should not choose lightly between student and teacher
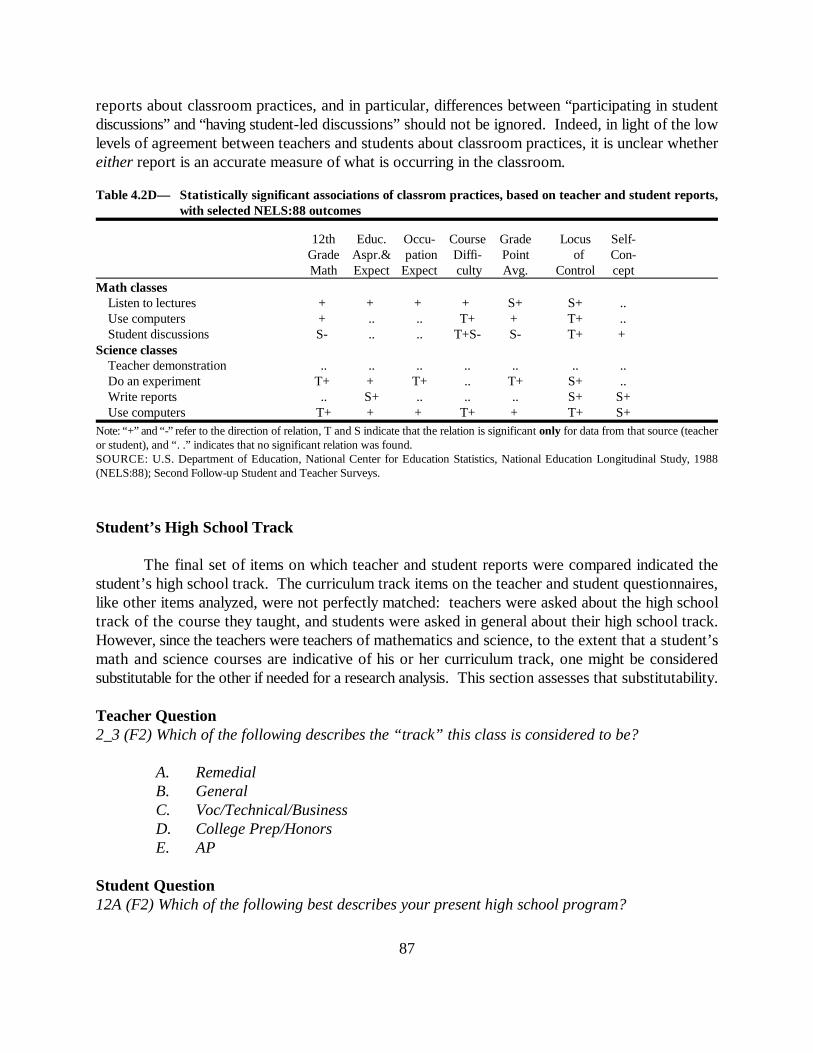
87
reports about classroom practices, and in particular, differences between “participating in studentdiscussions” and “having student-led discussions” should not be ignored. Indeed, in light of the lowlevels of agreement between teachers and students about classroom practices, it is unclear whethereither report is an accurate measure of what is occurring in the classroom.
Table 4.2D— Statistically significant associations of classrom practices, based on teacher and student reports,with selected NELS:88 outcomes
12th Educ. Occu- Course Grade Locus Self-Grade Aspr.& pation Diffi- Point of Con-Math Expect Expect culty Avg. Control cept
Math classesListen to lectures + + + + S+ S+ .. Use computers + .. .. T+ + T+ .. Student discussions S- .. .. T+S- S- T+ +
Science classesTeacher demonstration .. .. .. .. .. .. .. Do an experiment T+ + T+ .. T+ S+ .. Write reports .. S+ .. .. .. S+ S+ Use computers T+ + + T+ + T+ S+
Note: “+” and “-” refer to the direction of relation, T and S indicate that the relation is significant only for data from that source (teacheror student), and “. .” indicates that no significant relation was found.SOURCE: U.S. Department of Education, National Center for Education Statistics, National Education Longitudinal Study, 1988(NELS:88); Second Follow-up Student and Teacher Surveys.
Student’s High School Track
The final set of items on which teacher and student reports were compared indicated thestudent’s high school track. The curriculum track items on the teacher and student questionnaires,like other items analyzed, were not perfectly matched: teachers were asked about the high schooltrack of the course they taught, and students were asked in general about their high school track.However, since the teachers were teachers of mathematics and science, to the extent that a student’smath and science courses are indicative of his or her curriculum track, one might be consideredsubstitutable for the other if needed for a research analysis. This section assesses that substitutability.
Teacher Question 2_3 (F2) Which of the following describes the “track” this class is considered to be?
A. RemedialB. GeneralC. Voc/Technical/BusinessD. College Prep/HonorsE. AP
Student Question 12A (F2) Which of the following best describes your present high school program?
88
A. General high school programB. College prep, academic, or specialized academic (such as Science or Math)C. Vocational technical, or business and career...
— Industrial arts/Technology education— Agricultural occupations— Business or office occupations— Marketing or Distributive education— Health occupations— Home economics occupations— Consumer and homemaking education— Technical occupations— Trade or industrial occupations
D. Other specialized high school program (such as Fine Arts)E. Special Education ProgramF. I don’t knowG. Alternative, Stay-in-School, or Dropout Prevention Program
An additional problem to be addressed in this comparison was that the response categorieswere not identical for the student and teacher items. However, it was possible to collapse theresponses into general, vocational, and college preparatory tracks and limit the analyses to these threetracks. Rather than utilize a single scale for these three items, the items were recoded to generatethree binary variables (coded 1 if the course/student is in the track and 0 otherwise) for each set ofrespondents. Students in classes reported by teachers to be in a remedial track or by themselves tobe in special education, an alternative program, or a specialized program like fine arts were notcounted in these analyses. (That is, they were treated as legitimate skips for the trichotomy of maintracks).
Table 4.3A presents key measures of correspondence between teacher and student reportsfor these three variables. The polychoric correlations for these items were in the moderate range;however, the convergence for the college preparatory track response (.59) was noticeably higher thanthe others [t=3.72, 7.16]. That is, there appeared to be greater overlap of students in one track incourses in another track for the vocational education and general tracks than for the academic track.
Most math and science teachers considered their courses to be college preparatory (75 percentof students had teachers who reported their class to be college preparatory) , although they were opento students not in those tracks (only 62 percent of students reported being in a college preparatorytrack) [t=24.07]. This finding may follow from the differences between the teacher and student items.For instance, many students in a general or vocational high school track may take math or scienceclasses that teachers consider to be college preparatory. It is also possible that, depending upon howapparent or unapparent track levels are in a school, students simply do not know which track theybelong to and simply report “general” because they believe they are taking the same courses theirpeers are.
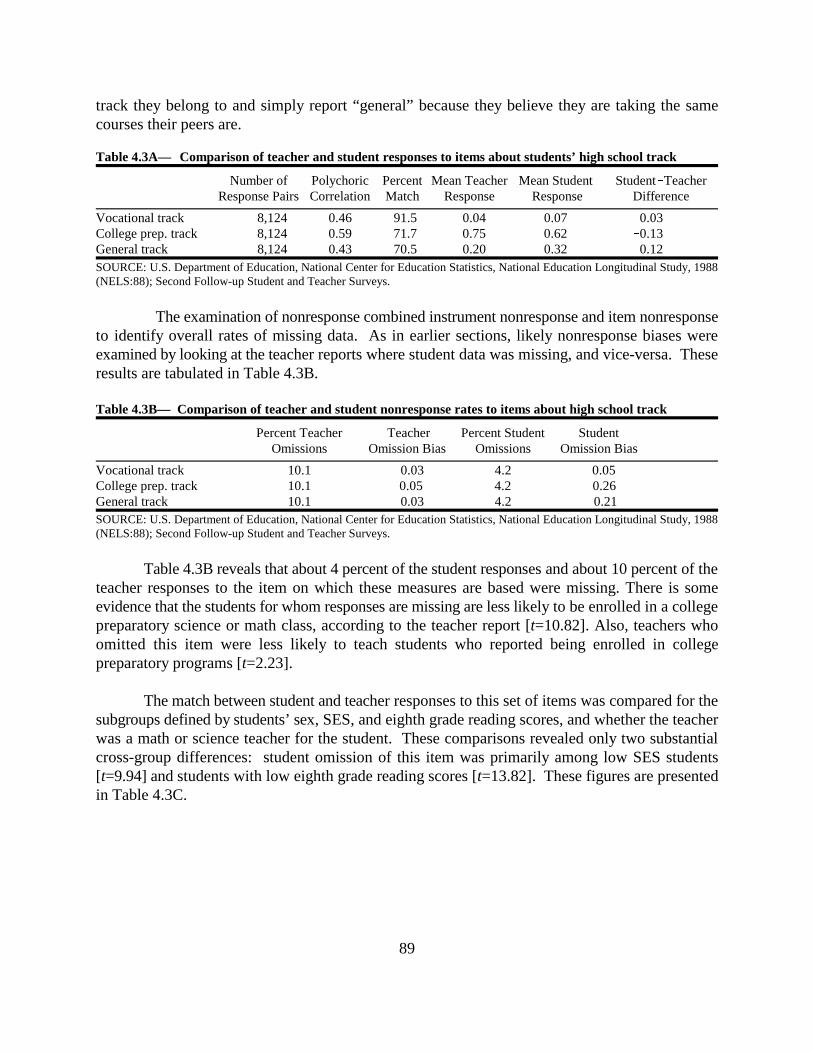
89
track they belong to and simply report “general” because they believe they are taking the samecourses their peers are.
Table 4.3A— Comparison of teacher and student responses to items about students’ high school track
Number of Polychoric Percent Mean Teacher Mean Student StudentTeacherResponse Pairs Correlation Match Response Response Difference
Vocational track 8,124 0.46 91.5 0.04 0.07 0.03College prep. track 8,124 0.59 71.7 0.75 0.62 0.13General track 8,124 0.43 70.5 0.20 0.32 0.12SOURCE: U.S. Department of Education, National Center for Education Statistics, National Education Longitudinal Study, 1988(NELS:88); Second Follow-up Student and Teacher Surveys.
The examination of nonresponse combined instrument nonresponse and item nonresponseto identify overall rates of missing data. As in earlier sections, likely nonresponse biases wereexamined by looking at the teacher reports where student data was missing, and vice-versa. Theseresults are tabulated in Table 4.3B.
Table 4.3B— Comparison of teacher and student nonresponse rates to items about high school track
Percent Teacher Teacher Percent Student StudentOmissions Omission Bias Omissions Omission Bias
Vocational track 10.1 0.03 4.2 0.05College prep. track 10.1 0.05 4.2 0.26General track 10.1 0.03 4.2 0.21SOURCE: U.S. Department of Education, National Center for Education Statistics, National Education Longitudinal Study, 1988(NELS:88); Second Follow-up Student and Teacher Surveys.
Table 4.3B reveals that about 4 percent of the student responses and about 10 percent of theteacher responses to the item on which these measures are based were missing. There is someevidence that the students for whom responses are missing are less likely to be enrolled in a collegepreparatory science or math class, according to the teacher report [t=10.82]. Also, teachers whoomitted this item were less likely to teach students who reported being enrolled in collegepreparatory programs [t=2.23].
The match between student and teacher responses to this set of items was compared for thesubgroups defined by students’ sex, SES, and eighth grade reading scores, and whether the teacherwas a math or science teacher for the student. These comparisons revealed only two substantialcross-group differences: student omission of this item was primarily among low SES students[t=9.94] and students with low eighth grade reading scores [t=13.82]. These figures are presentedin Table 4.3C.
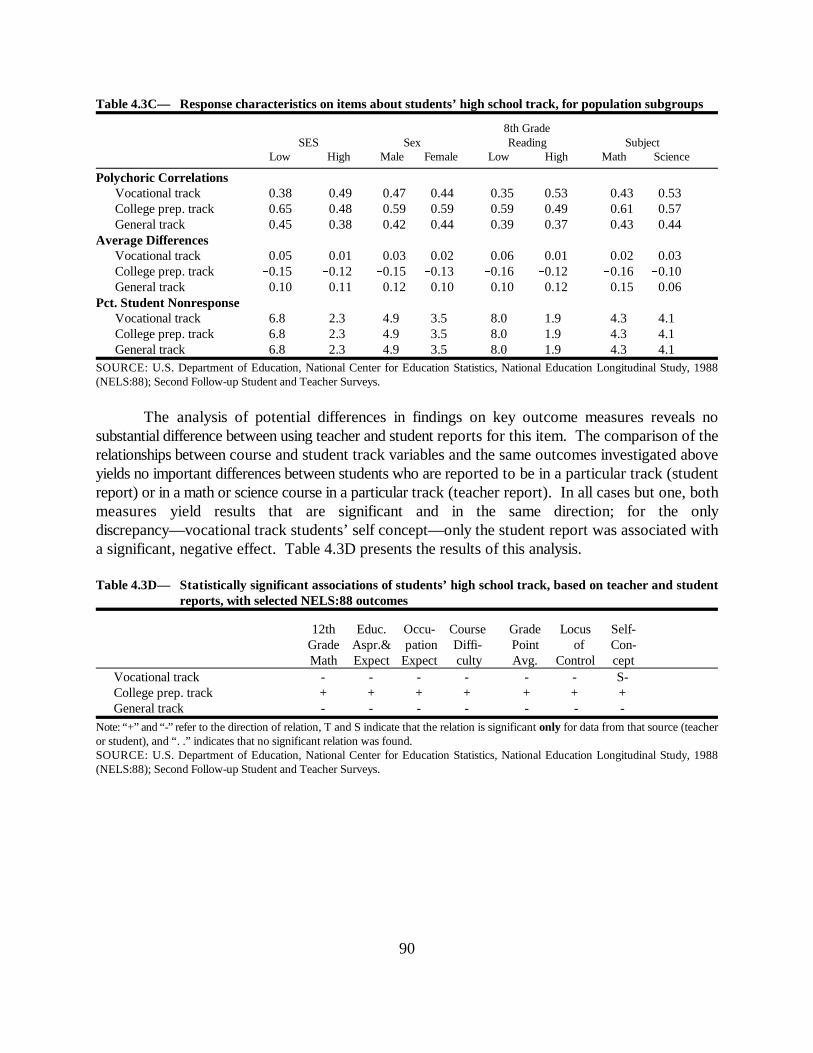
90
Table 4.3C— Response characteristics on items about students’ high school track, for population subgroups
8th Grade SES Sex Reading Subject
Low High Male Female Low High Math Science
Polychoric CorrelationsVocational track 0.38 0.49 0.47 0.44 0.35 0.53 0.43 0.53College prep. track 0.65 0.48 0.59 0.59 0.59 0.49 0.61 0.57General track 0.45 0.38 0.42 0.44 0.39 0.37 0.43 0.44
Average DifferencesVocational track 0.05 0.01 0.03 0.02 0.06 0.01 0.02 0.03College prep. track 0.15 0.12 0.15 0.13 0.16 0.12 0.16 0.10General track 0.10 0.11 0.12 0.10 0.10 0.12 0.15 0.06
Pct. Student NonresponseVocational track 6.8 2.3 4.9 3.5 8.0 1.9 4.3 4.1College prep. track 6.8 2.3 4.9 3.5 8.0 1.9 4.3 4.1General track 6.8 2.3 4.9 3.5 8.0 1.9 4.3 4.1
SOURCE: U.S. Department of Education, National Center for Education Statistics, National Education Longitudinal Study, 1988(NELS:88); Second Follow-up Student and Teacher Surveys.
The analysis of potential differences in findings on key outcome measures reveals nosubstantial difference between using teacher and student reports for this item. The comparison of therelationships between course and student track variables and the same outcomes investigated aboveyields no important differences between students who are reported to be in a particular track (studentreport) or in a math or science course in a particular track (teacher report). In all cases but one, bothmeasures yield results that are significant and in the same direction; for the onlydiscrepancy—vocational track students’ self concept—only the student report was associated witha significant, negative effect. Table 4.3D presents the results of this analysis.
Table 4.3D— Statistically significant associations of students’ high school track, based on teacher and studentreports, with selected NELS:88 outcomes
12th Educ. Occu- Course Grade Locus Self-Grade Aspr.& pation Diffi- Point of Con-Math Expect Expect culty Avg. Control cept
Vocational track - - - - - - S-College prep. track + + + + + + +General track - - - - - - -
Note: “+” and “-” refer to the direction of relation, T and S indicate that the relation is significant only for data from that source (teacheror student), and “. .” indicates that no significant relation was found.SOURCE: U.S. Department of Education, National Center for Education Statistics, National Education Longitudinal Study, 1988(NELS:88); Second Follow-up Student and Teacher Surveys.
91
Summary
The combined results across the various topic areas discussed in this chapter are shown in thefollowing series of tables. First, in Figure 4.1 and Table 4.4A, the scatter of items in terms of twomeasures of convergence, the teacher-student difference and the polychoric correlation, are shown.As can be seen, the polychoric correlations vary from .10 to .86. Next, Table 4.4B summarizes theimpact of teacher and student nonresponse on the distribution of item responses. Table 4.5summarizes the variations in polychoric correlations between various population subgroups. Table4.6 shows the general pattern of agreement between teachers and students for population subgroups,and Table 4.7 shows the pattern of student nonresponse to these items. (Items pertaining toclassroom practices cannot be compared in Tables 4.5, 4.6, and 4.7 between the subpopulations ofstudents for whom math or science teacher responses are available because the items about mathclasses do not match the items about science classes. Therefore, parts of these tables are left blank.)Finally, Table 4.8 summarizes the comparisons of findings of statistically significant associations withoutcome measures, when the predictive factors are based on teacher or student information.
Teacher and student responses to the NELS:88 items under consideration tend to differ,sometimes quite dramatically. Even seemingly straightforward items, such as the question of whetheror not English is a student’s native language, yield reports from teachers and students that differnoticeably from one another.
In some cases of difference between teacher and student reports, the differences may beattributed, at least in part, to differences in the wording of items or to the ways in which the studentand teacher are likely to understand the items. Among such cases, instances with the highestcorrespondence tend to be those with a fairly concrete referent (e.g., the physical presence of acomputer in a classroom; the student’s recollection of conducting an experiment in science class).
Based upon findings presented in this chapter, researchers employing data about classroompractices are likely to obtain different findings depending on specific item wordings and whether theychoose to rely on student or teacher reports of the practices researched (e.g, are student or student-led discussions as effective as lectures in a high school math class?). Student and teacher data divergeso significantly on these items that one must carefully scrutinize conclusions that are based on reportsby teachers and students about classroom activities to determine whether they are warranted. Studentand teacher responses provide different perspectives on high school, and research to combine theminto more effective pictures of school processes would be valuable.
Given the data available, researchers should not make the choice between student and teacherreports of classroom practices lightly, and indeed, perhaps should not make the choice in that format all. The incomparability of teacher and student data on these items shows clearly that researchersusing these data must clearly define what they intend to measure and develop an explicit model of therelation that the data bear to that construct. Such models might include data from multiple sources,as well as specification of the error structure of the model.
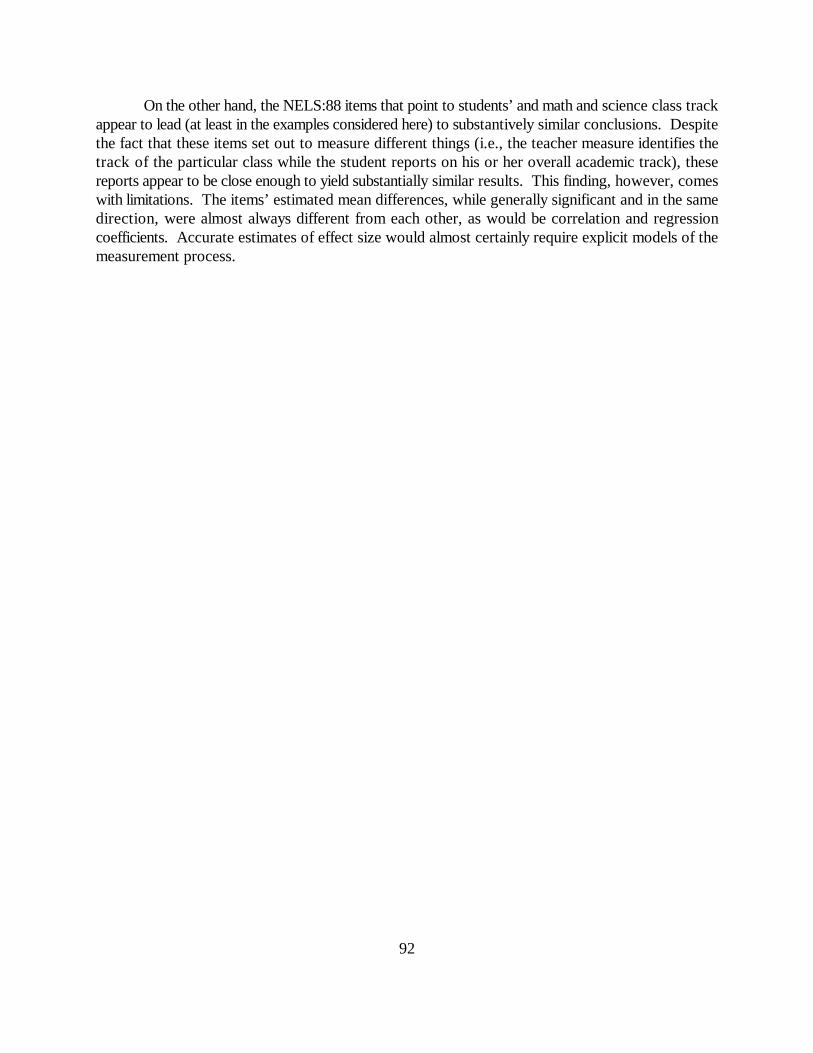
92
On the other hand, the NELS:88 items that point to students’ and math and science class trackappear to lead (at least in the examples considered here) to substantively similar conclusions. Despitethe fact that these items set out to measure different things (i.e., the teacher measure identifies thetrack of the particular class while the student reports on his or her overall academic track), thesereports appear to be close enough to yield substantially similar results. This finding, however, comeswith limitations. The items’ estimated mean differences, while generally significant and in the samedirection, were almost always different from each other, as would be correlation and regressioncoefficients. Accurate estimates of effect size would almost certainly require explicit models of themeasurement process.
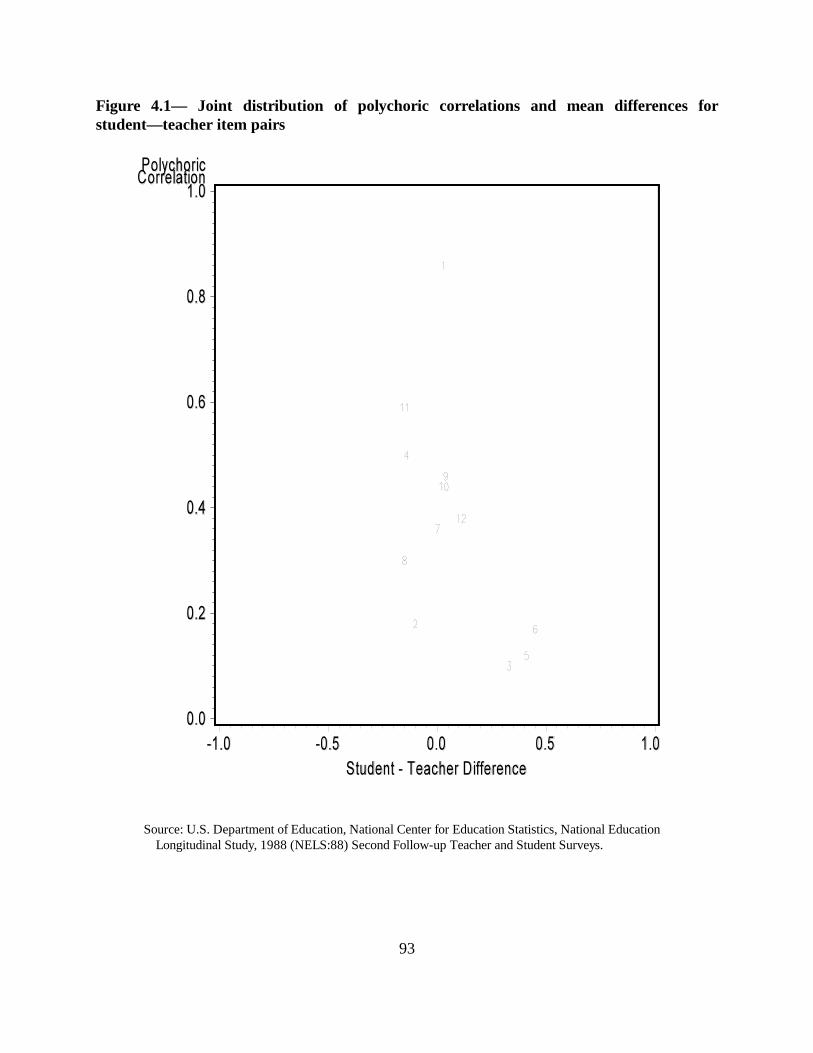
93
Figure 4.1— Joint distribution of polychoric correlations and mean differences forstudent—teacher item pairs
Source: U.S. Department of Education, National Center for Education Statistics, National EducationLongitudinal Study, 1988 (NELS:88) Second Follow-up Teacher and Student Surveys.

94
Table 4.4A— Comparison of student and teacher responses to NELS:88 items
Number of Polychoric Percent Mean Teacher Mean Student StudentTeacherResponse Pairs Correlation Match Response Response Difference
1.Is native language English 7,791 0.86 94.5 0.95 0.92 0.032.Limited English Proficiency 728 0.27 80.8 0.03 0.18 0.15Math classes
3.Listen to lectures 4,640 0.10 33.3 3.97 4.30 0.334.Use computers 4,599 0.50 66.7 1.51 1.37 0.145.Student discussions 4,599 0.12 40.5 1.62 2.03 0.41
Science classes6.Teacher demonstration 3,435 0.17 31.8 2.60 3.05 0.457.Do an experiment 3,439 0.36 46.6 2.69 2.69 0.008.Write reports 3,429 0.30 41.5 2.48 2.32 0.159.Use computers 3,428 0.46 68.5 1.36 1.40 0.04
10.Vocational track 8,124 0.46 91.5 0.04 0.07 0.0311.College prep. track 8,124 0.59 71.7 0.75 0.62 0.1312.General track 8,124 0.43 70.5 0.20 0.32 0.12SOURCE: U.S. Department of Education, National Center for Education Statistics, National Education Longitudinal Study, 1988(NELS:88); Second Follow-up Student and Teacher Surveys.
Table 4.4B— Comparisons of teacher and student nonresponse rates to NELS:88 items
Percent Teacher Teacher Percent Student StudentOmissions Omission Bias Omissions Omission Bias
Is native language English 20.5 0.14 0.4 0.36Limited English Proficiency 10.0 0.03 22.5 0.04Math classes
Listen to lectures 16.3 0.08 3.3 0.02Use computers 16.8 0.01 3.6 0.01Student discussions 16.9 0.00 3.5 0.06
Science classesTeacher demonstration 10.6 0.01 2.8 0.09Do an experiment 10.6 0.10 2.7 0.08Write reports 10.7 0.06 2.8 0.02Use computers 10.9 0.03 2.7 0.05
Vocational track 10.1 0.03 4.2 0.05College prep. track 10.1 0.05 4.2 0.26General track 10.1 0.03 4.2 0.21SOURCE: U.S. Department of Education, National Center for Education Statistics, National Education Longitudinal Study, 1988(NELS:88); Second Follow-up Student and Teacher Surveys.
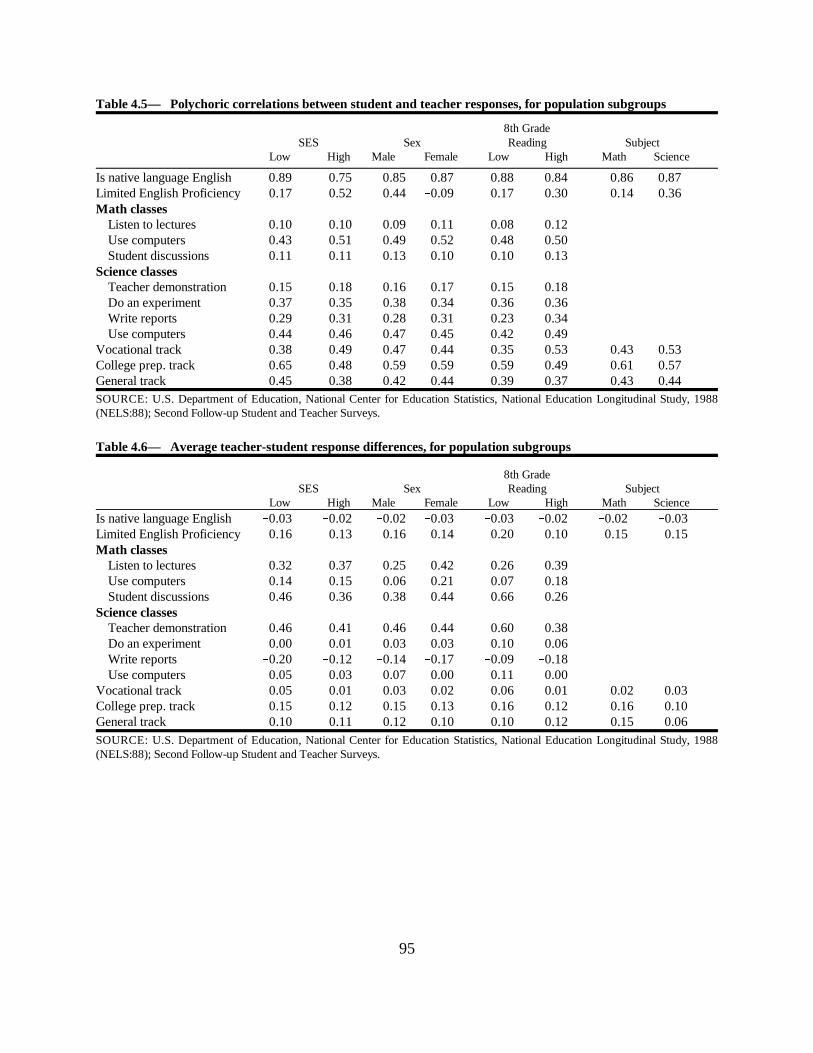
95
Table 4.5— Polychoric correlations between student and teacher responses, for population subgroups
8th Grade SES Sex Reading Subject
Low High Male Female Low High Math Science
Is native language English 0.89 0.75 0.85 0.87 0.88 0.84 0.86 0.87 Limited English Proficiency 0.17 0.52 0.440.09 0.17 0.30 0.14 0.36Math classes
Listen to lectures 0.10 0.10 0.09 0.11 0.08 0.12Use computers 0.43 0.51 0.49 0.52 0.48 0.50Student discussions 0.11 0.11 0.13 0.10 0.10 0.13
Science classesTeacher demonstration 0.15 0.18 0.16 0.17 0.15 0.18Do an experiment 0.37 0.35 0.38 0.34 0.36 0.36Write reports 0.29 0.31 0.28 0.31 0.23 0.34Use computers 0.44 0.46 0.47 0.45 0.42 0.49
Vocational track 0.38 0.49 0.47 0.44 0.35 0.53 0.43 0.53College prep. track 0.65 0.48 0.59 0.59 0.59 0.49 0.61 0.57General track 0.45 0.38 0.42 0.44 0.39 0.37 0.43 0.44SOURCE: U.S. Department of Education, National Center for Education Statistics, National Education Longitudinal Study, 1988(NELS:88); Second Follow-up Student and Teacher Surveys.
Table 4.6— Average teacher-student response differences, for population subgroups
8th Grade SES Sex Reading Subject
Low High Male Female Low High Math ScienceIs native language English 0.03 0.02 0.02 0.03 0.03 0.02 0.02 0.03Limited English Proficiency 0.16 0.13 0.16 0.14 0.20 0.10 0.15 0.15Math classes
Listen to lectures 0.32 0.37 0.25 0.42 0.26 0.39Use computers 0.14 0.15 0.06 0.21 0.07 0.18Student discussions 0.46 0.36 0.38 0.44 0.66 0.26
Science classesTeacher demonstration 0.46 0.41 0.46 0.44 0.60 0.38Do an experiment 0.00 0.01 0.03 0.03 0.10 0.06Write reports 0.20 0.12 0.14 0.17 0.09 0.18Use computers 0.05 0.03 0.07 0.00 0.11 0.00
Vocational track 0.05 0.01 0.03 0.02 0.06 0.01 0.02 0.03College prep. track 0.15 0.12 0.15 0.13 0.16 0.12 0.16 0.10General track 0.10 0.11 0.12 0.10 0.10 0.12 0.15 0.06SOURCE: U.S. Department of Education, National Center for Education Statistics, National Education Longitudinal Study, 1988(NELS:88); Second Follow-up Student and Teacher Surveys.
96
Table 4.7— Percentage of student nonresponse for student-teacher item pairs, for population subgroups
8th Grade SES Sex Reading Subject
Low High Male Female Low High Math Science
Is native language English 0.5 0.3 0.5 0.3 0.7 0.2 0.4 0.4Limited English Proficiency 26.2 15.5 26.9 18.1 29.3 12.7 25.3 18.2Math classes
Listen to lectures 3.1 2.6 3.6 2.9 3.7 2.6Use computers 3.5 2.8 3.6 3.5 4.1 2.9Student discussions 3.4 2.9 3.8 3.2 4.2 2.8
Science classesTeacher demonstration 2.3 2.6 3.0 2.6 3.4 2.5Do an experiment 2.0 2.5 2.9 2.5 3.3 2.4Write reports 2.5 2.5 3.0 2.6 3.4 2.5Use computers 2.0 2.5 2.9 2.5 3.3 2.3
Vocational track 6.8 2.3 4.9 3.5 8.0 1.9 4.3 4.1College prep. track 6.8 2.3 4.9 3.5 8.0 1.9 4.3 4.1General track 6.8 2.3 4.9 3.5 8.0 1.9 4.3 4.1SOURCE: U.S. Department of Education, National Center for Education Statistics, National Education Longitudinal Study, 1988(NELS:88); Second Follow-up Student and Teacher Surveys
Table 4.8— Comparison of significant association of teacher and student measures with selected NELS:88 outcomes
12th Educ. Occu- Course Grade Locus Self-Grade Aspr.& Pation Diffi- Point of Con-Math Expect Expect culty Avg. Control cept
Is native language English + .. T+ T+ T+ S+ .. Limited English Proficiency T T TS+ T .. Math classes
Listen to lectures + + + + S+ S+ .. Use computers + .. .. T+ + T+ .. Student discussions S .. .. T+S S T+ +
Science classesTeacher demonstration .. .. .. .. .. .. .. Do an experimentT+ + T+ .. T+ S+ .. Write reports .. S+ .. .. .. S+ S+ Use computers T+ + + T+ + T+ S+
Vocational track - - - - - - S- College prep. track + + + + + + + General track
Note: “+” and “” refer to the direction of relation, T and S indicate that the relation is significant only for data from that source (teacheror student), and “. .” indicates that no significant relation was found.SOURCE: U.S. Department of Education, National Center for Education Statistics, National Education Longitudinal Study, 1988(NELS:88); Second Followup Student and Teacher Surveys.

97
Chapter 5
Comparison of Second Follow-up Student Responses with Earlier Responses
In efforts to improve education through research, analysts have explored ever-increasinglycomplex models of relations among various measures of student attitudes, behaviors, choices, andperformance. Students’ homework behavior, television-watching, self-esteem, sense of what isimportant, and educational expectations interact in different ways for different students to affectperformance in high school.
In many studies, single-time measures of attitudes, behaviors, and choices are correlated withsingle-time measures of performance. Questions of whether attitudes and behaviors are specific toa particular grade level and whether the age at which they are measured determines whether they arecorrelated with high school performance are rarely considered because the data to address them arerarely available. NELS:88 offers a unique opportunity to address these questions, because similar andoverlapping survey items were administered two or three times to students between eighth andtwelfth grades.
In this chapter, NELS:88 responses at the second follow-up, when most participants were intwelfth grade, are compared to base year (eighth grade) or first follow-up (tenth grade) responseson similar items. These items range from family interactions, including language use and discussions;to personal attitudes and expectations, including self-esteem, locus of control, and occupational andeducational expectations; to behaviors that might be related to performance in school, such astelevision viewing, homework, course selection, and extracurricular activities; and finally, to feelingsabout the student’s school. NELS:88 data are used to determine how stable these items are acrossthe high school years, how response patterns change, and how these measures taken at different timeshave different relations to outcome variables. The stability of NELS:88 cognitive measures acrossyears is discussed in a separate Psychometric Report for the NELS:88 Base Year Through SecondFollow-up (Rock et al. 1995).
Most of the measures examined in this chapter are expected to change between eighth gradeand twelfth grade or between tenth grade and twelfth grade because the teenagers are growing andthe environment around them is changing. Therefore, findings of lack of convergence are notnecessarily a sign that the items were poorly designed or that students misunderstood the items.Discrepancies between the measures only constitute measurement error for analyses that make theassumption that the measures are constant across the four years. The results in this chapter indicatethe extent to which it is reasonable to characterize individual differences among teenagers and theirenvironments as constant traits from eighth to twelfth grades. Can a teenager be characterized as atelevision watcher, as a church goer, as a homework completer, or as having high educational andoccupational expectations, or do different students have these characteristics at eighth, tenth, andtwelfth grades? Do eighth graders who attend schools where they feel that they are unsafe, thatteachers are not interested in students, and that crimes occur feel the same way about their schoolsin twelfth grade?
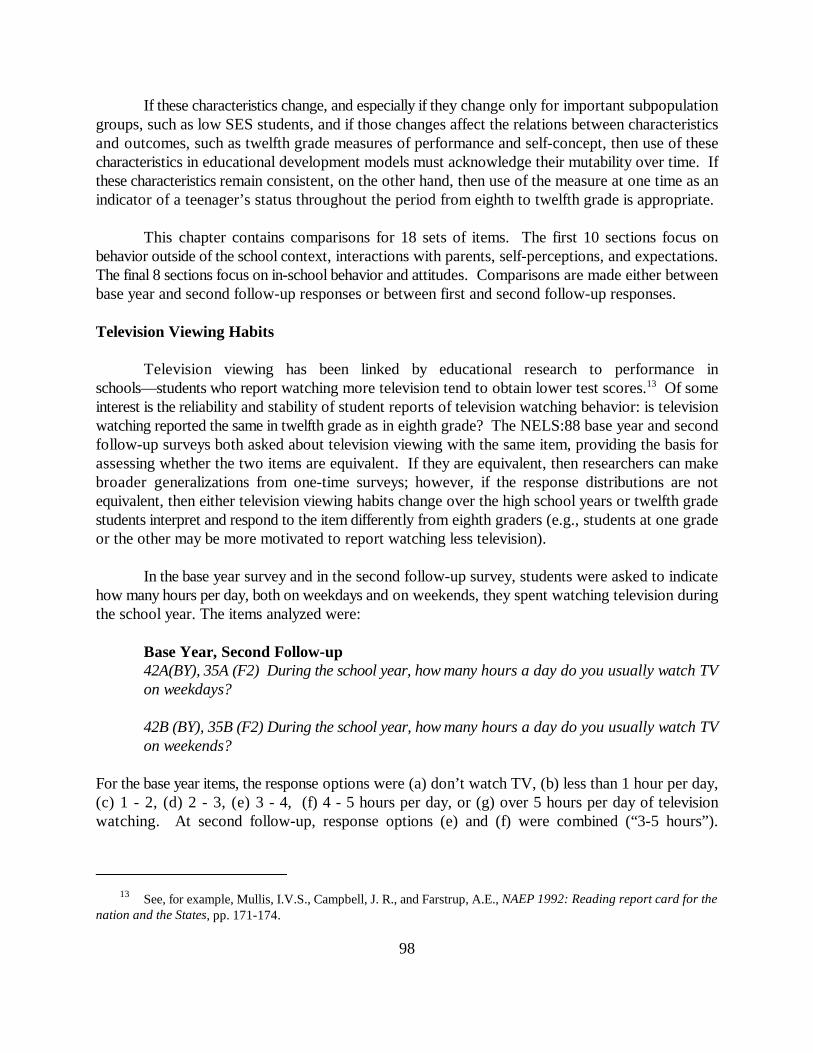
See, for example, Mullis, I.V.S., Campbell, J. R., and Farstrup, A.E., NAEP 1992: Reading report card for the13
nation and the States, pp. 171-174.
98
If these characteristics change, and especially if they change only for important subpopulationgroups, such as low SES students, and if those changes affect the relations between characteristicsand outcomes, such as twelfth grade measures of performance and self-concept, then use of thesecharacteristics in educational development models must acknowledge their mutability over time. Ifthese characteristics remain consistent, on the other hand, then use of the measure at one time as anindicator of a teenager’s status throughout the period from eighth to twelfth grade is appropriate.
This chapter contains comparisons for 18 sets of items. The first 10 sections focus onbehavior outside of the school context, interactions with parents, self-perceptions, and expectations.The final 8 sections focus on in-school behavior and attitudes. Comparisons are made either betweenbase year and second follow-up responses or between first and second follow-up responses.
Television Viewing Habits
Television viewing has been linked by educational research to performance inschools—students who report watching more television tend to obtain lower test scores. Of some13
interest is the reliability and stability of student reports of television watching behavior: is televisionwatching reported the same in twelfth grade as in eighth grade? The NELS:88 base year and secondfollow-up surveys both asked about television viewing with the same item, providing the basis forassessing whether the two items are equivalent. If they are equivalent, then researchers can makebroader generalizations from one-time surveys; however, if the response distributions are notequivalent, then either television viewing habits change over the high school years or twelfth gradestudents interpret and respond to the item differently from eighth graders (e.g., students at one gradeor the other may be more motivated to report watching less television).
In the base year survey and in the second follow-up survey, students were asked to indicatehow many hours per day, both on weekdays and on weekends, they spent watching television duringthe school year. The items analyzed were:
Base Year, Second Follow-up42A(BY), 35A (F2) During the school year, how many hours a day do you usually watch TVon weekdays?
42B (BY), 35B (F2) During the school year, how many hours a day do you usually watch TVon weekends?
For the base year items, the response options were (a) don’t watch TV, (b) less than 1 hour per day,(c) 1 - 2, (d) 2 - 3, (e) 3 - 4, (f) 4 - 5 hours per day, or (g) over 5 hours per day of televisionwatching. At second follow-up, response options (e) and (f) were combined (“3-5 hours”).

Average scaled responses are referred to as “hours” to provide meaning for the comparisons. Although a more14
accurate scaling might subtract .5 from the values, it may be that students perform that subtraction in generating theirresponses.
99
Therefore, for these analyses, base year response options (e) and (f) were combined to produce thesame scale, from 0 to 5, as in the second follow-up.
The results from comparison of students’ responses over the two waves of the survey areshown in Table 5.1A. The polychoric correlations were 0.42 and 0.37 for weekday hours andweekend hours, respectively, indicating only a moderate degree of convergence for students’responses between eighth and twelfth grades; and the raw percentages of matched responses were29.2 percent and 29.8 percent. Students on average reported slightly more hours of TV watching onthe base year survey than they did on the second follow-up survey (3.0 hours versus 2.5 hours on14
weekdays [t=�37.3] and 3.5 hours versus 3.0 hours on weekends [t=�33.1]). Whether the lack ofconvergence and change in mean values indicate changing behavior on the part of students or merelychanging responses to the item, these data suggest that television watching is not a stable traitmeasured over time.
There was a higher level of missing data (approximately 10 percent) from students in the baseyear than at the second follow-up (less than 5 percent) [t=�20.2, �22.0, for weekday and weekendhours], as shown in Table 5.1B. Moreover, the omission bias for the base year was noticeablypositive for both items (0.38 and 0.19); that is, base year nonrespondents tended to report greateramounts of television viewing [t=9.63, 4.79] at the second follow-up than did other students, onaverage. At eighth grade, these nonrespondents may have been avoiding the response of moretelevision watching by omitting the item. Thus, it is unlikely that the drop in average reportedtelevision watching (0.46, in Table 5.1A) is due to differential nonresponse. Moreover, a similaromission bias was not found at the second follow-up, which suggests that if there was a tendency toavoid reporting a large amount of television watching, it was more noticeable at the eighth grade thanat the twelfth grade. Taken together, the results on omissions indicate that the apparent drop intelevision viewing from the base year to the second follow-up was more likely a reflection of actualbehavior, rather than a differential tendency of twelfth graders to avoid saying that they watched agreat deal of television. Table 5.1A— Comparison of second follow-up and base year student responses to items about television viewing
Number of Polychoric Percent Mean Base Year Mean Second 2nd Follow-up - EarlierResponse Pairs Correlation Match Response Follow-up Response Difference
Weekday TV hours 13,233 0.42 29.2 3.00 2.54 0.46Weekend TV hours 12,896 0.37 29.8 3.51 3.05 0.46
SOURCE: U.S. Department of Education, National Center for Education Statistics, National Education Longitudinal Study, 1988(NELS:88); Base Year and Second Follow-up Student Surveys.
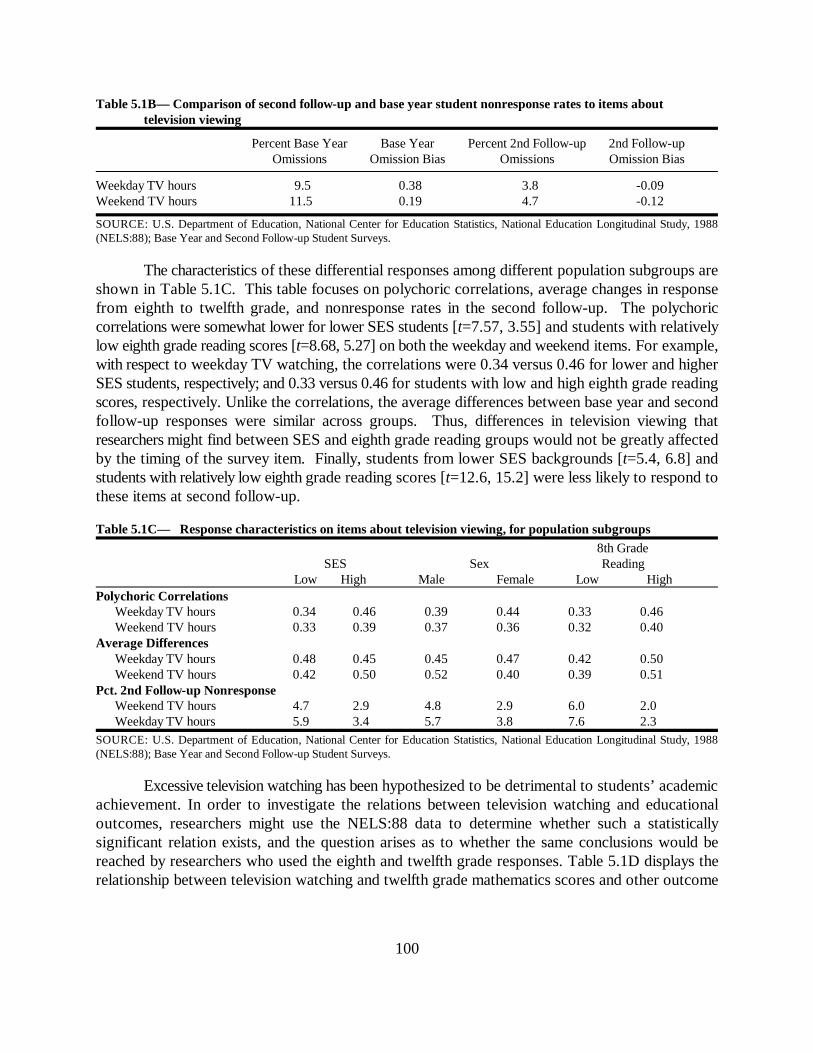
100
Table 5.1B— Comparison of second follow-up and base year student nonresponse rates to items about television viewing
Percent Base Year Base Year Percent 2nd Follow-up 2nd Follow-upOmissions Omission Bias Omissions Omission Bias
Weekday TV hours 9.5 0.38 3.8 -0.09Weekend TV hours 11.5 0.19 4.7 -0.12
SOURCE: U.S. Department of Education, National Center for Education Statistics, National Education Longitudinal Study, 1988(NELS:88); Base Year and Second Follow-up Student Surveys.
The characteristics of these differential responses among different population subgroups areshown in Table 5.1C. This table focuses on polychoric correlations, average changes in responsefrom eighth to twelfth grade, and nonresponse rates in the second follow-up. The polychoriccorrelations were somewhat lower for lower SES students [t=7.57, 3.55] and students with relativelylow eighth grade reading scores [t=8.68, 5.27] on both the weekday and weekend items. For example,with respect to weekday TV watching, the correlations were 0.34 versus 0.46 for lower and higherSES students, respectively; and 0.33 versus 0.46 for students with low and high eighth grade readingscores, respectively. Unlike the correlations, the average differences between base year and secondfollow-up responses were similar across groups. Thus, differences in television viewing thatresearchers might find between SES and eighth grade reading groups would not be greatly affectedby the timing of the survey item. Finally, students from lower SES backgrounds [t=5.4, 6.8] andstudents with relatively low eighth grade reading scores [t=12.6, 15.2] were less likely to respond tothese items at second follow-up.
Table 5.1C— Response characteristics on items about television viewing, for population subgroups
8th GradeSES Sex Reading
Low High Male Female Low HighPolychoric Correlations
Weekday TV hours 0.34 0.46 0.39 0.44 0.33 0.46Weekend TV hours 0.33 0.39 0.37 0.36 0.32 0.40
Average DifferencesWeekday TV hours 0.48 0.45 0.45 0.47 0.42 0.50Weekend TV hours 0.42 0.50 0.52 0.40 0.39 0.51
Pct. 2nd Follow-up NonresponseWeekend TV hours 4.7 2.9 4.8 2.9 6.0 2.0Weekday TV hours 5.9 3.4 5.7 3.8 7.6 2.3
SOURCE: U.S. Department of Education, National Center for Education Statistics, National Education Longitudinal Study, 1988(NELS:88); Base Year and Second Follow-up Student Surveys.
Excessive television watching has been hypothesized to be detrimental to students’ academicachievement. In order to investigate the relations between television watching and educationaloutcomes, researchers might use the NELS:88 data to determine whether such a statisticallysignificant relation exists, and the question arises as to whether the same conclusions would bereached by researchers who used the eighth and twelfth grade responses. Table 5.1D displays therelationship between television watching and twelfth grade mathematics scores and other outcome

A note about twelfth grade enrollment status as an outcome: for the television viewing items, unlike most other15
analyses in this chapter, only student questionnaires were used, not dropout questionnaires, due to differences in thequestionnaires. As a result, although there were a few dropouts (based on the transcript information) who returnedstudent questionnaires, it would be much more difficult to detect a significant effect of these measures at second follow-up on enrollment status than to detect an effect of the base year measures.
101
measures, as measured by weighted t-tests comparing two groups: those who reported watching threeor more hours versus those who reported watching fewer than three hours.
The entries in Table 5.1D and subsequent tables of relations to outcome measures have thefollowing meanings:
B+ base year or first follow-up item has a significant positive relationB base year or first follow-up item has a significant negative relation S+ second follow-up item has a significant positive relationS second follow-up item has a significant negative relation + both items have a significant positive relation both items have a significant negative relation BS+ base year item has a significant negative relation, second follow-up item
has a positive relationB+S base year item has a significant positive relation, second follow-up item
has a negative relation.. neither source shows a significant relation
Table 5.1D— Statistically significant associations of base year and second follow-up student responses abouttelevision viewing with selected NELS:88 outcomes
12th Educ. Occu- Course Grade Locus Self- Enroll-Grade Aspr.& pation Diffi- Point of Con- mentMath Expect Expect culty Avg. Control cept Status
Weekday TV hours (3+) .. (--)Weekend TV hours (3+) S .. .. B+ S .. (--)
(--) Entry not appropriate because no second follow-up dropout questionnaire data were included for television watching.Note: “+” and “-” refer to the direction of relation, B and S indicate that the relation is significant only for data from that source(base year or second follow-up), and “. .” indicates that no significant relation was found.SOURCE: U.S. Department of Education, National Center for Education Statistics, National Education Longitudinal Study, 1988(NELS:88); Base Year and Second Follow-up Student Surveys.
As Table 5.1D shows, the relations between student outcomes and relative high numbers ofhours of television watching on weekdays (three or more hours per day) is consistently negative andsignificant for six of the eight outcome measures. This is true no matter which student response is15
used. However, the story for weekend television watching is different: only one of the outcomemeasures (locus of control) was negatively related to weekend television watching, as measured atthe base year; and one was significantly positively related (curriculum program difficulty). On theother hand, three outcome measures (twelfth grade math scores, grade point average, and locus ofcontrol) were negatively related at the second follow-up. Researchers using the NELS:88 student

102
reports of television watching would find different results if they measured weekend televisionviewing at eighth or twelfth grade.
English Language Competency
English language competency is an important goal of American schools, and its achievementis related both to many contextual factors and to many outcomes. Knowledge about changes in thismeasure between eighth grade and twelfth grade can help researchers interpret results of analyses thatuse the measure at one time or the other. In the base year and second follow-up NELS:88 surveys,students were asked questions about their native language; help received in learning English; how wellthey understood, spoke, read, and wrote English; and about their knowledge of other languages. Theitems analyzed were:
Base Year
17 Before you started going to school, did you speak any language other than English?
18 What was the first language you learned to speak as a child?
27 How well do you (A) understand spoken, (B) speak, (C) read, and (D) write English?(Very well, Pretty well, Well, Not very well)
29 Were you ever enrolled in an English language/language assistance program, thatis, a program for students whose native language is not English?
Second Follow-Up
107 Is English your native language (the first language you learned to speak when youwere a child)?
109 How well do you (A) understand spoken, (B) speak, (C) read, and (D) write English?(Very well, Well, Not well, Not at all)
110A Since the fall of 1989, have you received special help in school in reading, writing,or speaking English?
For this analysis, the two base year items, 17 and 18, were used together to indicate whetherthe student’s native language was English. They were coded “1" for English and “0" for non-Englishfor this analysis, to facilitate interpretation of means as percentages. The ability (“how well?”)responses were scored 4, 3, 2, and 1, respectively. The special help items were scored “2" forreceiving assistance and “1" for no assistance, but for this analysis they are rescored as 1 and 0respectively. The questions on receiving services had different referent periods, which must beconsidered in evaluating differences in responses to the items. Finally, the ability and special help
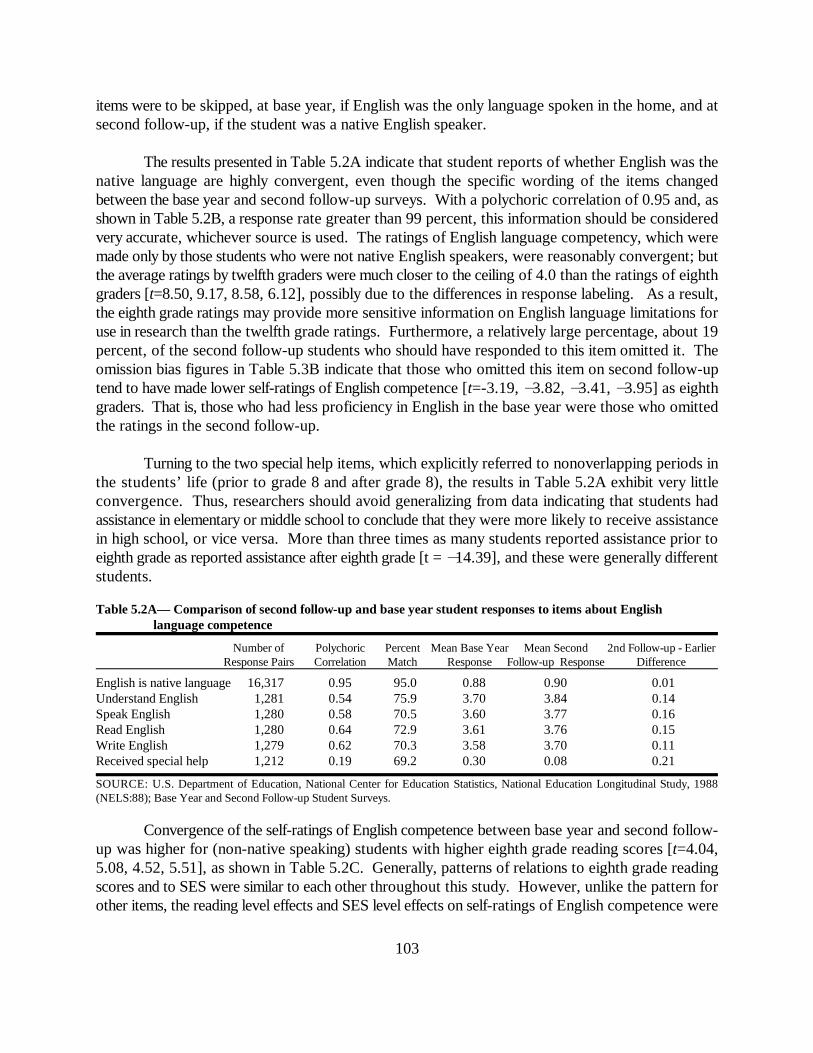
103
items were to be skipped, at base year, if English was the only language spoken in the home, and atsecond follow-up, if the student was a native English speaker.
The results presented in Table 5.2A indicate that student reports of whether English was thenative language are highly convergent, even though the specific wording of the items changedbetween the base year and second follow-up surveys. With a polychoric correlation of 0.95 and, asshown in Table 5.2B, a response rate greater than 99 percent, this information should be consideredvery accurate, whichever source is used. The ratings of English language competency, which weremade only by those students who were not native English speakers, were reasonably convergent; butthe average ratings by twelfth graders were much closer to the ceiling of 4.0 than the ratings of eighthgraders [t=8.50, 9.17, 8.58, 6.12], possibly due to the differences in response labeling. As a result,the eighth grade ratings may provide more sensitive information on English language limitations foruse in research than the twelfth grade ratings. Furthermore, a relatively large percentage, about 19percent, of the second follow-up students who should have responded to this item omitted it. Theomission bias figures in Table 5.3B indicate that those who omitted this item on second follow-uptend to have made lower self-ratings of English competence [t=-3.19, 3.82, 3.41, 3.95] as eighthgraders. That is, those who had less proficiency in English in the base year were those who omittedthe ratings in the second follow-up.
Turning to the two special help items, which explicitly referred to nonoverlapping periods inthe students’ life (prior to grade 8 and after grade 8), the results in Table 5.2A exhibit very littleconvergence. Thus, researchers should avoid generalizing from data indicating that students hadassistance in elementary or middle school to conclude that they were more likely to receive assistancein high school, or vice versa. More than three times as many students reported assistance prior toeighth grade as reported assistance after eighth grade [t = 14.39], and these were generally differentstudents.
Table 5.2A— Comparison of second follow-up and base year student responses to items about English language competence
Number of Polychoric Percent Mean Base Year Mean Second 2nd Follow-up - EarlierResponse Pairs Correlation Match Response Follow-up Response Difference
English is native language 16,317 0.95 95.0 0.88 0.90 0.01Understand English 1,281 0.54 75.9 3.70 3.84 0.14Speak English 1,280 0.58 70.5 3.60 3.77 0.16Read English 1,280 0.64 72.9 3.61 3.76 0.15Write English 1,279 0.62 70.3 3.58 3.70 0.11Received special help 1,212 0.19 69.2 0.30 0.08 0.21
SOURCE: U.S. Department of Education, National Center for Education Statistics, National Education Longitudinal Study, 1988(NELS:88); Base Year and Second Follow-up Student Surveys.
Convergence of the self-ratings of English competence between base year and second follow-up was higher for (non-native speaking) students with higher eighth grade reading scores [t=4.04,5.08, 4.52, 5.51], as shown in Table 5.2C. Generally, patterns of relations to eighth grade readingscores and to SES were similar to each other throughout this study. However, unlike the pattern forother items, the reading level effects and SES level effects on self-ratings of English competence were
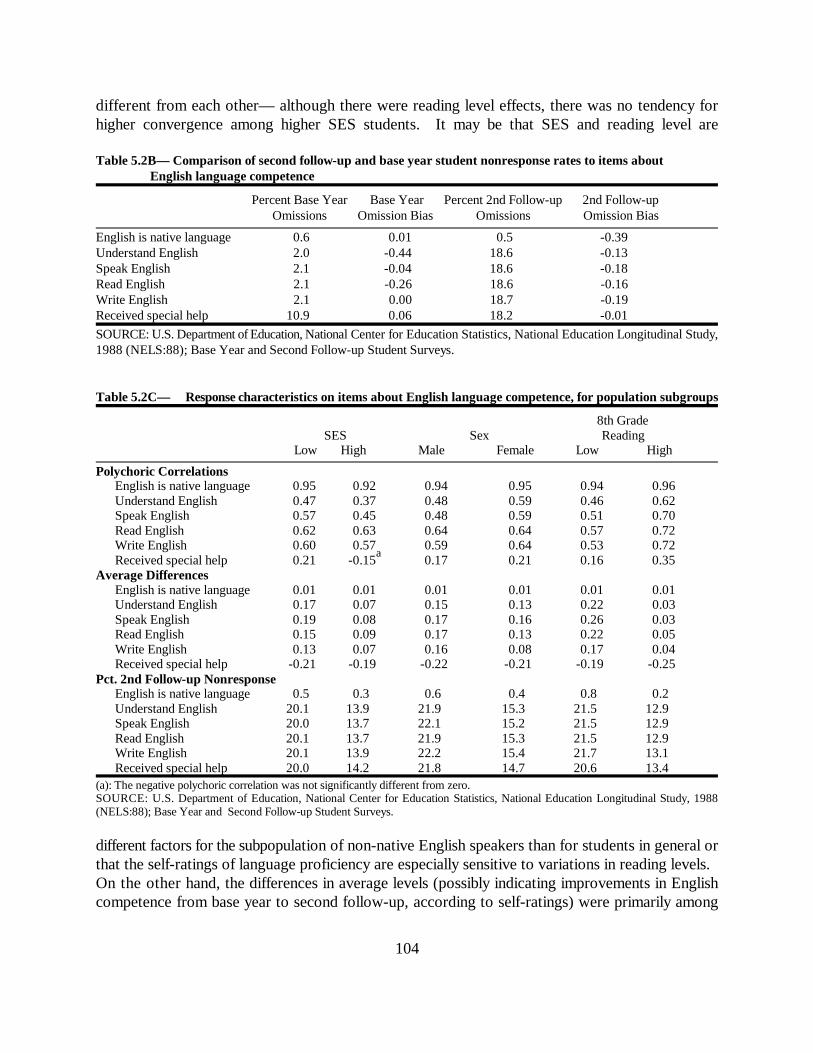
104
different from each other— although there were reading level effects, there was no tendency forhigher convergence among higher SES students. It may be that SES and reading level are
Table 5.2B— Comparison of second follow-up and base year student nonresponse rates to items about English language competence
Percent Base Year Base Year Percent 2nd Follow-up 2nd Follow-upOmissions Omission Bias Omissions Omission Bias
English is native language 0.6 0.01 0.5 -0.39Understand English 2.0 -0.44 18.6 -0.13Speak English 2.1 -0.04 18.6 -0.18Read English 2.1 -0.26 18.6 -0.16Write English 2.1 0.00 18.7 -0.19Received special help 10.9 0.06 18.2 -0.01
SOURCE: U.S. Department of Education, National Center for Education Statistics, National Education Longitudinal Study,1988 (NELS:88); Base Year and Second Follow-up Student Surveys.
Table 5.2C— Response characteristics on items about English language competence, for population subgroups
8th GradeSES Sex Reading
Low High Male Female Low High
Polychoric CorrelationsEnglish is native language 0.95 0.92 0.94 0.95 0.94 0.96Understand English 0.47 0.37 0.48 0.59 0.46 0.62Speak English 0.57 0.45 0.48 0.59 0.51 0.70Read English 0.62 0.63 0.64 0.64 0.57 0.72Write English 0.60 0.57 0.59 0.64 0.53 0.72Received special help 0.21 -0.15 0.17 0.21 0.16 0.35
a
Average DifferencesEnglish is native language 0.01 0.01 0.01 0.01 0.01 0.01Understand English 0.17 0.07 0.15 0.13 0.22 0.03Speak English 0.19 0.08 0.17 0.16 0.26 0.03Read English 0.15 0.09 0.17 0.13 0.22 0.05Write English 0.13 0.07 0.16 0.08 0.17 0.04Received special help -0.21 -0.19 -0.22 -0.21 -0.19 -0.25
Pct. 2nd Follow-up NonresponseEnglish is native language 0.5 0.3 0.6 0.4 0.8 0.2Understand English 20.1 13.9 21.9 15.3 21.5 12.9Speak English 20.0 13.7 22.1 15.2 21.5 12.9Read English 20.1 13.7 21.9 15.3 21.5 12.9Write English 20.1 13.9 22.2 15.4 21.7 13.1Received special help 20.0 14.2 21.8 14.7 20.6 13.4
(a): The negative polychoric correlation was not significantly different from zero.SOURCE: U.S. Department of Education, National Center for Education Statistics, National Education Longitudinal Study, 1988(NELS:88); Base Year and Second Follow-up Student Surveys.
different factors for the subpopulation of non-native English speakers than for students in general orthat the self-ratings of language proficiency are especially sensitive to variations in reading levels. On the other hand, the differences in average levels (possibly indicating improvements in Englishcompetence from base year to second follow-up, according to self-ratings) were primarily among
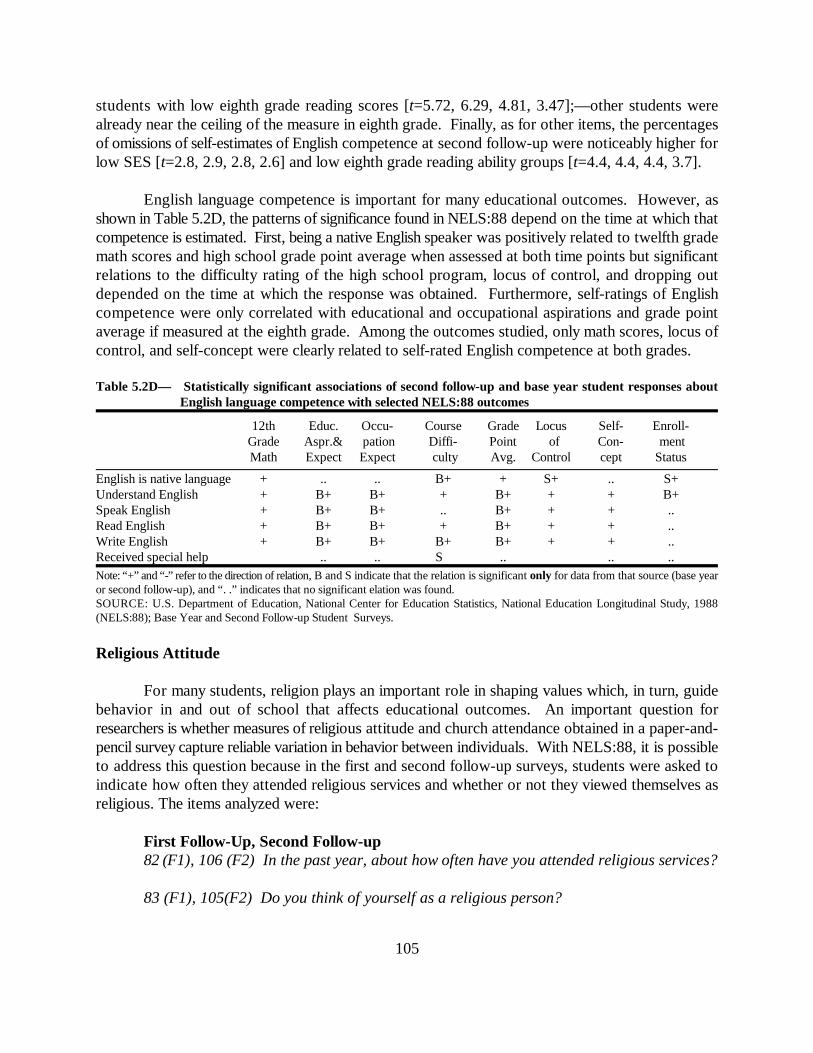
105
students with low eighth grade reading scores [t=5.72, 6.29, 4.81, 3.47];—other students werealready near the ceiling of the measure in eighth grade. Finally, as for other items, the percentagesof omissions of self-estimates of English competence at second follow-up were noticeably higher forlow SES [t=2.8, 2.9, 2.8, 2.6] and low eighth grade reading ability groups [t=4.4, 4.4, 4.4, 3.7].
English language competence is important for many educational outcomes. However, asshown in Table 5.2D, the patterns of significance found in NELS:88 depend on the time at which thatcompetence is estimated. First, being a native English speaker was positively related to twelfth grademath scores and high school grade point average when assessed at both time points but significantrelations to the difficulty rating of the high school program, locus of control, and dropping outdepended on the time at which the response was obtained. Furthermore, self-ratings of Englishcompetence were only correlated with educational and occupational aspirations and grade pointaverage if measured at the eighth grade. Among the outcomes studied, only math scores, locus ofcontrol, and self-concept were clearly related to self-rated English competence at both grades.
Table 5.2D— Statistically significant associations of second follow-up and base year student responses about English language competence with selected NELS:88 outcomes
12th Educ. Occu- Course Grade Locus Self- Enroll-Grade Aspr.& pation Diffi- Point of Con- mentMath Expect Expect culty Avg. Control cept Status
English is native language + .. .. B+ + S+ .. S+Understand English + B+ B+ + B+ + + B+Speak English + B+ B+ .. B+ + + ..Read English + B+ B+ + B+ + + ..Write English + B+ B+ B+ B+ + + ..Received special help .. .. S .. .. ..Note: “+” and “-” refer to the direction of relation, B and S indicate that the relation is significant only for data from that source (base yearor second follow-up), and “. .” indicates that no significant elation was found.SOURCE: U.S. Department of Education, National Center for Education Statistics, National Education Longitudinal Study, 1988(NELS:88); Base Year and Second Follow-up Student Surveys.
Religious Attitude
For many students, religion plays an important role in shaping values which, in turn, guidebehavior in and out of school that affects educational outcomes. An important question forresearchers is whether measures of religious attitude and church attendance obtained in a paper-and-pencil survey capture reliable variation in behavior between individuals. With NELS:88, it is possibleto address this question because in the first and second follow-up surveys, students were asked toindicate how often they attended religious services and whether or not they viewed themselves asreligious. The items analyzed were:
First Follow-Up, Second Follow-up82 (F1), 106 (F2) In the past year, about how often have you attended religious services?
83 (F1), 105(F2) Do you think of yourself as a religious person?

106
In both surveys, students were given six choices regarding attendance at religious services, rangingfrom (1) “more than once per week” to (6) “not at all”. With respect to being a religious person,students could respond (1) “very,” (2) “somewhat,” or (3) “not at all.” For both items, the scaleswere reversed before conducting the analyses.
As shown in Table 5.3A, the polychoric correlations for both items were 0.71, which showsfairly strong agreement in students’ responses between tenth grade and twelfth grade, whether thequestion is couched as a self-image rating or as a report of frequency of behavior. The rate ofmatches for the religious self-image question was higher (68.9 percent) than for the attendancequestion (46.9 percent), but this was due to the difference in number of response options (3 versus6). Although the two items had similar convergence, the average response to the question aboutattendance changed between tenth and twelfth grades (from 3.53 to 3.22 [t=�24.5]), while theaverage response to the self-image question remained stable (1.83 and 1.82).
Table 5.3A— Comparison of first and second follow-up student responses to items about religious attitudes
Number of Polychoric Percent Mean First Mean Second 2nd Follow-up -Earlier
Response Pairs Correlation Match Follow -Up Response Follow-up Response Difference
Religious person 13,625 0.71 68.9 1.83 1.82 0.02Attending services 13,612 0.71 46.9 3.53 3.22 0.31
SOURCE: U.S. Department of Education, National Center for Education Statistics, National Education Longitudinal Study, 1988(NELS:88); First and Second Follow-up Student Surveys.
A noticeable percentage of students in both surveys did not respond to either item (Table5.3B). Data from students in the first follow-up were not available for about 7 percent of the casesfor each item; and data from students in the second follow-up were not available for about 12 percent[t=17.26, 18.15]. Although there was very little omission bias in the twelfth grade items, those whoomitted the question about attending services in tenth grade were likely at twelfth grade to indicateslightly less attendance, on average, than other students (a difference of 0.14) [t=-2.19].
Table 5.3B— Comparison of first and second follow-up student nonresponse rates to items about religious attitudes
Percent Earlier First Follow-up Percent 2nd Follow-up 2nd Follow-upOmissions Omission Bias Omissions Omission Bias
Religious person 6.9 0.01 12.5 0.00Attending services 6.8 0.14 12.7 0.03
SOURCE: U.S. Department of Education, National Center for Education Statistics, National Education Longitudinal Study, 1988(NELS:88); First and Second Follow-up Student Surveys.
Comparisons of the responses among different subgroups of students are shown in Table5.3C. The polychoric correlations on both items are fairly high across subgroups, although they arehighest for high SES students [t=10.4, 11.4] and students with relatively high eighth grade readingscores [t=13.8, 15.4]. Otherwise, there are no substantial differences in responses between the
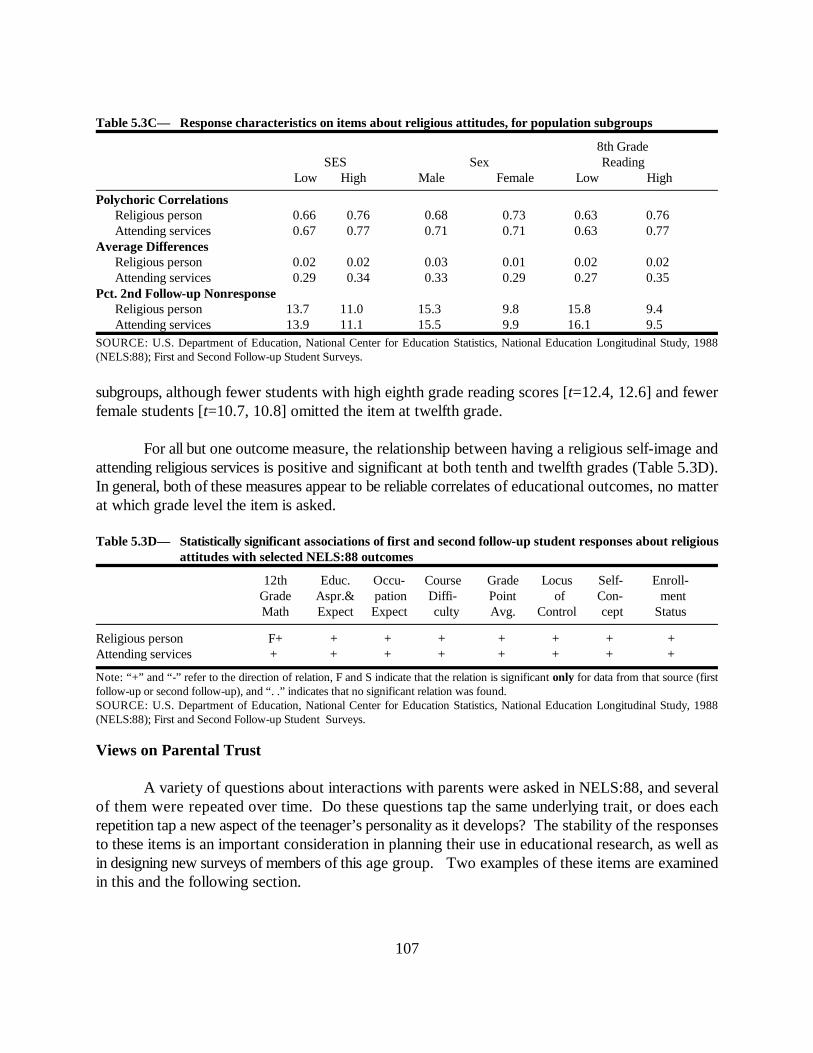
107
Table 5.3C— Response characteristics on items about religious attitudes, for population subgroups
8th GradeSES Sex Reading
Low High Male Female Low High
Polychoric CorrelationsReligious person 0.66 0.76 0.68 0.73 0.63 0.76Attending services 0.67 0.77 0.71 0.71 0.63 0.77
Average DifferencesReligious person 0.02 0.02 0.03 0.01 0.02 0.02Attending services 0.29 0.34 0.33 0.29 0.27 0.35
Pct. 2nd Follow-up NonresponseReligious person 13.7 11.0 15.3 9.8 15.8 9.4Attending services 13.9 11.1 15.5 9.9 16.1 9.5
SOURCE: U.S. Department of Education, National Center for Education Statistics, National Education Longitudinal Study, 1988(NELS:88); First and Second Follow-up Student Surveys.
subgroups, although fewer students with high eighth grade reading scores [t=12.4, 12.6] and fewerfemale students [t=10.7, 10.8] omitted the item at twelfth grade.
For all but one outcome measure, the relationship between having a religious self-image andattending religious services is positive and significant at both tenth and twelfth grades (Table 5.3D).In general, both of these measures appear to be reliable correlates of educational outcomes, no matterat which grade level the item is asked.
Table 5.3D— Statistically significant associations of first and second follow-up student responses about religiousattitudes with selected NELS:88 outcomes
12th Educ. Occu- Course Grade Locus Self- Enroll-Grade Aspr.& pation Diffi- Point of Con- mentMath Expect Expect culty Avg. Control cept Status
Religious person F+ + + + + + + + Attending services + + + + + + + +
Note: “+” and “-” refer to the direction of relation, F and S indicate that the relation is significant only for data from that source (firstfollow-up or second follow-up), and “. .” indicates that no significant relation was found.SOURCE: U.S. Department of Education, National Center for Education Statistics, National Education Longitudinal Study, 1988(NELS:88); First and Second Follow-up Student Surveys.
Views on Parental Trust
A variety of questions about interactions with parents were asked in NELS:88, and severalof them were repeated over time. Do these questions tap the same underlying trait, or does eachrepetition tap a new aspect of the teenager’s personality as it develops? The stability of the responsesto these items is an important consideration in planning their use in educational research, as well asin designing new surveys of members of this age group. Two examples of these items are examinedin this and the following section.

108
In the base year survey and in the second follow-up survey, students were asked to indicatethe extent to which three statements about their relationships with their parents were true. Thestatements were as follows:
Base Year 39 . Are the following statements mostly true for you and your parents or mostly false
for you and your parents?
Second Follow-up 100 How true are the following statements for you and your parent(s)/guardian(s)?
A. My parents trust me to do what they expect without checking up on me. B. I often do not know WHY I am supposed to do what my parents tell me to do. C. I often count on my parents to solve many of my problems.
In the base year survey, students could respond in one of two ways, true or false. For thisanalysis, true is coded as 1, false as 0; and data for statement B are reversed, so that all three itemsare scored in a positive direction. In the second follow-up, students were given a choice based on a6-point scale, ranging from “true” to “false”. In order to make comparisons, the second follow-up6-point scale was collapsed to a 2-point scale (1, 2, 3 vs. 4, 5, 6) to correspond to the base year scale.
Comparisons of student responses over the two waves of the survey are shown in Table 5.4A.The polychoric correlations (0.30, 0.25, and 0.31 for statements A, B, and C, respectively) indicatea low level of convergence. It is of some interest that a substantial majority of students respondedwith a positive attitude about parents for the first two of the items (87 and 74 percent, at secondfollow-up) but disagreed with it for the other item (only 19 percent agreed). This is a positiveindicator that students were responding to each item independently, not as repeated, redundantquestions about their relations with their parents.
Also, for two of the items, the percentage of students responding “false” changed littlebetween eighth and twelfth grades, but for the question about parents “checking up,” the percentageof students responding “false” dropped from 20 percent to 13 percent (i.e., the mean responsechanged from .80 to .87) [t=17.64]. In the second follow-up, more students on average believed thattheir parents trusted them to do what they [their parents] expected, without checking up. One mightsuppose that this is an indicator of growth on the personal characteristic tapped by this item, but thelow correlation (0.31) suggests that growth is not a reliable measure at the individual level: manystudents changed from “false” to “true,” but many also changed from “true” to “false”.

109
Table 5.4A— Comparison of second follow-up and base year student responses to items about views on parental trust
Number of Polychoric Percent Mean Base Year Mean 2nd Follow-up-EarlierResponse Pairs Correlation Match Response Follow-up Response Difference
Do what is expected 13,201 0.30 76.3 0.80 0.87 0.07Aware of parental reasons 13,108 0.25 66.3 0.73 0.74 0.01Parents solve problems 13,083 0.31 73.5 0.21 0.19 0.02
SOURCE: U.S. Department of Education, National Center for Education Statistics, National Education Longitudinal Study, 1988(NELS:88); Base Year and Second Follow-up Student Surveys.
Although student nonresponse on these items in the base year was very low, studentnonresponse in the second follow-up survey was very high [t=58.0, 58.1, 57.1]. Nearly 20 percentof teenagers omitted these items in the twelfth grade survey (Table 5.4B). Fortunately, for the useof these items in research, the data indicate that second follow-up respondents who omitted the itemwere not very different from others, as measured by their base year responses to these items [t=�1.69,�2.79, 4.88]. The tendency for nonrespondents to have indicated earlier that they counted on parentsto solve their problems, although statistically significant, was only 4 percent greater than thecorresponding likelihood for respondents.
Table 5.4B— Comparison of second follow-up and base year student nonresponse rates to items about viewson parental trust
Percent Base Year Base Year Percent 2nd Follow-up 2nd Follow-upOmissions Omission Bias Omissions Omission Bias
Do what is expected 0.9 0.02 19.2 0.01Aware of parental reasons 1.1 0.05 19.7 0.02Parents solve problems 1.3 0.06 19.7 0.04
SOURCE: U.S. Department of Education, National Center for Education Statistics, National Education Longitudinal Study, 1988(NELS:88); Base Year and Second Follow-up Student Surveys.
Levels of convergence between base year and second follow-ups differed somewhat acrosspopulation subgroups, as shown in Table 5.4C. However, the convergence was low in all of thesubgroups shown in the table. With respect to average differences in student responses between thetwo surveys, there was a small but noticeable trend for the item concerning awareness of parents’reasons for telling them what to do; increases from 3 to 4 percent occurred among high SES [t=3.71],high reading ability [t=3.63], and female respondents [t=4.99], compared to no increases for otherrespondents.
Similar to other items with substantial numbers of omissions, omission rates for all three ofthese items at second follow-up were related to subgroups. High SES [t=9.7, 9.8, 9.8], high eighthgrade reading level [t=18.4, 18.4, 18.4], and female teenagers [t=6.5, 6.6, 6.8] omitted the items lessfrequently than students in the other subgroups.
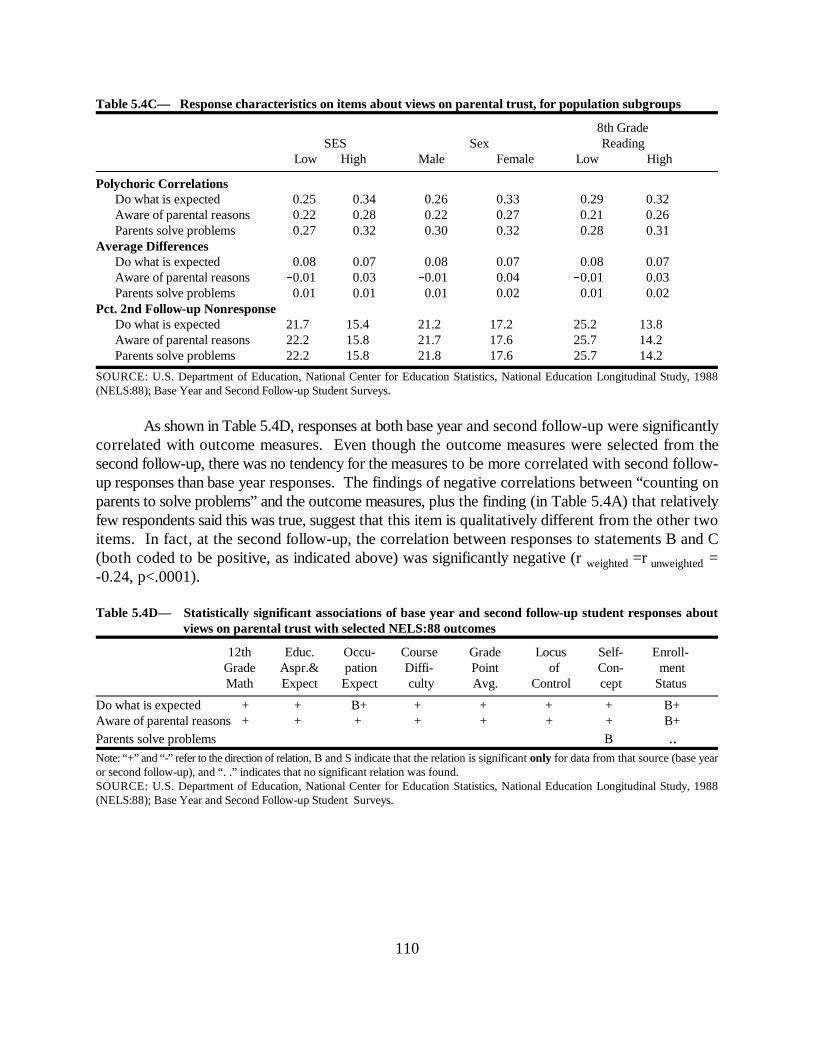
110
Table 5.4C— Response characteristics on items about views on parental trust, for population subgroups
8th GradeSES Sex Reading
Low High Male Female Low High
Polychoric CorrelationsDo what is expected 0.25 0.34 0.26 0.33 0.29 0.32Aware of parental reasons 0.22 0.28 0.22 0.27 0.21 0.26Parents solve problems 0.27 0.32 0.30 0.32 0.28 0.31
Average DifferencesDo what is expected 0.08 0.07 0.08 0.07 0.08 0.07Aware of parental reasons 0.01 0.03 0.01 0.04 0.01 0.03Parents solve problems 0.01 0.01 0.01 0.02 0.01 0.02
Pct. 2nd Follow-up NonresponseDo what is expected 21.7 15.4 21.2 17.2 25.2 13.8Aware of parental reasons 22.2 15.8 21.7 17.6 25.7 14.2Parents solve problems 22.2 15.8 21.8 17.6 25.7 14.2
SOURCE: U.S. Department of Education, National Center for Education Statistics, National Education Longitudinal Study, 1988(NELS:88); Base Year and Second Follow-up Student Surveys.
As shown in Table 5.4D, responses at both base year and second follow-up were significantlycorrelated with outcome measures. Even though the outcome measures were selected from thesecond follow-up, there was no tendency for the measures to be more correlated with second follow-up responses than base year responses. The findings of negative correlations between “counting onparents to solve problems” and the outcome measures, plus the finding (in Table 5.4A) that relativelyfew respondents said this was true, suggest that this item is qualitatively different from the other twoitems. In fact, at the second follow-up, the correlation between responses to statements B and C(both coded to be positive, as indicated above) was significantly negative (r =r =weighted unweighted-0.24, p<.0001).
Table 5.4D— Statistically significant associations of base year and second follow-up student responses about views on parental trust with selected NELS:88 outcomes
12th Educ. Occu- Course Grade Locus Self- Enroll-Grade Aspr.& pation Diffi- Point of Con- mentMath Expect Expect culty Avg. Control cept Status
Do what is expected + + B+ + + + + B+Aware of parental reasons + + + + + + + B+Parents solve problems B ..Note: “+” and “-” refer to the direction of relation, B and S indicate that the relation is significant only for data from that source (base yearor second follow-up), and “. .” indicates that no significant relation was found.SOURCE: U.S. Department of Education, National Center for Education Statistics, National Education Longitudinal Study, 1988(NELS:88); Base Year and Second Follow-up Student Surveys.

111
Discussions with Parents
The other item concerning interactions with parents asked for recall of the frequency ofdiscussions on school-related topics. In the base year survey and in the first and second follow-upsurveys, students were asked how often they had discussed certain topics with either or both of theirparents or guardians. The question in the base year survey asked how often the students haddiscussed the topics “since the beginning of the school year,” with response options of “not at all,”“once or twice,” or “three or more times.” The question in the first follow-up survey asked thestudents to indicate how frequently they had discussed these topics “in the first half of the schoolyear;” and the question in the second follow-up survey asked how frequently this had occurred “inthe first semester or term of the school year.” Both follow-up items had response options of “never,”“sometimes,” and “often.”
The topics were as follows:
Base Year36 A. Selecting courses or programs at school.
B. School activities or events of particular interest to you. C. Things you’ve studied in class.
First Follow-Up, Second Follow-up105 (F1), (99) (F2)
A. Selecting courses or programs at school.B. School activities or events of particular interest to you.C. Things you’ve studied in class.D. Your grades.
The polychoric correlations, shown in Table 5.5A, indicate a low level of convergencebetween the base year and second follow-up, similar to the levels seen in the preceding section. Inthis case, however, an additional potential source of divergence is the change of schools that tookplace for virtually all of the students between the two surveys (i.e., from middle school to highschool). The convergence between tenth and twelfth grade measures was somewhat higher, althoughit can still only be called moderate. Unfortunately, because the response options were different forthe base year, it is impossible to determine whether the difference in convergence levels is related towording changes or to the fact that there was a change in the frequency of discussions with parentsbetween eighth grade and tenth grade but not between tenth grade and twelfth grade. On the otherhand, the large mean differences [t=�56.7, 76.0, 67.2] shown in Table 5.5A between base year andfollow-up are probably due to the change in wording: many would interpret “sometimes” to includepart of the region referred to by “three or more times.” The average changes between first andsecond follow-up were relatively small, although taken together they indicate slightly less frequentconversations with parents about school at the twelfth grade [t=�24.95, �11.12, �6.95, �16.40].

112
Table 5.5A— Comparison of second follow-up and earlier student responses to items about discussions with parents
Number of Polychoric Percent Mean Earlier Mean Second 2nd Follow-up -EarlierResponse Pairs Correlation Match Response Follow-up Response Difference
vs Base Year Courses 12,964 0.25 41.7 2.31 1.90 0.41 School events 12,971 0.32 39.0 2.55 2.01 0.54 Class topics 12,937 0.33 40.3 2.47 1.99 0.47vs First Follow-up Courses 12,199 0.43 56.6 2.06 1.90 0.16 School events 12,169 0.46 54.5 2.10 2.02 0.08 Class topics 12,142 0.48 58.6 2.05 2.00 0.04 Grades 12,111 0.40 57.7 2.44 2.33 0.11SOURCE: U.S. Department of Education, National Center for Education Statistics, National Education Longitudinal Study, 1988(NELS:88); Base Year and First and Second Follow-up Student Surveys.
As shown in Table 5.5B, there were substantial percentages of omissions of these items at thefirst (9 percent) and second (12 percent) follow-ups. With the exception of discussions about grades,those who omitted the items on the second follow-up tended to have indicated fewer conversationswith parents when they responded to the base year or other follow-up survey than other students did[t (second follow-up)=�5.44, �8.15, �5.23, �3.33,�3.04, �2.95,�0.76]. Therefore, estimates offrequency based only on respondents are probably slight overestimates.
There were no substantial subpopulation differences in either convergence or mean level ofresponse, as shown in Table 5.5C. There were, however, noticeable variations in tendency to omitthe item. Fewer students from high SES households [seven t’s ranged from 6.1 to 6.7], students withhigh eighth grade reading scores [seven t’s ranged from 14.3 to 15.3], and female students [seven t’sranged from 9.7 to 10.0] omitted the item than other students.
Table 5.5B— Comparison of second follow-up and earlier student nonresponse rates to items about discussions with parents
Percent Earlier Earlier Percent 2nd Follow-up 2nd Follow-upOmissions Omission Bias Omissions Omission Bias
vs Base Year Courses 1.6 0.10 12.4 0.09 School events 1.3 0.11 12.5 0.13 Class topics 1.4 0.06 12.7 0.09vs First Follow-up Courses 8.8 0.04 12.4 0.06 School events 8.9 0.10 12.5 0.06 Class topics 8.9 0.09 12.7 0.05 Grades 8.9 0.05 12.9 0.01
SOURCE: U.S. Department of Education, National Center for Education Statistics, National Education Longitudinal Study, 1988(NELS:88); Base Year and First and Second Follow-up Student Surveys.
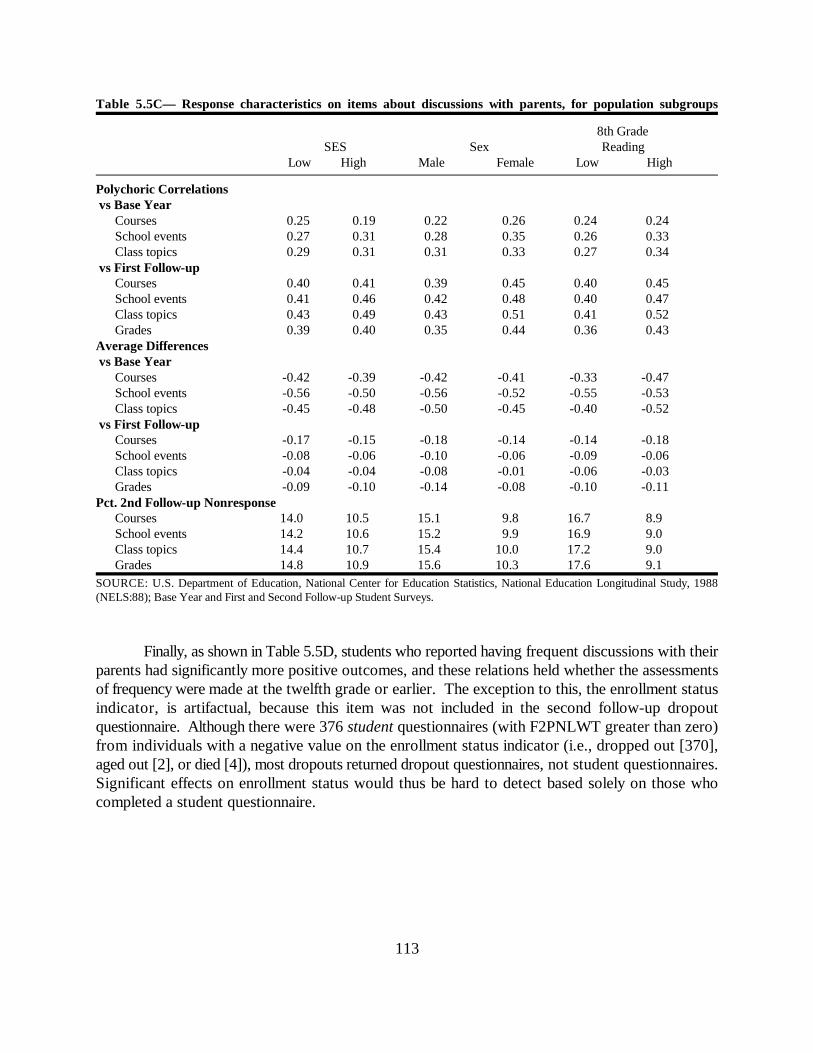
113
Table 5.5C— Response characteristics on items about discussions with parents, for population subgroups
8th GradeSES Sex Reading
Low High Male Female Low High
Polychoric Correlations vs Base Year Courses 0.25 0.19 0.22 0.26 0.24 0.24
School events 0.27 0.31 0.28 0.35 0.26 0.33Class topics 0.29 0.31 0.31 0.33 0.27 0.34
vs First Follow-upCourses 0.40 0.41 0.39 0.45 0.40 0.45School events 0.41 0.46 0.42 0.48 0.40 0.47Class topics 0.43 0.49 0.43 0.51 0.41 0.52Grades 0.39 0.40 0.35 0.44 0.36 0.43
Average Differences vs Base Year
Courses -0.42 -0.39 -0.42 -0.41 -0.33 -0.47School events -0.56 -0.50 -0.56 -0.52 -0.55 -0.53Class topics -0.45 -0.48 -0.50 -0.45 -0.40 -0.52
vs First Follow-upCourses -0.17 -0.15 -0.18 -0.14 -0.14 -0.18School events -0.08 -0.06 -0.10 -0.06 -0.09 -0.06Class topics -0.04 -0.04 -0.08 -0.01 -0.06 -0.03Grades -0.09 -0.10 -0.14 -0.08 -0.10 -0.11
Pct. 2nd Follow-up NonresponseCourses 14.0 10.5 15.1 9.8 16.7 8.9School events 14.2 10.6 15.2 9.9 16.9 9.0Class topics 14.4 10.7 15.4 10.0 17.2 9.0Grades 14.8 10.9 15.6 10.3 17.6 9.1
SOURCE: U.S. Department of Education, National Center for Education Statistics, National Education Longitudinal Study, 1988(NELS:88); Base Year and First and Second Follow-up Student Surveys.
Finally, as shown in Table 5.5D, students who reported having frequent discussions with theirparents had significantly more positive outcomes, and these relations held whether the assessmentsof frequency were made at the twelfth grade or earlier. The exception to this, the enrollment statusindicator, is artifactual, because this item was not included in the second follow-up dropoutquestionnaire. Although there were 376 student questionnaires (with F2PNLWT greater than zero)from individuals with a negative value on the enrollment status indicator (i.e., dropped out [370],aged out [2], or died [4]), most dropouts returned dropout questionnaires, not student questionnaires.Significant effects on enrollment status would thus be hard to detect based solely on those whocompleted a student questionnaire.
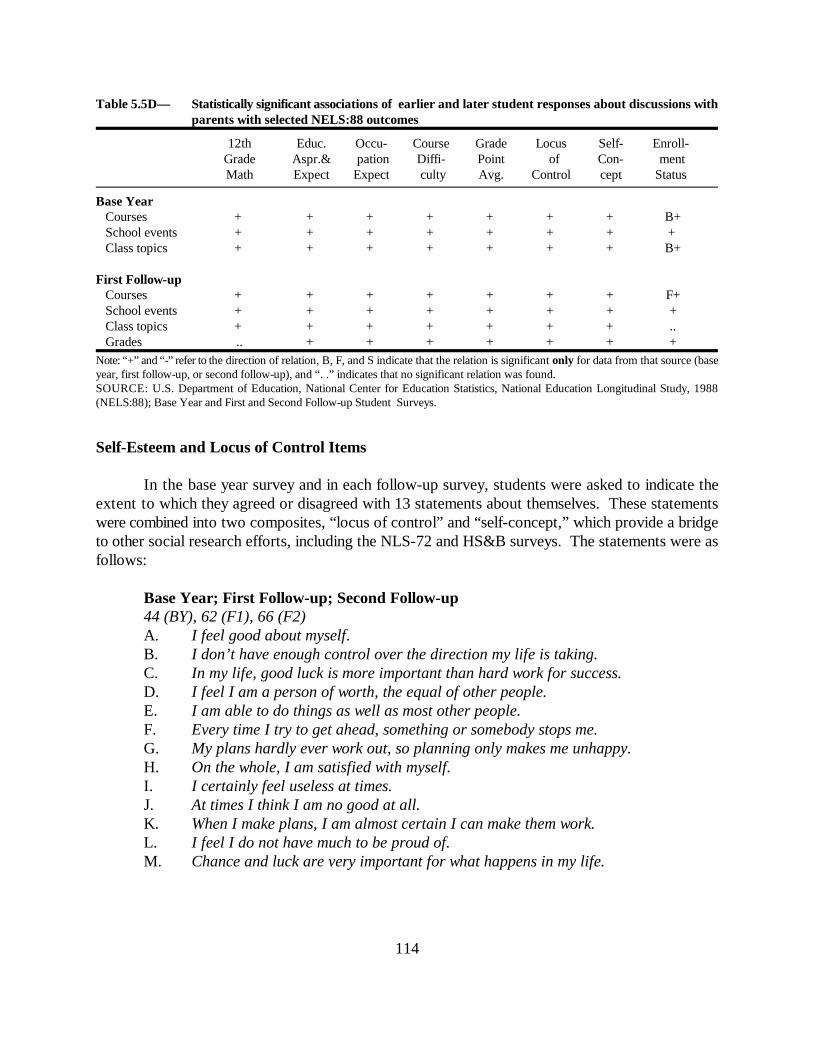
114
Table 5.5D— Statistically significant associations of earlier and later student responses about discussions withparents with selected NELS:88 outcomes
12th Educ. Occu- Course Grade Locus Self- Enroll-Grade Aspr.& pation Diffi- Point of Con- mentMath Expect Expect culty Avg. Control cept Status
Base Year Courses + + + + + + + B+ School events + + + + + + + + Class topics + + + + + + + B+
First Follow-up Courses + + + + + + + F+ School events + + + + + + + + Class topics + + + + + + + .. Grades .. + + + + + + +Note: “+” and “-” refer to the direction of relation, B, F, and S indicate that the relation is significant only for data from that source (baseyear, first follow-up, or second follow-up), and “. .” indicates that no significant relation was found.SOURCE: U.S. Department of Education, National Center for Education Statistics, National Education Longitudinal Study, 1988(NELS:88); Base Year and First and Second Follow-up Student Surveys.
Self-Esteem and Locus of Control Items
In the base year survey and in each follow-up survey, students were asked to indicate theextent to which they agreed or disagreed with 13 statements about themselves. These statementswere combined into two composites, “locus of control” and “self-concept,” which provide a bridgeto other social research efforts, including the NLS-72 and HS&B surveys. The statements were asfollows:
Base Year; First Follow-up; Second Follow-up44 (BY), 62 (F1), 66 (F2)A. I feel good about myself.B. I don’t have enough control over the direction my life is taking.C. In my life, good luck is more important than hard work for success.D. I feel I am a person of worth, the equal of other people.E. I am able to do things as well as most other people.F. Every time I try to get ahead, something or somebody stops me.G. My plans hardly ever work out, so planning only makes me unhappy.H. On the whole, I am satisfied with myself.I. I certainly feel useless at times.J. At times I think I am no good at all.K. When I make plans, I am almost certain I can make them work.L. I feel I do not have much to be proud of.M. Chance and luck are very important for what happens in my life.
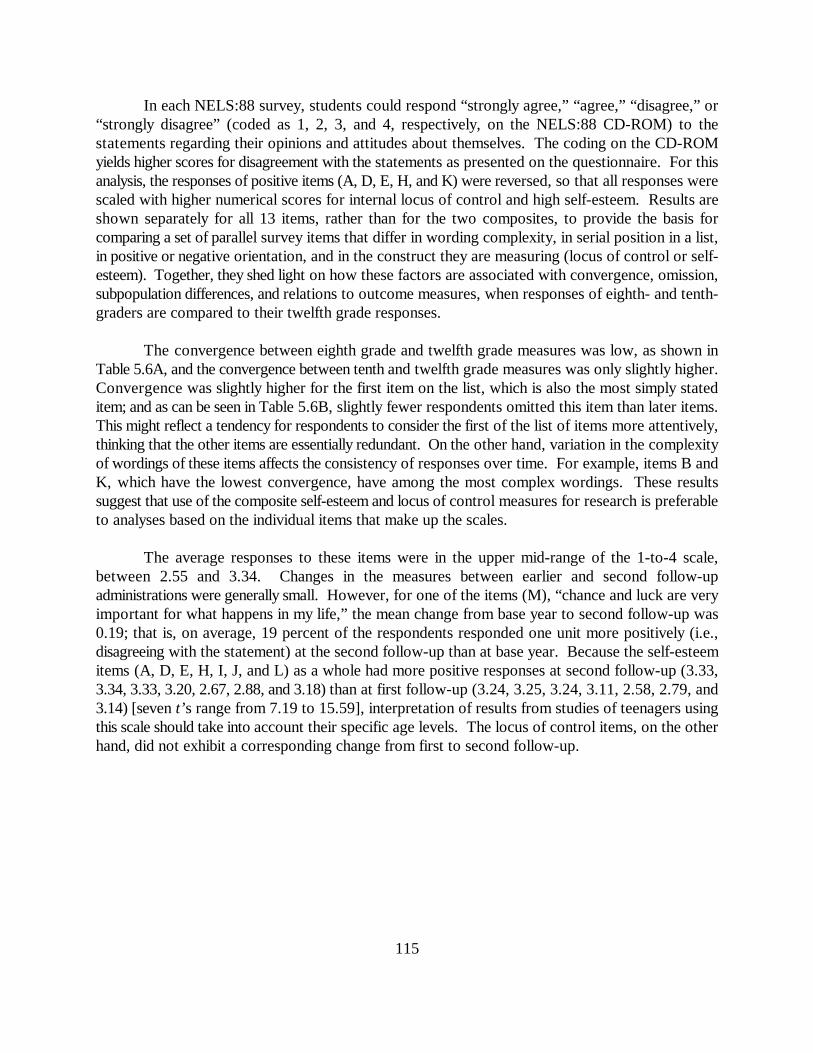
115
In each NELS:88 survey, students could respond “strongly agree,” “agree,” “disagree,” or“strongly disagree” (coded as 1, 2, 3, and 4, respectively, on the NELS:88 CD-ROM) to thestatements regarding their opinions and attitudes about themselves. The coding on the CD-ROMyields higher scores for disagreement with the statements as presented on the questionnaire. For thisanalysis, the responses of positive items (A, D, E, H, and K) were reversed, so that all responses werescaled with higher numerical scores for internal locus of control and high self-esteem. Results areshown separately for all 13 items, rather than for the two composites, to provide the basis forcomparing a set of parallel survey items that differ in wording complexity, in serial position in a list,in positive or negative orientation, and in the construct they are measuring (locus of control or self-esteem). Together, they shed light on how these factors are associated with convergence, omission,subpopulation differences, and relations to outcome measures, when responses of eighth- and tenth-graders are compared to their twelfth grade responses.
The convergence between eighth grade and twelfth grade measures was low, as shown inTable 5.6A, and the convergence between tenth and twelfth grade measures was only slightly higher.Convergence was slightly higher for the first item on the list, which is also the most simply stateditem; and as can be seen in Table 5.6B, slightly fewer respondents omitted this item than later items.This might reflect a tendency for respondents to consider the first of the list of items more attentively,thinking that the other items are essentially redundant. On the other hand, variation in the complexityof wordings of these items affects the consistency of responses over time. For example, items B andK, which have the lowest convergence, have among the most complex wordings. These resultssuggest that use of the composite self-esteem and locus of control measures for research is preferableto analyses based on the individual items that make up the scales.
The average responses to these items were in the upper mid-range of the 1-to-4 scale,between 2.55 and 3.34. Changes in the measures between earlier and second follow-upadministrations were generally small. However, for one of the items (M), “chance and luck are veryimportant for what happens in my life,” the mean change from base year to second follow-up was0.19; that is, on average, 19 percent of the respondents responded one unit more positively (i.e.,disagreeing with the statement) at the second follow-up than at base year. Because the self-esteemitems (A, D, E, H, I, J, and L) as a whole had more positive responses at second follow-up (3.33,3.34, 3.33, 3.20, 2.67, 2.88, and 3.18) than at first follow-up (3.24, 3.25, 3.24, 3.11, 2.58, 2.79, and3.14) [seven t’s range from 7.19 to 15.59], interpretation of results from studies of teenagers usingthis scale should take into account their specific age levels. The locus of control items, on the otherhand, did not exhibit a corresponding change from first to second follow-up.
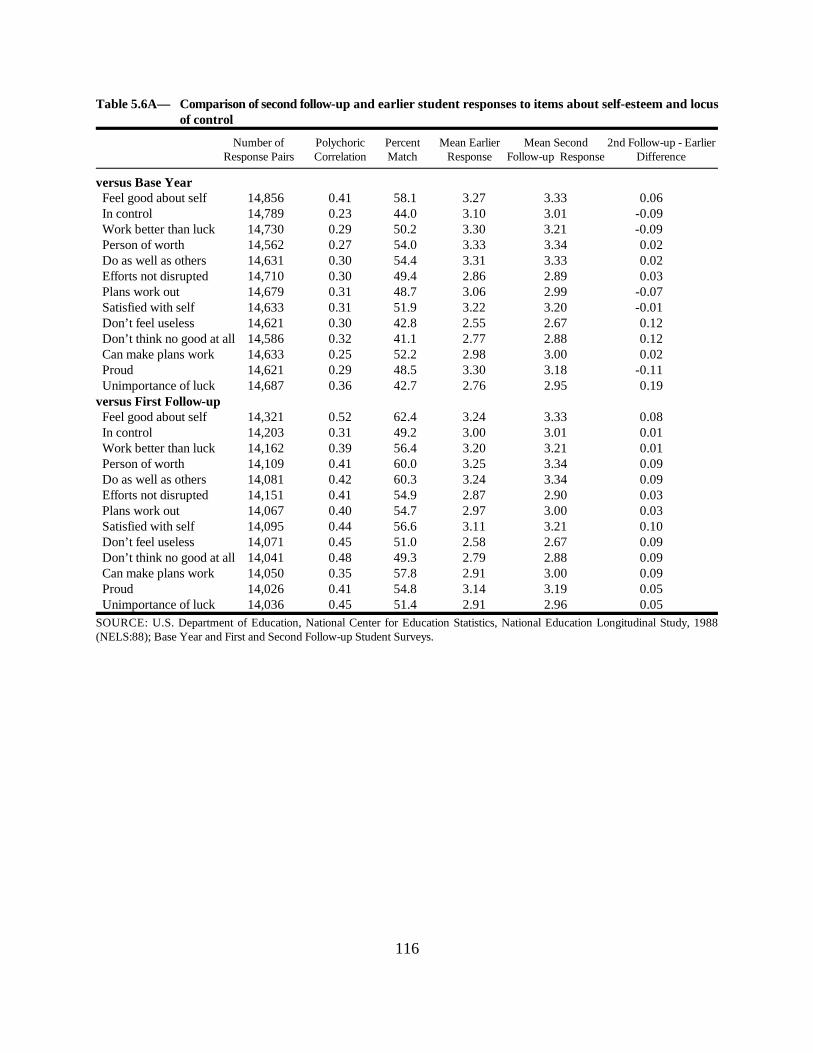
116
Table 5.6A— Comparison of second follow-up and earlier student responses to items about self-esteem and locusof control
Number of Polychoric Percent Mean Earlier Mean Second 2nd Follow-up - EarlierResponse Pairs Correlation Match Response Follow-up Response Difference
versus Base Year Feel good about self 14,856 0.41 58.1 3.27 3.33 0.06 In control 14,789 0.23 44.0 3.10 3.01 -0.09 Work better than luck 14,730 0.29 50.2 3.30 3.21 -0.09 Person of worth 14,562 0.27 54.0 3.33 3.34 0.02 Do as well as others 14,631 0.30 54.4 3.31 3.33 0.02 Efforts not disrupted 14,710 0.30 49.4 2.86 2.89 0.03 Plans work out 14,679 0.31 48.7 3.06 2.99 -0.07 Satisfied with self 14,633 0.31 51.9 3.22 3.20 -0.01 Don’t feel useless 14,621 0.30 42.8 2.55 2.67 0.12 Don’t think no good at all 14,586 0.32 41.1 2.77 2.88 0.12 Can make plans work 14,633 0.25 52.2 2.98 3.00 0.02 Proud 14,621 0.29 48.5 3.30 3.18 -0.11 Unimportance of luck 14,687 0.36 42.7 2.76 2.95 0.19versus First Follow-up Feel good about self 14,321 0.52 62.4 3.24 3.33 0.08 In control 14,203 0.31 49.2 3.00 3.01 0.01 Work better than luck 14,162 0.39 56.4 3.20 3.21 0.01 Person of worth 14,109 0.41 60.0 3.25 3.34 0.09 Do as well as others 14,081 0.42 60.3 3.24 3.34 0.09 Efforts not disrupted 14,151 0.41 54.9 2.87 2.90 0.03 Plans work out 14,067 0.40 54.7 2.97 3.00 0.03 Satisfied with self 14,095 0.44 56.6 3.11 3.21 0.10 Don’t feel useless 14,071 0.45 51.0 2.58 2.67 0.09 Don’t think no good at all 14,041 0.48 49.3 2.79 2.88 0.09 Can make plans work 14,050 0.35 57.8 2.91 3.00 0.09 Proud 14,026 0.41 54.8 3.14 3.19 0.05 Unimportance of luck 14,036 0.45 51.4 2.91 2.96 0.05SOURCE: U.S. Department of Education, National Center for Education Statistics, National Education Longitudinal Study, 1988(NELS:88); Base Year and First and Second Follow-up Student Surveys.
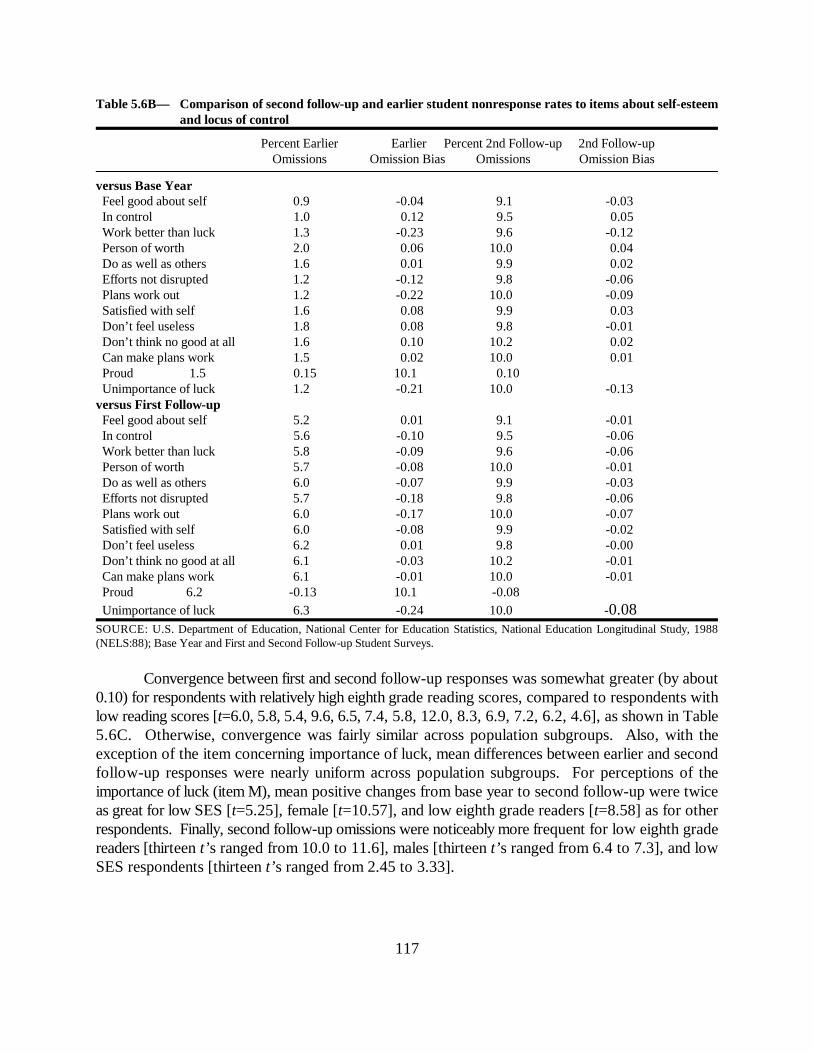
117
Table 5.6B— Comparison of second follow-up and earlier student nonresponse rates to items about self-esteemand locus of control
Percent Earlier Earlier Percent 2nd Follow-up 2nd Follow-upOmissions Omission Bias Omissions Omission Bias
versus Base Year Feel good about self 0.9 -0.04 9.1 -0.03 In control 1.0 0.12 9.5 0.05 Work better than luck 1.3 -0.23 9.6 -0.12 Person of worth 2.0 0.06 10.0 0.04 Do as well as others 1.6 0.01 9.9 0.02 Efforts not disrupted 1.2 -0.12 9.8 -0.06 Plans work out 1.2 -0.22 10.0 -0.09 Satisfied with self 1.6 0.08 9.9 0.03 Don’t feel useless 1.8 0.08 9.8 -0.01 Don’t think no good at all 1.6 0.10 10.2 0.02 Can make plans work 1.5 0.02 10.0 0.01 Proud 1.5 0.15 10.1 0.10 Unimportance of luck 1.2 -0.21 10.0 -0.13versus First Follow-up Feel good about self 5.2 0.01 9.1 -0.01 In control 5.6 -0.10 9.5 -0.06 Work better than luck 5.8 -0.09 9.6 -0.06 Person of worth 5.7 -0.08 10.0 -0.01 Do as well as others 6.0 -0.07 9.9 -0.03 Efforts not disrupted 5.7 -0.18 9.8 -0.06 Plans work out 6.0 -0.17 10.0 -0.07 Satisfied with self 6.0 -0.08 9.9 -0.02 Don’t feel useless 6.2 0.01 9.8 -0.00 Don’t think no good at all 6.1 -0.03 10.2 -0.01 Can make plans work 6.1 -0.01 10.0 -0.01 Proud 6.2 -0.13 10.1 -0.08 Unimportance of luck 6.3 -0.24 10.0 -0.08SOURCE: U.S. Department of Education, National Center for Education Statistics, National Education Longitudinal Study, 1988(NELS:88); Base Year and First and Second Follow-up Student Surveys.
Convergence between first and second follow-up responses was somewhat greater (by about0.10) for respondents with relatively high eighth grade reading scores, compared to respondents withlow reading scores [t=6.0, 5.8, 5.4, 9.6, 6.5, 7.4, 5.8, 12.0, 8.3, 6.9, 7.2, 6.2, 4.6], as shown in Table5.6C. Otherwise, convergence was fairly similar across population subgroups. Also, with theexception of the item concerning importance of luck, mean differences between earlier and secondfollow-up responses were nearly uniform across population subgroups. For perceptions of theimportance of luck (item M), mean positive changes from base year to second follow-up were twiceas great for low SES [t=5.25], female [t=10.57], and low eighth grade readers [t=8.58] as for otherrespondents. Finally, second follow-up omissions were noticeably more frequent for low eighth gradereaders [thirteen t’s ranged from 10.0 to 11.6], males [thirteen t’s ranged from 6.4 to 7.3], and lowSES respondents [thirteen t’s ranged from 2.45 to 3.33].
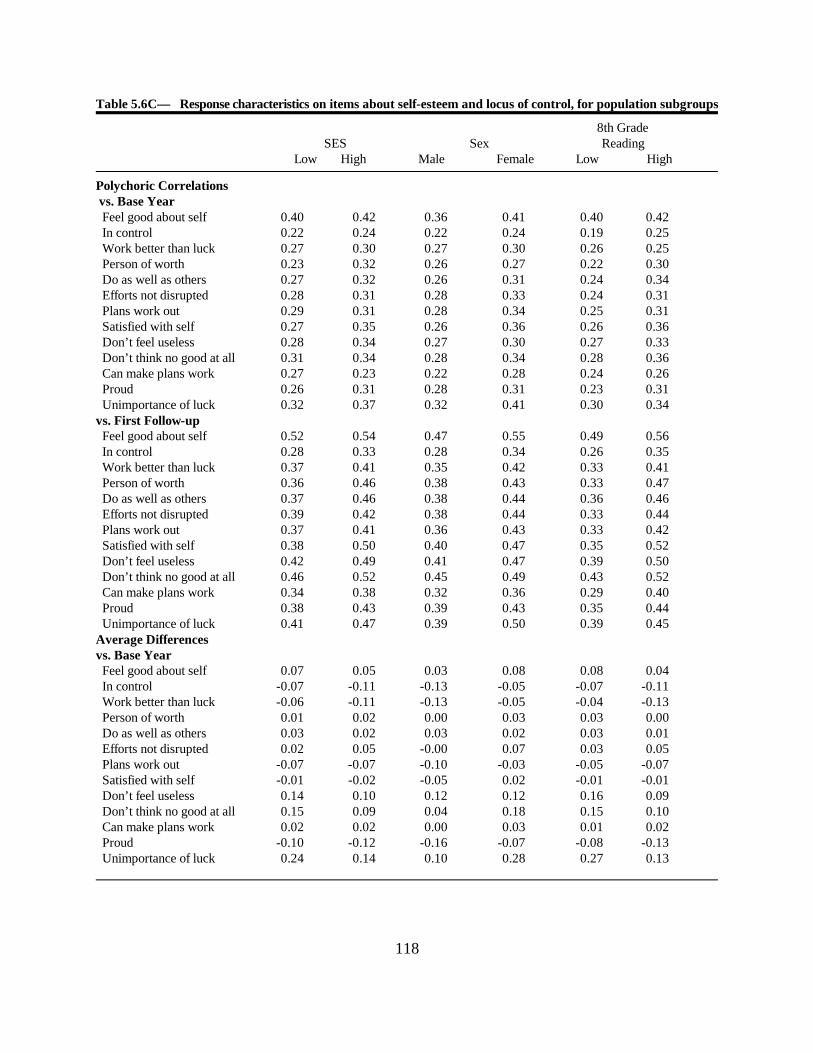
118
Table 5.6C— Response characteristics on items about self-esteem and locus of control, for population subgroups
8th GradeSES Sex Reading
Low High Male Female Low High
Polychoric Correlations vs. Base Year Feel good about self 0.40 0.42 0.36 0.41 0.40 0.42 In control 0.22 0.24 0.22 0.24 0.19 0.25 Work better than luck 0.27 0.30 0.27 0.30 0.26 0.25 Person of worth 0.23 0.32 0.26 0.27 0.22 0.30 Do as well as others 0.27 0.32 0.26 0.31 0.24 0.34 Efforts not disrupted 0.28 0.31 0.28 0.33 0.24 0.31 Plans work out 0.29 0.31 0.28 0.34 0.25 0.31 Satisfied with self 0.27 0.35 0.26 0.36 0.26 0.36 Don’t feel useless 0.28 0.34 0.27 0.30 0.27 0.33 Don’t think no good at all 0.31 0.34 0.28 0.34 0.28 0.36 Can make plans work 0.27 0.23 0.22 0.28 0.24 0.26 Proud 0.26 0.31 0.28 0.31 0.23 0.31 Unimportance of luck 0.32 0.37 0.32 0.41 0.30 0.34vs. First Follow-up Feel good about self 0.52 0.54 0.47 0.55 0.49 0.56 In control 0.28 0.33 0.28 0.34 0.26 0.35 Work better than luck 0.37 0.41 0.35 0.42 0.33 0.41 Person of worth 0.36 0.46 0.38 0.43 0.33 0.47 Do as well as others 0.37 0.46 0.38 0.44 0.36 0.46 Efforts not disrupted 0.39 0.42 0.38 0.44 0.33 0.44 Plans work out 0.37 0.41 0.36 0.43 0.33 0.42 Satisfied with self 0.38 0.50 0.40 0.47 0.35 0.52 Don’t feel useless 0.42 0.49 0.41 0.47 0.39 0.50 Don’t think no good at all 0.46 0.52 0.45 0.49 0.43 0.52 Can make plans work 0.34 0.38 0.32 0.36 0.29 0.40 Proud 0.38 0.43 0.39 0.43 0.35 0.44 Unimportance of luck 0.41 0.47 0.39 0.50 0.39 0.45Average Differencesvs. Base Year Feel good about self 0.07 0.05 0.03 0.08 0.08 0.04 In control -0.07 -0.11 -0.13 -0.05 -0.07 -0.11 Work better than luck -0.06 -0.11 -0.13 -0.05 -0.04 -0.13 Person of worth 0.01 0.02 0.00 0.03 0.03 0.00 Do as well as others 0.03 0.02 0.03 0.02 0.03 0.01 Efforts not disrupted 0.02 0.05 -0.00 0.07 0.03 0.05 Plans work out -0.07 -0.07 -0.10 -0.03 -0.05 -0.07 Satisfied with self -0.01 -0.02 -0.05 0.02 -0.01 -0.01 Don’t feel useless 0.14 0.10 0.12 0.12 0.16 0.09 Don’t think no good at all 0.15 0.09 0.04 0.18 0.15 0.10 Can make plans work 0.02 0.02 0.00 0.03 0.01 0.02 Proud -0.10 -0.12 -0.16 -0.07 -0.08 -0.13 Unimportance of luck 0.24 0.14 0.10 0.28 0.27 0.13

119
Table 5.6C— Response characteristics on items about self-esteem and locus of control, for populationsubgroups—Continued
8th GradeSES Sex Reading
Low High Male Female Low High
versus First Follow-up Feel good about self 0.08 0.09 0.10 0.08 0.10 0.07 In control 0.02 0.01 -0.01 0.03 -0.00 0.03 Work better than luck 0.02 0.00 -0.00 0.02 0.00 0.02 Person of worth 0.10 0.08 0.11 0.08 0.11 0.08 Do as well as others 0.10 0.08 0.10 0.09 0.11 0.08 Efforts not disrupted 0.02 0.04 0.01 0.06 0.00 0.06 Plans work out 0.02 0.04 -0.00 0.06 0.01 0.05 Satisfied with self 0.09 0.10 0.08 0.12 0.10 0.10 Don’t feel useless 0.07 0.10 0.06 0.11 0.09 0.08 Don’t think no good at all 0.10 0.09 0.05 0.14 0.10 0.09 Can make plans work 0.08 0.09 0.08 0.09 0.09 0.08 Proud 0.05 0.05 0.04 0.07 0.06 0.05 Unimportance of luck 0.06 0.04 0.02 0.08 0.06 0.05Pct. 2nd Follow-up Nonresponse Feel good about self 9.2 7.8 10.6 7.7 11.6 6.9 In control 9.5 8.1 11.0 8.0 12.0 7.2 Work better than luck 9.6 8.2 11.1 8.1 12.0 7.3 Person of worth 10.0 8.6 11.5 8.5 12.5 7.7 Do as well as others 10.0 8.5 11.5 8.3 12.3 7.6 Efforts not disrupted 9.9 8.3 11.4 8.1 12.3 7.4 Plans work out 10.1 8.6 11.6 8.4 12.6 7.5 Satisfied with self 10.0 8.4 11.5 8.3 12.5 7.4 Don’t feel useless 9.9 8.4 11.5 8.2 12.4 7.4 Don’t think no good at all 10.1 8.9 11.9 8.5 12.9 7.7 Can make plans work 10.1 8.6 11.7 8.4 12.9 7.4 Proud 10.1 8.7 11.8 8.5 12.8 7.6 Unimportance of luck 10.1 8.5 11.7 8.3 12.7 7.5SOURCE: U.S. Department of Education, National Center for Education Statistics, National Education Longitudinal Study, 1988(NELS:88); Base Year and First and Second Follow-up Student Surveys.
As shown in Table 5.6D, nearly all of these items were significantly and positively related tooutcome measures at all three time periods. There were exceptions, however. In five cases, relationsare significant when measured at base year or first follow-up but not significant at second follow-up:relations between item A (“I feel good about myself”) and grade point average and enrollment status,relations between item E (“I can do things as well as others”) and occupational expectation andenrollment status, and the relation between item H (“I am satisfied with myself”) and occupationalexpectation. In these cases, the eighth or tenth grade measures have more variance in common withthe outcomes. On the other hand, in three cases, relations are significant when measured at thesecond follow-up but not at one of the other measurements. Item A (“I feel good about myself”) issignificantly positively related to twelfth grade math scores, but not when item A is administered atthe tenth grade; occupational expectations are significantly positively related to item K (“I am almost

120
certain I can make my plans work”) and I (“I [don’t] feel useless at times”) at the second follow-upbut not at first follow-up for both K and I; and base year for item I.
The major finding with respect to the 13 items making up the two composites is that, exceptfor the first item, there are few systematic differences among them. The first item (I feel good aboutmyself) stands out as having both (1) greater convergence across time and (2) relations with outcomemeasures that change in ways different from the other items.
Table 5.6D— Statistically significant associations of earlier and later student responses about self-esteem andlocus of control with selected NELS:88 outcomes
12th Educ. Occu- Course Grade Locus Self- Enroll-Grade Aspr.& pation Diffi- Point of Con- mentMath Expect Expect culty Avg. Control cept Status
versus Base Year Feel good about self + + .. + B+ + + B+ In control + + + + + + + + Work better than luck + + + + + + + + Person of worth + + + + + + + + Do as well as others + + B+ + + + + B+ Efforts not disrupted + + + + + + + + Plans work out + + + + + + + + Satisfied with self + + B+ + + + + + Don’t feel useless + + S+ + + + + + Don’t think no good at all + + + + + + + + Can make plans work + + + + + + + + Proud + + + + + + + + Unimportance of luck + + + + + + + + versus First Follow-up Feel good about self S+ + .. + F+ + + F+ In control + + + + + + + + Work better than luck + + + + + + + + Person of worth + + + + + + + + Do as well as others + + F+ + + + + .. Efforts not disrupted + + + + + + + + Plans work out + + + + + + + + Satisfied with self + + .. + + + + + Don’t feel useless + + S+ + + + + + Don’t think no good at all + + + + + + + + Can make plans work + + S+ + + + + + Proud + + + + + + + + Unimportance of luck + + + + + + + + Note: “+” and “-” refer to the direction of relation, B, F, and S indicate that the relation is significant only for data from that source (baseyear, first follow-up or second follow-up), and “. .” indicates that no significant relation was found.SOURCE: U.S. Department of Education, National Center for Education Statistics, National Education Longitudinal Study, 1988(NELS:88); Base Year and First and Second Follow-up Student Surveys.

121
Educational Expectations
In this and the following three sections, the stability of teenagers’ expectations for education,for occupation, and for various aspects of quality of life, as well as of the importance they place onaspects of quality of life, are examined. Because NELS:88 asked similar questions at multiple timepoints, these data provide new information on the extent of change in these important measures overa crucial developmental period.
Educational expectations are both an indicator of a teenager’s self-image and, to the extentthat self-image reflects an objective assessment of the likelihood of future events, a predictor ofeducational outcomes. These expectations are based on many factors, and they may be related toteenagers’ perceptions of their parents’ expectations for them. Whether these expectations asmeasured in eighth grade are as valid as later assessments of expectations is of importance toresearchers who would use them in models of educational development. In the base year and secondfollow-up surveys, students were asked how far in school they thought they would get. The itemwas:
Base Year, Second Follow-up45 (BY), 43 (F2) As things stand now, how far in school do you think you will get?
In the base year survey, students were given six choices: “won’t finish high school”, “willfinish high school”, “will attend vocational, trade, or business school after high school”, “will attenda four-year college”, “will finish college”, and “will attend a higher level of school after graduatingfrom college”, scored 1 to 6, respectively. In the second follow-up survey, students were giveneleven choices. The first ten choices ranged from “less than high school graduation” to “Ph.D., M.D.,or other professional degree,” and the last response alternative was “don’t know.” The secondfollow-up item was recoded for this analysis onto the base year scale.
In both surveys, students were also asked to indicate how far in school they thought theirfather and their mother would want them to reach. The statements were as follows:
Base Year (48); Second Follow-up (42)48 (BY), 42 (F2) A. How far in school do you think your father (or male guardian) wants
you to get [go]?
B. How far in school do you think your mother (or female guardian)wants you to get [go]?
The word “get” was used in base year survey, whereas “go” was used in the second follow-up. In the base year survey, students were given the same six response alternatives as in the questionabout their own expectations, plus an “I don’t know” alternative. In the second follow-up survey,the response options for the parental aspirations items were the same as for the expectations item,with the addition of a “does not apply” option, presumably for the case of absent parents. Second
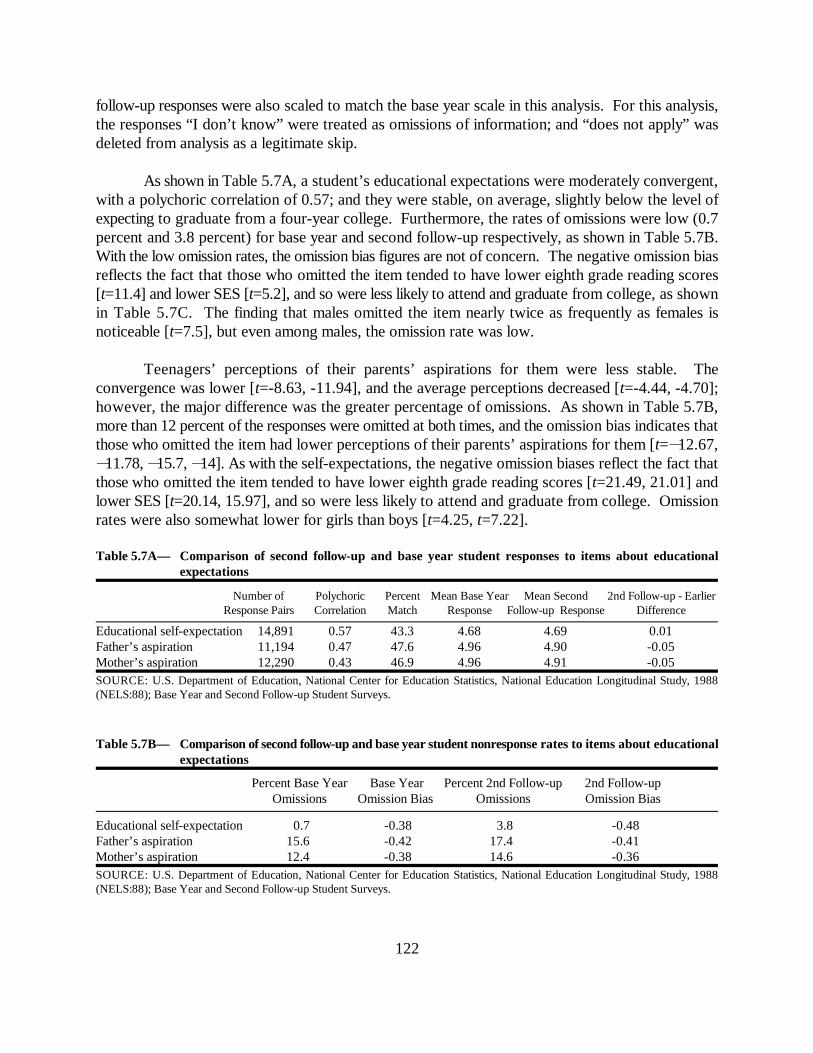
122
follow-up responses were also scaled to match the base year scale in this analysis. For this analysis,the responses “I don’t know” were treated as omissions of information; and “does not apply” wasdeleted from analysis as a legitimate skip.
As shown in Table 5.7A, a student’s educational expectations were moderately convergent,with a polychoric correlation of 0.57; and they were stable, on average, slightly below the level ofexpecting to graduate from a four-year college. Furthermore, the rates of omissions were low (0.7percent and 3.8 percent) for base year and second follow-up respectively, as shown in Table 5.7B.With the low omission rates, the omission bias figures are not of concern. The negative omission biasreflects the fact that those who omitted the item tended to have lower eighth grade reading scores[t=11.4] and lower SES [t=5.2], and so were less likely to attend and graduate from college, as shownin Table 5.7C. The finding that males omitted the item nearly twice as frequently as females isnoticeable [t=7.5], but even among males, the omission rate was low.
Teenagers’ perceptions of their parents’ aspirations for them were less stable. Theconvergence was lower [t=-8.63, -11.94], and the average perceptions decreased [t=-4.44, -4.70];however, the major difference was the greater percentage of omissions. As shown in Table 5.7B,more than 12 percent of the responses were omitted at both times, and the omission bias indicates thatthose who omitted the item had lower perceptions of their parents’ aspirations for them [t=�12.67,�11.78, �15.7, �14]. As with the self-expectations, the negative omission biases reflect the fact thatthose who omitted the item tended to have lower eighth grade reading scores [t=21.49, 21.01] andlower SES [t=20.14, 15.97], and so were less likely to attend and graduate from college. Omissionrates were also somewhat lower for girls than boys [t=4.25, t=7.22].
Table 5.7A— Comparison of second follow-up and base year student responses to items about educationalexpectations
Number of Polychoric Percent Mean Base Year Mean Second 2nd Follow-up - EarlierResponse Pairs Correlation Match Response Follow-up Response Difference
Educational self-expectation 14,891 0.57 43.3 4.68 4.69 0.01Father’s aspiration 11,194 0.47 47.6 4.96 4.90 -0.05Mother’s aspiration 12,290 0.43 46.9 4.96 4.91 -0.05SOURCE: U.S. Department of Education, National Center for Education Statistics, National Education Longitudinal Study, 1988(NELS:88); Base Year and Second Follow-up Student Surveys.
Table 5.7B— Comparison of second follow-up and base year student nonresponse rates to items about educationalexpectations
Percent Base Year Base Year Percent 2nd Follow-up 2nd Follow-upOmissions Omission Bias Omissions Omission Bias
Educational self-expectation 0.7 -0.38 3.8 -0.48Father’s aspiration 15.6 -0.42 17.4 -0.41Mother’s aspiration 12.4 -0.38 14.6 -0.36SOURCE: U.S. Department of Education, National Center for Education Statistics, National Education Longitudinal Study, 1988(NELS:88); Base Year and Second Follow-up Student Surveys.
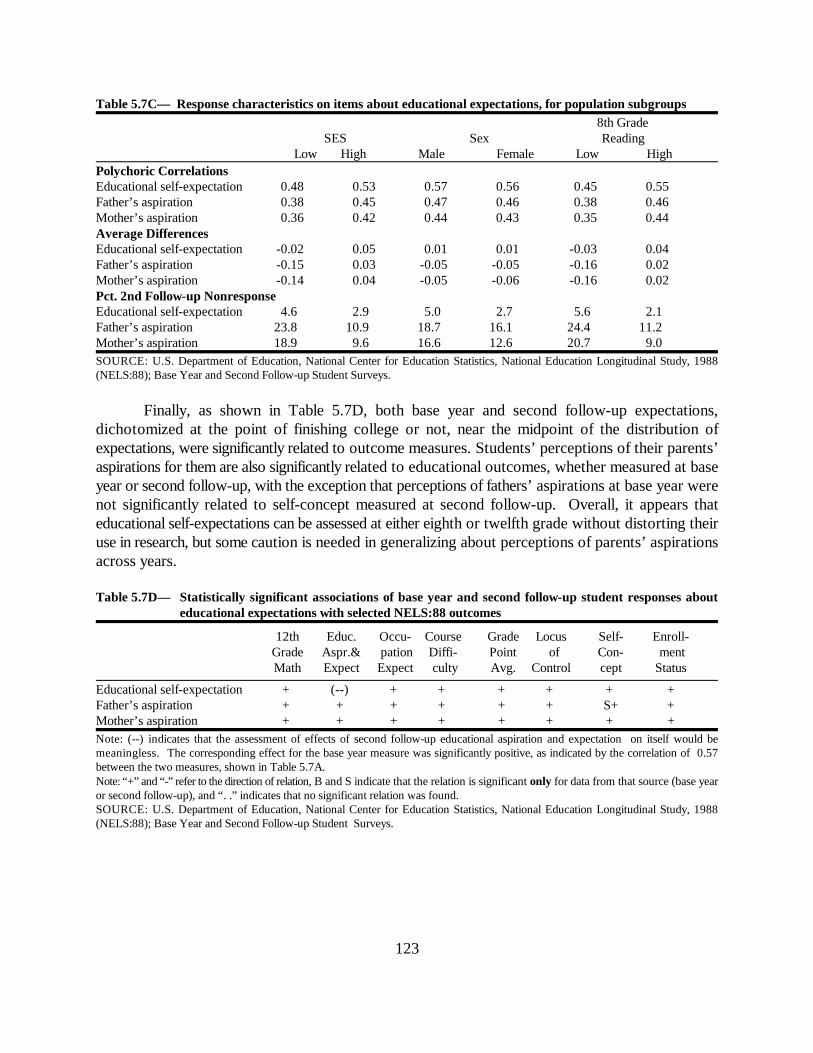
123
Table 5.7C— Response characteristics on items about educational expectations, for population subgroups8th Grade
SES Sex ReadingLow High Male Female Low High
Polychoric CorrelationsEducational self-expectation 0.48 0.53 0.57 0.56 0.45 0.55Father’s aspiration 0.38 0.45 0.47 0.46 0.38 0.46Mother’s aspiration 0.36 0.42 0.44 0.43 0.35 0.44Average DifferencesEducational self-expectation -0.02 0.05 0.01 0.01 -0.03 0.04Father’s aspiration -0.15 0.03 -0.05 -0.05 -0.16 0.02Mother’s aspiration -0.14 0.04 -0.05 -0.06 -0.16 0.02Pct. 2nd Follow-up NonresponseEducational self-expectation 4.6 2.9 5.0 2.7 5.6 2.1Father’s aspiration 23.8 10.9 18.7 16.1 24.4 11.2Mother’s aspiration 18.9 9.6 16.6 12.6 20.7 9.0SOURCE: U.S. Department of Education, National Center for Education Statistics, National Education Longitudinal Study, 1988(NELS:88); Base Year and Second Follow-up Student Surveys.
Finally, as shown in Table 5.7D, both base year and second follow-up expectations,dichotomized at the point of finishing college or not, near the midpoint of the distribution ofexpectations, were significantly related to outcome measures. Students’ perceptions of their parents’aspirations for them are also significantly related to educational outcomes, whether measured at baseyear or second follow-up, with the exception that perceptions of fathers’ aspirations at base year werenot significantly related to self-concept measured at second follow-up. Overall, it appears thateducational self-expectations can be assessed at either eighth or twelfth grade without distorting theiruse in research, but some caution is needed in generalizing about perceptions of parents’ aspirationsacross years.
Table 5.7D— Statistically significant associations of base year and second follow-up student responses abouteducational expectations with selected NELS:88 outcomes
12th Educ. Occu- Course Grade Locus Self- Enroll-Grade Aspr.& pation Diffi- Point of Con- mentMath Expect Expect culty Avg. Control cept Status
Educational self-expectation + (--) + + + + + + Father’s aspiration + + + + + + S+ + Mother’s aspiration + + + + + + + + Note: (--) indicates that the assessment of effects of second follow-up educational aspiration and expectation on itself would bemeaningless. The corresponding effect for the base year measure was significantly positive, as indicated by the correlation of 0.57between the two measures, shown in Table 5.7A.Note: “+” and “-” refer to the direction of relation, B and S indicate that the relation is significant only for data from that source (base yearor second follow-up), and “. .” indicates that no significant relation was found.SOURCE: U.S. Department of Education, National Center for Education Statistics, National Education Longitudinal Study, 1988(NELS:88); Base Year and Second Follow-up Student Surveys.

124
Expected Occupation
In the base year, first, and second follow-up surveys, students were asked questions abouttheir current or most recent jobs and about the jobs they expected or planned to have in the future.The items analyzed were:
Base Year52. What kind of work do you expect to be doing when you are 30 years old? (MARK
THE ANSWER THAT COMES CLOSEST TO WHAT YOU EXPECT TO BE DOING.IF YOU HAVE TWO OR THREE THINGS YOU THINK YOU MAY BE DOING, DONOT CHOOSE MORE THAN ONE ANSWER. INSTEAD, MAKE ONE BESTGUESS.)
First Follow-up; Second Follow-up53B (F1), 64B (F2)
Which of the categories below comes closest to describing the job or occupationthat you expect or plan to have ... when you are 30 years old? Even if you are notsure, circle your best guess.
Eleven separate occupational categories were provided in the base year item, and 16 wereprovided in the follow-up items. The categories were re-ordered to match the standard occupationalprestige coding (Stevens and Cho 1985), and the follow-up categories were collapsed to match thebase year categories for the base year comparisons. The resulting 11 categories were scored from1 to 11 in the following increasing order: professions such as law; professions such as science orengineering; teacher or homemaker; technical; office work or sales; military or police; small businessowner; farmer; craftsperson or machine operator; service worker; and laborer. See appendix TableB4 for further details. Dropouts were not included in this analysis.
As shown in Table 5.8A, the convergence between tenth and twelfth grade measures wasmoderate, higher than the convergence between eighth grade and twelfth grade measures. Thisdifference may be due to either or both the change in response alternatives and developmental factorsbetween eighth and tenth grades. As can be seen in Table 5.8B, there were more omissions of thisitem in the earlier surveys than in the second follow-up [t=�28.25, �29.33]. Those who omitted theitem tended to have low eighth grade reading scores [t=15.2] and low SES [t=7.4] and to be male[t=4.4], as shown by the second follow-up omission rates in Table 5.8C, and this is reflected in thedirection of the omission bias (Table 5.8B): those who omitted the item at any point tended to selectlower SES occupations and those requiring lower reading skills when they responded at another timepoint [t= 7.81, 9.03, 6.96, 8.51].
As shown in Table 5.8D, measurements of expected occupation at all three times weresignificantly positively related to the educational outcomes considered. For this purpose, theoccupations were dichotomized into the professions (the first two categories) versus the rest of the
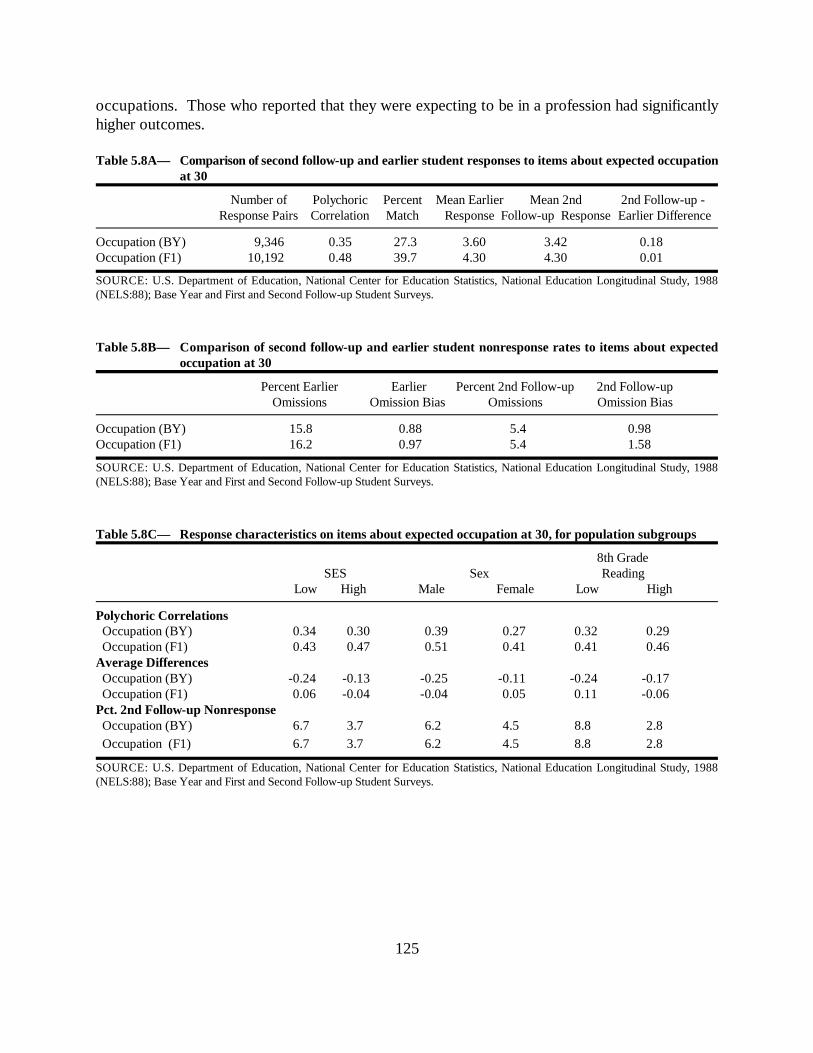
125
occupations. Those who reported that they were expecting to be in a profession had significantlyhigher outcomes.
Table 5.8A— Comparison of second follow-up and earlier student responses to items about expected occupationat 30
Number of Polychoric Percent Mean Earlier Mean 2nd 2nd Follow-up - Response Pairs Correlation Match Response Follow-up Response Earlier Difference
Occupation (BY) 9,346 0.35 27.3 3.60 3.42 0.18Occupation (F1) 10,192 0.48 39.7 4.30 4.30 0.01
SOURCE: U.S. Department of Education, National Center for Education Statistics, National Education Longitudinal Study, 1988(NELS:88); Base Year and First and Second Follow-up Student Surveys.
Table 5.8B— Comparison of second follow-up and earlier student nonresponse rates to items about expectedoccupation at 30
Percent Earlier Earlier Percent 2nd Follow-up 2nd Follow-upOmissions Omission Bias Omissions Omission Bias
Occupation (BY) 15.8 0.88 5.4 0.98Occupation (F1) 16.2 0.97 5.4 1.58
SOURCE: U.S. Department of Education, National Center for Education Statistics, National Education Longitudinal Study, 1988(NELS:88); Base Year and First and Second Follow-up Student Surveys.
Table 5.8C— Response characteristics on items about expected occupation at 30, for population subgroups
8th GradeSES Sex Reading
Low High Male Female Low High
Polychoric Correlations Occupation (BY) 0.34 0.30 0.39 0.27 0.32 0.29 Occupation (F1) 0.43 0.47 0.51 0.41 0.41 0.46Average Differences Occupation (BY) -0.24 -0.13 -0.25 -0.11 -0.24 -0.17 Occupation (F1) 0.06 -0.04 -0.04 0.05 0.11 -0.06 Pct. 2nd Follow-up Nonresponse Occupation (BY) 6.7 3.7 6.2 4.5 8.8 2.8 Occupation (F1) 6.7 3.7 6.2 4.5 8.8 2.8
SOURCE: U.S. Department of Education, National Center for Education Statistics, National Education Longitudinal Study, 1988(NELS:88); Base Year and First and Second Follow-up Student Surveys.
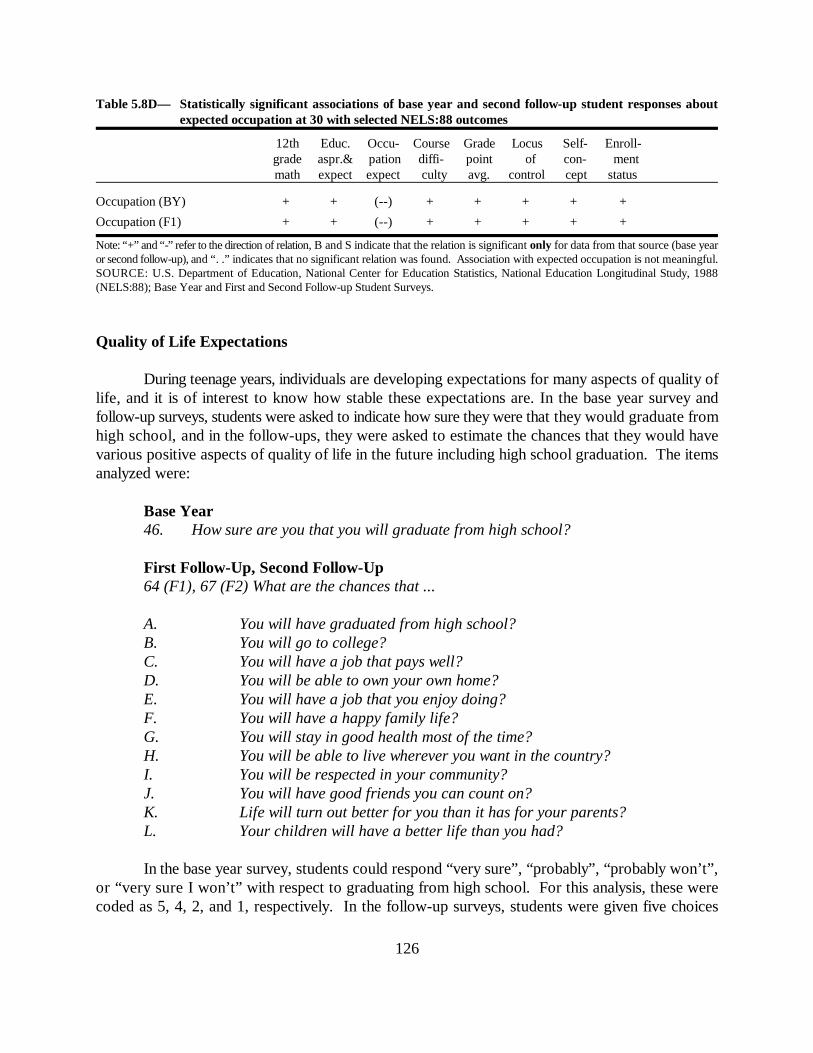
126
Table 5.8D— Statistically significant associations of base year and second follow-up student responses aboutexpected occupation at 30 with selected NELS:88 outcomes
12th Educ. Occu- Course Grade Locus Self- Enroll-grade aspr.& pation diffi- point of con- mentmath expect expect culty avg. control cept status
Occupation (BY) + + (--) + + + + +
Occupation (F1) + + (--) + + + + +
Note: “+” and “-” refer to the direction of relation, B and S indicate that the relation is significant only for data from that source (base yearor second follow-up), and “. .” indicates that no significant relation was found. Association with expected occupation is not meaningful.SOURCE: U.S. Department of Education, National Center for Education Statistics, National Education Longitudinal Study, 1988(NELS:88); Base Year and First and Second Follow-up Student Surveys.
Quality of Life Expectations
During teenage years, individuals are developing expectations for many aspects of quality oflife, and it is of interest to know how stable these expectations are. In the base year survey andfollow-up surveys, students were asked to indicate how sure they were that they would graduate fromhigh school, and in the follow-ups, they were asked to estimate the chances that they would havevarious positive aspects of quality of life in the future including high school graduation. The itemsanalyzed were:
Base Year46. How sure are you that you will graduate from high school?
First Follow-Up, Second Follow-Up64 (F1), 67 (F2) What are the chances that ...
A. You will have graduated from high school?B. You will go to college?C. You will have a job that pays well?D. You will be able to own your own home?E. You will have a job that you enjoy doing?F. You will have a happy family life?G. You will stay in good health most of the time?H. You will be able to live wherever you want in the country?I. You will be respected in your community?J. You will have good friends you can count on?K. Life will turn out better for you than it has for your parents?L. Your children will have a better life than you had?
In the base year survey, students could respond “very sure”, “probably”, “probably won’t”,or “very sure I won’t” with respect to graduating from high school. For this analysis, these werecoded as 5, 4, 2, and 1, respectively. In the follow-up surveys, students were given five choices
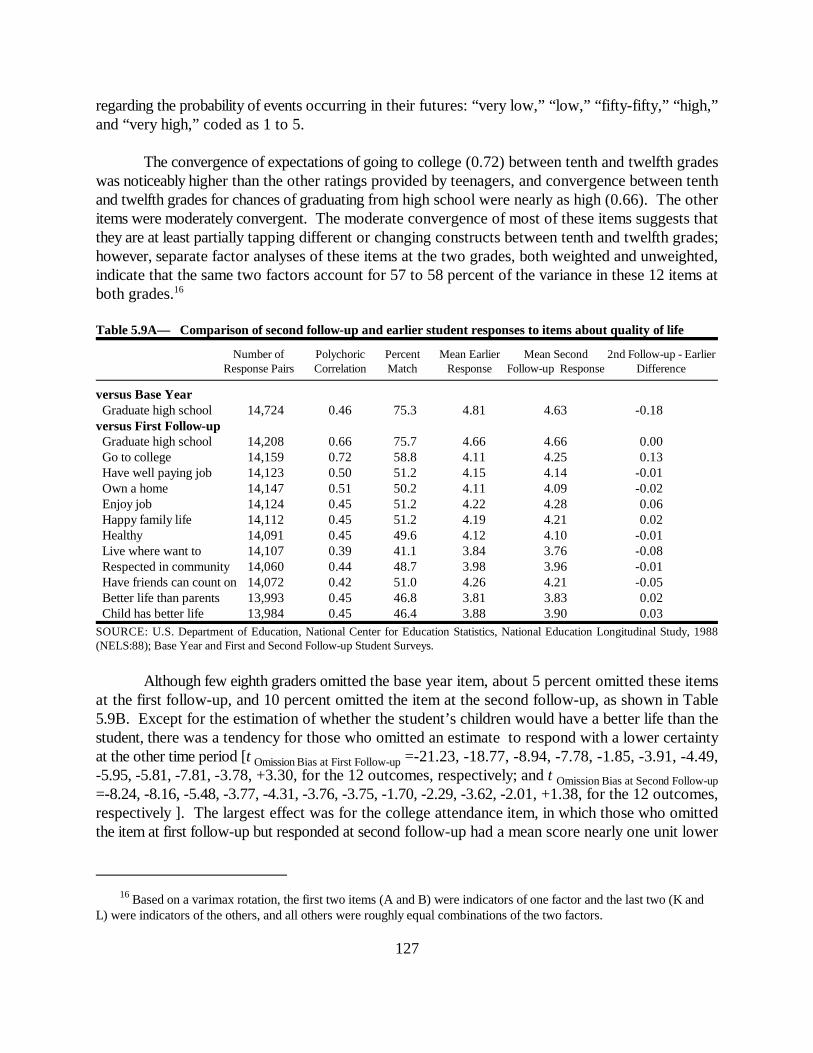
Based on a varimax rotation, the first two items (A and B) were indicators of one factor and the last two (K and16
L) were indicators of the others, and all others were roughly equal combinations of the two factors.
127
regarding the probability of events occurring in their futures: “very low,” “low,” “fifty-fifty,” “high,”and “very high,” coded as 1 to 5.
The convergence of expectations of going to college (0.72) between tenth and twelfth gradeswas noticeably higher than the other ratings provided by teenagers, and convergence between tenthand twelfth grades for chances of graduating from high school were nearly as high (0.66). The otheritems were moderately convergent. The moderate convergence of most of these items suggests thatthey are at least partially tapping different or changing constructs between tenth and twelfth grades;however, separate factor analyses of these items at the two grades, both weighted and unweighted,indicate that the same two factors account for 57 to 58 percent of the variance in these 12 items atboth grades.16
Table 5.9A— Comparison of second follow-up and earlier student responses to items about quality of life
Number of Polychoric Percent Mean Earlier Mean Second 2nd Follow-up - EarlierResponse Pairs Correlation Match Response Follow-up Response Difference
versus Base Year Graduate high school 14,724 0.46 75.3 4.81 4.63 -0.18versus First Follow-up Graduate high school 14,208 0.66 75.7 4.66 4.66 0.00 Go to college 14,159 0.72 58.8 4.11 4.25 0.13 Have well paying job 14,123 0.50 51.2 4.15 4.14 -0.01 Own a home 14,147 0.51 50.2 4.11 4.09 -0.02 Enjoy job 14,124 0.45 51.2 4.22 4.28 0.06 Happy family life 14,112 0.45 51.2 4.19 4.21 0.02 Healthy 14,091 0.45 49.6 4.12 4.10 -0.01 Live where want to 14,107 0.39 41.1 3.84 3.76 -0.08 Respected in community 14,060 0.44 48.7 3.98 3.96 -0.01 Have friends can count on 14,072 0.42 51.0 4.26 4.21 -0.05 Better life than parents 13,993 0.45 46.8 3.81 3.83 0.02 Child has better life 13,984 0.45 46.4 3.88 3.90 0.03SOURCE: U.S. Department of Education, National Center for Education Statistics, National Education Longitudinal Study, 1988(NELS:88); Base Year and First and Second Follow-up Student Surveys.
Although few eighth graders omitted the base year item, about 5 percent omitted these itemsat the first follow-up, and 10 percent omitted the item at the second follow-up, as shown in Table5.9B. Except for the estimation of whether the student’s children would have a better life than thestudent, there was a tendency for those who omitted an estimate to respond with a lower certaintyat the other time period [t =-21.23, -18.77, -8.94, -7.78, -1.85, -3.91, -4.49,Omission Bias at First Follow-up-5.95, -5.81, -7.81, -3.78, +3.30, for the 12 outcomes, respectively; and t Omission Bias at Second Follow-up=-8.24, -8.16, -5.48, -3.77, -4.31, -3.76, -3.75, -1.70, -2.29, -3.62, -2.01, +1.38, for the 12 outcomes,respectively ]. The largest effect was for the college attendance item, in which those who omittedthe item at first follow-up but responded at second follow-up had a mean score nearly one unit lower
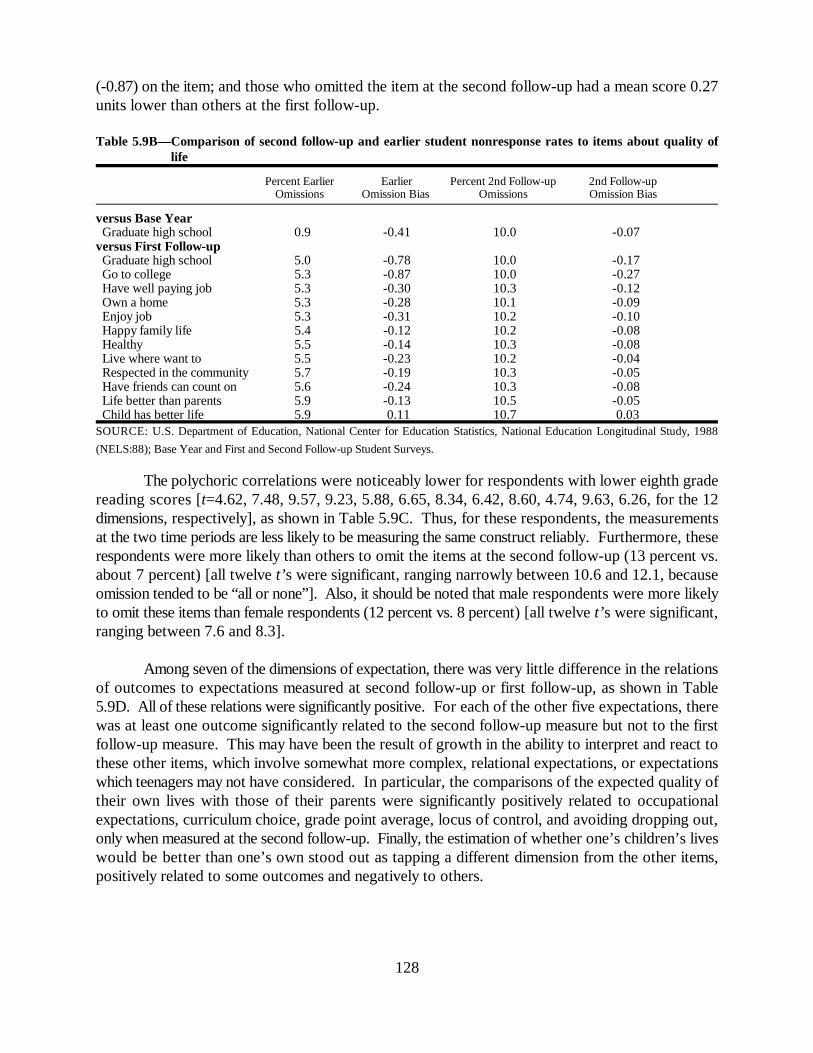
128
(-0.87) on the item; and those who omitted the item at the second follow-up had a mean score 0.27units lower than others at the first follow-up.
Table 5.9B—Comparison of second follow-up and earlier student nonresponse rates to items about quality of life
Percent Earlier Earlier Percent 2nd Follow-up 2nd Follow-upOmissions Omission Bias Omissions Omission Bias
versus Base Year Graduate high school 0.9 -0.41 10.0 -0.07versus First Follow-up Graduate high school 5.0 -0.78 10.0 -0.17 Go to college 5.3 -0.87 10.0 -0.27 Have well paying job 5.3 -0.30 10.3 -0.12 Own a home 5.3 -0.28 10.1 -0.09 Enjoy job 5.3 -0.31 10.2 -0.10 Happy family life 5.4 -0.12 10.2 -0.08 Healthy 5.5 -0.14 10.3 -0.08 Live where want to 5.5 -0.23 10.2 -0.04 Respected in the community 5.7 -0.19 10.3 -0.05 Have friends can count on 5.6 -0.24 10.3 -0.08 Life better than parents 5.9 -0.13 10.5 -0.05 Child has better life 5.9 0.11 10.7 0.03SOURCE: U.S. Department of Education, National Center for Education Statistics, National Education Longitudinal Study, 1988
(NELS:88); Base Year and First and Second Follow-up Student Surveys.
The polychoric correlations were noticeably lower for respondents with lower eighth gradereading scores [t=4.62, 7.48, 9.57, 9.23, 5.88, 6.65, 8.34, 6.42, 8.60, 4.74, 9.63, 6.26, for the 12dimensions, respectively], as shown in Table 5.9C. Thus, for these respondents, the measurementsat the two time periods are less likely to be measuring the same construct reliably. Furthermore, theserespondents were more likely than others to omit the items at the second follow-up (13 percent vs.about 7 percent) [all twelve t’s were significant, ranging narrowly between 10.6 and 12.1, becauseomission tended to be “all or none”]. Also, it should be noted that male respondents were more likelyto omit these items than female respondents (12 percent vs. 8 percent) [all twelve t’s were significant,ranging between 7.6 and 8.3].
Among seven of the dimensions of expectation, there was very little difference in the relationsof outcomes to expectations measured at second follow-up or first follow-up, as shown in Table5.9D. All of these relations were significantly positive. For each of the other five expectations, therewas at least one outcome significantly related to the second follow-up measure but not to the firstfollow-up measure. This may have been the result of growth in the ability to interpret and react tothese other items, which involve somewhat more complex, relational expectations, or expectationswhich teenagers may not have considered. In particular, the comparisons of the expected quality oftheir own lives with those of their parents were significantly positively related to occupationalexpectations, curriculum choice, grade point average, locus of control, and avoiding dropping out,only when measured at the second follow-up. Finally, the estimation of whether one’s children’s liveswould be better than one’s own stood out as tapping a different dimension from the other items,positively related to some outcomes and negatively to others.
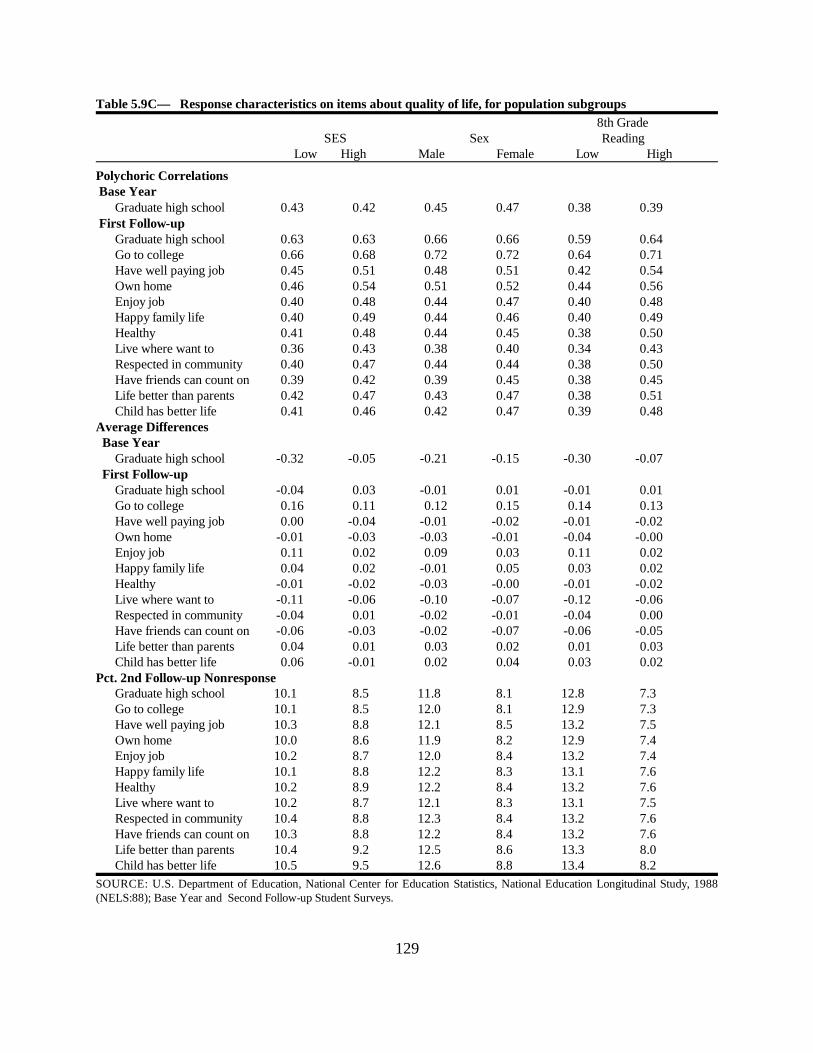
129
Table 5.9C— Response characteristics on items about quality of life, for population subgroups8th Grade
SES Sex ReadingLow High Male Female Low High
Polychoric Correlations Base Year
Graduate high school 0.43 0.42 0.45 0.47 0.38 0.39 First Follow-up
Graduate high school 0.63 0.63 0.66 0.66 0.59 0.64Go to college 0.66 0.68 0.72 0.72 0.64 0.71Have well paying job 0.45 0.51 0.48 0.51 0.42 0.54Own home 0.46 0.54 0.51 0.52 0.44 0.56Enjoy job 0.40 0.48 0.44 0.47 0.40 0.48Happy family life 0.40 0.49 0.44 0.46 0.40 0.49Healthy 0.41 0.48 0.44 0.45 0.38 0.50Live where want to 0.36 0.43 0.38 0.40 0.34 0.43Respected in community 0.40 0.47 0.44 0.44 0.38 0.50Have friends can count on 0.39 0.42 0.39 0.45 0.38 0.45Life better than parents 0.42 0.47 0.43 0.47 0.38 0.51Child has better life 0.41 0.46 0.42 0.47 0.39 0.48
Average Differences Base Year
Graduate high school -0.32 -0.05 -0.21 -0.15 -0.30 -0.07 First Follow-up
Graduate high school -0.04 0.03 -0.01 0.01 -0.01 0.01Go to college 0.16 0.11 0.12 0.15 0.14 0.13Have well paying job 0.00 -0.04 -0.01 -0.02 -0.01 -0.02Own home -0.01 -0.03 -0.03 -0.01 -0.04 -0.00Enjoy job 0.11 0.02 0.09 0.03 0.11 0.02Happy family life 0.04 0.02 -0.01 0.05 0.03 0.02Healthy -0.01 -0.02 -0.03 -0.00 -0.01 -0.02Live where want to -0.11 -0.06 -0.10 -0.07 -0.12 -0.06Respected in community -0.04 0.01 -0.02 -0.01 -0.04 0.00Have friends can count on -0.06 -0.03 -0.02 -0.07 -0.06 -0.05Life better than parents 0.04 0.01 0.03 0.02 0.01 0.03Child has better life 0.06 -0.01 0.02 0.04 0.03 0.02
Pct. 2nd Follow-up NonresponseGraduate high school 10.1 8.5 11.8 8.1 12.8 7.3Go to college 10.1 8.5 12.0 8.1 12.9 7.3Have well paying job 10.3 8.8 12.1 8.5 13.2 7.5Own home 10.0 8.6 11.9 8.2 12.9 7.4Enjoy job 10.2 8.7 12.0 8.4 13.2 7.4Happy family life 10.1 8.8 12.2 8.3 13.1 7.6Healthy 10.2 8.9 12.2 8.4 13.2 7.6Live where want to 10.2 8.7 12.1 8.3 13.1 7.5Respected in community 10.4 8.8 12.3 8.4 13.2 7.6Have friends can count on 10.3 8.8 12.2 8.4 13.2 7.6Life better than parents 10.4 9.2 12.5 8.6 13.3 8.0Child has better life 10.5 9.5 12.6 8.8 13.4 8.2
SOURCE: U.S. Department of Education, National Center for Education Statistics, National Education Longitudinal Study, 1988(NELS:88); Base Year and Second Follow-up Student Surveys.
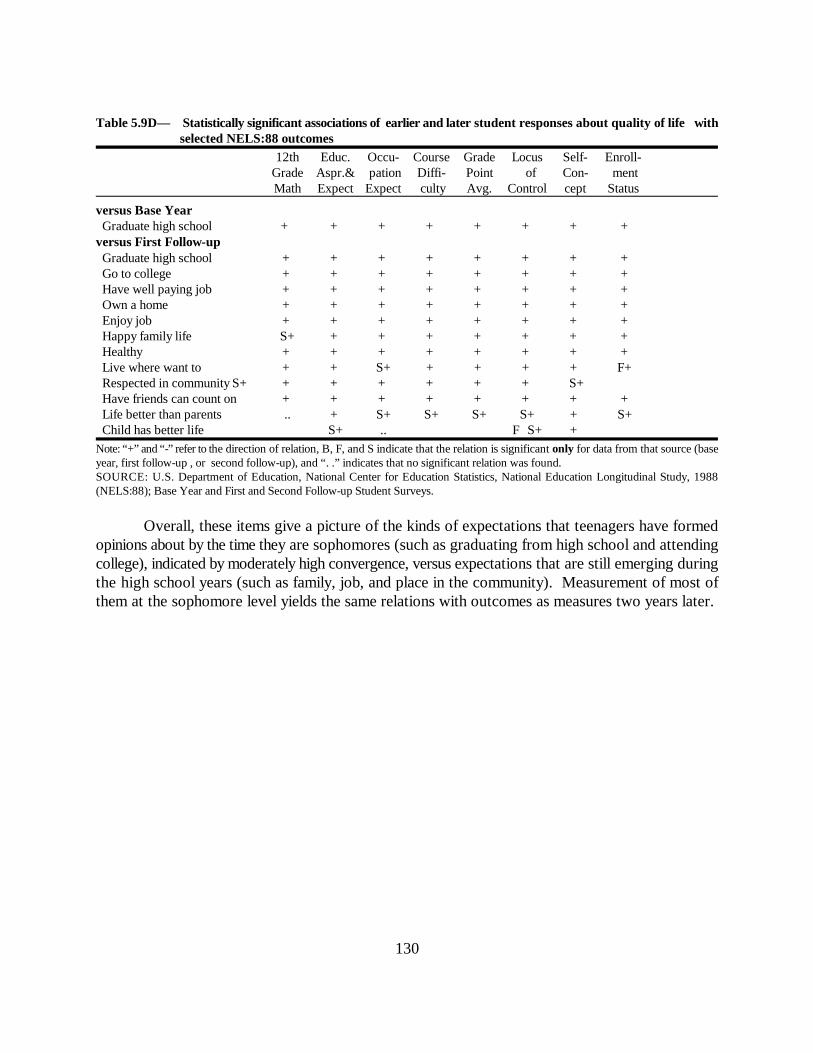
130
Table 5.9D— Statistically significant associations of earlier and later student responses about quality of life withselected NELS:88 outcomes
12th Educ. Occu- Course Grade Locus Self- Enroll-Grade Aspr.& pation Diffi- Point of Con- mentMath Expect Expect culty Avg. Control cept Status
versus Base Year Graduate high school + + + + + + + +versus First Follow-up Graduate high school + + + + + + + + Go to college + + + + + + + + Have well paying job + + + + + + + + Own a home + + + + + + + + Enjoy job + + + + + + + + Happy family life S+ + + + + + + + Healthy + + + + + + + + Live where want to + + S+ + + + + F+ Respected in community S+ + + + + + + S+ Have friends can count on + + + + + + + + Life better than parents .. + S+ S+ S+ S+ + S+ Child has better life S+ .. FS+ +
Note: “+” and “-” refer to the direction of relation, B, F, and S indicate that the relation is significant only for data from that source (baseyear, first follow-up , or second follow-up), and “. .” indicates that no significant relation was found.SOURCE: U.S. Department of Education, National Center for Education Statistics, National Education Longitudinal Study, 1988(NELS:88); Base Year and First and Second Follow-up Student Surveys.
Overall, these items give a picture of the kinds of expectations that teenagers have formedopinions about by the time they are sophomores (such as graduating from high school and attendingcollege), indicated by moderately high convergence, versus expectations that are still emerging duringthe high school years (such as family, job, and place in the community). Measurement of most ofthem at the sophomore level yields the same relations with outcomes as measures two years later.
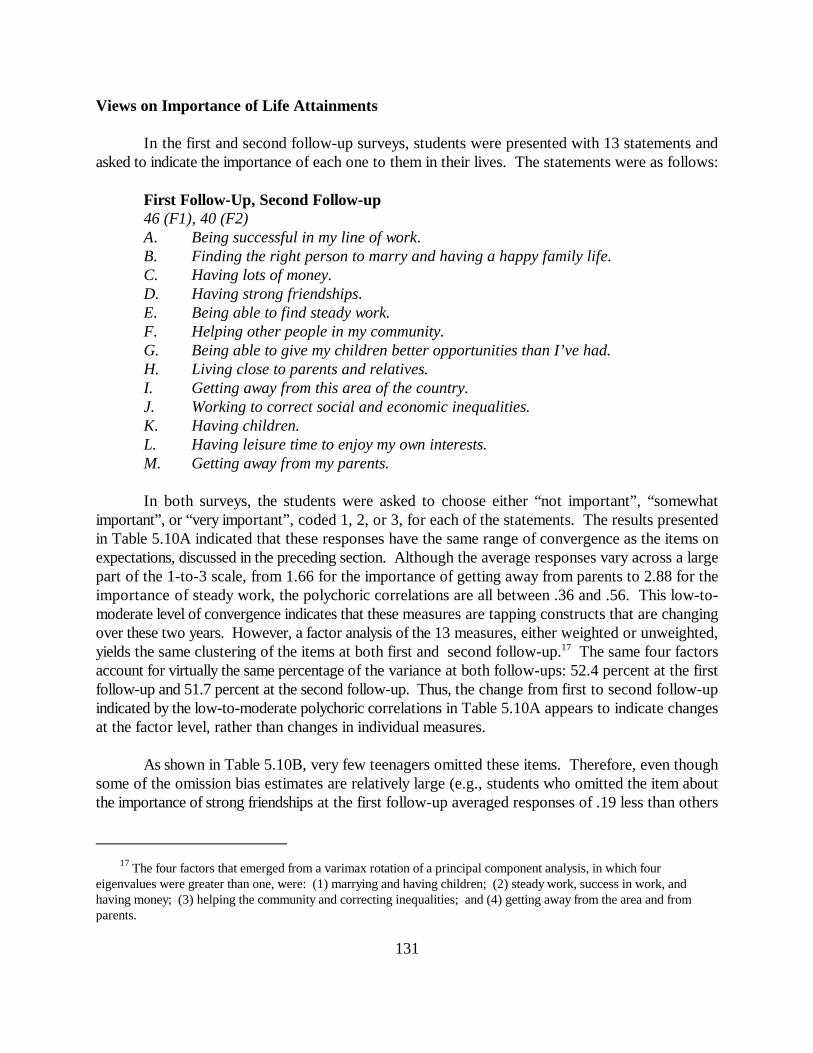
The four factors that emerged from a varimax rotation of a principal component analysis, in which four17
eigenvalues were greater than one, were: (1) marrying and having children; (2) steady work, success in work, andhaving money; (3) helping the community and correcting inequalities; and (4) getting away from the area and fromparents.
131
Views on Importance of Life Attainments
In the first and second follow-up surveys, students were presented with 13 statements andasked to indicate the importance of each one to them in their lives. The statements were as follows:
First Follow-Up, Second Follow-up46 (F1), 40 (F2) A. Being successful in my line of work.B. Finding the right person to marry and having a happy family life.C. Having lots of money.D. Having strong friendships.E. Being able to find steady work.F. Helping other people in my community.G. Being able to give my children better opportunities than I’ve had.H. Living close to parents and relatives.I. Getting away from this area of the country.J. Working to correct social and economic inequalities.K. Having children.L. Having leisure time to enjoy my own interests.M. Getting away from my parents.
In both surveys, the students were asked to choose either “not important”, “somewhatimportant”, or “very important”, coded 1, 2, or 3, for each of the statements. The results presentedin Table 5.10A indicated that these responses have the same range of convergence as the items onexpectations, discussed in the preceding section. Although the average responses vary across a largepart of the 1-to-3 scale, from 1.66 for the importance of getting away from parents to 2.88 for theimportance of steady work, the polychoric correlations are all between .36 and .56. This low-to-moderate level of convergence indicates that these measures are tapping constructs that are changingover these two years. However, a factor analysis of the 13 measures, either weighted or unweighted,yields the same clustering of the items at both first and second follow-up. The same four factors17
account for virtually the same percentage of the variance at both follow-ups: 52.4 percent at the firstfollow-up and 51.7 percent at the second follow-up. Thus, the change from first to second follow-upindicated by the low-to-moderate polychoric correlations in Table 5.10A appears to indicate changesat the factor level, rather than changes in individual measures.
As shown in Table 5.10B, very few teenagers omitted these items. Therefore, even thoughsome of the omission bias estimates are relatively large (e.g., students who omitted the item aboutthe importance of strong friendships at the first follow-up averaged responses of .19 less than others

132
when asked this question at the second follow-up [t=�6.22]), there should be little impact onestimates for the entire population.
Table 5.10A— Comparison of first and second follow-up student responses to items about importance of lifeattainments
Number of Polychoric Percent Mean Earlier Mean Second 2nd Follow-up -EarlierResponse Pairs Correlation Match Response Follow-up Response Difference
Success in work 16,140 0.39 80.7 2.83 2.87 0.04Marrying the right person 16,146 0.50 73.4 2.71 2.76 0.04Having lots of money 16,133 0.55 62.0 2.37 2.28 -0.09Strong friendships 16,121 0.46 75.9 2.79 2.78 -0.01Steady work 16,104 0.36 79.9 2.82 2.88 0.05Helping the community 16,094 0.45 60.3 2.23 2.26 0.03Child having better future 16,082 0.48 71.3 2.69 2.71 0.02Living close to parents 16,076 0.46 54.6 2.03 1.90 -0.13Getting away from area 16,083 0.43 51.1 1.67 1.78 0.11Correcting inequalities 16,045 0.36 51.0 1.89 1.93 0.05Having children 16,093 0.56 57.6 2.27 2.28 0.01Having leisure time 16,089 0.36 63.6 2.64 2.62 -0.02Getting away from parents 16,097 0.44 53.6 1.72 1.66 -0.06SOURCE: U.S. Department of Education, National Center for Education Statistics, National Education Longitudinal Study, 1988(NELS:88); First and Second Follow-up Student Surveys.
Table 5.10B— Comparison of first and second follow-up student nonresponse rates to items about importance oflife attainments
Percent 1st Follow-up 1st Follow-up Percent 2nd Follow-up 2nd Follow-upOmissions Omission Bias Omissions Omission Bias
Success in work 1.3 -0.16 0.9 -0.11Marrying the right person 1.3 -0.06 0.9 -0.10Having lots of money 1.3 0.05 0.9 -0.05Strong friendships 1.4 -0.19 0.9 -0.03Steady work 1.4 -0.06 1.0 -0.06Helping the community 1.4 0.00 1.0 -0.07Child having better future 1.5 0.07 1.0 -0.02Living close to parents 1.6 0.12 1.0 -0.04Getting away from area 1.5 0.05 1.0 0.08Correcting inequalities 1.6 0.05 1.1 0.09Having children 1.5 -0.14 1.0 -0.05Having leisure time 1.5 -0.13 1.0 -0.05Getting away from parents 1.4 -0.02 1.1 0.06SOURCE: U.S. Department of Education, National Center for Education Statistics, National Education Longitudinal Study, 1988(NELS:88); First and Second Follow-up Student Surveys.
The convergence of items differed across subpopulations, as shown in Table 5.10C, althoughthe polychoric correlations remained in the low-to-moderate range for all of the subpopulationsdisplayed. The responses of teenagers with high eighth grade reading scores were more convergent[t=2.58, 9.42, 8.37, 4.44, 6.20, 7.56, 12.1, 10.1, 9.65, 11.7, 12.0, 4.28, 6.01, respectively], as werethe responses of high SES respondents [t=3.55, 7.38, 6.58, 1.65, 5.67, 6.60, 7.00, 6.19, 4.32, 6.57,

133
7.08, 3.86, 4.09, respectively] and of female respondents [t=5.00, 6.21, 6.86, 8.58, 3.97, -.27, 5.09,1.76, 2.95, 2.82, 8.01, 1.89, 4.84, respectively].
Stability of some of the ratings but not others varied between subpopulations. Between firstto second follow-ups, respondents from low SES households and with low eighth grade readingscores were more likely than others to perceive increasing importance of success in work [t=7.72,10.13], steady work [t=5.26, 7.52], and creating better opportunities for their children [t=9.11, 9.12].Although the subpopulation differences in second follow-up omission rates were statisticallysignificant, it should be noted, the largest rate was still very small, 1.6 percent.
Finding significant relations between importance ratings and educational outcome measuresfrequently depends on whether the importance ratings are gathered at the tenth or twelfth grade level.As shown in Table 5.10D, for all but two of the importance dimensions, there is at least one outcomethat is significant at one time point but not the other. Most notable is the rating of importance ofbeing able to find steady work, which is positively related to second follow-up outcome measures ifmeasured at the first follow-up, but not if measured at the second follow-up.
Importance ratings at the two time periods therefore cannot be used interchangeably inanalyses of relations of student values and achievement in school. Changes in some importanceratings vary systematically between population subgroups, and the relations between importanceratings and outcomes changes.

134
Table 5.10C— Response characteristics on items about importance of life attainments, for population subgroups
8th GradeSES Sex Reading
Low High Male Female Low High
Polychoric CorrelationsSuccess in work 0.38 0.43 0.36 0.42 0.37 0.40Marrying the right person 0.46 0.55 0.46 0.53 0.44 0.55Having lots of money 0.51 0.59 0.49 0.57 0.49 0.58Strong friendships 0.44 0.46 0.41 0.52 0.41 0.47Steady work 0.32 0.40 0.33 0.38 0.31 0.40Helping the community 0.41 0.49 0.44 0.43 0.40 0.50Child having better future 0.41 0.51 0.45 0.51 0.38 0.54Living close to parents 0.41 0.49 0.44 0.47 0.38 0.51Getting away from area 0.40 0.46 0.41 0.45 0.36 0.49Correcting inequalities 0.31 0.41 0.33 0.37 0.27 0.44Having children 0.52 0.60 0.51 0.60 0.49 0.62Having leisure time 0.32 0.38 0.35 0.37 0.32 0.38Getting away from parents 0.42 0.47 0.41 0.47 0.39 0.47
Average DifferencesSuccess in work 0.07 0.01 0.05 0.04 0.08 0.01Marrying the right person 0.06 0.03 0.06 0.03 0.07 0.02Having lots of money -0.06 -0.12 -0.09 -0.09 -0.06 -0.11Strong friendships -0.02 -0.01 0.01 -0.04 -0.02 -0.01Steady work 0.08 0.02 0.07 0.04 0.09 0.02Helping the community 0.02 0.03 0.04 0.02 0.02 0.04Child having better future 0.07 -0.03 0.04 0.00 0.07 -0.02Living close to parents -0.11 -0.14 -0.15 -0.10 -0.12 -0.14Getting away from area 0.10 0.11 0.12 0.09 0.10 0.11Correcting inequalities 0.06 0.03 0.03 0.06 0.04 0.05Having children 0.03 -0.00 -0.01 0.04 0.02 0.01Having leisure time -0.01 -0.02 -0.00 -0.04 -0.00 -0.03Getting away from parents -0.09 -0.05 -0.04 -0.08 -0.07 -0.05
Pct. 2nd Follow-up NonresponseSuccess in work 1.0 0.7 1.1 0.7 1.2 0.5Marrying the right person 1.0 0.7 1.1 0.6 1.2 0.6Having lots of money 1.1 0.7 1.2 0.7 1.3 0.6Strong friendships 1.1 0.7 1.1 0.7 1.3 0.5Steady work 1.2 0.7 1.2 0.7 1.4 0.6Helping the community 1.3 0.7 1.3 0.8 1.4 0.6Child having better future 1.2 0.8 1.3 0.8 1.4 0.7Living close to parents 1.2 0.7 1.2 0.8 1.4 0.6Getting away from area 1.2 0.8 1.3 0.8 1.4 0.7Correcting inequalities 1.3 0.8 1.4 0.9 1.6 0.7Having children 1.1 0.8 1.2 0.8 1.4 0.6Having leisure time 1.2 0.8 1.2 0.8 1.5 0.6Getting away from parents 1.3 0.8 1.3 0.8 1.5 0.6
SOURCE: U.S. Department of Education, National Center for Education Statistics, National Education Longitudinal Study, 1988(NELS:88); First and Second Follow-up Student Surveys.

135
Table 5.10D— Statistically significant associations of first and second follow-up student responses aboutimportance of life attainments with selected NELS:88 outcomes
12th Educ. Occu- Course Grade Locus Self- Enroll-Grade Aspr.& pation Diffi- Point of Con- mentMath Expect Expect culty Avg. Control cept Status
Success in work + + + + + + + + Marrying the right person + F+ + + + + + F+Having lots of money � � � F� � � S+ ..Strong friendships + + + + + + S+ + Steady work F+S� F+ F+ F+ F+ + + F+Helping the community F� + + .. S+ + + ..Child having better future � S� S� � � .. + �Living close to parents � .. .. .. .. .. S+ ..Getting away from area � F� .. F� � � � S�Correcting inequalities .. + + + + F+ + ..Having children + + + + + + + + Having leisure time + + + + + F+ + +Getting away from parents � � � � � � � F�SOURCE: NELS:88 First and Second Follow-up Student Surveys.Note: “+” and “-” refer to the direction of relation, B, F, and S indicate that the relation is significant only for data from that source (baseyear, first follow-up, or second follow-up), and “. .” indicates that no significant relation was found.
High School Program
Students were asked about their high school program on the first follow-up questionnaire andagain on the second follow-up questionnaire. The statements were as follows:
First Follow-up 20 Which of the following best describes your present program?
A. General high school programB. College prep, academic, or specialized academic (such as Science or Math)C. Vocational technical, or business and career
— Industrial arts/Technology education— Agricultural occupations— Business or office occupations— Marketing or Distributive education— Health occupations— Home economics occupations— Consumer and homemaking education— Technical occupations— Trade or industrial occupations— Other specialized high school program (such as Fine Arts)
D. OtherE. I don’t know

136
Students were asked a similar question in the second follow-up:
Second Follow-Up 12A Which of the following best describes your present high school program?
A. General high school programB. College prep, academic, or specialized academic (such as Science or Math)C. Vocational technical, or business and career...
— Industrial arts/Technology education— Agricultural occupations— Business or office occupations— Marketing or Distributive education— Health occupations— Home economics occupations— Consumer and homemaking education— Technical occupations— Trade or industrial occupations
D. Other specialized high school program (such as Fine Arts)E. Special Education ProgramF. I don’t knowG. Alternative, Stay-in-School, or Dropout Prevention Program
For the following comparisons of first and second follow-up reports of high school academicprogram, responses were collapsed into three dichotomous indicators: (C) vocational, (B) academic,and (A) general. Students who selected response alternatives D,E,F, or G were counted in thisanalysis as respondents indicating none of the main three tracks. Note that Fine Arts was notincluded in the vocational track on either follow-up for this analysis.
Table 5.11A summarizes the correspondence between students’ first follow-up and secondfollow-up reports of their high school programs.
Table 5.11A— Comparison of first and second follow-up student responses to items about students’ high schoolprogram
Number of Polychoric Percent Mean Earlier Mean Second 2nd Follow-up - EarlierResponse Pairs Correlation Match Response Follow-up Response Difference
Vocational track 14,476 0.53 87.4 0.08 0.11 0.03College prep. track 14,476 0.74 76.3 0.39 0.47 0.08General track 14,476 0.50 68.1 0.41 0.35 -0.06Note: The mean responses sum to less than 1.00 to the extent that students indicated one of the “other” programs (D, E, F, and G, above).SOURCE: U.S. Department of Education, National Center for Education Statistics, National Education Longitudinal Study, 1988(NELS:88); First and Second Follow-up Student Surveys.
These results suggest that in both the first and second follow-up years, students mostfrequently identified their high school program as either academic or general; and more of them werelikely to consider their program academic in the second follow-up [t=18.82]. The polychoric

137
correlation was fairly high for the academic program indicator, but only moderate for the others.Whether that is an indication of different rates of changing programs or of different levels of surveyitem interpretation is not clear.
Table 5.11B reports nonresponse rates and statistics assessing the likely bias fromnonresponse. Very few data were missing for these two items—2 percent on the first follow-up andless than 1 percent on the second follow-up. However, despite such high response rates, the statisticssuggest some nonresponse bias: at each follow-up, fewer of the nonrespondents than respondents (13percent and 18 percent) indicated an academic track at the other follow-up [t=-4.30, -3.96].
Table 5.11B— Comparison of first and second follow-up student nonresponse rates to items about students’ highschool program
Percent 1st Follow-up 1st Follow-up Percent 2nd Follow-up 2nd Follow-upOmissions Omission Bias Omissions Omission Bias
Vocational track 2.0 0.07 0.8 0.13College prep. track 2.0 -0.13 0.8 -0.18General track 2.0 0.03 0.8 0.03SOURCE: U.S. Department of Education, National Center for Education Statistics, National Education Longitudinal Study, 1988(NELS:88); First and Second Follow-up Student Surveys.
The analysis was repeated for various subgroups to determine whether students in differentgroups demonstrated different response patterns on the two items. Table 5.11C reports theassociations between students’ first and second follow-up responses to this item pair by subgroup.For the vocational and general program indicators, there was greater convergence for high SES[t=4.21, 9.21] and high reading score students [t=5.85, 11.7]; however, this was not true for theacademic program indicator, indirectly suggesting that the higher reading skills of academic programstudents are responsible for the greater convergence of the academic indicator.
Table 5.11C— Response characteristics on items about students’ school program, for population subgroups
8th GradeSES Sex Reading
Low High Male Female Low HighPolychoric Correlations
Vocational track 0.49 0.54 0.54 0.52 0.46 0.54College prep. track 0.74 0.71 0.74 0.74 0.70 0.69General track 0.44 0.56 0.49 0.51 0.41 0.56
Average DifferencesVocational track 0.04 0.01 0.01 0.04 0.03 0.03College prep. track 0.05 0.11 0.07 0.08 0.05 0.09General track -0.03 -0.09 -0.04 -0.08 -0.00 -0.10
Pct. 2nd Follow-up NonresponseVocational track 1.0 0.5 0.8 0.7 1.2 0.4College prep. track 1.0 0.5 0.8 0.7 1.2 0.4General track 1.0 0.5 0.8 0.7 1.2 0.4
SOURCE: U.S. Department of Education, National Center for Education Statistics, National Education Longitudinal Study, 1988(NELS:88); First and Second Follow-up Student Surveys.
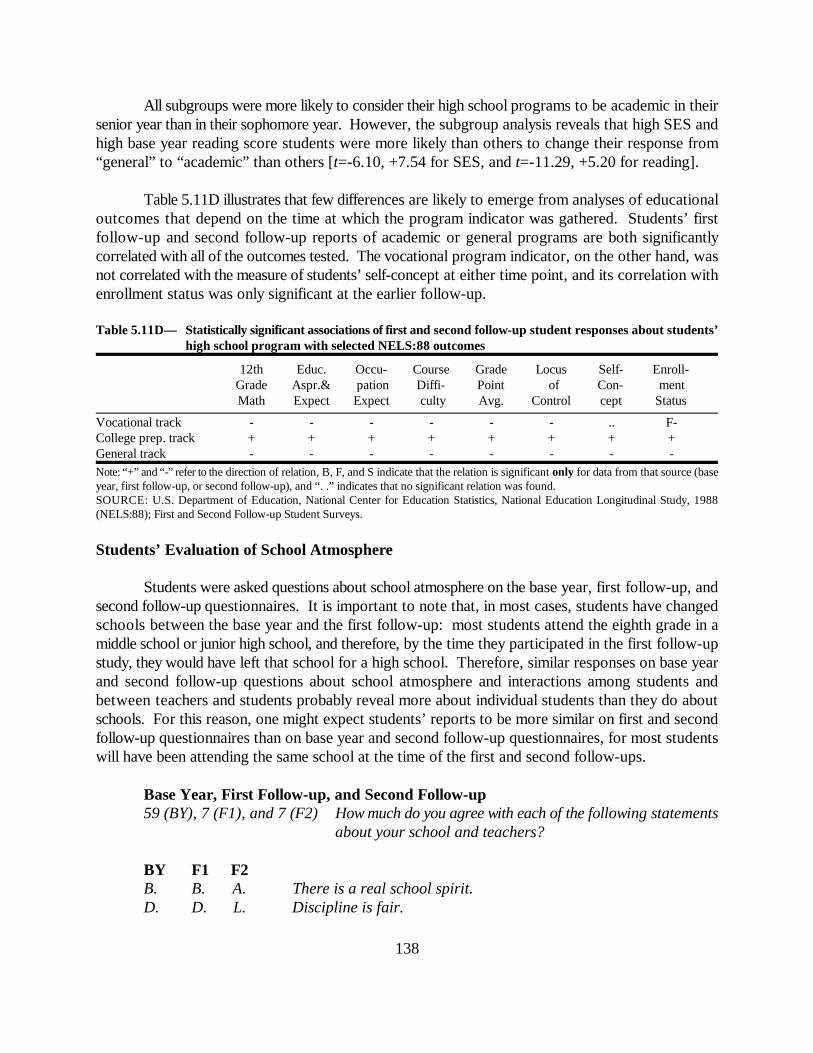
138
All subgroups were more likely to consider their high school programs to be academic in theirsenior year than in their sophomore year. However, the subgroup analysis reveals that high SES andhigh base year reading score students were more likely than others to change their response from“general” to “academic” than others [t=-6.10, +7.54 for SES, and t=-11.29, +5.20 for reading].
Table 5.11D illustrates that few differences are likely to emerge from analyses of educationaloutcomes that depend on the time at which the program indicator was gathered. Students’ firstfollow-up and second follow-up reports of academic or general programs are both significantlycorrelated with all of the outcomes tested. The vocational program indicator, on the other hand, wasnot correlated with the measure of students’ self-concept at either time point, and its correlation withenrollment status was only significant at the earlier follow-up.
Table 5.11D— Statistically significant associations of first and second follow-up student responses about students’high school program with selected NELS:88 outcomes
12th Educ. Occu- Course Grade Locus Self- Enroll-Grade Aspr.& pation Diffi- Point of Con- mentMath Expect Expect culty Avg. Control cept Status
Vocational track - - - - - - .. F-College prep. track + + + + + + + +General track - - - - - - - -Note: “+” and “-” refer to the direction of relation, B, F, and S indicate that the relation is significant only for data from that source (baseyear, first follow-up, or second follow-up), and “. .” indicates that no significant relation was found.SOURCE: U.S. Department of Education, National Center for Education Statistics, National Education Longitudinal Study, 1988(NELS:88); First and Second Follow-up Student Surveys.
Students’ Evaluation of School Atmosphere
Students were asked questions about school atmosphere on the base year, first follow-up, andsecond follow-up questionnaires. It is important to note that, in most cases, students have changedschools between the base year and the first follow-up: most students attend the eighth grade in amiddle school or junior high school, and therefore, by the time they participated in the first follow-upstudy, they would have left that school for a high school. Therefore, similar responses on base yearand second follow-up questions about school atmosphere and interactions among students andbetween teachers and students probably reveal more about individual students than they do aboutschools. For this reason, one might expect students’ reports to be more similar on first and secondfollow-up questionnaires than on base year and second follow-up questionnaires, for most studentswill have been attending the same school at the time of the first and second follow-ups.
Base Year, First Follow-up, and Second Follow-up59 (BY), 7 (F1), and 7 (F2) How much do you agree with each of the following statements
about your school and teachers?
BY F1 F2B. B. A. There is a real school spirit.D. D. L. Discipline is fair.
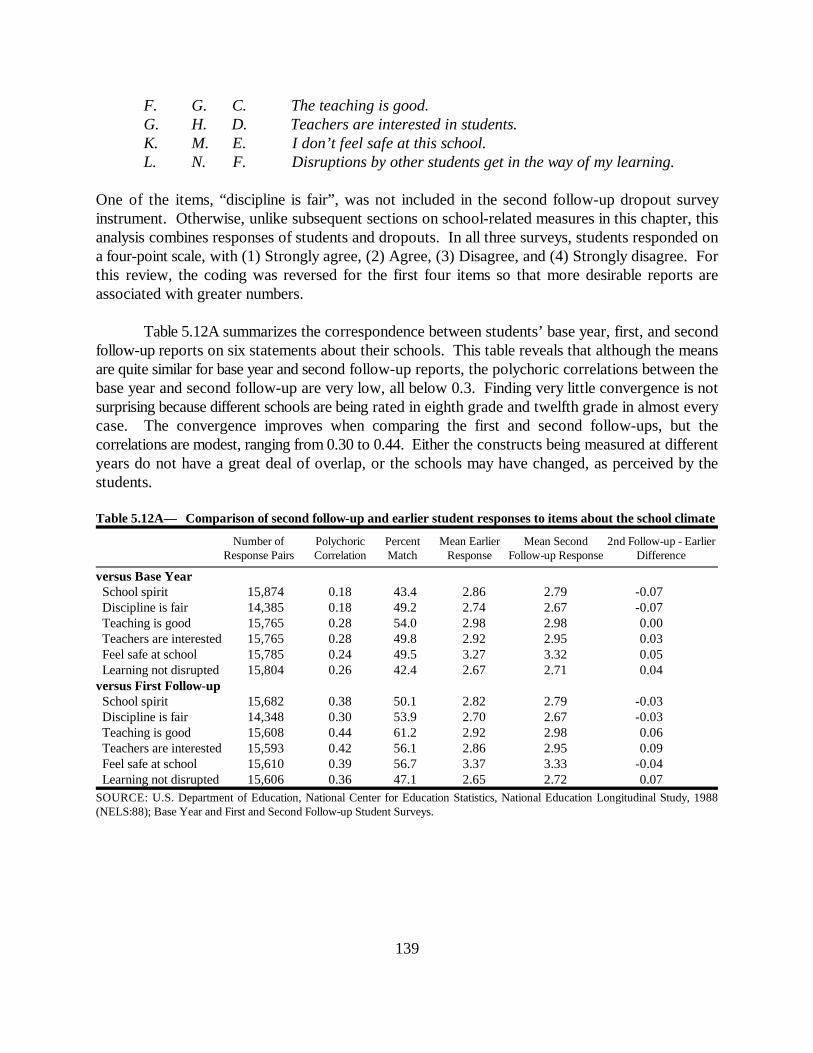
139
F. G. C. The teaching is good.G. H. D. Teachers are interested in students.K. M. E. I don’t feel safe at this school.L. N. F. Disruptions by other students get in the way of my learning.
One of the items, “discipline is fair”, was not included in the second follow-up dropout surveyinstrument. Otherwise, unlike subsequent sections on school-related measures in this chapter, thisanalysis combines responses of students and dropouts. In all three surveys, students responded ona four-point scale, with (1) Strongly agree, (2) Agree, (3) Disagree, and (4) Strongly disagree. Forthis review, the coding was reversed for the first four items so that more desirable reports areassociated with greater numbers.
Table 5.12A summarizes the correspondence between students’ base year, first, and secondfollow-up reports on six statements about their schools. This table reveals that although the meansare quite similar for base year and second follow-up reports, the polychoric correlations between thebase year and second follow-up are very low, all below 0.3. Finding very little convergence is notsurprising because different schools are being rated in eighth grade and twelfth grade in almost everycase. The convergence improves when comparing the first and second follow-ups, but thecorrelations are modest, ranging from 0.30 to 0.44. Either the constructs being measured at differentyears do not have a great deal of overlap, or the schools may have changed, as perceived by thestudents.
Table 5.12A— Comparison of second follow-up and earlier student responses to items about the school climate
Number of Polychoric Percent Mean Earlier Mean Second 2nd Follow-up - EarlierResponse Pairs Correlation Match Response Follow-up Response Difference
versus Base Year School spirit 15,874 0.18 43.4 2.86 2.79 -0.07 Discipline is fair 14,385 0.18 49.2 2.74 2.67 -0.07 Teaching is good 15,765 0.28 54.0 2.98 2.98 0.00 Teachers are interested 15,765 0.28 49.8 2.92 2.95 0.03 Feel safe at school 15,785 0.24 49.5 3.27 3.32 0.05 Learning not disrupted 15,804 0.26 42.4 2.67 2.71 0.04versus First Follow-up School spirit 15,682 0.38 50.1 2.82 2.79 -0.03 Discipline is fair 14,348 0.30 53.9 2.70 2.67 -0.03 Teaching is good 15,608 0.44 61.2 2.92 2.98 0.06 Teachers are interested 15,593 0.42 56.1 2.86 2.95 0.09 Feel safe at school 15,610 0.39 56.7 3.37 3.33 -0.04 Learning not disrupted 15,606 0.36 47.1 2.65 2.72 0.07SOURCE: U.S. Department of Education, National Center for Education Statistics, National Education Longitudinal Study, 1988(NELS:88); Base Year and First and Second Follow-up Student Surveys.
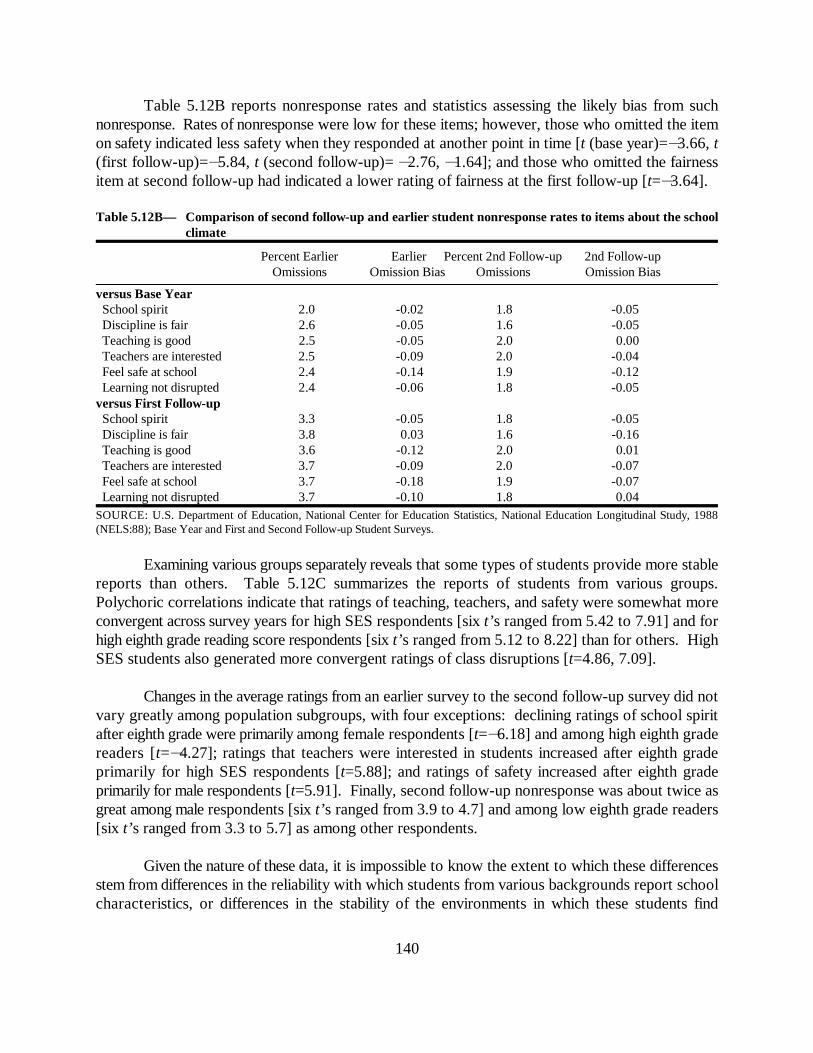
140
Table 5.12B reports nonresponse rates and statistics assessing the likely bias from suchnonresponse. Rates of nonresponse were low for these items; however, those who omitted the itemon safety indicated less safety when they responded at another point in time [t (base year)=�3.66, t(first follow-up)=�5.84, t (second follow-up)= �2.76, �1.64]; and those who omitted the fairnessitem at second follow-up had indicated a lower rating of fairness at the first follow-up [t=�3.64].
Table 5.12B— Comparison of second follow-up and earlier student nonresponse rates to items about the schoolclimate
Percent Earlier Earlier Percent 2nd Follow-up 2nd Follow-upOmissions Omission Bias Omissions Omission Bias
versus Base Year School spirit 2.0 -0.02 1.8 -0.05 Discipline is fair 2.6 -0.05 1.6 -0.05 Teaching is good 2.5 -0.05 2.0 0.00 Teachers are interested 2.5 -0.09 2.0 -0.04 Feel safe at school 2.4 -0.14 1.9 -0.12 Learning not disrupted 2.4 -0.06 1.8 -0.05versus First Follow-up School spirit 3.3 -0.05 1.8 -0.05 Discipline is fair 3.8 0.03 1.6 -0.16 Teaching is good 3.6 -0.12 2.0 0.01 Teachers are interested 3.7 -0.09 2.0 -0.07 Feel safe at school 3.7 -0.18 1.9 -0.07 Learning not disrupted 3.7 -0.10 1.8 0.04SOURCE: U.S. Department of Education, National Center for Education Statistics, National Education Longitudinal Study, 1988(NELS:88); Base Year and First and Second Follow-up Student Surveys.
Examining various groups separately reveals that some types of students provide more stablereports than others. Table 5.12C summarizes the reports of students from various groups.Polychoric correlations indicate that ratings of teaching, teachers, and safety were somewhat moreconvergent across survey years for high SES respondents [six t’s ranged from 5.42 to 7.91] and forhigh eighth grade reading score respondents [six t’s ranged from 5.12 to 8.22] than for others. HighSES students also generated more convergent ratings of class disruptions [t=4.86, 7.09].
Changes in the average ratings from an earlier survey to the second follow-up survey did notvary greatly among population subgroups, with four exceptions: declining ratings of school spiritafter eighth grade were primarily among female respondents [t=�6.18] and among high eighth gradereaders [t=�4.27]; ratings that teachers were interested in students increased after eighth gradeprimarily for high SES respondents [t=5.88]; and ratings of safety increased after eighth gradeprimarily for male respondents [t=5.91]. Finally, second follow-up nonresponse was about twice asgreat among male respondents [six t’s ranged from 3.9 to 4.7] and among low eighth grade readers[six t’s ranged from 3.3 to 5.7] as among other respondents.
Given the nature of these data, it is impossible to know the extent to which these differencesstem from differences in the reliability with which students from various backgrounds report schoolcharacteristics, or differences in the stability of the environments in which these students find
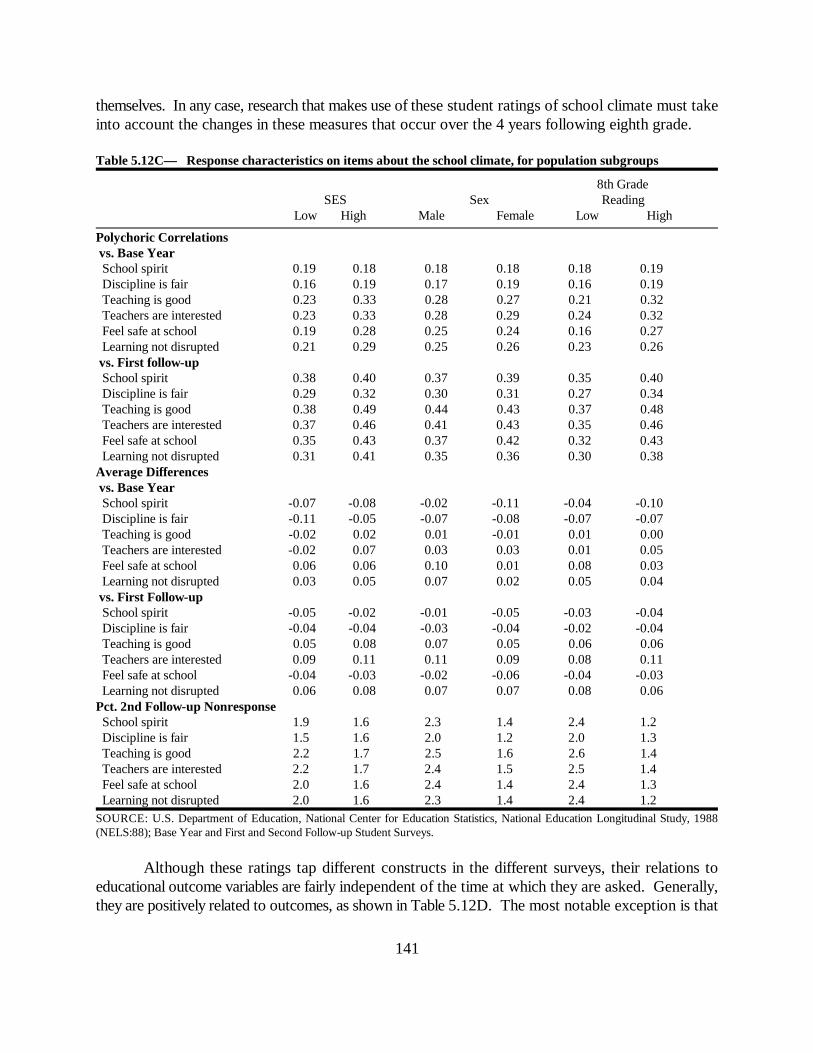
141
themselves. In any case, research that makes use of these student ratings of school climate must takeinto account the changes in these measures that occur over the 4 years following eighth grade.
Table 5.12C— Response characteristics on items about the school climate, for population subgroups
8th GradeSES Sex Reading
Low High Male Female Low High
Polychoric Correlations vs. Base Year School spirit 0.19 0.18 0.18 0.18 0.18 0.19 Discipline is fair 0.16 0.19 0.17 0.19 0.16 0.19 Teaching is good 0.23 0.33 0.28 0.27 0.21 0.32 Teachers are interested 0.23 0.33 0.28 0.29 0.24 0.32 Feel safe at school 0.19 0.28 0.25 0.24 0.16 0.27 Learning not disrupted 0.21 0.29 0.25 0.26 0.23 0.26 vs. First follow-up School spirit 0.38 0.40 0.37 0.39 0.35 0.40 Discipline is fair 0.29 0.32 0.30 0.31 0.27 0.34 Teaching is good 0.38 0.49 0.44 0.43 0.37 0.48 Teachers are interested 0.37 0.46 0.41 0.43 0.35 0.46 Feel safe at school 0.35 0.43 0.37 0.42 0.32 0.43 Learning not disrupted 0.31 0.41 0.35 0.36 0.30 0.38Average Differences vs. Base Year School spirit -0.07 -0.08 -0.02 -0.11 -0.04 -0.10 Discipline is fair -0.11 -0.05 -0.07 -0.08 -0.07 -0.07 Teaching is good -0.02 0.02 0.01 -0.01 0.01 0.00 Teachers are interested -0.02 0.07 0.03 0.03 0.01 0.05 Feel safe at school 0.06 0.06 0.10 0.01 0.08 0.03 Learning not disrupted 0.03 0.05 0.07 0.02 0.05 0.04 vs. First Follow-up School spirit -0.05 -0.02 -0.01 -0.05 -0.03 -0.04 Discipline is fair -0.04 -0.04 -0.03 -0.04 -0.02 -0.04 Teaching is good 0.05 0.08 0.07 0.05 0.06 0.06 Teachers are interested 0.09 0.11 0.11 0.09 0.08 0.11 Feel safe at school -0.04 -0.03 -0.02 -0.06 -0.04 -0.03 Learning not disrupted 0.06 0.08 0.07 0.07 0.08 0.06Pct. 2nd Follow-up Nonresponse School spirit 1.9 1.6 2.3 1.4 2.4 1.2 Discipline is fair 1.5 1.6 2.0 1.2 2.0 1.3 Teaching is good 2.2 1.7 2.5 1.6 2.6 1.4 Teachers are interested 2.2 1.7 2.4 1.5 2.5 1.4 Feel safe at school 2.0 1.6 2.4 1.4 2.4 1.3 Learning not disrupted 2.0 1.6 2.3 1.4 2.4 1.2SOURCE: U.S. Department of Education, National Center for Education Statistics, National Education Longitudinal Study, 1988(NELS:88); Base Year and First and Second Follow-up Student Surveys.
Although these ratings tap different constructs in the different surveys, their relations toeducational outcome variables are fairly independent of the time at which they are asked. Generally,they are positively related to outcomes, as shown in Table 5.12D. The most notable exception is that
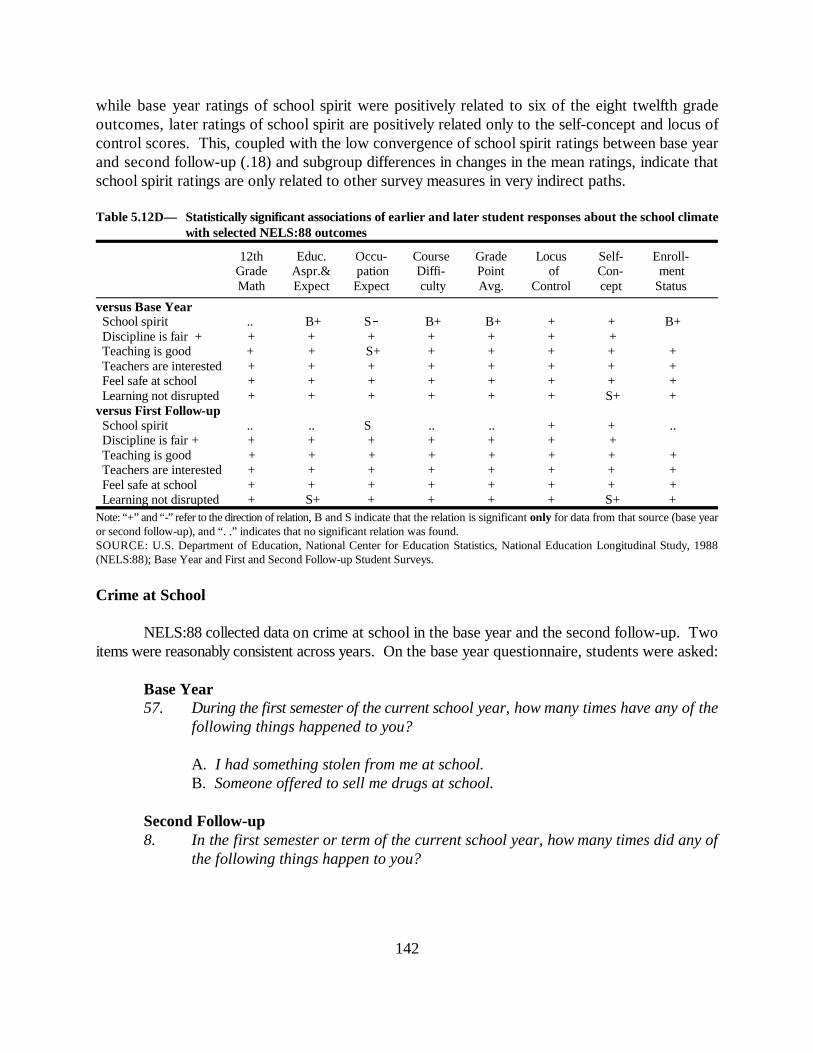
142
while base year ratings of school spirit were positively related to six of the eight twelfth gradeoutcomes, later ratings of school spirit are positively related only to the self-concept and locus ofcontrol scores. This, coupled with the low convergence of school spirit ratings between base yearand second follow-up (.18) and subgroup differences in changes in the mean ratings, indicate thatschool spirit ratings are only related to other survey measures in very indirect paths. Table 5.12D— Statistically significant associations of earlier and later student responses about the school climate
with selected NELS:88 outcomes
12th Educ. Occu- Course Grade Locus Self- Enroll-Grade Aspr.& pation Diffi- Point of Con- mentMath Expect Expect culty Avg. Control cept Status
versus Base Year School spirit .. B+ S B+ B+ + + B+ Discipline is fair + + + + + + + + Teaching is good + + S+ + + + + + Teachers are interested + + + + + + + + Feel safe at school + + + + + + + + Learning not disrupted + + + + + + S+ +versus First Follow-up School spirit .. .. S .. .. + + .. Discipline is fair + + + + + + + + Teaching is good + + + + + + + + Teachers are interested + + + + + + + + Feel safe at school + + + + + + + + Learning not disrupted + S+ + + + + S+ +Note: “+” and “-” refer to the direction of relation, B and S indicate that the relation is significant only for data from that source (base yearor second follow-up), and “. .” indicates that no significant relation was found.SOURCE: U.S. Department of Education, National Center for Education Statistics, National Education Longitudinal Study, 1988(NELS:88); Base Year and First and Second Follow-up Student Surveys.
Crime at School
NELS:88 collected data on crime at school in the base year and the second follow-up. Twoitems were reasonably consistent across years. On the base year questionnaire, students were asked:
Base Year57. During the first semester of the current school year, how many times have any of the
following things happened to you?
A. I had something stolen from me at school.B. Someone offered to sell me drugs at school.
Second Follow-up8. In the first semester or term of the current school year, how many times did any of
the following things happen to you?

143
A. I had something stolen from me at school.B. Someone offered to sell me drugs at school.
On both items, students selected from three alternative responses: 0 = Never, 1 = Once or twice, 2= More than twice.
Table 5.13A reports the correspondence between base year and second follow-up reports tothe two crime items. As the table makes clear, these responses are not very stable over time.Students report being less likely to have had something stolen during twelfth grade [t=�33.07], butmore likely to have been offered drugs [t=26.98]. In addition, fairly low polychoric correlationssuggest that these mean differences do not tell the whole story. The polychoric correlation betweenthe base year and second follow-up is 0.23 for the question about theft, and 0.41 for the questionabout drugs. Because responses on these two items in most cases reflect students’ experiences at twodifferent schools, the middle or junior high school and the high school, expectations of stability overtime are hard to establish.
Table 5.13A— Comparison of second follow-up and base year student responses to items about crime at school
Number of Polychoric Percent Mean Base Year Mean Second 2nd Follow-up - Base YearResponse Pairs Correlation Match Response Follow-up Response Difference
Had something stolen 14,489 0.23 52.5 0.56 0.35 -0.21Was offered drugs 14,471 0.41 80.4 0.10 0.23 0.13SOURCE: U.S. Department of Education, National Center for Education Statistics, National Education Longitudinal Study, 1988(NELS:88); Base Year and Second Follow-up Student Surveys.
As shown in Table 5.13B, nonresponse on these items was below 3 percent. With such highresponse, the opportunity for nonresponse bias is small. Table 5.13B reveals no evidence ofnonresponse bias.
Table 5.13B— Comparison of second follow-up and base year student nonresponse rates to items about crime atschool
Percent Base Year Base Year Percent 2nd Follow-up 2nd Follow-upOmissions Omission Bias Omissions Omission Bias
Had something stolen 2.1 0.01 1.4 0.05Was offered drugs 2.2 0.08 1.5 0.03SOURCE: U.S. Department of Education, National Center for Education Statistics, National Education Longitudinal Study, 1988(NELS:88); Base Year and Second Follow-up Student Surveys.
Table 5.13C reports the convergence statistics separately for several subgroups. Examinationof the polychoric correlations and average differences reveals that the increase in reports of offers ofdrugs at second follow-up occurred primarily among male students [t=-15.4].

144
Table 5.13C— Response characteristics on items about crime at school, for population subgroups
8th GradeSES Sex Reading
Low High Male Female Low High
Polychoric Correlations Had something stolen 0.24 0.21 0.22 0.22 0.22 0.22 Was offered drugs 0.39 0.45 0.41 0.38 0.40 0.43Average Differences Had something stolen -0.23 -0.19 -0.22 -0.20 -0.23 -0.20 Was offered drugs 0.11 0.15 0.21 0.06 0.14 0.13Pct. 2nd Follow-up Nonresponse Had something stolen 1.4 1.3 1.7 1.1 1.8 1.0 Was offered drugs 1.5 1.3 1.7 1.2 1.9 1.1SOURCE: U.S. Department of Education, National Center for Education Statistics, National Education Longitudinal Study, 1988(NELS:88); Base Year and Second Follow-up Student Surveys.
Table 5.13D presents the results of the analysis of the association between students’ base yearand second follow-up reports and several key outcome measures. The table reveals the generalnegative relationship between these events and educational outcomes, but the relations to self-conceptdepend on when the reports were given. Having something stolen is negatively related to self-concept, but only when reported at the second follow-up, and being offered drugs is negativelyrelated to self-concept, but only when reported at the base year. In both cases, at the time reportsof the crime were more frequent, there was no significant relation to self-concept.
Table 5.13D— Statistically significant associations of base year and second follow-up student responses aboutcrime at school with selected NELS:88 outcomes
12th Educ. Occu- Course Grade Locus Self- Enroll-Grade Aspr.& pation Diffi- Point of Con- mentMath Expect Expect culty Avg. Control cept Status
Had something stolen .. .. S BWas offered drugs B
Note: “+” and “-” refer to the direction of relation, B and S indicate that the relation is significant only for data from that source (base yearor second follow-up), and “. .” indicates that no significant relation was found. SOURCE: U.S. Department of Education, National Center for Education Statistics, National Education Longitudinal Study, 1988(NELS:88); Base Year and Second Follow-up Student Surveys.
Student Participation in Special Programs
Students were asked during both the base year and the second follow-up about theirparticipation in special academic programs. These items were not identical on the two questionnaires.Students were asked two separate questions during the base year:
Base Year68. Are you enrolled in any of the following special programs/services?
A. Classes for gifted or talented students

145
B. Special instruction for those whose first language is not English—forexample, bilingual education or English as a second language (not regularEnglish classes)
66. Are you enrolled in advanced, enriched, or accelerated courses in any of thefollowing areas?
A. English (language arts)B. Social studiesC. ScienceD Mathematics
Second Follow-up13. Have you ever been in any of the following kinds of courses or programs in high
school?
D. English as a Second Language programE. Advanced placement programJ. A program for the gifted and talented
Responses are coded on the NELS:88 CD-ROM data file as 1, for reported participation, and 2, forreported nonparticipation, but for the present analyses, nonparticipation was recoded as 0.
Analysis of correspondence between these items is problematic on several accounts. First ofall, the items asking about enrollment in advanced courses are very dissimilar, and therefore do notnecessarily indicate comparable academic programs during each of the two years: for purposes of thepresent analysis, a student’s affirmative response to any of the four items in question 66 wasconsidered a “yes” and compared to students’ high school enrollment in an advanced placementprogram (item 13E). Second, the base year questionnaire asks students about their enrollment inspecial programs during the school year when the survey was administered. The second follow-upquestionnaire, however, asks students to report their participation in special programs during any oftheir high school years. Finally, there may be real changes in participation, and the extent to whichthe instability follows from real change versus poor measurement is not clear.
As with many of the other items in this chapter, this item, reported accurately, should changeover time. As students make their way through high school, they encounter additional opportunitiesto enter a special program. Also, students need only to enroll in such a program during one year ofhigh school to respond affirmatively to these items at the second follow-up; therefore, it would beexpected that more students would respond affirmatively to the second follow-up items than to thesimilar base year items. Similarly, students enrolled in an English as a second language programduring the base year may no longer require the services of such a program in subsequent years. (Also,it seems likely that, for the most part, students not enrolled in an ESL program during the base yearwill not be enrolled in such a program during high school.) Nevertheless, whether events are
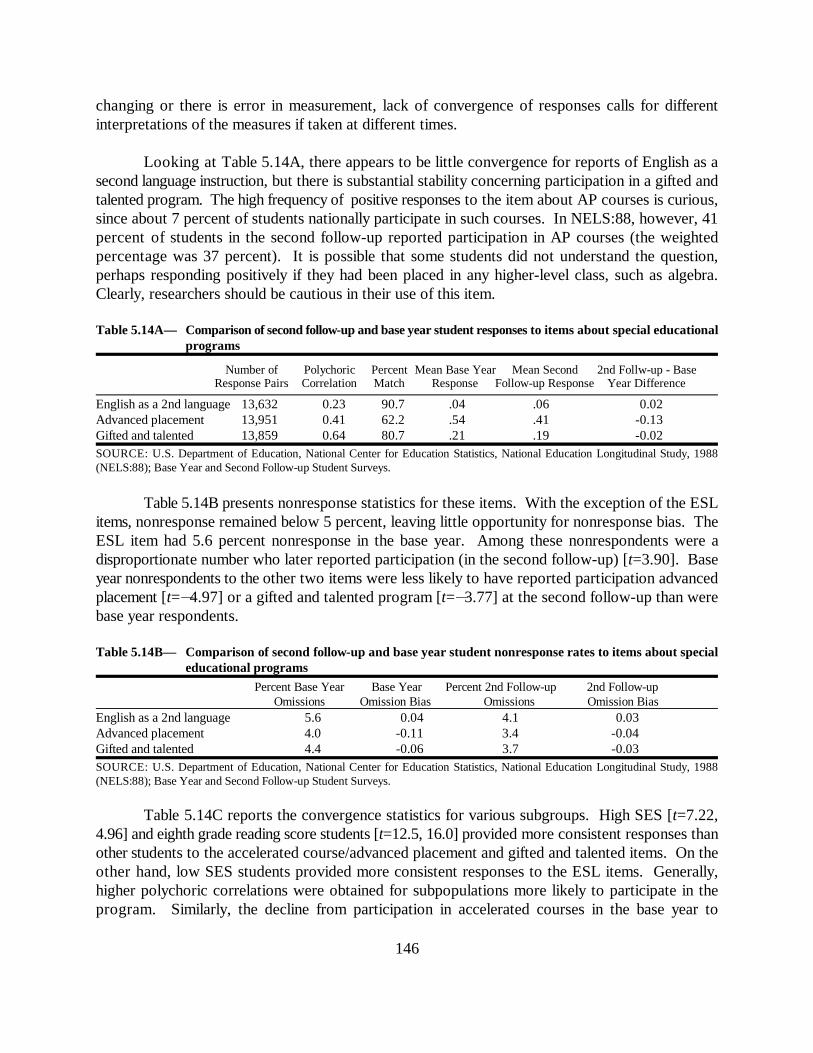
146
changing or there is error in measurement, lack of convergence of responses calls for differentinterpretations of the measures if taken at different times.
Looking at Table 5.14A, there appears to be little convergence for reports of English as asecond language instruction, but there is substantial stability concerning participation in a gifted andtalented program. The high frequency of positive responses to the item about AP courses is curious,since about 7 percent of students nationally participate in such courses. In NELS:88, however, 41percent of students in the second follow-up reported participation in AP courses (the weightedpercentage was 37 percent). It is possible that some students did not understand the question,perhaps responding positively if they had been placed in any higher-level class, such as algebra.Clearly, researchers should be cautious in their use of this item.
Table 5.14A— Comparison of second follow-up and base year student responses to items about special educationalprograms
Number of Polychoric Percent Mean Base Year Mean Second 2nd Follw-up - BaseResponse Pairs Correlation Match Response Follow-up Response Year Difference
English as a 2nd language 13,632 0.23 90.7 .04 .06 0.02Advanced placement 13,951 0.41 62.2 .54 .41 -0.13Gifted and talented 13,859 0.64 80.7 .21 .19 -0.02SOURCE: U.S. Department of Education, National Center for Education Statistics, National Education Longitudinal Study, 1988(NELS:88); Base Year and Second Follow-up Student Surveys.
Table 5.14B presents nonresponse statistics for these items. With the exception of the ESLitems, nonresponse remained below 5 percent, leaving little opportunity for nonresponse bias. TheESL item had 5.6 percent nonresponse in the base year. Among these nonrespondents were adisproportionate number who later reported participation (in the second follow-up) [t=3.90]. Baseyear nonrespondents to the other two items were less likely to have reported participation advancedplacement [t=�4.97] or a gifted and talented program [t=�3.77] at the second follow-up than werebase year respondents.
Table 5.14B— Comparison of second follow-up and base year student nonresponse rates to items about specialeducational programs
Percent Base Year Base Year Percent 2nd Follow-up 2nd Follow-upOmissions Omission Bias Omissions Omission Bias
English as a 2nd language 5.6 0.04 4.1 0.03Advanced placement 4.0 -0.11 3.4 -0.04Gifted and talented 4.4 -0.06 3.7 -0.03SOURCE: U.S. Department of Education, National Center for Education Statistics, National Education Longitudinal Study, 1988(NELS:88); Base Year and Second Follow-up Student Surveys.
Table 5.14C reports the convergence statistics for various subgroups. High SES [t=7.22,4.96] and eighth grade reading score students [t=12.5, 16.0] provided more consistent responses thanother students to the accelerated course/advanced placement and gifted and talented items. On theother hand, low SES students provided more consistent responses to the ESL items. Generally,higher polychoric correlations were obtained for subpopulations more likely to participate in theprogram. Similarly, the decline from participation in accelerated courses in the base year to
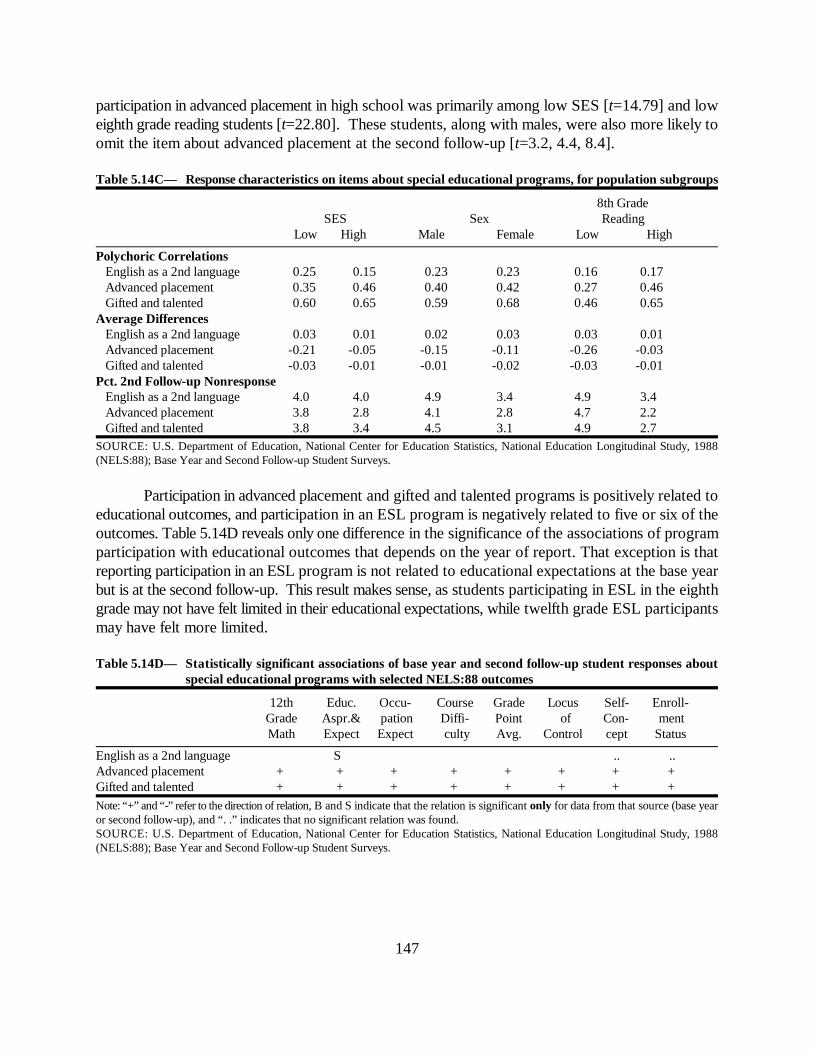
147
participation in advanced placement in high school was primarily among low SES [t=14.79] and loweighth grade reading students [t=22.80]. These students, along with males, were also more likely toomit the item about advanced placement at the second follow-up [t=3.2, 4.4, 8.4].
Table 5.14C— Response characteristics on items about special educational programs, for population subgroups
8th GradeSES Sex Reading
Low High Male Female Low High
Polychoric Correlations English as a 2nd language 0.25 0.15 0.23 0.23 0.16 0.17 Advanced placement 0.35 0.46 0.40 0.42 0.27 0.46 Gifted and talented 0.60 0.65 0.59 0.68 0.46 0.65Average Differences English as a 2nd language 0.03 0.01 0.02 0.03 0.03 0.01 Advanced placement -0.21 -0.05 -0.15 -0.11 -0.26 -0.03 Gifted and talented -0.03 -0.01 -0.01 -0.02 -0.03 -0.01Pct. 2nd Follow-up Nonresponse English as a 2nd language 4.0 4.0 4.9 3.4 4.9 3.4 Advanced placement 3.8 2.8 4.1 2.8 4.7 2.2 Gifted and talented 3.8 3.4 4.5 3.1 4.9 2.7SOURCE: U.S. Department of Education, National Center for Education Statistics, National Education Longitudinal Study, 1988(NELS:88); Base Year and Second Follow-up Student Surveys.
Participation in advanced placement and gifted and talented programs is positively related toeducational outcomes, and participation in an ESL program is negatively related to five or six of theoutcomes. Table 5.14D reveals only one difference in the significance of the associations of programparticipation with educational outcomes that depends on the year of report. That exception is thatreporting participation in an ESL program is not related to educational expectations at the base yearbut is at the second follow-up. This result makes sense, as students participating in ESL in the eighthgrade may not have felt limited in their educational expectations, while twelfth grade ESL participantsmay have felt more limited.
Table 5.14D— Statistically significant associations of base year and second follow-up student responses aboutspecial educational programs with selected NELS:88 outcomes
12th Educ. Occu- Course Grade Locus Self- Enroll-Grade Aspr.& pation Diffi- Point of Con- mentMath Expect Expect culty Avg. Control cept Status
English as a 2nd language S .. ..Advanced placement + + + + + + + + Gifted and talented + + + + + + + +
Note: “+” and “-” refer to the direction of relation, B and S indicate that the relation is significant only for data from that source (base yearor second follow-up), and “. .” indicates that no significant relation was found.SOURCE: U.S. Department of Education, National Center for Education Statistics, National Education Longitudinal Study, 1988(NELS:88); Base Year and Second Follow-up Student Surveys.
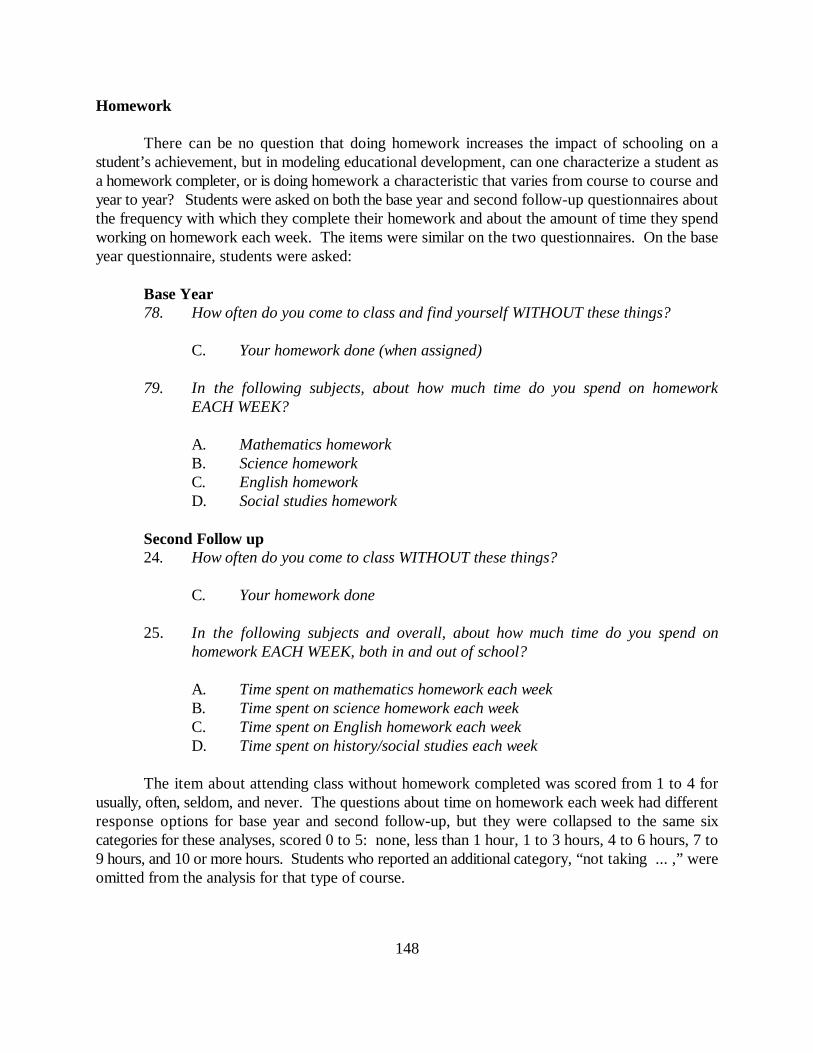
148
Homework
There can be no question that doing homework increases the impact of schooling on astudent’s achievement, but in modeling educational development, can one characterize a student asa homework completer, or is doing homework a characteristic that varies from course to course andyear to year? Students were asked on both the base year and second follow-up questionnaires aboutthe frequency with which they complete their homework and about the amount of time they spendworking on homework each week. The items were similar on the two questionnaires. On the baseyear questionnaire, students were asked:
Base Year78. How often do you come to class and find yourself WITHOUT these things?
C. Your homework done (when assigned)
79. In the following subjects, about how much time do you spend on homeworkEACH WEEK?
A. Mathematics homeworkB. Science homeworkC. English homeworkD. Social studies homework
Second Follow up24. How often do you come to class WITHOUT these things?
C. Your homework done
25. In the following subjects and overall, about how much time do you spend onhomework EACH WEEK, both in and out of school?
A. Time spent on mathematics homework each weekB. Time spent on science homework each weekC. Time spent on English homework each weekD. Time spent on history/social studies each week
The item about attending class without homework completed was scored from 1 to 4 forusually, often, seldom, and never. The questions about time on homework each week had differentresponse options for base year and second follow-up, but they were collapsed to the same sixcategories for these analyses, scored 0 to 5: none, less than 1 hour, 1 to 3 hours, 4 to 6 hours, 7 to9 hours, and 10 or more hours. Students who reported an additional category, “not taking ... ,” wereomitted from the analysis for that type of course.
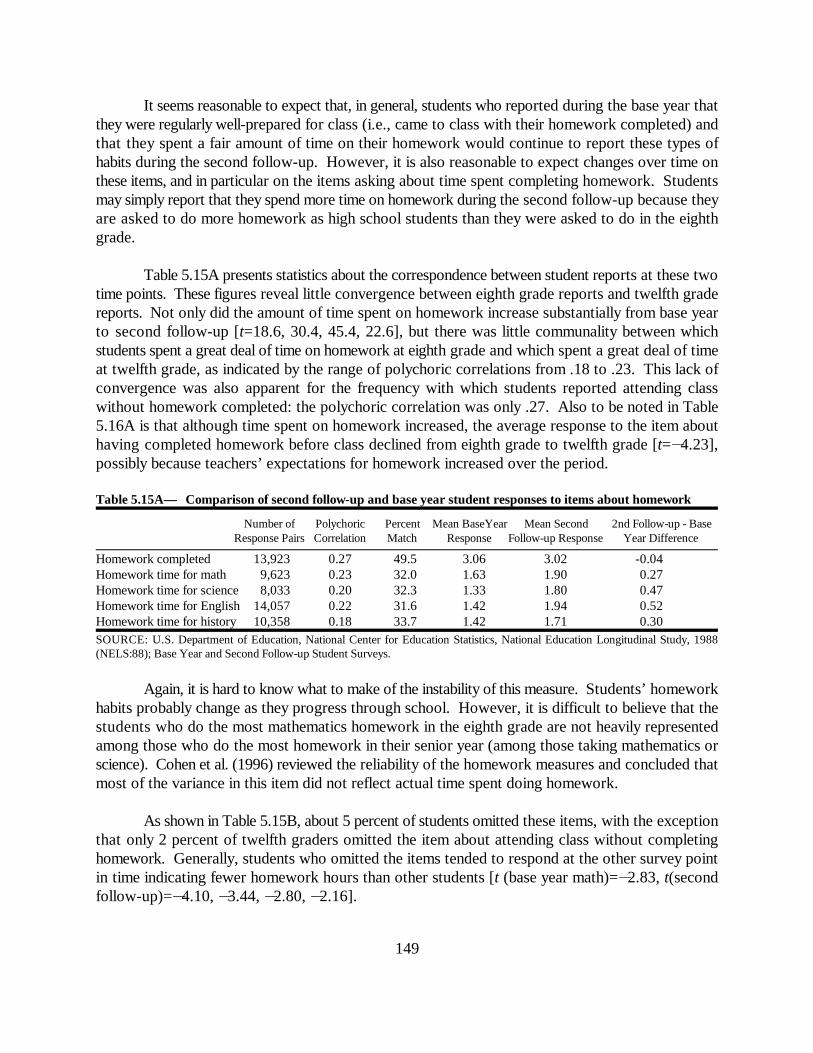
149
It seems reasonable to expect that, in general, students who reported during the base year thatthey were regularly well-prepared for class (i.e., came to class with their homework completed) andthat they spent a fair amount of time on their homework would continue to report these types ofhabits during the second follow-up. However, it is also reasonable to expect changes over time onthese items, and in particular on the items asking about time spent completing homework. Studentsmay simply report that they spend more time on homework during the second follow-up because theyare asked to do more homework as high school students than they were asked to do in the eighthgrade.
Table 5.15A presents statistics about the correspondence between student reports at these twotime points. These figures reveal little convergence between eighth grade reports and twelfth gradereports. Not only did the amount of time spent on homework increase substantially from base yearto second follow-up [t=18.6, 30.4, 45.4, 22.6], but there was little communality between whichstudents spent a great deal of time on homework at eighth grade and which spent a great deal of timeat twelfth grade, as indicated by the range of polychoric correlations from .18 to .23. This lack ofconvergence was also apparent for the frequency with which students reported attending classwithout homework completed: the polychoric correlation was only .27. Also to be noted in Table5.16A is that although time spent on homework increased, the average response to the item abouthaving completed homework before class declined from eighth grade to twelfth grade [t=�4.23],possibly because teachers’ expectations for homework increased over the period.
Table 5.15A— Comparison of second follow-up and base year student responses to items about homework
Number of Polychoric Percent Mean BaseYear Mean Second 2nd Follow-up - BaseResponse Pairs Correlation Match Response Follow-up Response Year Difference
Homework completed 13,923 0.27 49.5 3.06 3.02 -0.04Homework time for math 9,623 0.23 32.0 1.63 1.90 0.27Homework time for science 8,033 0.20 32.3 1.33 1.80 0.47Homework time for English 14,057 0.22 31.6 1.42 1.94 0.52Homework time for history 10,358 0.18 33.7 1.42 1.71 0.30SOURCE: U.S. Department of Education, National Center for Education Statistics, National Education Longitudinal Study, 1988(NELS:88); Base Year and Second Follow-up Student Surveys.
Again, it is hard to know what to make of the instability of this measure. Students’ homeworkhabits probably change as they progress through school. However, it is difficult to believe that thestudents who do the most mathematics homework in the eighth grade are not heavily representedamong those who do the most homework in their senior year (among those taking mathematics orscience). Cohen et al. (1996) reviewed the reliability of the homework measures and concluded thatmost of the variance in this item did not reflect actual time spent doing homework.
As shown in Table 5.15B, about 5 percent of students omitted these items, with the exceptionthat only 2 percent of twelfth graders omitted the item about attending class without completinghomework. Generally, students who omitted the items tended to respond at the other survey pointin time indicating fewer homework hours than other students [t (base year math)=�2.83, t(secondfollow-up)=�4.10, �3.44, �2.80, �2.16].

150
Table 5.15B— Comparison of second follow-up and base year student nonresponse rates to items about homework
Percent Base Year Base Year Percent 2nd Follow-up 2nd Follow-upOmissions Omission Bias Omissions Omission Bias
Homework completed 5.5 -0.05 2.1 -0.08Homework time for math 4.3 -0.19 4.5 -0.18Homework time for science 4.5 -0.10 5.3 -0.15Homework time for English 4.8 -0.06 4.2 -0.10Homework time for history 4.8 -0.03 5.1 -0.08SOURCE: U.S. Department of Education, National Center for Education Statistics, National Education Longitudinal Study, 1988(NELS:88); Base Year and Second Follow-up Student Surveys.
Increases in amount of time spent on homework were also greatest for high SES students[t=3.79, 6.89, 5.95, 2.80], for female students [t=8.31, 4.11, 7.76, 2.38], and in science and English,for students with high eighth grade reading scores [t=5.11, 6.42]. Therefore, the finding that thedecline in homework completion between eighth and twelfth grades was limited to high SES students[t=�7.74] and students with high eighth grade reading scores [t=�10.47] suggests that greaterdemands for homework are being made on these groups. Finally, most of the students who omittedthe items on hours spent on homework each week at the second follow-up had low eighth gradereading scores [t’s ranged from 13.1 to 13.7], were from low SES households [t’s ranged from 8.0to 9.0], and were male [t’s ranged from 4.2 to 5.8].
Table 5.15C— Response characteristics on items about homework, for population subgroups
8th GradeSES Sex Reading
Low High Male Female Low High
Polychoric Correlations Homework completed 0.24 0.30 0.23 0.29 0.23 0.31 Homework time for math 0.24 0.21 0.19 0.26 0.17 0.24 Homework time for science 0.21 0.20 0.17 0.22 0.17 0.20 Homework time for English 0.17 0.24 0.21 0.22 0.15 0.23 Homework time for history 0.15 0.19 0.17 0.18 0.15 0.19Average Differences Homework completed 0.04 -0.10 -0.05 -0.02 0.07 -0.11 Homework time for math 0.19 0.31 0.15 0.39 0.26 0.28 Homework time for science 0.32 0.55 0.41 0.54 0.37 0.54 Homework time for English 0.43 0.58 0.43 0.60 0.43 0.58 Homework time for history 0.24 0.32 0.27 0.33 0.29 0.30Pct. 2nd Follow-up Nonresponse Homework completed 2.0 2.0 2.6 1.5 2.8 1.5 Homework time for math 6.2 2.7 5.4 3.6 7.9 2.2 Homework time for science 7.7 3.2 6.7 3.8 9.7 2.6 Homework time for English 5.6 2.6 5.1 3.3 6.7 2.2 Homework time for history 7.2 3.1 6.1 4.1 8.4 2.6SOURCE: U.S. Department of Education, National Center for Education Statistics, National Education Longitudinal Study, 1988(NELS:88); Base Year and Second Follow-up Student Surveys.
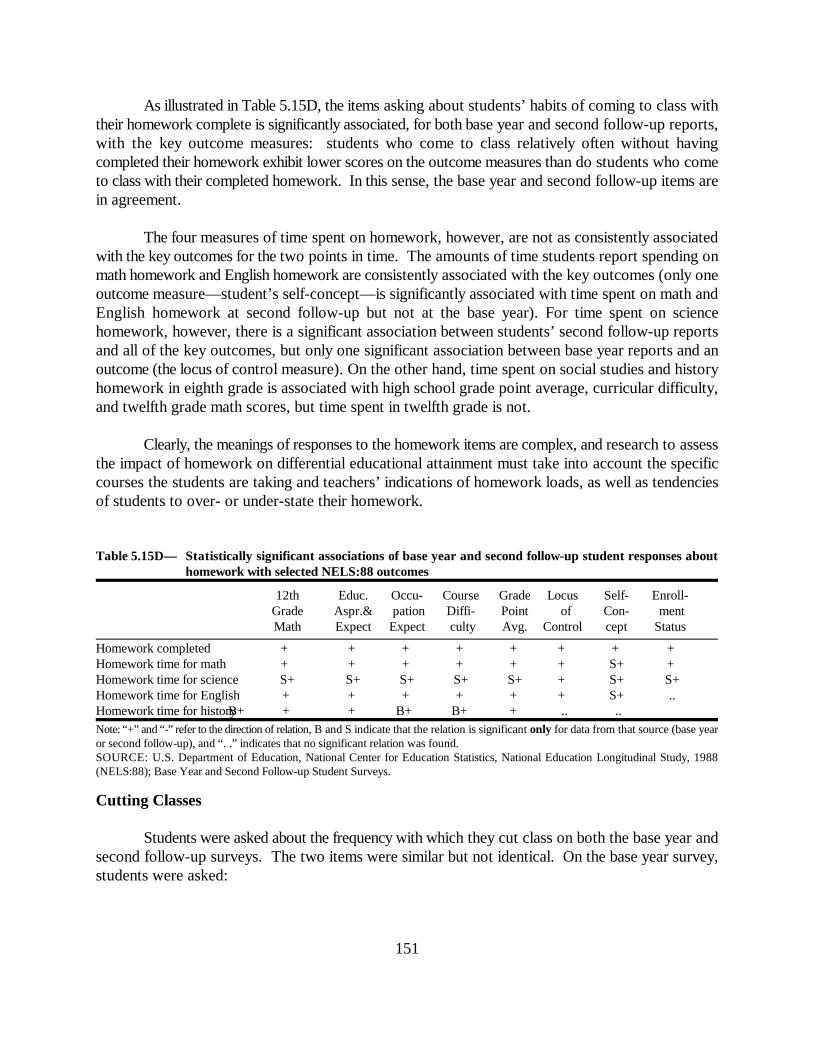
151
As illustrated in Table 5.15D, the items asking about students’ habits of coming to class withtheir homework complete is significantly associated, for both base year and second follow-up reports,with the key outcome measures: students who come to class relatively often without havingcompleted their homework exhibit lower scores on the outcome measures than do students who cometo class with their completed homework. In this sense, the base year and second follow-up items arein agreement.
The four measures of time spent on homework, however, are not as consistently associatedwith the key outcomes for the two points in time. The amounts of time students report spending onmath homework and English homework are consistently associated with the key outcomes (only oneoutcome measure—student’s self-concept—is significantly associated with time spent on math andEnglish homework at second follow-up but not at the base year). For time spent on sciencehomework, however, there is a significant association between students’ second follow-up reportsand all of the key outcomes, but only one significant association between base year reports and anoutcome (the locus of control measure). On the other hand, time spent on social studies and historyhomework in eighth grade is associated with high school grade point average, curricular difficulty,and twelfth grade math scores, but time spent in twelfth grade is not.
Clearly, the meanings of responses to the homework items are complex, and research to assessthe impact of homework on differential educational attainment must take into account the specificcourses the students are taking and teachers’ indications of homework loads, as well as tendenciesof students to over- or under-state their homework.
Table 5.15D— Statistically significant associations of base year and second follow-up student responses abouthomework with selected NELS:88 outcomes
12th Educ. Occu- Course Grade Locus Self- Enroll-Grade Aspr.& pation Diffi- Point of Con- mentMath Expect Expect culty Avg. Control cept Status
Homework completed + + + + + + + +Homework time for math + + + + + + S+ + Homework time for science S+ S+ S+ S+ S+ + S+ S+Homework time for English + + + + + + S+ ..Homework time for historyB+ + + B+ B+ + .. ..Note: “+” and “-” refer to the direction of relation, B and S indicate that the relation is significant only for data from that source (base yearor second follow-up), and “. .” indicates that no significant relation was found.SOURCE: U.S. Department of Education, National Center for Education Statistics, National Education Longitudinal Study, 1988(NELS:88); Base Year and Second Follow-up Student Surveys.
Cutting Classes
Students were asked about the frequency with which they cut class on both the base year andsecond follow-up surveys. The two items were similar but not identical. On the base year survey,students were asked:
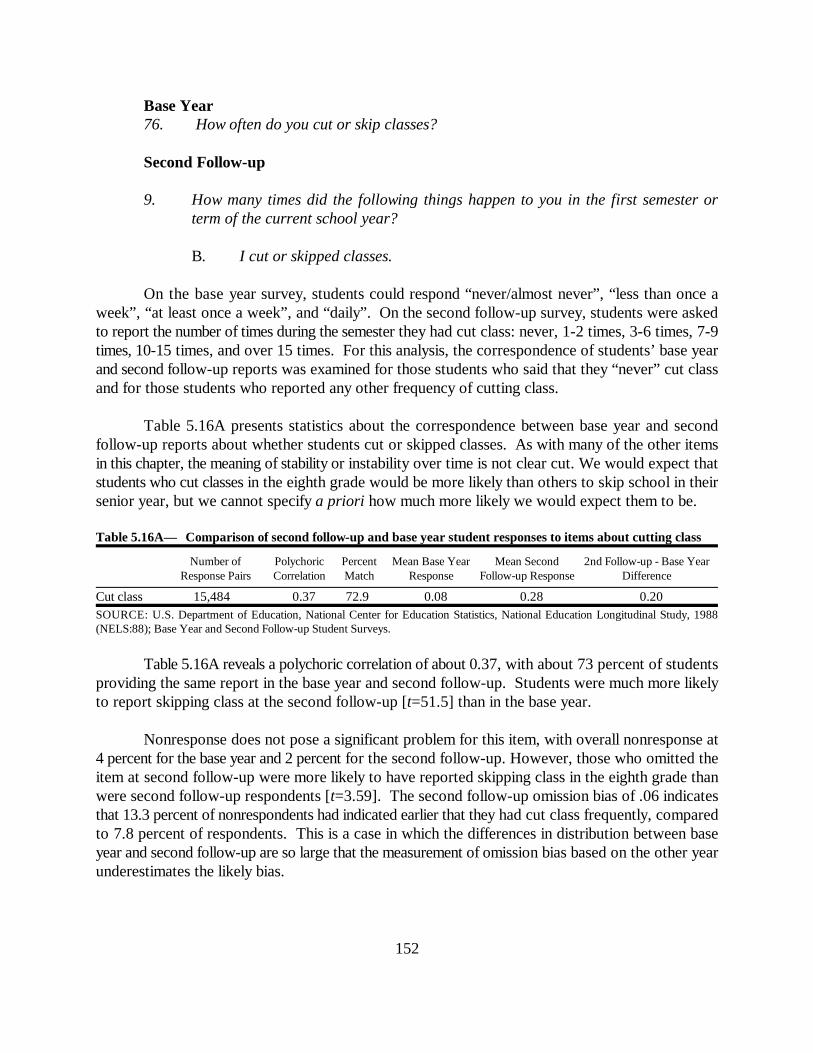
152
Base Year76. How often do you cut or skip classes?
Second Follow-up
9. How many times did the following things happen to you in the first semester orterm of the current school year?
B. I cut or skipped classes.
On the base year survey, students could respond “never/almost never”, “less than once aweek”, “at least once a week”, and “daily”. On the second follow-up survey, students were askedto report the number of times during the semester they had cut class: never, 1-2 times, 3-6 times, 7-9times, 10-15 times, and over 15 times. For this analysis, the correspondence of students’ base yearand second follow-up reports was examined for those students who said that they “never” cut classand for those students who reported any other frequency of cutting class.
Table 5.16A presents statistics about the correspondence between base year and secondfollow-up reports about whether students cut or skipped classes. As with many of the other itemsin this chapter, the meaning of stability or instability over time is not clear cut. We would expect thatstudents who cut classes in the eighth grade would be more likely than others to skip school in theirsenior year, but we cannot specify a priori how much more likely we would expect them to be.
Table 5.16A— Comparison of second follow-up and base year student responses to items about cutting class
Number of Polychoric Percent Mean Base Year Mean Second 2nd Follow-up - Base YearResponse Pairs Correlation Match Response Follow-up Response Difference
Cut class 15,484 0.37 72.9 0.08 0.28 0.20SOURCE: U.S. Department of Education, National Center for Education Statistics, National Education Longitudinal Study, 1988(NELS:88); Base Year and Second Follow-up Student Surveys.
Table 5.16A reveals a polychoric correlation of about 0.37, with about 73 percent of studentsproviding the same report in the base year and second follow-up. Students were much more likelyto report skipping class at the second follow-up [t=51.5] than in the base year.
Nonresponse does not pose a significant problem for this item, with overall nonresponse at4 percent for the base year and 2 percent for the second follow-up. However, those who omitted theitem at second follow-up were more likely to have reported skipping class in the eighth grade thanwere second follow-up respondents [t=3.59]. The second follow-up omission bias of .06 indicatesthat 13.3 percent of nonrespondents had indicated earlier that they had cut class frequently, comparedto 7.8 percent of respondents. This is a case in which the differences in distribution between baseyear and second follow-up are so large that the measurement of omission bias based on the other yearunderestimates the likely bias.
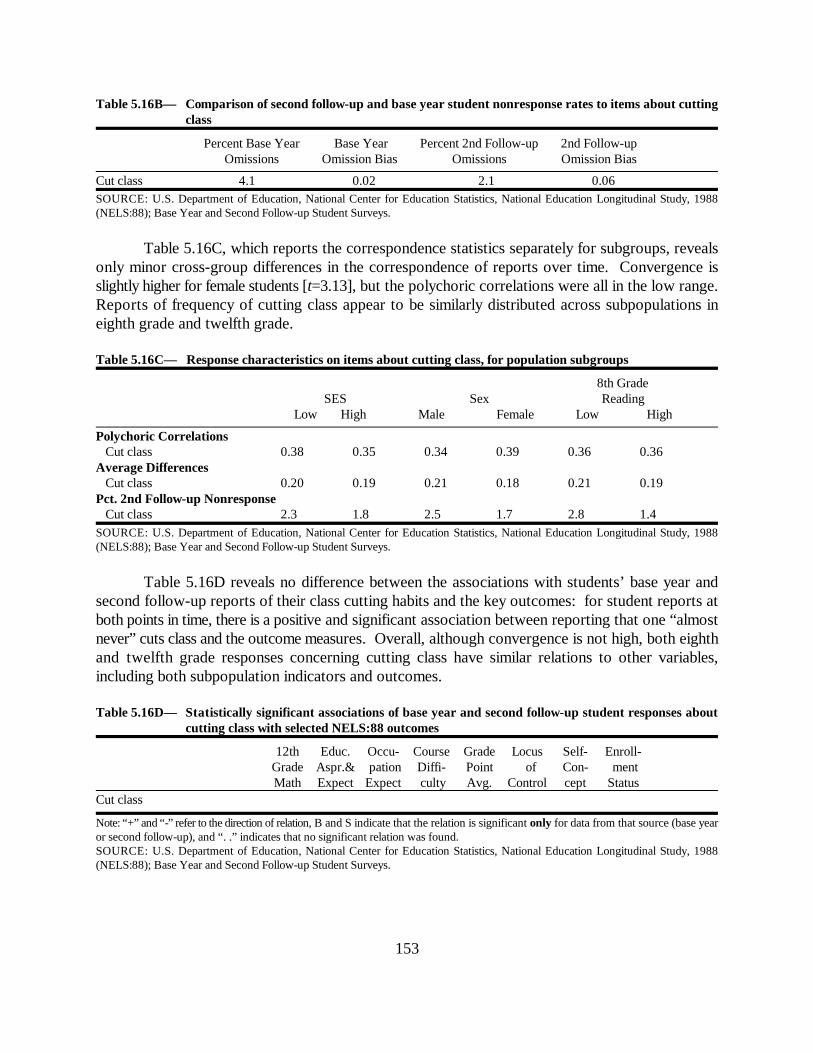
153
Table 5.16B— Comparison of second follow-up and base year student nonresponse rates to items about cuttingclass
Percent Base Year Base Year Percent 2nd Follow-up 2nd Follow-upOmissions Omission Bias Omissions Omission Bias
Cut class 4.1 0.02 2.1 0.06SOURCE: U.S. Department of Education, National Center for Education Statistics, National Education Longitudinal Study, 1988(NELS:88); Base Year and Second Follow-up Student Surveys.
Table 5.16C, which reports the correspondence statistics separately for subgroups, revealsonly minor cross-group differences in the correspondence of reports over time. Convergence isslightly higher for female students [t=3.13], but the polychoric correlations were all in the low range.Reports of frequency of cutting class appear to be similarly distributed across subpopulations ineighth grade and twelfth grade.
Table 5.16C— Response characteristics on items about cutting class, for population subgroups
8th GradeSES Sex Reading
Low High Male Female Low High
Polychoric Correlations Cut class 0.38 0.35 0.34 0.39 0.36 0.36Average Differences Cut class 0.20 0.19 0.21 0.18 0.21 0.19Pct. 2nd Follow-up Nonresponse Cut class 2.3 1.8 2.5 1.7 2.8 1.4SOURCE: U.S. Department of Education, National Center for Education Statistics, National Education Longitudinal Study, 1988(NELS:88); Base Year and Second Follow-up Student Surveys.
Table 5.16D reveals no difference between the associations with students’ base year andsecond follow-up reports of their class cutting habits and the key outcomes: for student reports atboth points in time, there is a positive and significant association between reporting that one “almostnever” cuts class and the outcome measures. Overall, although convergence is not high, both eighthand twelfth grade responses concerning cutting class have similar relations to other variables,including both subpopulation indicators and outcomes.
Table 5.16D— Statistically significant associations of base year and second follow-up student responses aboutcutting class with selected NELS:88 outcomes
12th Educ. Occu- Course Grade Locus Self- Enroll-Grade Aspr.& pation Diffi- Point of Con- mentMath Expect Expect culty Avg. Control cept Status
Cut class
Note: “+” and “-” refer to the direction of relation, B and S indicate that the relation is significant only for data from that source (base yearor second follow-up), and “. .” indicates that no significant relation was found.SOURCE: U.S. Department of Education, National Center for Education Statistics, National Education Longitudinal Study, 1988(NELS:88); Base Year and Second Follow-up Student Surveys.

154
Students’ Preparedness for Class
Students were asked to report how often they come to class unprepared. The questions weresimilar on the base year and second follow-up questionnaires.
Base Year78. How often do you come to class and find yourself WITHOUT these things?
A. Pencil or paper (when needed)B. Books (when needed)
Second follow-up24. How often do you come to class WITHOUT these things?
A. Pencil or paperB. Books?
(Note that these items were asked in conjunction with the items about homework completion,examined in an earlier section.) Students responded to these items on a four-point scale, ranging from(1) usually, (2) often, (3) seldom, and (4) never.
Table 5.17A reports the correspondence between base year and second follow-up reportsabout the two items about preparedness for class. As with many of the other items examined in thischapter, these items might reasonably be expected to change over time. In the aggregate, studentsreport attending class without a pencil or paper less frequently at the time of the second follow-upthan in the base year [t=40.5]. This is not the case for attending class without books: the averageresponses in both the base year and second follow-up indicate that students almost never attendedclass without books. The low polychoric correlation for the item about books (0.22) suggests thatthis item may be more related to particular course requirements than habits of individual students.
Table 5.17A— Comparison of second follow-up and base year student responses to items about preparing for class
Number of Polychoric PercentMean Base Year Mean Second 2nd Follow-up - BaseResponse Pairs Correlation Match Response Follow-up Response Year Difference
Never attend w/out pencil/paper 14,080 0.35 45.4 3.03 3.37 0.34Never attend w/out book 13,912 0.22 51.4 3.40 3.40 0.00SOURCE: U.S. Department of Education, National Center for Education Statistics, National Education Longitudinal Study, 1988(NELS:88); Base Year and Second Follow-up Student Surveys.
Base year nonresponse to these items was slightly greater than second-follow-up nonresponse[t=�12.00,�16.01] (see Table 5.17B). Even in the base year, nonresponse was just over 5 percentoverall. Examination of the omission bias statistics reveals no likely substantial bias fromnonresponse.
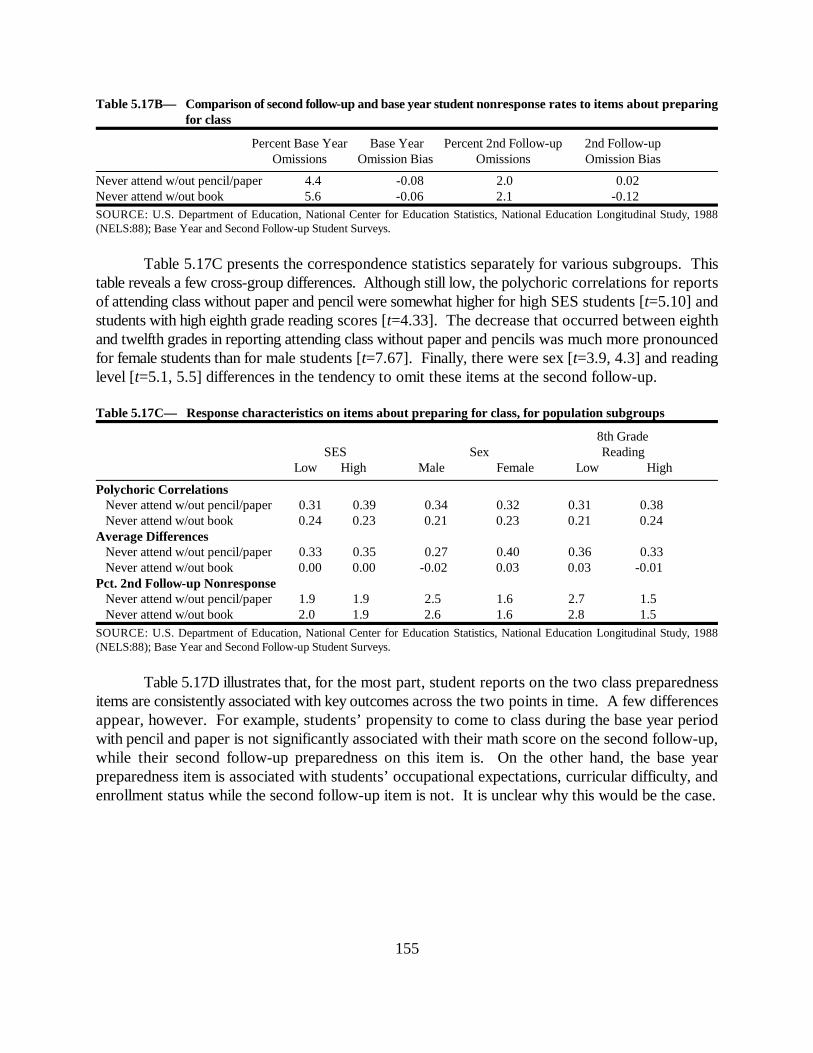
155
Table 5.17B— Comparison of second follow-up and base year student nonresponse rates to items about preparingfor class
Percent Base Year Base Year Percent 2nd Follow-up 2nd Follow-upOmissions Omission Bias Omissions Omission Bias
Never attend w/out pencil/paper 4.4 -0.08 2.0 0.02Never attend w/out book 5.6 -0.06 2.1 -0.12SOURCE: U.S. Department of Education, National Center for Education Statistics, National Education Longitudinal Study, 1988(NELS:88); Base Year and Second Follow-up Student Surveys.
Table 5.17C presents the correspondence statistics separately for various subgroups. Thistable reveals a few cross-group differences. Although still low, the polychoric correlations for reportsof attending class without paper and pencil were somewhat higher for high SES students [t=5.10] andstudents with high eighth grade reading scores [t=4.33]. The decrease that occurred between eighthand twelfth grades in reporting attending class without paper and pencils was much more pronouncedfor female students than for male students [t=7.67]. Finally, there were sex [t=3.9, 4.3] and readinglevel [t=5.1, 5.5] differences in the tendency to omit these items at the second follow-up.
Table 5.17C— Response characteristics on items about preparing for class, for population subgroups
8th GradeSES Sex Reading
Low High Male Female Low High
Polychoric Correlations Never attend w/out pencil/paper 0.31 0.39 0.34 0.32 0.31 0.38 Never attend w/out book 0.24 0.23 0.21 0.23 0.21 0.24Average Differences Never attend w/out pencil/paper 0.33 0.35 0.27 0.40 0.36 0.33 Never attend w/out book 0.00 0.00 -0.02 0.03 0.03 -0.01Pct. 2nd Follow-up Nonresponse Never attend w/out pencil/paper 1.9 1.9 2.5 1.6 2.7 1.5 Never attend w/out book 2.0 1.9 2.6 1.6 2.8 1.5SOURCE: U.S. Department of Education, National Center for Education Statistics, National Education Longitudinal Study, 1988(NELS:88); Base Year and Second Follow-up Student Surveys.
Table 5.17D illustrates that, for the most part, student reports on the two class preparednessitems are consistently associated with key outcomes across the two points in time. A few differencesappear, however. For example, students’ propensity to come to class during the base year periodwith pencil and paper is not significantly associated with their math score on the second follow-up,while their second follow-up preparedness on this item is. On the other hand, the base yearpreparedness item is associated with students’ occupational expectations, curricular difficulty, andenrollment status while the second follow-up item is not. It is unclear why this would be the case.

156
Table 5.17D— Statistically significant associations of base year and second follow-up student responses aboutpreparing for class with selected NELS:88 outcomes
12th Educ. Occu- Course Grade Locus Self- Enroll-Grade Aspr.& pation Diffi- Point of Con- mentMath Expect Expect culty Avg. Control cept Status
Never attend w/out pencil/paper S+ + + + + + + B+Never attend w/out book .. + B+ B+ + + + B+Note: “+” and “-” refer to the direction of relation, B and S indicate that the relation is significant only for data from that source (base yearor second follow-up), and “. .” indicates that no significant relation was found.SOURCE: U.S. Department of Education, National Center for Education Statistics, National Education Longitudinal Study, 1988(NELS:88); Base Year and Second Follow-up Student Surveys.
Participation in Extracurricular Activities
Students were asked about their participation in extracurricular activities on both the base yearand second follow-up questionnaires. Many of the items were very similar on the two surveys.
Base Year82. Have you or will you have participated in any of the following school activities
during the current school year, either as a member, or as an officer (for example,vice-president, coordinator, team captain)?
C. Intramural sports (playing against teams from your own school)B. School varsity sports (playing against teams from other schools)D. CheerleadingN. Drama clubR. Student councilO. Academic Honors SocietyU. Vocational education club
Second Follow up30A. Please circle one response for EACH type of interscholastic sport/activity in which
you have participated THIS SCHOOL YEAR. (INTERSCHOLASTIC means yourschool’s team competes with other schools’ teams.) Circle the highest number thatapplies on each line.
A. A team sport (baseball, basketball, football, soccer, hockey, etc.)C. Cheerleading, pompon, drill team
30B. Please mark one for each activity in which you have participated THIS SCHOOLYEAR. Circle the highest number that applies on each line.
J. An intramural team sport (baseball, basketball, football, soccer, hockey, etc.)B. Drama club, school play or musical
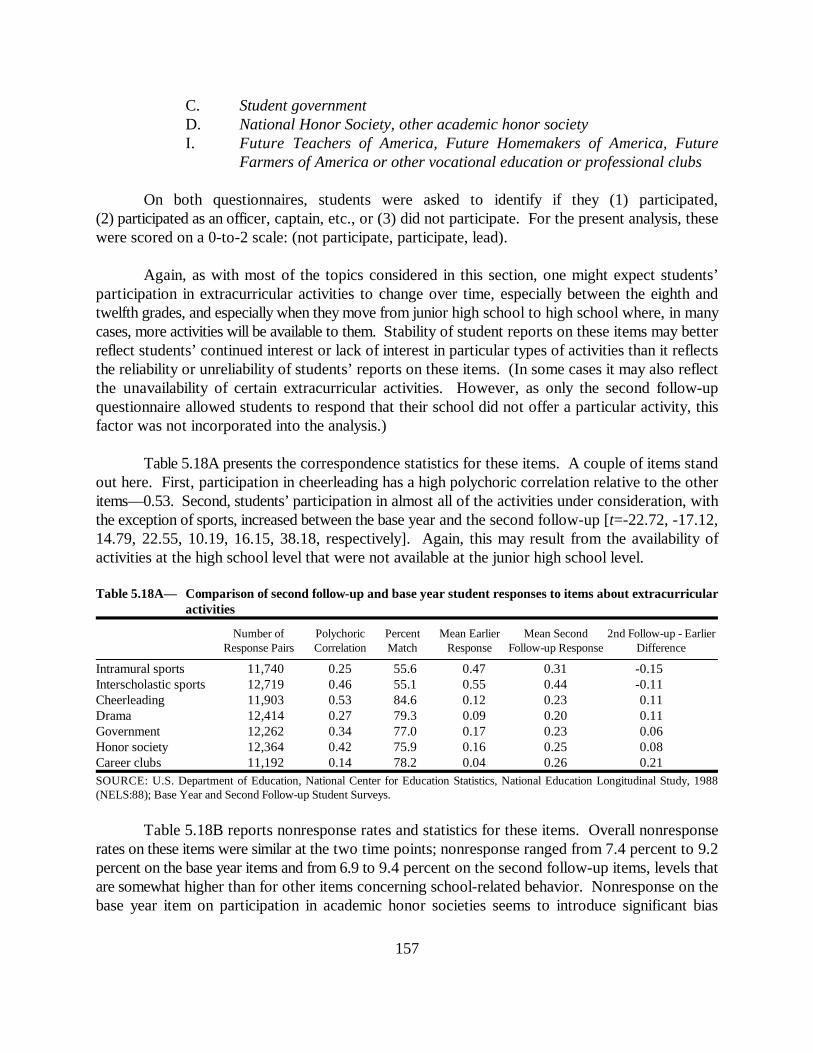
157
C. Student governmentD. National Honor Society, other academic honor societyI. Future Teachers of America, Future Homemakers of America, Future
Farmers of America or other vocational education or professional clubs
On both questionnaires, students were asked to identify if they (1) participated,(2) participated as an officer, captain, etc., or (3) did not participate. For the present analysis, thesewere scored on a 0-to-2 scale: (not participate, participate, lead).
Again, as with most of the topics considered in this section, one might expect students’participation in extracurricular activities to change over time, especially between the eighth andtwelfth grades, and especially when they move from junior high school to high school where, in manycases, more activities will be available to them. Stability of student reports on these items may betterreflect students’ continued interest or lack of interest in particular types of activities than it reflectsthe reliability or unreliability of students’ reports on these items. (In some cases it may also reflectthe unavailability of certain extracurricular activities. However, as only the second follow-upquestionnaire allowed students to respond that their school did not offer a particular activity, thisfactor was not incorporated into the analysis.)
Table 5.18A presents the correspondence statistics for these items. A couple of items standout here. First, participation in cheerleading has a high polychoric correlation relative to the otheritems—0.53. Second, students’ participation in almost all of the activities under consideration, withthe exception of sports, increased between the base year and the second follow-up [t=-22.72, -17.12,14.79, 22.55, 10.19, 16.15, 38.18, respectively]. Again, this may result from the availability ofactivities at the high school level that were not available at the junior high school level.
Table 5.18A— Comparison of second follow-up and base year student responses to items about extracurricularactivities
Number of Polychoric Percent Mean Earlier Mean Second 2nd Follow-up - EarlierResponse Pairs Correlation Match Response Follow-up Response Difference
Intramural sports 11,740 0.25 55.6 0.47 0.31 -0.15Interscholastic sports 12,719 0.46 55.1 0.55 0.44 -0.11Cheerleading 11,903 0.53 84.6 0.12 0.23 0.11Drama 12,414 0.27 79.3 0.09 0.20 0.11Government 12,262 0.34 77.0 0.17 0.23 0.06Honor society 12,364 0.42 75.9 0.16 0.25 0.08Career clubs 11,192 0.14 78.2 0.04 0.26 0.21SOURCE: U.S. Department of Education, National Center for Education Statistics, National Education Longitudinal Study, 1988(NELS:88); Base Year and Second Follow-up Student Surveys.
Table 5.18B reports nonresponse rates and statistics for these items. Overall nonresponserates on these items were similar at the two time points; nonresponse ranged from 7.4 percent to 9.2percent on the base year items and from 6.9 to 9.4 percent on the second follow-up items, levels thatare somewhat higher than for other items concerning school-related behavior. Nonresponse on thebase year item on participation in academic honor societies seems to introduce significant bias

158
[t=-5.94] in that those who omitted the item tended to report not participating at the time of thesecond follow-up.
Table 5.18B— Comparison of second follow-up and base year student nonresponse rates to items aboutextracurricular activities
Percent Base Year Base Year Percent 2nd Follow-up 2nd Follow-upOmissions Omission Bias Omissions Omission Bias
Intramural sports 8.1 0.02 7.5 -0.00Interscholastic sports 7.4 -0.02 7.4 0.00Cheerleading 8.4 -0.03 9.4 -0.02Drama 8.8 -0.03 6.9 0.03Government 9.2 -0.03 7.2 -0.01Honor society 9.0 -0.09 7.3 -0.01Career clubs 9.2 0.01 7.7 0.02SOURCE: U.S. Department of Education, National Center for Education Statistics, National Education Longitudinal Study, 1988(NELS:88); Base Year and Second Follow-up Student Surveys.
Table 5.18C— Response characteristics on items about extracurricular activities, for population subgroups
8th GradeSES Sex Reading
Low High Male Female Low High
Polychoric Correlations Intramural sports 0.27 0.24 0.18 0.29 0.28 0.23 Interscholastic sports 0.44 0.46 0.44 0.44 0.45 0.46 Cheerleading 0.49 0.57 0.31 0.46 0.49 0.56 Drama 0.25 0.28 0.26 0.27 0.23 0.28 Government 0.33 0.34 0.33 0.33 0.25 0.36 Honor society 0.43 0.39 0.44 0.40 0.35 0.38 Career clubs 0.17 0.11 0.16 0.15 0.13 0.11Average Differences Intramural sports -0.14 -0.17 -0.09 -0.21 -0.12 -0.18 Interscholastic sports -0.13 -0.10 -0.04 -0.18 -0.12 -0.12 Cheerleading 0.08 0.13 -0.02 0.19 0.07 0.14 Drama 0.08 0.14 0.11 0.11 0.05 0.15 Government 0.03 0.09 0.05 0.07 0.01 0.10 Honor society 0.04 0.14 0.04 0.12 -0.01 0.15 Career clubs 0.27 0.16 0.16 0.27 0.25 0.19Pct. 2nd Follow-up Nonresponse Intramural sports 6.4 7.1 8.4 6.6 8.9 6.3 Interscholastic sports 6.3 7.0 8.1 6.7 8.7 6.3 Cheerleading 7.8 9.3 11.4 7.4 10.9 8.0 Drama 6.1 6.4 7.8 6.0 8.6 5.5 Government 6.3 6.6 8.0 6.3 8.8 5.8 Honor society 6.4 6.8 8.2 6.4 8.8 6.0 Career clubs 6.5 7.4 8.6 6.7 9.1 6.4SOURCE: U.S. Department of Education, National Center for Education Statistics, National Education Longitudinal Study, 1988(NELS:88); Base Year and Second Follow-up Student Surveys.
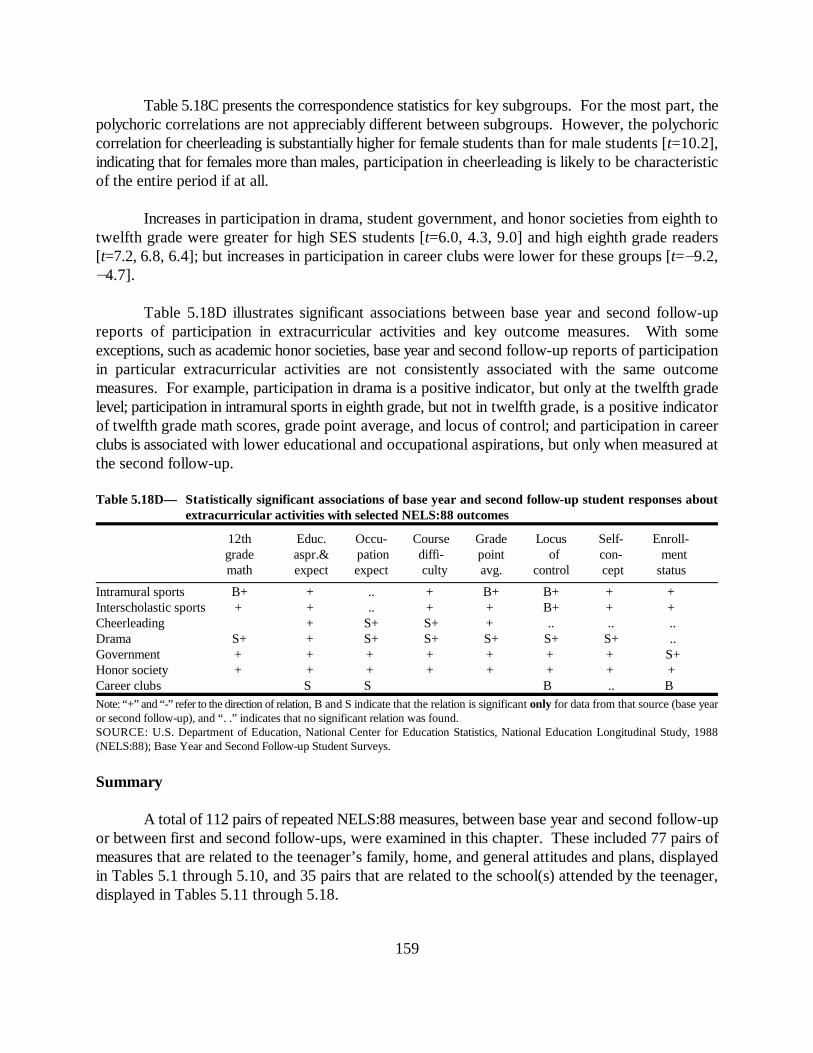
159
Table 5.18C presents the correspondence statistics for key subgroups. For the most part, thepolychoric correlations are not appreciably different between subgroups. However, the polychoriccorrelation for cheerleading is substantially higher for female students than for male students [t=10.2],indicating that for females more than males, participation in cheerleading is likely to be characteristicof the entire period if at all.
Increases in participation in drama, student government, and honor societies from eighth totwelfth grade were greater for high SES students [t=6.0, 4.3, 9.0] and high eighth grade readers[t=7.2, 6.8, 6.4]; but increases in participation in career clubs were lower for these groups [t=�9.2,�4.7].
Table 5.18D illustrates significant associations between base year and second follow-upreports of participation in extracurricular activities and key outcome measures. With someexceptions, such as academic honor societies, base year and second follow-up reports of participationin particular extracurricular activities are not consistently associated with the same outcomemeasures. For example, participation in drama is a positive indicator, but only at the twelfth gradelevel; participation in intramural sports in eighth grade, but not in twelfth grade, is a positive indicatorof twelfth grade math scores, grade point average, and locus of control; and participation in careerclubs is associated with lower educational and occupational aspirations, but only when measured atthe second follow-up.
Table 5.18D— Statistically significant associations of base year and second follow-up student responses aboutextracurricular activities with selected NELS:88 outcomes
12th Educ. Occu- Course Grade Locus Self- Enroll-grade aspr.& pation diffi- point of con- mentmath expect expect culty avg. control cept status
Intramural sports B+ + .. + B+ B+ + + Interscholastic sports + + .. + + B+ + + Cheerleading � + S+ S+ + .. .. ..Drama S+ + S+ S+ S+ S+ S+ ..Government + + + + + + + S+Honor society + + + + + + + + Career clubs � S� S� � � B� .. B�Note: “+” and “-” refer to the direction of relation, B and S indicate that the relation is significant only for data from that source (base yearor second follow-up), and “. .” indicates that no significant relation was found.SOURCE: U.S. Department of Education, National Center for Education Statistics, National Education Longitudinal Study, 1988(NELS:88); Base Year and Second Follow-up Student Surveys.
Summary
A total of 112 pairs of repeated NELS:88 measures, between base year and second follow-upor between first and second follow-ups, were examined in this chapter. These included 77 pairs ofmeasures that are related to the teenager’s family, home, and general attitudes and plans, displayedin Tables 5.1 through 5.10, and 35 pairs that are related to the school(s) attended by the teenager,displayed in Tables 5.11 through 5.18.
160
Convergence. A summary of the results presented in Tables 5.1A through 5.10A is shownin Table 5.19A and Figure 5.1. A corresponding Table and Figure, Table 5.19B and Figure 5.2,combine Tables 5.11A through 5.18A. Numbers presented in the figures correspond to the rownumbers shown in Tables 5.19A and 5.19B. Note that the use of “A” and “B” in these table numbersdiffers from their use elsewhere in this report: other “B” tables contain information about omissions,not convergence.
Generally, the polychoric correlations are of modest size, suggesting that the interpretationsof NELS:88 items generally depend on the age level at which they were administered. The mostnotable pattern in these data is that the polychoric correlation coefficients, which measure theconvergence of the pairs, are generally higher for pairs that include first and second follow-upmeasures. This is to be expected because the interval that separates those pairs is only half the lengthof the interval that separates the base year from the second follow-up. One might expect thedifference to be even more striking for the measures relating to schools, because most teenagersattend the same school in tenth and twelfth grades, while nearly all change schools between eighthand twelfth grades. However, the median polychoric correlations do not reflect this interaction.Compared to second follow-up measures, the median polychoric correlations are .45 and .39 for firstfollow-up measures related to home and school, respectively, and .32 and .26 for base year measuresrelated to home and school, respectively.
Not all of the polychoric correlations were modest. Teenagers responded nearly identicallyat base year and second follow-up to the question about whether English was their native language;and they were fairly stable in indicating whether the curriculum they were engaged in was intendedto prepare them for college and whether they planned to go to college. Their indications of religiositywere also much more stable than the other measures examined, whether asked as a self-perceptionor as an explicit behavioral indicator (frequency of attendance). While reported attendance at servicesdropped off, the correlation between years was high.
For these analyses, all measures were rescaled, if necessary, to a small number of discreteresponse categories. On that scale, a mean increase or decrease of 1.0 would indicate a large shiftbetween the earlier and later response distribution. Most of the changes in mean values were muchless than one half unit on the measure’s response scale, but as shown in Figures 5.1 and 5.2, severalwere on the order of .5 or -.5. Most notable were reports of decreases in discussions about schoolwith parents, in television watching, and in attending religious services and of increases in time spenton homework and remembering to bring pencil and paper to class. Whether these changes in reportsreflect real changes in behavior or merely different interpretations of the same behavior by teenagerscannot be determined directly from these data. In either case, interpretations of the reportedfrequencies of these behaviors should take into account the age at which the reports were made.
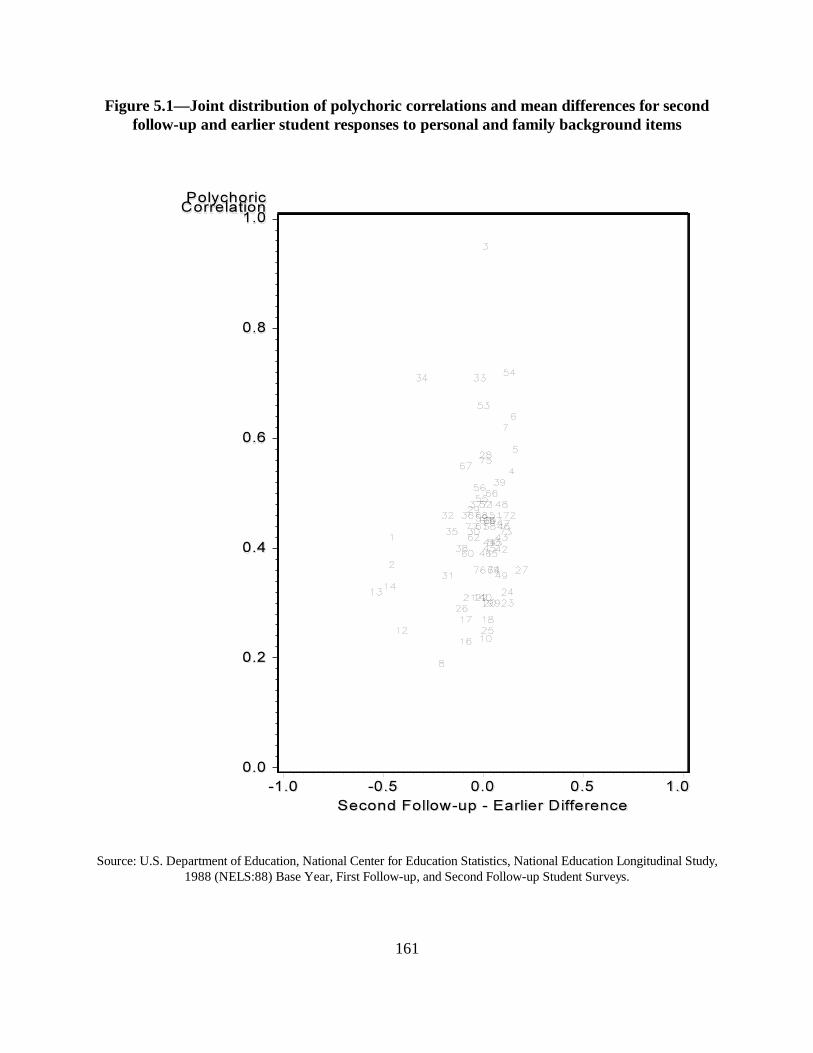
161
Figure 5.1—Joint distribution of polychoric correlations and mean differences for secondfollow-up and earlier student responses to personal and family background items
Source: U.S. Department of Education, National Center for Education Statistics, National Education Longitudinal Study,1988 (NELS:88) Base Year, First Follow-up, and Second Follow-up Student Surveys.
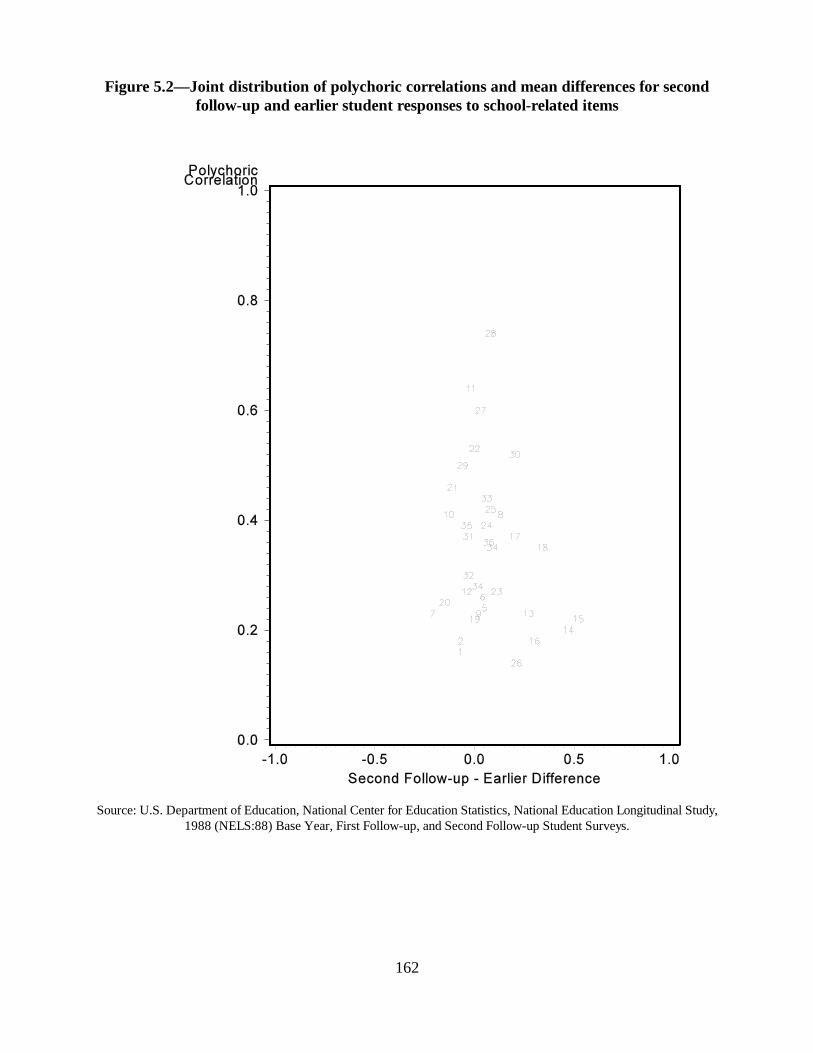
162
Figure 5.2—Joint distribution of polychoric correlations and mean differences for secondfollow-up and earlier student responses to school-related items
Source: U.S. Department of Education, National Center for Education Statistics, National Education Longitudinal Study,1988 (NELS:88) Base Year, First Follow-up, and Second Follow-up Student Surveys.
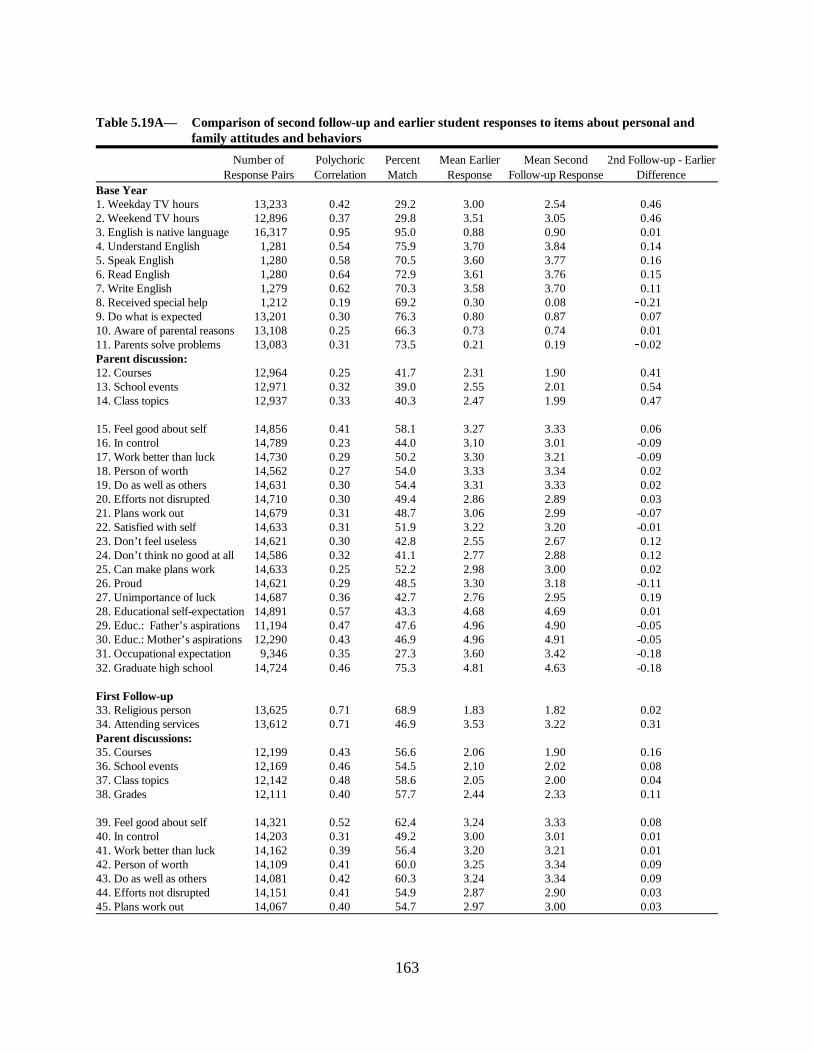
163
Table 5.19A— Comparison of second follow-up and earlier student responses to items about personal andfamily attitudes and behaviors
Number of Polychoric Percent Mean Earlier Mean Second 2nd Follow-up - EarlierResponse Pairs Correlation Match Response Follow-up Response Difference
Base Year1. Weekday TV hours 13,233 0.42 29.2 3.00 2.54 0.462. Weekend TV hours 12,896 0.37 29.8 3.51 3.05 0.463. English is native language 16,317 0.95 95.0 0.88 0.90 0.014. Understand English 1,281 0.54 75.9 3.70 3.84 0.145. Speak English 1,280 0.58 70.5 3.60 3.77 0.166. Read English 1,280 0.64 72.9 3.61 3.76 0.157. Write English 1,279 0.62 70.3 3.58 3.70 0.118. Received special help 1,212 0.19 69.2 0.30 0.08 0.219. Do what is expected 13,201 0.30 76.3 0.80 0.87 0.0710. Aware of parental reasons 13,108 0.25 66.3 0.73 0.74 0.0111. Parents solve problems 13,083 0.31 73.5 0.21 0.19 0.02Parent discussion:12. Courses 12,964 0.25 41.7 2.31 1.90 0.4113. School events 12,971 0.32 39.0 2.55 2.01 0.5414. Class topics 12,937 0.33 40.3 2.47 1.99 0.47
15. Feel good about self 14,856 0.41 58.1 3.27 3.33 0.0616. In control 14,789 0.23 44.0 3.10 3.01 -0.0917. Work better than luck 14,730 0.29 50.2 3.30 3.21 -0.0918. Person of worth 14,562 0.27 54.0 3.33 3.34 0.0219. Do as well as others 14,631 0.30 54.4 3.31 3.33 0.0220. Efforts not disrupted 14,710 0.30 49.4 2.86 2.89 0.0321. Plans work out 14,679 0.31 48.7 3.06 2.99 -0.0722. Satisfied with self 14,633 0.31 51.9 3.22 3.20 -0.0123. Don’t feel useless 14,621 0.30 42.8 2.55 2.67 0.1224. Don’t think no good at all 14,586 0.32 41.1 2.77 2.88 0.1225. Can make plans work 14,633 0.25 52.2 2.98 3.00 0.0226. Proud 14,621 0.29 48.5 3.30 3.18 -0.1127. Unimportance of luck 14,687 0.36 42.7 2.76 2.95 0.1928. Educational self-expectation 14,891 0.57 43.3 4.68 4.69 0.0129. Educ.: Father’s aspirations 11,194 0.47 47.6 4.96 4.90 -0.0530. Educ.: Mother’s aspirations 12,290 0.43 46.9 4.96 4.91 -0.0531. Occupational expectation 9,346 0.35 27.3 3.60 3.42 -0.1832. Graduate high school 14,724 0.46 75.3 4.81 4.63 -0.18
First Follow-up33. Religious person 13,625 0.71 68.9 1.83 1.82 0.0234. Attending services 13,612 0.71 46.9 3.53 3.22 0.31Parent discussions:35. Courses 12,199 0.43 56.6 2.06 1.90 0.1636. School events 12,169 0.46 54.5 2.10 2.02 0.0837. Class topics 12,142 0.48 58.6 2.05 2.00 0.0438. Grades 12,111 0.40 57.7 2.44 2.33 0.11
39. Feel good about self 14,321 0.52 62.4 3.24 3.33 0.0840. In control 14,203 0.31 49.2 3.00 3.01 0.0141. Work better than luck 14,162 0.39 56.4 3.20 3.21 0.0142. Person of worth 14,109 0.41 60.0 3.25 3.34 0.0943. Do as well as others 14,081 0.42 60.3 3.24 3.34 0.0944. Efforts not disrupted 14,151 0.41 54.9 2.87 2.90 0.0345. Plans work out 14,067 0.40 54.7 2.97 3.00 0.03

164
Table 5.19A— Comparison of second follow-up and earlier student responses to items about personal andfamily attitudes and behaviors—Continued
Number of Polychoric Percent Mean Earlier Mean Second 2nd Follow-up - EarlierResponse Pairs Correlation Match Response Follow-up Response Difference
46. Satisfied with self 14,095 0.44 56.6 3.11 3.21 0.1047. Don’t feel useless 14,071 0.45 51.0 2.58 2.67 0.0948. Don’t think no good at all 14,041 0.48 49.3 2.79 2.88 0.0949. Can make plans work 14,050 0.35 57.8 2.91 3.00 0.0950. Proud 14,026 0.41 54.8 3.14 3.19 0.05 51. Unimportance of luck 14,036 0.45 51.4 2.91 2.96 0.0552. Occupational expectation 10,192 0.48 39.7 4.30 4.30 0.0153. Graduate high school 14,208 0.66 75.7 4.66 4.66 0.0054. Go to college 14,159 0.72 58.8 4.11 4.25 0.1355. Have well paying job 14,123 0.50 51.2 4.15 4.14 -0.0156. Own a home 14,147 0.51 50.2 4.11 4.09 -0.0257. Enjoy job 14,124 0.45 51.2 4.22 4.28 0.0658. Happy family life 14,112 0.45 51.2 4.19 4.21 0.0259. Healthy 14,091 0.45 49.6 4.12 4.10 -0.0160. Live where want to 14,107 0.39 41.1 3.84 3.76 -0.0861. Respected in community 14,060 0.44 48.7 3.98 3.96 -0.0162. Have friends can count on 14,072 0.42 51.0 4.26 4.21 -0.0563. Better life than parents 13,993 0.45 46.8 3.81 3.83 0.0264. Child has better life 13,984 0.45 46.4 3.88 3.90 0.0365. Success in work 16,140 0.39 80.7 2.83 2.87 0.0466. Marrying the right person 16,146 0.50 73.4 2.71 2.76 0.0467. Having lots of money 16,133 0.55 62.0 2.37 2.28 -0.0968. Strong friendships 16,121 0.46 75.9 2.79 2.78 -0.0169. Steady work 16,104 0.36 79.9 2.82 2.88 0.0570. Helping the community 16,094 0.45 60.3 2.23 2.26 0.0371. Child having better future 16,082 0.48 71.3 2.69 2.71 0.0272. Living close to parents 16,076 0.46 54.6 2.03 1.90 -0.1373. Getting away from area 16,083 0.43 51.1 1.67 1.78 0.1174. Correcting inequalities 16,045 0.36 51.0 1.89 1.93 0.0575. Having children 16,093 0.56 57.6 2.27 2.28 0.0176. Having leisure time 16,089 0.36 63.6 2.64 2.62 -0.0277. Getting away from parents 16,097 0.44 53.6 1.72 1.66 -0.06
SOURCE: U.S. Department of Education, National Center for Education Statistics, National Education Longitudinal Study, 1988(NELS:88); Base Year and First and Second Follow-up Student Surveys.

165
Table 5.19B— Comparison of second follow-up and earlier student responses to items about school eventsNumber of Polychoric Percent Mean Earlier Mean Second 2nd Flw-up - Earlier
Response Pairs Correlation Match Response Follow-up Response Difference
versus Base Year 1. School spirit 15,874 0.18 43.4 2.86 2.79 -0.07 2. Discipline is fair 14,385 0.18 49.2 2.74 2.67 -0.07 3. Teaching is good 15,765 0.28 54.0 2.98 2.98 0.00 4. Teachers are interested 15,765 0.28 49.8 2.92 2.95 0.03 5. Feel safe at school 15,785 0.24 49.5 3.27 3.32 0.05 6. Learning not disrupted 15,804 0.26 42.4 2.67 2.71 0.04 7. Had Something stolen 14,489 0.23 52.5 0.56 0.35 -0.21 8. Was offered drugs 14,471 0.41 80.4 0.10 0.23 0.13 9. English as a 2nd language 13,632 0.23 90.7 0.04 0.06 0.0210. Advanced placement 13,951 0.41 62.2 0.54 0.41 -0.1311. Gifted and talented 13,859 0.64 80.7 0.21 0.19 -0.0212. Homework completed 13,923 0.27 49.5 3.06 3.02 -0.0413. Homework time for math 9,623 0.23 32.0 1.63 1.90 0.2714. Homework time for science 8,033 0.20 32.3 1.33 1.80 0.4715. Homework time for English 14,057 0.22 31.6 1.42 1.94 0.5216. Homework time for history 10,358 0.18 33.7 1.42 1.71 0.3017. Cut class 15,484 0.37 72.9 0.08 0.28 0.2018. Never attnd w/out pcil/paper 14,080 0.35 45.4 3.03 3.37 0.3419. Never attend w/out book 13,912 0.22 51.4 3.40 3.40 0.0020. Intramural sports 11,740 0.25 55.6 0.47 0.31 -0.1521. Interscholastic sports 12,719 0.46 55.1 0.55 0.44 -0.1122. Cheerleading 11,903 0.53 86.0 0.12 0.11 -0.0023. Drama 12,414 0.27 79.3 0.09 0.20 0.1124. Government 12,262 0.34 77.0 0.17 0.23 0.0625. Honor society 12,364 0.42 75.9 0.16 0.25 0.0826. Career clubs 11,192 0.14 78.2 0.04 0.26 0.21
versus First Follow-up27. Vocational track 14,476 0.53 87.4 0.08 0.11 0.0328. College prep. track 14,476 0.74 76.3 0.39 0.47 0.0829. General track 14,476 0.50 68.1 0.41 0.35 -0.0630. School spirit 15,682 0.38 50.1 2.82 2.79 -0.0331. Discipline is fair 14,348 0.30 53.9 2.70 2.67 -0.0332. Teaching is good 15,608 0.44 61.2 2.92 2.98 0.0633. Teachers are interested 15,593 0.42 56.1 2.86 2.95 0.0934. Feel safe at school 15,610 0.39 56.7 3.37 3.33 -0.0435. Learning not disrupted 15,606 0.36 47.1 2.65 2.72 0.07
SOURCE: U.S. Department of Education, National Center for Education Statistics, National Education Longitudinal Study, 1988(NELS:88); Base Year and First and Second Follow-up Student Surveys.
Omission Rates. The information on omission rates, shown in Tables 5.20A and 5.20B,shows a general tendency for more omissions in the first follow-up than in the base year and mostomissions in the second follow-up. This tendency is not due to failure of teenagers to returnfollow-up questionnaires, because the analyses are limited to the subset of NELS:88 participantswith nonzero second follow-up panel weights, and therefore to participants who returned aquestionnaire for each of the surveys.
There are noticeable exceptions to the general pattern, and in interpreting them, readersshould note that for these analyses, noninformative responses, such as “I don’t know,” weretreated as omissions, because that is how they are generally treated by researchers who use
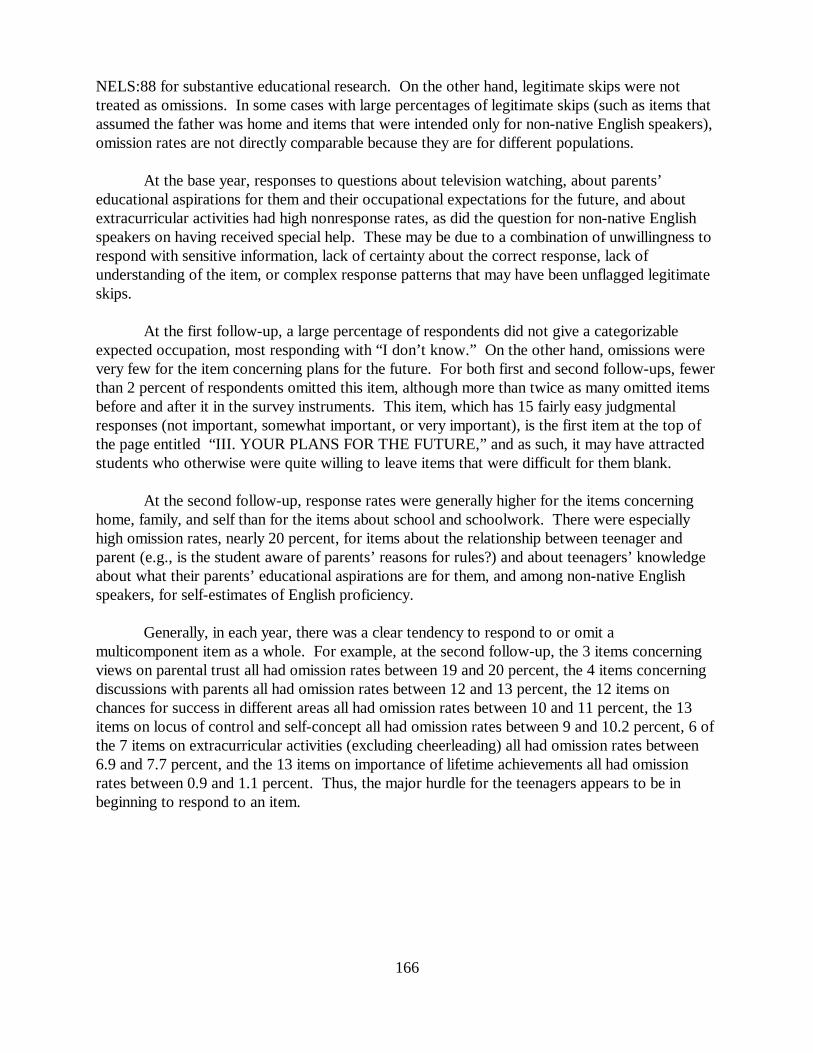
166
NELS:88 for substantive educational research. On the other hand, legitimate skips were nottreated as omissions. In some cases with large percentages of legitimate skips (such as items thatassumed the father was home and items that were intended only for non-native English speakers),omission rates are not directly comparable because they are for different populations.
At the base year, responses to questions about television watching, about parents’educational aspirations for them and their occupational expectations for the future, and aboutextracurricular activities had high nonresponse rates, as did the question for non-native Englishspeakers on having received special help. These may be due to a combination of unwillingness torespond with sensitive information, lack of certainty about the correct response, lack ofunderstanding of the item, or complex response patterns that may have been unflagged legitimateskips.
At the first follow-up, a large percentage of respondents did not give a categorizableexpected occupation, most responding with “I don’t know.” On the other hand, omissions werevery few for the item concerning plans for the future. For both first and second follow-ups, fewerthan 2 percent of respondents omitted this item, although more than twice as many omitted itemsbefore and after it in the survey instruments. This item, which has 15 fairly easy judgmentalresponses (not important, somewhat important, or very important), is the first item at the top ofthe page entitled “III. YOUR PLANS FOR THE FUTURE,” and as such, it may have attractedstudents who otherwise were quite willing to leave items that were difficult for them blank.
At the second follow-up, response rates were generally higher for the items concerninghome, family, and self than for the items about school and schoolwork. There were especiallyhigh omission rates, nearly 20 percent, for items about the relationship between teenager andparent (e.g., is the student aware of parents’ reasons for rules?) and about teenagers’ knowledgeabout what their parents’ educational aspirations are for them, and among non-native Englishspeakers, for self-estimates of English proficiency.
Generally, in each year, there was a clear tendency to respond to or omit amulticomponent item as a whole. For example, at the second follow-up, the 3 items concerningviews on parental trust all had omission rates between 19 and 20 percent, the 4 items concerningdiscussions with parents all had omission rates between 12 and 13 percent, the 12 items onchances for success in different areas all had omission rates between 10 and 11 percent, the 13items on locus of control and self-concept all had omission rates between 9 and 10.2 percent, 6 ofthe 7 items on extracurricular activities (excluding cheerleading) all had omission rates between6.9 and 7.7 percent, and the 13 items on importance of lifetime achievements all had omissionrates between 0.9 and 1.1 percent. Thus, the major hurdle for the teenagers appears to be inbeginning to respond to an item.
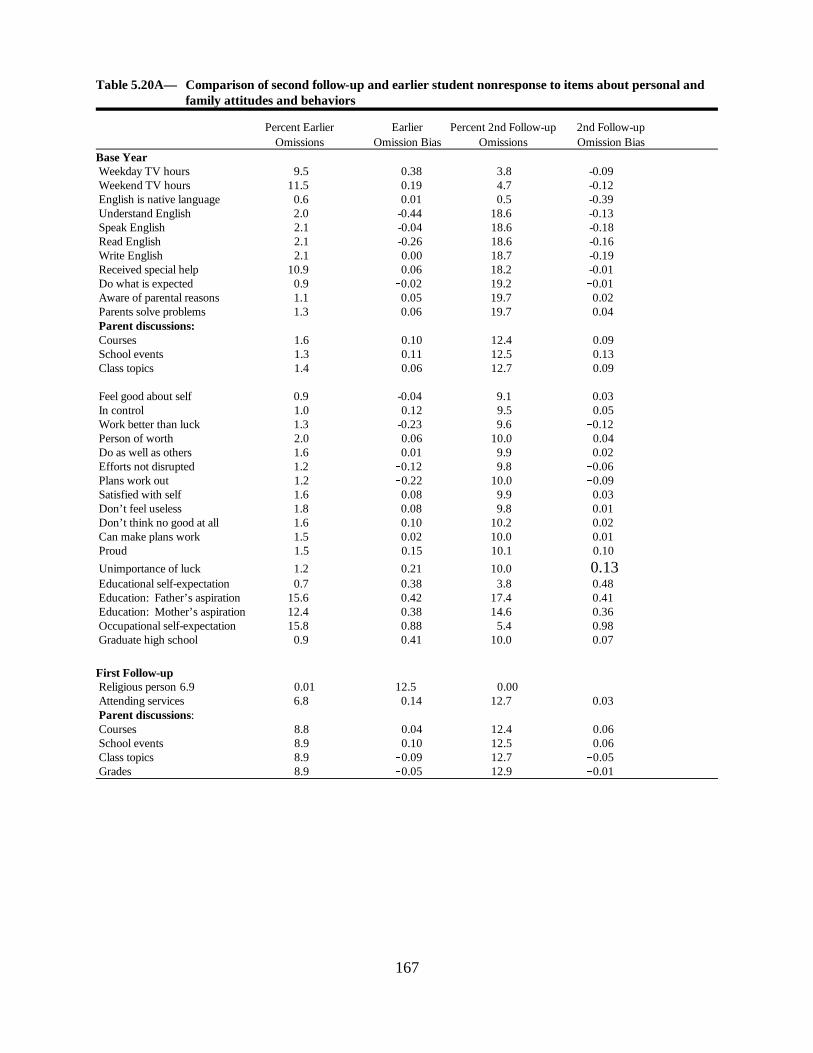
167
Table 5.20A— Comparison of second follow-up and earlier student nonresponse to items about personal andfamily attitudes and behaviors
Percent Earlier Earlier Percent 2nd Follow-up 2nd Follow-upOmissions Omission Bias Omissions Omission Bias
Base Year Weekday TV hours 9.5 0.38 3.8 -0.09 Weekend TV hours 11.5 0.19 4.7 -0.12 English is native language 0.6 0.01 0.5 -0.39 Understand English 2.0 -0.44 18.6 -0.13 Speak English 2.1 -0.04 18.6 -0.18 Read English 2.1 -0.26 18.6 -0.16 Write English 2.1 0.00 18.7 -0.19 Received special help 10.9 0.06 18.2 -0.01 Do what is expected 0.9 0.02 19.2 0.01 Aware of parental reasons 1.1 0.05 19.7 0.02 Parents solve problems 1.3 0.06 19.7 0.04 Parent discussions: Courses 1.6 0.10 12.4 0.09 School events 1.3 0.11 12.5 0.13 Class topics 1.4 0.06 12.7 0.09 Feel good about self 0.9 -0.04 9.1 0.03 In control 1.0 0.12 9.5 0.05 Work better than luck 1.3 -0.23 9.6 0.12 Person of worth 2.0 0.06 10.0 0.04 Do as well as others 1.6 0.01 9.9 0.02 Efforts not disrupted 1.2 0.12 9.8 0.06 Plans work out 1.2 0.22 10.0 0.09 Satisfied with self 1.6 0.08 9.9 0.03 Don’t feel useless 1.8 0.08 9.8 0.01 Don’t think no good at all 1.6 0.10 10.2 0.02 Can make plans work 1.5 0.02 10.0 0.01 Proud 1.5 0.15 10.1 0.10
Unimportance of luck 1.2 0.21 10.0 0.13 Educational self-expectation 0.7 0.38 3.8 0.48 Education: Father’s aspiration 15.6 0.42 17.4 0.41 Education: Mother’s aspiration 12.4 0.38 14.6 0.36 Occupational self-expectation 15.8 0.88 5.4 0.98 Graduate high school 0.9 0.41 10.0 0.07
First Follow-up Religious person 6.9 0.01 12.5 0.00 Attending services 6.8 0.14 12.7 0.03 Parent discussions: Courses 8.8 0.04 12.4 0.06 School events 8.9 0.10 12.5 0.06 Class topics 8.9 0.09 12.7 0.05 Grades 8.9 0.05 12.9 0.01
168
Table 5.20A— Comparison of second follow-up and earlier student nonresponse to items about personal andfamily attitudes and behaviors—Continued
Percent Earlier Earlier Percent 2nd Follow-up 2nd Follow-upOmissions Omission Bias Omissions Omission Bias
Feel good about self 5.2 0.01 9.1 -0.01 In control 5.6 -0.10 9.5 -0.06 Work better than luck 5.8 -0.09 9.6 -0.06 Person of worth 5.7 -0.08 10.0 -0.01 Do as well as others 6.0 -0.07 9.9 -0.03 Efforts not disrupted 5.7 -0.18 9.8 -0.06 Plans work out 6.0 -0.17 10.0 -0.07 Satisfied with self 6.0 -0.08 9.9 -0.02 Don’t feel useless 6.2 0.01 9.8 -0.00 Don’t think no good at all 6.1 -0.03 10.2 -0.01 Can make plans work 6.1 -0.01 10.0 -0.01 Proud 6.2 -0.13 10.1 -0.08 Unimportance of luck 6.3 -0.24 10.0 -0.08 Occupational self-expectation 16.2 0.97 5.4 1.58 Graduate high school 5.0 -0.78 10.0 -0.17 Go to college 5.3 -0.87 10.0 -0.27 Have well paying job 5.3 -0.30 10.3 -0.12 Own a home 5.3 -0.28 10.1 -0.09 Enjoy job 5.3 -0.31 10.2 -0.10 Happy family life 5.4 -0.12 10.2 -0.08 Healthy 5.5 -0.14 10.3 -0.08 Live where want to 5.5 -0.23 10.2 -0.04 Respected in the community 5.7 -0.19 10.3 -0.05 Have friends can count on 5.6 -0.24 10.3 -0.08 Life better than parents 5.9 -0.13 10.5 -0.05 Child has better life 5.9 0.11 10.7 0.03 Success in work 1.3 -0.16 0.9 -0.11 Marrying the right person 1.3 -0.06 0.9 -0.10 Having lots of money 1.3 0.05 0.9 -0.05 Strong Friendships 1.4 -0.19 0.9 -0.03 Steady work 1.4 -0.06 1.0 -0.06 Helping the community 1.4 0.00 1.0 -0.07 Child having better future 1.5 0.07 1.0 -0.02 Living close to parents 1.6 0.12 1.0 -0.04 Getting away from area 1.5 0.05 1.0 0.08 Correcting inequalities 1.6 0.05 1.1 0.09 Having children 1.5 -0.14 1.0 -0.05 Having leisure time 1.5 -0.13 1.0 -0.05 Getting away from parents 1.4 -0.02 1.1 0.06
SOURCE: U.S. Department of Education, National Center for Education Statistics, National Education Longitudinal Study, 1988(NELS:88); Base Year and First and Second Follw-up Student Surveys
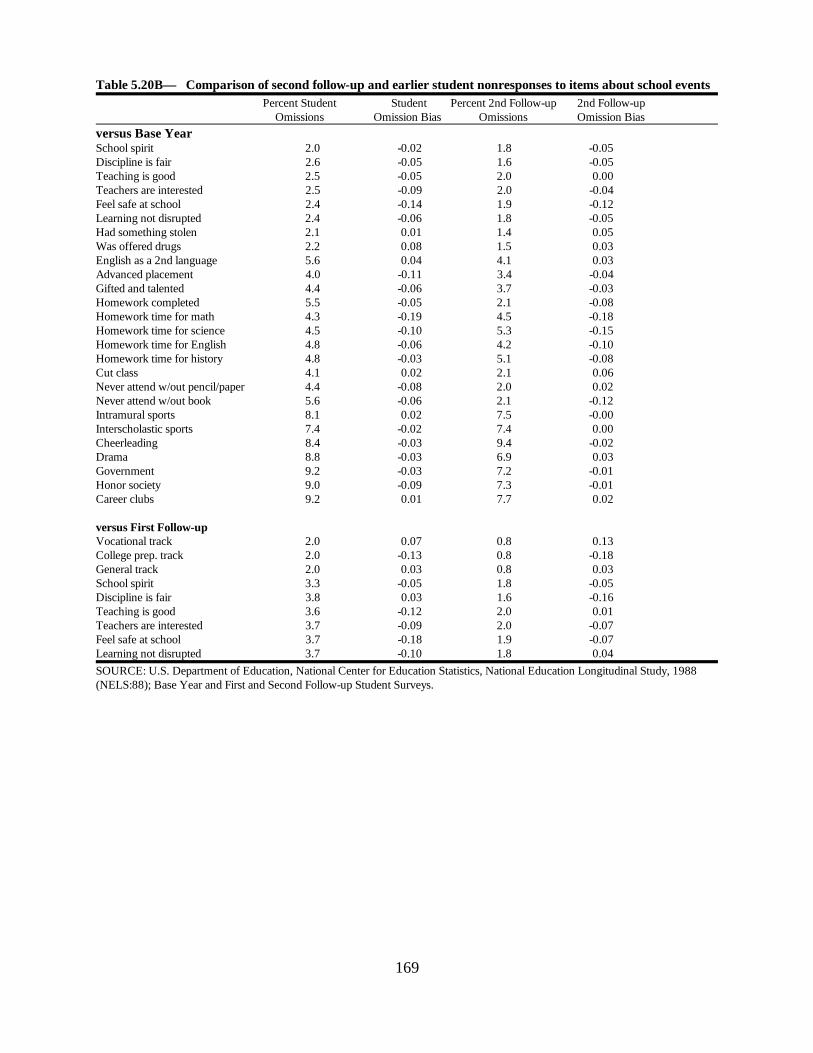
169
Table 5.20B— Comparison of second follow-up and earlier student nonresponses to items about school eventsPercent Student Student Percent 2nd Follow-up 2nd Follow-up
Omissions Omission Bias Omissions Omission Bias
versus Base YearSchool spirit 2.0 -0.02 1.8 -0.05Discipline is fair 2.6 -0.05 1.6 -0.05Teaching is good 2.5 -0.05 2.0 0.00Teachers are interested 2.5 -0.09 2.0 -0.04Feel safe at school 2.4 -0.14 1.9 -0.12Learning not disrupted 2.4 -0.06 1.8 -0.05Had something stolen 2.1 0.01 1.4 0.05Was offered drugs 2.2 0.08 1.5 0.03English as a 2nd language 5.6 0.04 4.1 0.03Advanced placement 4.0 -0.11 3.4 -0.04Gifted and talented 4.4 -0.06 3.7 -0.03Homework completed 5.5 -0.05 2.1 -0.08Homework time for math 4.3 -0.19 4.5 -0.18Homework time for science 4.5 -0.10 5.3 -0.15Homework time for English 4.8 -0.06 4.2 -0.10Homework time for history 4.8 -0.03 5.1 -0.08Cut class 4.1 0.02 2.1 0.06Never attend w/out pencil/paper 4.4 -0.08 2.0 0.02Never attend w/out book 5.6 -0.06 2.1 -0.12Intramural sports 8.1 0.02 7.5 -0.00Interscholastic sports 7.4 -0.02 7.4 0.00Cheerleading 8.4 -0.03 9.4 -0.02Drama 8.8 -0.03 6.9 0.03Government 9.2 -0.03 7.2 -0.01Honor society 9.0 -0.09 7.3 -0.01Career clubs 9.2 0.01 7.7 0.02
versus First Follow-upVocational track 2.0 0.07 0.8 0.13College prep. track 2.0 -0.13 0.8 -0.18General track 2.0 0.03 0.8 0.03School spirit 3.3 -0.05 1.8 -0.05Discipline is fair 3.8 0.03 1.6 -0.16Teaching is good 3.6 -0.12 2.0 0.01Teachers are interested 3.7 -0.09 2.0 -0.07Feel safe at school 3.7 -0.18 1.9 -0.07Learning not disrupted 3.7 -0.10 1.8 0.04
SOURCE: U.S. Department of Education, National Center for Education Statistics, National Education Longitudinal Study, 1988(NELS:88); Base Year and First and Second Follow-up Student Surveys.
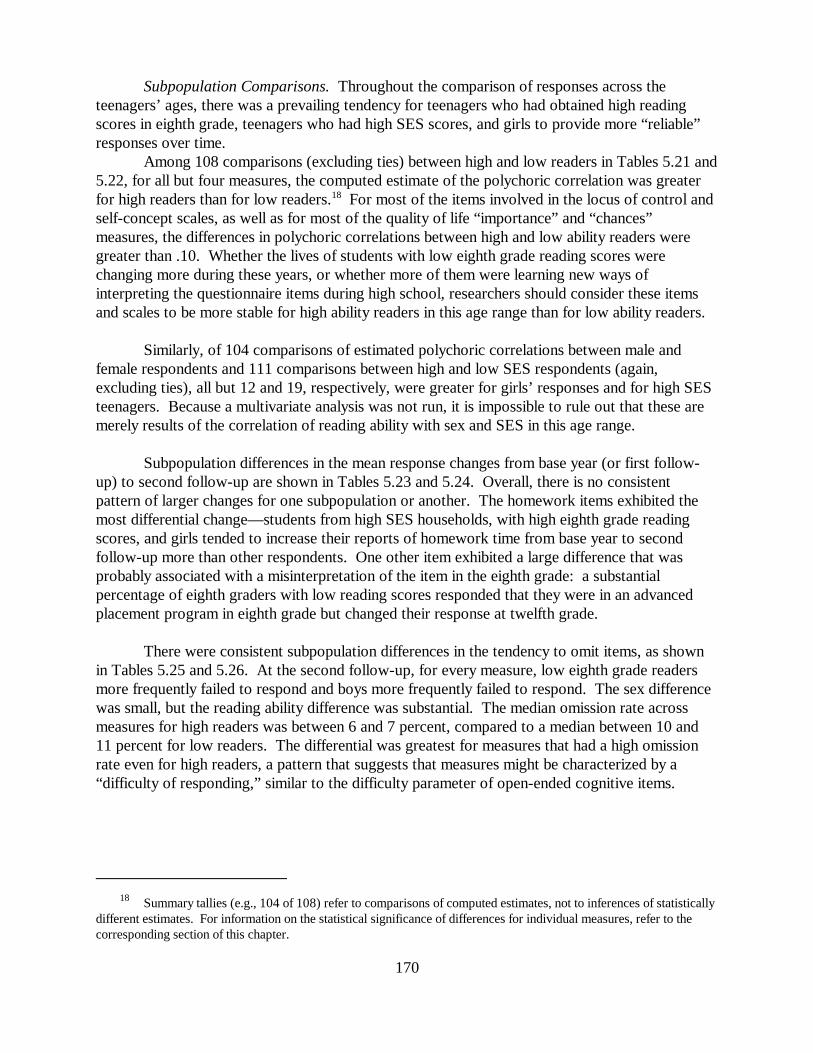
Summary tallies (e.g., 104 of 108) refer to comparisons of computed estimates, not to inferences of statistically18
different estimates. For information on the statistical significance of differences for individual measures, refer to thecorresponding section of this chapter.
170
Subpopulation Comparisons. Throughout the comparison of responses across theteenagers’ ages, there was a prevailing tendency for teenagers who had obtained high readingscores in eighth grade, teenagers who had high SES scores, and girls to provide more “reliable”responses over time.
Among 108 comparisons (excluding ties) between high and low readers in Tables 5.21 and5.22, for all but four measures, the computed estimate of the polychoric correlation was greaterfor high readers than for low readers. For most of the items involved in the locus of control and18
self-concept scales, as well as for most of the quality of life “importance” and “chances”measures, the differences in polychoric correlations between high and low ability readers weregreater than .10. Whether the lives of students with low eighth grade reading scores werechanging more during these years, or whether more of them were learning new ways ofinterpreting the questionnaire items during high school, researchers should consider these itemsand scales to be more stable for high ability readers in this age range than for low ability readers.
Similarly, of 104 comparisons of estimated polychoric correlations between male andfemale respondents and 111 comparisons between high and low SES respondents (again,excluding ties), all but 12 and 19, respectively, were greater for girls’ responses and for high SESteenagers. Because a multivariate analysis was not run, it is impossible to rule out that these aremerely results of the correlation of reading ability with sex and SES in this age range.
Subpopulation differences in the mean response changes from base year (or first follow-up) to second follow-up are shown in Tables 5.23 and 5.24. Overall, there is no consistentpattern of larger changes for one subpopulation or another. The homework items exhibited themost differential change—students from high SES households, with high eighth grade readingscores, and girls tended to increase their reports of homework time from base year to secondfollow-up more than other respondents. One other item exhibited a large difference that wasprobably associated with a misinterpretation of the item in the eighth grade: a substantialpercentage of eighth graders with low reading scores responded that they were in an advancedplacement program in eighth grade but changed their response at twelfth grade.
There were consistent subpopulation differences in the tendency to omit items, as shownin Tables 5.25 and 5.26. At the second follow-up, for every measure, low eighth grade readersmore frequently failed to respond and boys more frequently failed to respond. The sex differencewas small, but the reading ability difference was substantial. The median omission rate acrossmeasures for high readers was between 6 and 7 percent, compared to a median between 10 and11 percent for low readers. The differential was greatest for measures that had a high omissionrate even for high readers, a pattern that suggests that measures might be characterized by a“difficulty of responding,” similar to the difficulty parameter of open-ended cognitive items.

171
Table 5.21— Subpopulation comparisons of polychoric correlations between second follow-up and earlieryears for items about personal and family attitudes and behaviors
8th GradeSES Sex Reading
Low High Male Female Low Highversus Base Year
Weekday TV hours 0.34 0.46 0.39 0.44 0.33 0.46Weekend TV hours 0.33 0.39 0.37 0.36 0.32 0.40Is native language 0.95 0.92 0.94 0.95 0.94 0.96Understand English 0.47 0.37 0.48 0.59 0.46 0.62Speak English 0.57 0.45 0.48 0.59 0.51 0.70Read English 0.62 0.63 0.64 0.64 0.57 0.72Write English 0.60 0.57 0.59 0.64 0.53 0.72Received special help 0.21 -0.15 0.17 0.21 0.16 0.35Do what is expected 0.25 0.34 0.26 0.33 0.29 0.32Aware of parental reasons 0.22 0.28 0.22 0.27 0.21 0.26Parents solve problems 0.27 0.32 0.30 0.32 0.28 0.31Parent discussions:Courses 0.25 0.19 0.22 0.26 0.24 0.24School events 0.27 0.31 0.28 0.35 0.26 0.33Class topics 0.29 0.31 0.31 0.33 0.27 0.34
Feel good about self 0.40 0.42 0.36 0.41 0.40 0.42In control 0.22 0.24 0.22 0.24 0.19 0.25Work better than luck 0.27 0.30 0.27 0.30 0.26 0.25Person of worth 0.23 0.32 0.26 0.27 0.22 0.30Do as well as others 0.27 0.32 0.26 0.31 0.24 0.34Efforts not disrupted 0.28 0.31 0.28 0.33 0.24 0.31Plans work out 0.29 0.31 0.28 0.34 0.25 0.31Satisfied with self 0.27 0.35 0.26 0.36 0.26 0.36Don’t feel useless 0.28 0.34 0.27 0.30 0.27 0.33Don’t think no good at all 0.31 0.34 0.28 0.34 0.28 0.36Can make plans work 0.27 0.23 0.22 0.28 0.24 0.26Proud 0.26 0.31 0.28 0.31 0.23 0.31Unimportance of luck 0.32 0.37 0.32 0.41 0.30 0.34Educational self-expectation 0.48 0.53 0.57 0.56 0.45 0.55Education: Father’s aspiration 0.38 0.45 0.47 0.46 0.38 0.46Education: Mother’s aspiration 0.36 0.42 0.44 0.43 0.35 0.44Occupational self-expectation 0.34 0.30 0.39 0.27 0.32 0.29Graduate high school 0.43 0.42 0.45 0.47 0.38 0.39
First follow-upReligious person 0.66 0.76 0.68 0.73 0.63 0.76Attending services 0.67 0.77 0.71 0.71 0.63 0.77Parent discussions:Courses 0.40 0.41 0.39 0.45 0.40 0.45School events 0.41 0.46 0.42 0.48 0.40 0.47Class topics 0.43 0.49 0.43 0.51 0.41 0.52
Grades 0.39 0.40 0.35 0.44 0.36 0.43Feel good about self 0.52 0.54 0.47 0.55 0.49 0.56In control 0.28 0.33 0.28 0.34 0.26 0.35Work better than luck 0.37 0.41 0.35 0.42 0.33 0.41Person of worth 0.36 0.46 0.38 0.43 0.33 0.47Do as well as others 0.37 0.46 0.38 0.44 0.36 0.46Efforts not disrupted 0.39 0.42 0.38 0.44 0.33 0.44Plans work out 0.37 0.41 0.36 0.43 0.33 0.42

172
Table 5.21— Subpopulation comparisons of polychoric correlations between second follow-up and earlieryears for items about personal and family attitudes and behaviors—Continued
8th GradeSES Sex Reading
Low High Male Female Low HighSatisfied with self 0.38 0.50 0.40 0.47 0.35 0.52Don’t feel useless 0.42 0.49 0.41 0.47 0.39 0.50Don’t think no good at all 0.46 0.52 0.45 0.49 0.43 0.52Can make plans work 0.34 0.38 0.32 0.36 0.29 0.40Proud 0.38 0.43 0.39 0.43 0.35 0.44Unimportance of luck 0.41 0.47 0.39 0.50 0.39 0.45Occupational self-expectation 0.43 0.47 0.51 0.41 0.41 0.46Graduate high school 0.63 0.63 0.66 0.66 0.59 0.64Go to college 0.66 0.68 0.72 0.72 0.64 0.71Have well paying job 0.45 0.51 0.48 0.51 0.42 0.54Own home 0.46 0.54 0.51 0.52 0.44 0.56Enjoy job 0.40 0.48 0.44 0.47 0.40 0.48Happy family life 0.40 0.49 0.44 0.46 0.40 0.49Healthy 0.41 0.48 0.44 0.45 0.38 0.50Live where want to 0.36 0.43 0.38 0.40 0.34 0.43Respected in community 0.40 0.47 0.44 0.44 0.38 0.50Have friends can count on 0.39 0.42 0.39 0.45 0.38 0.45Life better than parents 0.42 0.47 0.43 0.47 0.38 0.51Child has better life 0.41 0.46 0.42 0.47 0.39 0.48Success in work 0.38 0.43 0.36 0.42 0.37 0.40Marrying the right person 0.46 0.55 0.46 0.53 0.44 0.55Having lots of money 0.51 0.59 0.49 0.57 0.49 0.58Strong friendships 0.44 0.46 0.41 0.52 0.41 0.47Steady work 0.32 0.40 0.33 0.38 0.31 0.40Helping the community 0.41 0.49 0.44 0.43 0.40 0.50Child having better future 0.41 0.51 0.45 0.51 0.38 0.54Living close to parents 0.41 0.49 0.44 0.47 0.38 0.51Getting away from area 0.40 0.46 0.41 0.45 0.36 0.49Correcting inequalities 0.31 0.41 0.33 0.37 0.27 0.44Having children 0.52 0.60 0.51 0.60 0.49 0.62Having leisure time 0.32 0.38 0.35 0.37 0.32 0.38Getting away from parents 0.42 0.47 0.41 0.47 0.39 0.47
SOURCE: U.S. Department of Education, National Center for Education Statistics, National Education Longitudinal Study, 1988(NELS:88); Base Year and First and Second Follow-up Student Surveys.
A similar pattern of more frequent omissions was observed for low SES teenagers, but itwas a much smaller effect; and for one set of items, the extracurricular participation measures,high SES teenagers more frequently failed to respond.
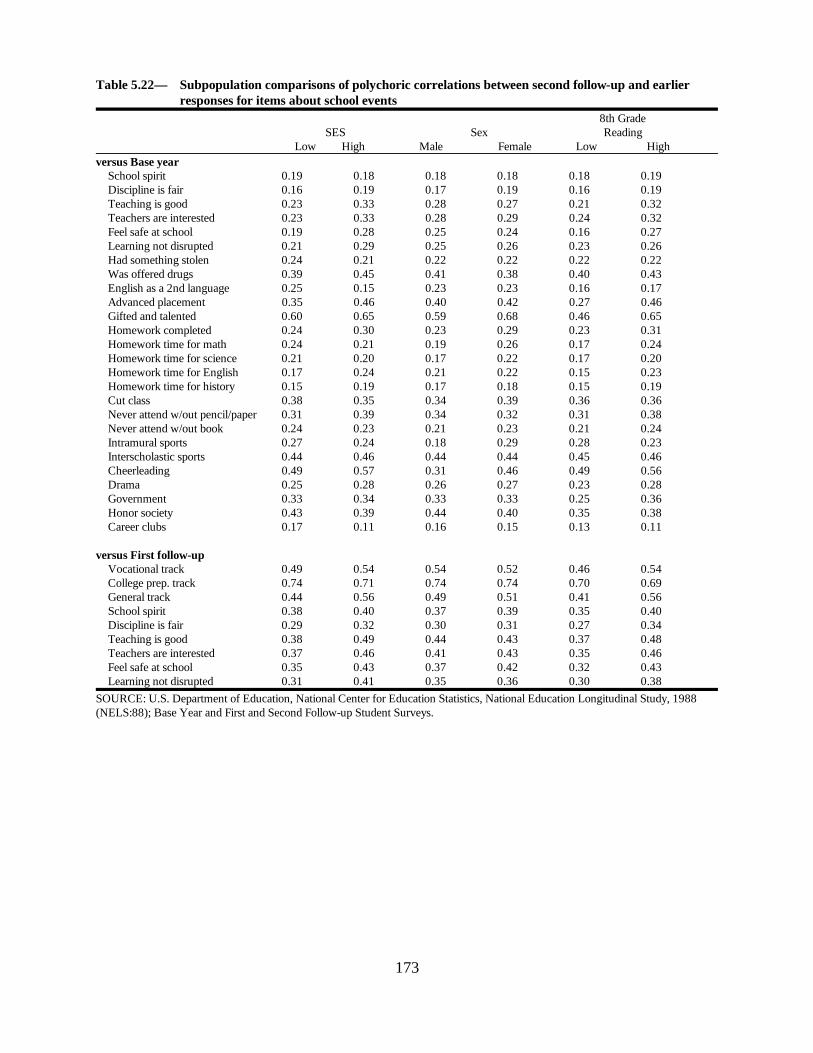
173
Table 5.22— Subpopulation comparisons of polychoric correlations between second follow-up and earlierresponses for items about school events
8th GradeSES Sex Reading
Low High Male Female Low Highversus Base year
School spirit 0.19 0.18 0.18 0.18 0.18 0.19Discipline is fair 0.16 0.19 0.17 0.19 0.16 0.19Teaching is good 0.23 0.33 0.28 0.27 0.21 0.32Teachers are interested 0.23 0.33 0.28 0.29 0.24 0.32Feel safe at school 0.19 0.28 0.25 0.24 0.16 0.27Learning not disrupted 0.21 0.29 0.25 0.26 0.23 0.26Had something stolen 0.24 0.21 0.22 0.22 0.22 0.22Was offered drugs 0.39 0.45 0.41 0.38 0.40 0.43English as a 2nd language 0.25 0.15 0.23 0.23 0.16 0.17Advanced placement 0.35 0.46 0.40 0.42 0.27 0.46Gifted and talented 0.60 0.65 0.59 0.68 0.46 0.65Homework completed 0.24 0.30 0.23 0.29 0.23 0.31Homework time for math 0.24 0.21 0.19 0.26 0.17 0.24Homework time for science 0.21 0.20 0.17 0.22 0.17 0.20Homework time for English 0.17 0.24 0.21 0.22 0.15 0.23Homework time for history 0.15 0.19 0.17 0.18 0.15 0.19Cut class 0.38 0.35 0.34 0.39 0.36 0.36Never attend w/out pencil/paper 0.31 0.39 0.34 0.32 0.31 0.38 Never attend w/out book 0.24 0.23 0.21 0.23 0.21 0.24Intramural sports 0.27 0.24 0.18 0.29 0.28 0.23Interscholastic sports 0.44 0.46 0.44 0.44 0.45 0.46Cheerleading 0.49 0.57 0.31 0.46 0.49 0.56Drama 0.25 0.28 0.26 0.27 0.23 0.28Government 0.33 0.34 0.33 0.33 0.25 0.36Honor society 0.43 0.39 0.44 0.40 0.35 0.38Career clubs 0.17 0.11 0.16 0.15 0.13 0.11
versus First follow-upVocational track 0.49 0.54 0.54 0.52 0.46 0.54College prep. track 0.74 0.71 0.74 0.74 0.70 0.69General track 0.44 0.56 0.49 0.51 0.41 0.56School spirit 0.38 0.40 0.37 0.39 0.35 0.40Discipline is fair 0.29 0.32 0.30 0.31 0.27 0.34Teaching is good 0.38 0.49 0.44 0.43 0.37 0.48Teachers are interested 0.37 0.46 0.41 0.43 0.35 0.46Feel safe at school 0.35 0.43 0.37 0.42 0.32 0.43Learning not disrupted 0.31 0.41 0.35 0.36 0.30 0.38
SOURCE: U.S. Department of Education, National Center for Education Statistics, National Education Longitudinal Study, 1988(NELS:88); Base Year and First and Second Follow-up Student Surveys.
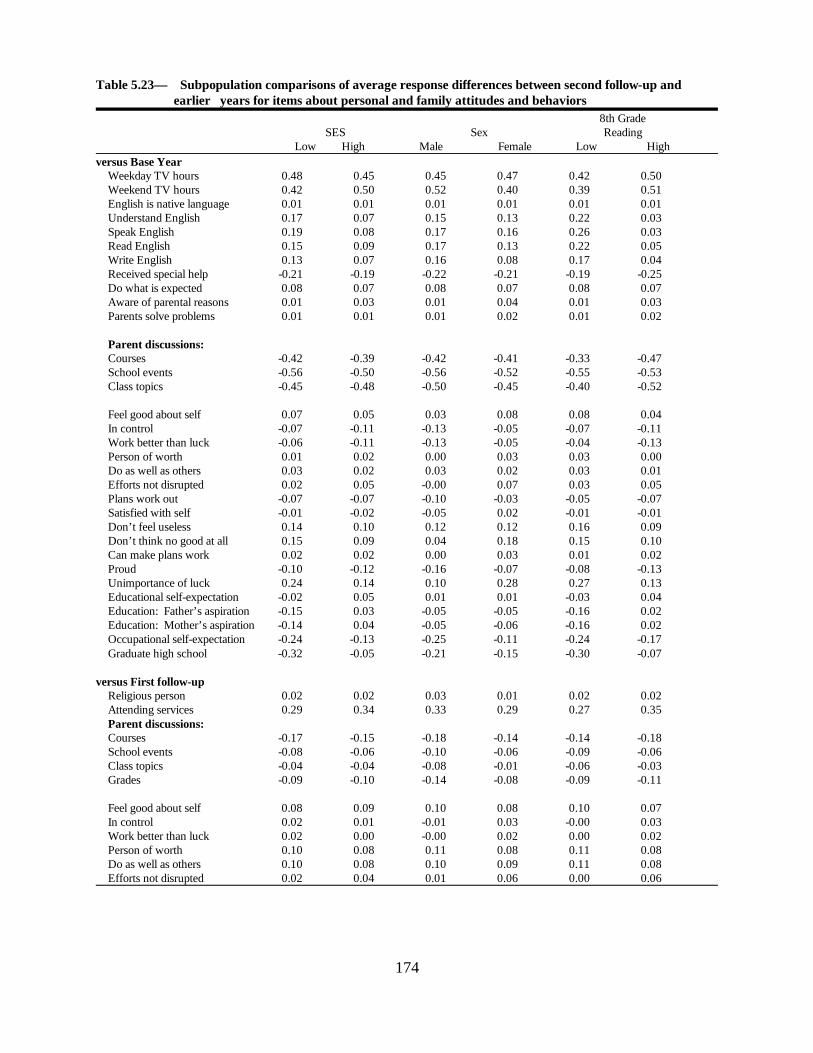
174
Table 5.23— Subpopulation comparisons of average response differences between second follow-up andearlier years for items about personal and family attitudes and behaviors
8th GradeSES Sex Reading
Low High Male Female Low Highversus Base Year
Weekday TV hours 0.48 0.45 0.45 0.47 0.42 0.50Weekend TV hours 0.42 0.50 0.52 0.40 0.39 0.51English is native language 0.01 0.01 0.01 0.01 0.01 0.01Understand English 0.17 0.07 0.15 0.13 0.22 0.03Speak English 0.19 0.08 0.17 0.16 0.26 0.03Read English 0.15 0.09 0.17 0.13 0.22 0.05Write English 0.13 0.07 0.16 0.08 0.17 0.04Received special help -0.21 -0.19 -0.22 -0.21 -0.19 -0.25Do what is expected 0.08 0.07 0.08 0.07 0.08 0.07Aware of parental reasons 0.01 0.03 0.01 0.04 0.01 0.03Parents solve problems 0.01 0.01 0.01 0.02 0.01 0.02
Parent discussions:Courses -0.42 -0.39 -0.42 -0.41 -0.33 -0.47School events -0.56 -0.50 -0.56 -0.52 -0.55 -0.53Class topics -0.45 -0.48 -0.50 -0.45 -0.40 -0.52
Feel good about self 0.07 0.05 0.03 0.08 0.08 0.04In control -0.07 -0.11 -0.13 -0.05 -0.07 -0.11Work better than luck -0.06 -0.11 -0.13 -0.05 -0.04 -0.13Person of worth 0.01 0.02 0.00 0.03 0.03 0.00Do as well as others 0.03 0.02 0.03 0.02 0.03 0.01Efforts not disrupted 0.02 0.05 -0.00 0.07 0.03 0.05Plans work out -0.07 -0.07 -0.10 -0.03 -0.05 -0.07Satisfied with self -0.01 -0.02 -0.05 0.02 -0.01 -0.01Don’t feel useless 0.14 0.10 0.12 0.12 0.16 0.09Don’t think no good at all 0.15 0.09 0.04 0.18 0.15 0.10Can make plans work 0.02 0.02 0.00 0.03 0.01 0.02Proud -0.10 -0.12 -0.16 -0.07 -0.08 -0.13Unimportance of luck 0.24 0.14 0.10 0.28 0.27 0.13Educational self-expectation -0.02 0.05 0.01 0.01 -0.03 0.04Education: Father’s aspiration -0.15 0.03 -0.05 -0.05 -0.16 0.02Education: Mother’s aspiration -0.14 0.04 -0.05 -0.06 -0.16 0.02Occupational self-expectation -0.24 -0.13 -0.25 -0.11 -0.24 -0.17Graduate high school -0.32 -0.05 -0.21 -0.15 -0.30 -0.07
versus First follow-upReligious person 0.02 0.02 0.03 0.01 0.02 0.02Attending services 0.29 0.34 0.33 0.29 0.27 0.35Parent discussions:Courses -0.17 -0.15 -0.18 -0.14 -0.14 -0.18School events -0.08 -0.06 -0.10 -0.06 -0.09 -0.06Class topics -0.04 -0.04 -0.08 -0.01 -0.06 -0.03Grades -0.09 -0.10 -0.14 -0.08 -0.09 -0.11
Feel good about self 0.08 0.09 0.10 0.08 0.10 0.07In control 0.02 0.01 -0.01 0.03 -0.00 0.03Work better than luck 0.02 0.00 -0.00 0.02 0.00 0.02Person of worth 0.10 0.08 0.11 0.08 0.11 0.08Do as well as others 0.10 0.08 0.10 0.09 0.11 0.08Efforts not disrupted 0.02 0.04 0.01 0.06 0.00 0.06
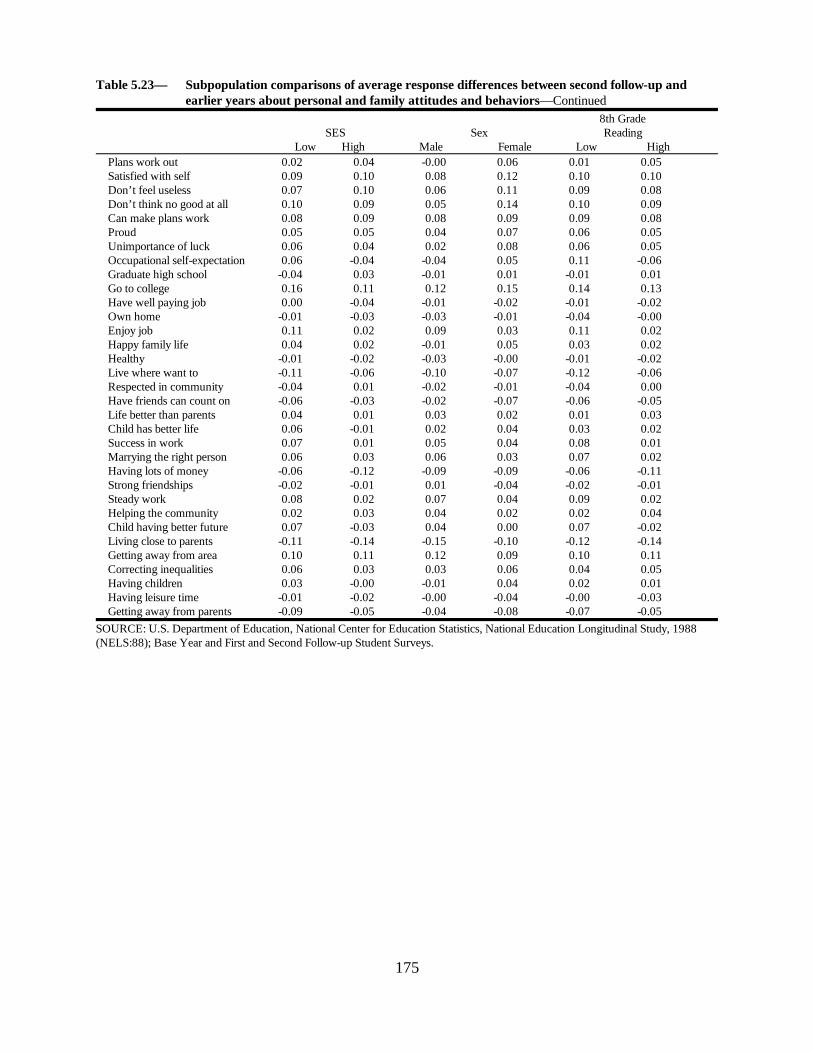
175
Table 5.23— Subpopulation comparisons of average response differences between second follow-up andearlier years about personal and family attitudes and behaviors—Continued
8th GradeSES Sex Reading
Low High Male Female Low HighPlans work out 0.02 0.04 -0.00 0.06 0.01 0.05Satisfied with self 0.09 0.10 0.08 0.12 0.10 0.10Don’t feel useless 0.07 0.10 0.06 0.11 0.09 0.08Don’t think no good at all 0.10 0.09 0.05 0.14 0.10 0.09Can make plans work 0.08 0.09 0.08 0.09 0.09 0.08Proud 0.05 0.05 0.04 0.07 0.06 0.05Unimportance of luck 0.06 0.04 0.02 0.08 0.06 0.05Occupational self-expectation 0.06 -0.04 -0.04 0.05 0.11 -0.06 Graduate high school -0.04 0.03 -0.01 0.01 -0.01 0.01Go to college 0.16 0.11 0.12 0.15 0.14 0.13Have well paying job 0.00 -0.04 -0.01 -0.02 -0.01 -0.02Own home -0.01 -0.03 -0.03 -0.01 -0.04 -0.00Enjoy job 0.11 0.02 0.09 0.03 0.11 0.02Happy family life 0.04 0.02 -0.01 0.05 0.03 0.02Healthy -0.01 -0.02 -0.03 -0.00 -0.01 -0.02Live where want to -0.11 -0.06 -0.10 -0.07 -0.12 -0.06Respected in community -0.04 0.01 -0.02 -0.01 -0.04 0.00Have friends can count on -0.06 -0.03 -0.02 -0.07 -0.06 -0.05Life better than parents 0.04 0.01 0.03 0.02 0.01 0.03Child has better life 0.06 -0.01 0.02 0.04 0.03 0.02Success in work 0.07 0.01 0.05 0.04 0.08 0.01Marrying the right person 0.06 0.03 0.06 0.03 0.07 0.02Having lots of money -0.06 -0.12 -0.09 -0.09 -0.06 -0.11Strong friendships -0.02 -0.01 0.01 -0.04 -0.02 -0.01Steady work 0.08 0.02 0.07 0.04 0.09 0.02Helping the community 0.02 0.03 0.04 0.02 0.02 0.04Child having better future 0.07 -0.03 0.04 0.00 0.07 -0.02Living close to parents -0.11 -0.14 -0.15 -0.10 -0.12 -0.14Getting away from area 0.10 0.11 0.12 0.09 0.10 0.11Correcting inequalities 0.06 0.03 0.03 0.06 0.04 0.05Having children 0.03 -0.00 -0.01 0.04 0.02 0.01Having leisure time -0.01 -0.02 -0.00 -0.04 -0.00 -0.03Getting away from parents -0.09 -0.05 -0.04 -0.08 -0.07 -0.05
SOURCE: U.S. Department of Education, National Center for Education Statistics, National Education Longitudinal Study, 1988(NELS:88); Base Year and First and Second Follow-up Student Surveys.

176
Table 5.24— Subpopulation comparisons of average response differences between second follow-up andearlier for school-related items
8th gradeSES Sex Reading
Low High Male Female Low Highvs. Base Year
School spirit -0.07 -0.08 -0.02 -0.11 -0.04 -0.10Discipline is fair -0.11 -0.05 -0.07 -0.08 -0.07 -0.07Teaching is good -0.02 0.02 0.01 -0.01 0.01 0.00Teachers are interested -0.02 0.07 0.03 0.03 0.01 0.05Feel safe at school 0.06 0.06 0.10 0.01 0.08 0.03Classes not disrupted 0.03 0.05 0.07 0.02 0.05 0.04Had Something stolen -0.23 -0.19 -0.22 -0.20 -0.23 -0.20Was offered drugs 0.11 0.15 0.21 0.06 0.14 0.13English as a 2nd language 0.03 0.01 0.02 0.03 0.03 0.01Advanced placement -0.21 -0.05 -0.15 -0.11 -0.26 -0.03Gifted and talented -0.03 -0.01 -0.01 -0.02 -0.03 -0.01Homework completed 0.04 -0.10 -0.05 -0.02 0.07 -0.11Homework time for math 0.19 0.31 0.15 0.39 0.26 0.28Homework time for science 0.32 0.55 0.41 0.54 0.37 0.54Homework time for English 0.43 0.58 0.43 0.60 0.43 0.58Homework time for history 0.24 0.32 0.27 0.33 0.29 0.30Cut class 0.20 0.19 0.21 0.18 0.21 0.19Never attend w/out pencil/paper 0.33 0.35 0.27 0.40 0.36 0.33Never attend w/out book 0.00 0.00 -0.02 0.03 0.03 -0.01Intramural sports -0.14 -0.17 -0.09 -0.21 -0.12 -0.18Interscholastic sports -0.13 -0.10 -0.04 -0.18 -0.12 -0.12Cheerleading -0.02 0.01 -0.01 0.00 -0.02 0.01Drama 0.08 0.14 0.11 0.11 0.05 0.15Government 0.03 0.09 0.05 0.07 0.01 0.10Honor society 0.04 0.14 0.04 0.12 -0.01 0.15Career clubs 0.27 0.16 0.16 0.27 0.25 0.19
vs. First Follow-upVocational track 0.04 0.01 0.01 0.04 0.03 0.03College prep. track 0.05 0.11 0.07 0.08 0.05 0.09General track -0.03 -0.09 -0.04 -0.08 -0.00 -0.10School spirit -0.05 -0.02 -0.01 -0.05 -0.03 -0.04Discipline is fair -0.04 -0.04 -0.03 -0.04 -0.02 -0.04Teaching is good 0.05 0.08 0.07 0.05 0.06 0.06Teachers are interested 0.09 0.11 0.11 0.09 0.08 0.11Feel safe at school -0.04 -0.03 -0.02 -0.06 -0.04 -0.03Learning not disrupted 0.06 0.08 0.07 0.07 0.08 0.06
SOURCE: U.S. Department of Education, National Center for Education Statistics, National Education Longitudinal Study, 1988(NELS:88); Base Year and First and Second Follow-up Student Surveys.
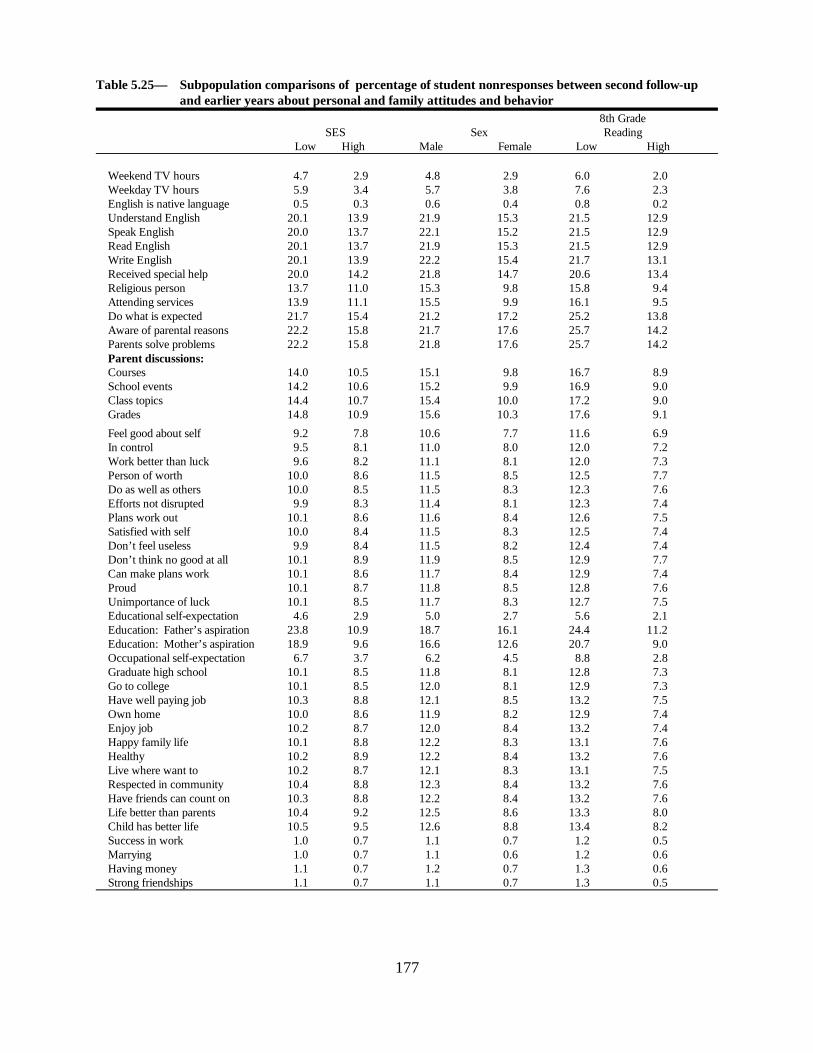
177
Table 5.25— Subpopulation comparisons of percentage of student nonresponses between second follow-upand earlier years about personal and family attitudes and behavior
8th GradeSES Sex Reading
Low High Male Female Low High
Weekend TV hours 4.7 2.9 4.8 2.9 6.0 2.0Weekday TV hours 5.9 3.4 5.7 3.8 7.6 2.3English is native language 0.5 0.3 0.6 0.4 0.8 0.2Understand English 20.1 13.9 21.9 15.3 21.5 12.9Speak English 20.0 13.7 22.1 15.2 21.5 12.9Read English 20.1 13.7 21.9 15.3 21.5 12.9Write English 20.1 13.9 22.2 15.4 21.7 13.1Received special help 20.0 14.2 21.8 14.7 20.6 13.4Religious person 13.7 11.0 15.3 9.8 15.8 9.4Attending services 13.9 11.1 15.5 9.9 16.1 9.5Do what is expected 21.7 15.4 21.2 17.2 25.2 13.8Aware of parental reasons 22.2 15.8 21.7 17.6 25.7 14.2Parents solve problems 22.2 15.8 21.8 17.6 25.7 14.2Parent discussions:Courses 14.0 10.5 15.1 9.8 16.7 8.9School events 14.2 10.6 15.2 9.9 16.9 9.0Class topics 14.4 10.7 15.4 10.0 17.2 9.0Grades 14.8 10.9 15.6 10.3 17.6 9.1
Feel good about self 9.2 7.8 10.6 7.7 11.6 6.9In control 9.5 8.1 11.0 8.0 12.0 7.2Work better than luck 9.6 8.2 11.1 8.1 12.0 7.3Person of worth 10.0 8.6 11.5 8.5 12.5 7.7Do as well as others 10.0 8.5 11.5 8.3 12.3 7.6Efforts not disrupted 9.9 8.3 11.4 8.1 12.3 7.4Plans work out 10.1 8.6 11.6 8.4 12.6 7.5Satisfied with self 10.0 8.4 11.5 8.3 12.5 7.4Don’t feel useless 9.9 8.4 11.5 8.2 12.4 7.4Don’t think no good at all 10.1 8.9 11.9 8.5 12.9 7.7Can make plans work 10.1 8.6 11.7 8.4 12.9 7.4Proud 10.1 8.7 11.8 8.5 12.8 7.6Unimportance of luck 10.1 8.5 11.7 8.3 12.7 7.5Educational self-expectation 4.6 2.9 5.0 2.7 5.6 2.1Education: Father’s aspiration 23.8 10.9 18.7 16.1 24.4 11.2Education: Mother’s aspiration 18.9 9.6 16.6 12.6 20.7 9.0Occupational self-expectation 6.7 3.7 6.2 4.5 8.8 2.8Graduate high school 10.1 8.5 11.8 8.1 12.8 7.3Go to college 10.1 8.5 12.0 8.1 12.9 7.3Have well paying job 10.3 8.8 12.1 8.5 13.2 7.5Own home 10.0 8.6 11.9 8.2 12.9 7.4Enjoy job 10.2 8.7 12.0 8.4 13.2 7.4Happy family life 10.1 8.8 12.2 8.3 13.1 7.6Healthy 10.2 8.9 12.2 8.4 13.2 7.6Live where want to 10.2 8.7 12.1 8.3 13.1 7.5Respected in community 10.4 8.8 12.3 8.4 13.2 7.6Have friends can count on 10.3 8.8 12.2 8.4 13.2 7.6Life better than parents 10.4 9.2 12.5 8.6 13.3 8.0Child has better life 10.5 9.5 12.6 8.8 13.4 8.2Success in work 1.0 0.7 1.1 0.7 1.2 0.5Marrying 1.0 0.7 1.1 0.6 1.2 0.6Having money 1.1 0.7 1.2 0.7 1.3 0.6Strong friendships 1.1 0.7 1.1 0.7 1.3 0.5

178
Table 5.25— Subpopulation comparisons of percentage of student nonresponses at second follow-up on itemsabout personal and family attitudes and behavior—Continued
8th GradeSES Sex Reading
Low High Male Female Low HighSteady work 1.2 0.7 1.2 0.7 1.4 0.6Helping the community 1.3 0.7 1.3 0.8 1.4 0.6Child having better future 1.2 0.8 1.3 0.8 1.4 0.7Living close to parents 1.2 0.7 1.2 0.8 1.4 0.6Getting away from area 1.2 0.8 1.3 0.8 1.4 0.7Correcting inequalities 1.3 0.8 1.4 0.9 1.6 0.7Having children 1.1 0.8 1.2 0.8 1.4 0.6Having leisure time 1.2 0.8 1.2 0.8 1.5 0.6Staying near parents 1.3 0.8 1.3 0.8 1.5 0.6
SOURCE: U.S. Department of Education, National Center for Education Statistics, National Education Longitudinal Study, 1988(NELS:88); Base Year and First and Second Follow-up Student Surveys.
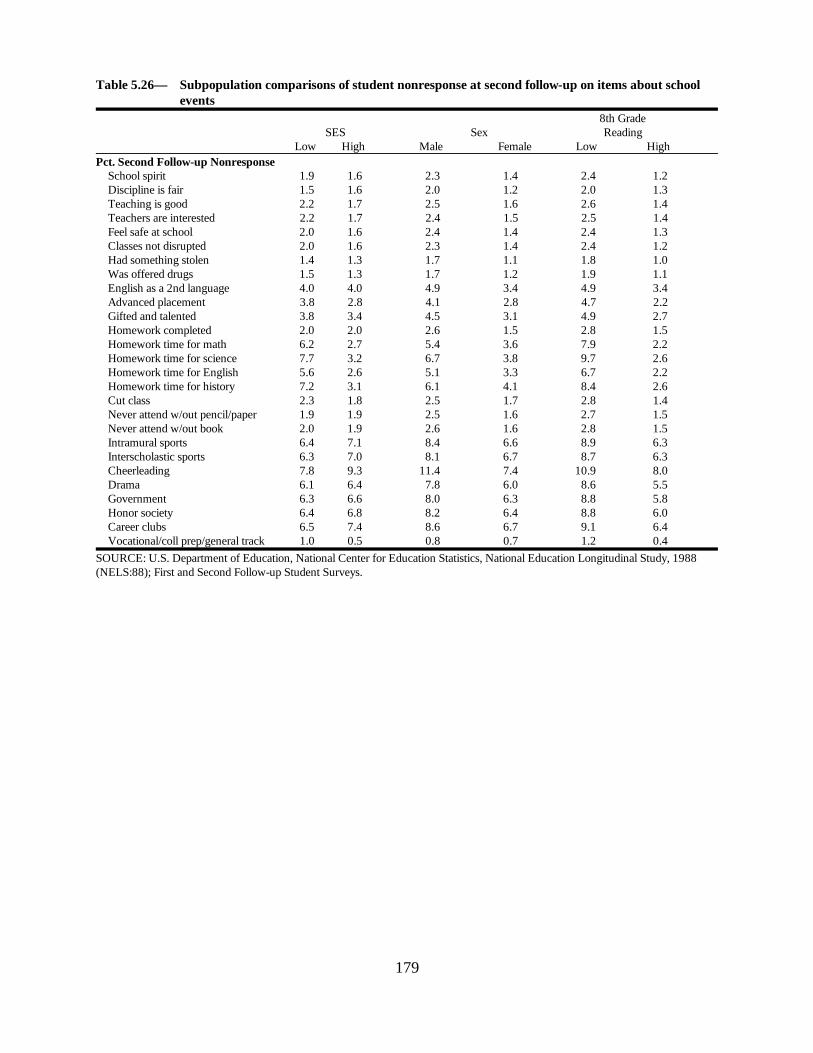
179
Table 5.26— Subpopulation comparisons of student nonresponse at second follow-up on items about schoolevents
8th GradeSES Sex Reading
Low High Male Female Low HighPct. Second Follow-up Nonresponse
School spirit 1.9 1.6 2.3 1.4 2.4 1.2Discipline is fair 1.5 1.6 2.0 1.2 2.0 1.3Teaching is good 2.2 1.7 2.5 1.6 2.6 1.4Teachers are interested 2.2 1.7 2.4 1.5 2.5 1.4Feel safe at school 2.0 1.6 2.4 1.4 2.4 1.3Classes not disrupted 2.0 1.6 2.3 1.4 2.4 1.2Had something stolen 1.4 1.3 1.7 1.1 1.8 1.0Was offered drugs 1.5 1.3 1.7 1.2 1.9 1.1English as a 2nd language 4.0 4.0 4.9 3.4 4.9 3.4Advanced placement 3.8 2.8 4.1 2.8 4.7 2.2Gifted and talented 3.8 3.4 4.5 3.1 4.9 2.7Homework completed 2.0 2.0 2.6 1.5 2.8 1.5Homework time for math 6.2 2.7 5.4 3.6 7.9 2.2Homework time for science 7.7 3.2 6.7 3.8 9.7 2.6Homework time for English 5.6 2.6 5.1 3.3 6.7 2.2Homework time for history 7.2 3.1 6.1 4.1 8.4 2.6Cut class 2.3 1.8 2.5 1.7 2.8 1.4Never attend w/out pencil/paper 1.9 1.9 2.5 1.6 2.7 1.5Never attend w/out book 2.0 1.9 2.6 1.6 2.8 1.5Intramural sports 6.4 7.1 8.4 6.6 8.9 6.3Interscholastic sports 6.3 7.0 8.1 6.7 8.7 6.3Cheerleading 7.8 9.3 11.4 7.4 10.9 8.0Drama 6.1 6.4 7.8 6.0 8.6 5.5Government 6.3 6.6 8.0 6.3 8.8 5.8Honor society 6.4 6.8 8.2 6.4 8.8 6.0Career clubs 6.5 7.4 8.6 6.7 9.1 6.4Vocational/coll prep/general track 1.0 0.5 0.8 0.7 1.2 0.4
SOURCE: U.S. Department of Education, National Center for Education Statistics, National Education Longitudinal Study, 1988(NELS:88); First and Second Follow-up Student Surveys.

180
Relations to Outcomes. The results of significance tests of the relations between themeasures at two different times and outcome measures are summarized in Tables 5.27 and 5.28. Although there were several dozen specific discrepancies in results that would be obtained usingearlier and later responses, the major finding is that in 85 percent of the cases (760 out of 888),the conclusions would be the same. In 700 of those cases, the results would be significant, if noBonferroni adjustment to the two-tailed .05 significance level were required, given theresearcher’s rationale for conducting the test.
There were 69 cases in which the relationship based on the earlier measure would besignificant but based on the later measure would not. Of these, nearly one-third (21) wereassociated with the enrollment status indicator, which has a very limited range at the secondfollow-up, especially for items pertaining to activities in school during the year of the secondfollow-up. Thirteen of the remaining 48 involve the four self-ratings of English language abilityby teenagers who are not native English speakers, suggesting that these items have greaterconstruct validity when measured at eighth grade than later.
Conversely, there were 56 cases in which the relationship based on the later (secondfollow-up) measure would be found significant but the relationship based on the earlier measurewould not. This is a notably small number of cases because the outcome measures are all basedon second follow-up data—a simple model would suggest that they would therefore be morelikely to be significantly related to second follow-up measures than earlier measures would be. Ofthese 56, 13 are with the prestige of the expected occupation and 11 are with the self-conceptmeasure. Thus, it may be that these two outcomes are slightly more closely related to othermeasures at the time of the second follow-up than to measures from earlier survey waves.
To summarize, the convergence of the NELS:88 noncognitive measures across two pointsin time is generally modest, suggesting that valuable information was obtained by asking theseitems at two time points. Item omissions increased from wave to wave and followed distinctpatterns. Teenagers with low eighth grade reading scores, and to a lesser extent low SESteenagers and boys, responded with lower levels of convergence and higher omission rates thanother NELS:88 participants. Finally, in most cases, the choice of time point for measurementwould not change conclusions about the significance of relations of these measures to educationaloutcome measures.
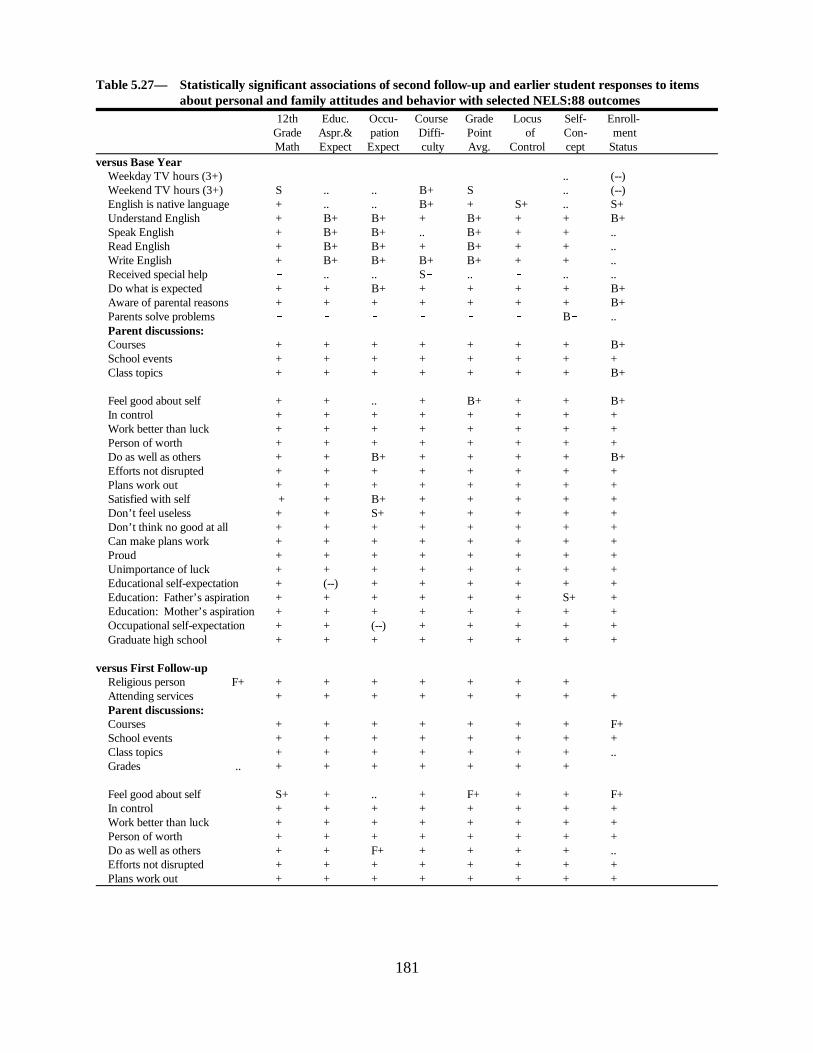
181
Table 5.27— Statistically significant associations of second follow-up and earlier student responses to itemsabout personal and family attitudes and behavior with selected NELS:88 outcomes
12th Educ. Occu- Course Grade Locus Self- Enroll-Grade Aspr.& pation Diffi- Point of Con- mentMath Expect Expect culty Avg. Control cept Status
versus Base YearWeekday TV hours (3+) .. (--)Weekend TV hours (3+) S .. .. B+ S .. (--)English is native language + .. .. B+ + S+ .. S+Understand English + B+ B+ + B+ + + B+Speak English + B+ B+ .. B+ + + ..Read English + B+ B+ + B+ + + ..Write English + B+ B+ B+ B+ + + ..Received special help .. .. S .. .. ..Do what is expected + + B+ + + + + B+Aware of parental reasons + + + + + + + B+Parents solve problems B ..Parent discussions:Courses + + + + + + + B+ School events + + + + + + + + Class topics + + + + + + + B+
Feel good about self + + .. + B+ + + B+In control + + + + + + + + Work better than luck + + + + + + + + Person of worth + + + + + + + + Do as well as others + + B+ + + + + B+Efforts not disrupted + + + + + + + + Plans work out + + + + + + + + Satisfied with self + + B+ + + + + + Don’t feel useless + + S+ + + + + + Don’t think no good at all + + + + + + + + Can make plans work + + + + + + + + Proud + + + + + + + + Unimportance of luck + + + + + + + +Educational self-expectation + (--) + + + + + + Education: Father’s aspiration + + + + + + S+ + Education: Mother’s aspiration + + + + + + + + Occupational self-expectation + + (--) + + + + + Graduate high school + + + + + + + +
versus First Follow-upReligious person F+ + + + + + + + Attending services + + + + + + + + Parent discussions:Courses + + + + + + + F+School events + + + + + + + + Class topics + + + + + + + ..Grades .. + + + + + + +
Feel good about self S+ + .. + F+ + + F+In control + + + + + + + + Work better than luck + + + + + + + + Person of worth + + + + + + + + Do as well as others + + F+ + + + + ..Efforts not disrupted + + + + + + + + Plans work out + + + + + + + +
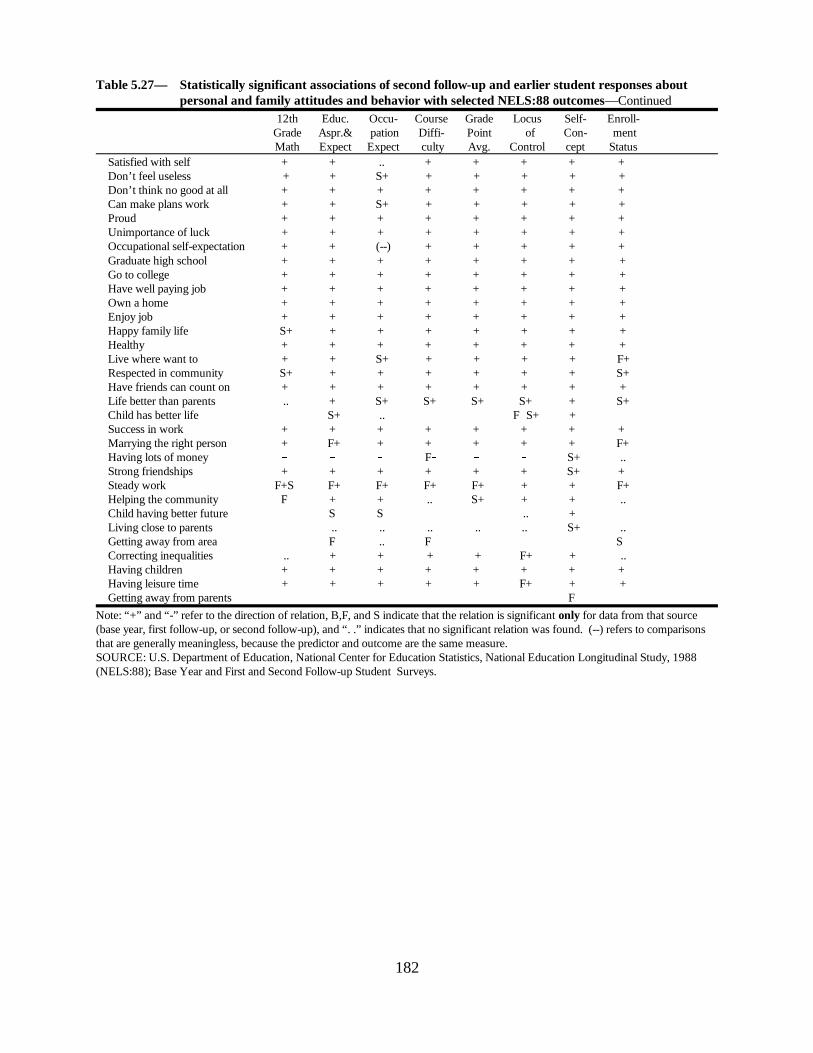
182
Table 5.27— Statistically significant associations of second follow-up and earlier student responses aboutpersonal and family attitudes and behavior with selected NELS:88 outcomes—Continued
12th Educ. Occu- Course Grade Locus Self- Enroll-Grade Aspr.& pation Diffi- Point of Con- mentMath Expect Expect culty Avg. Control cept Status
Satisfied with self + + .. + + + + + Don’t feel useless + + S+ + + + + + Don’t think no good at all + + + + + + + + Can make plans work + + S+ + + + + + Proud + + + + + + + + Unimportance of luck + + + + + + + + Occupational self-expectation + + (--) + + + + + Graduate high school + + + + + + + +Go to college + + + + + + + +Have well paying job + + + + + + + +Own a home + + + + + + + +Enjoy job + + + + + + + +Happy family life S+ + + + + + + +Healthy + + + + + + + +Live where want to + + S+ + + + + F+Respected in community S+ + + + + + + S+Have friends can count on + + + + + + + +Life better than parents .. + S+ S+ S+ S+ + S+Child has better life S+ .. FS+ +
Success in work + + + + + + + + Marrying the right person + F+ + + + + + F+Having lots of money � � � F� � � S+ ..Strong friendships + + + + + + S+ + Steady work F+S� F+ F+ F+ F+ + + F+Helping the community F� + + .. S+ + + ..Child having better future � S� S� � � .. + �
Living close to parents � .. .. .. .. .. S+ ..Getting away from area � F� .. F� � � � S�Correcting inequalities .. + + + + F+ + ..Having children + + + + + + + + Having leisure time + + + + + F+ + +Getting away from parents � � � � � � � F�
Note: “+” and “-” refer to the direction of relation, B,F, and S indicate that the relation is significant only for data from that source(base year, first follow-up, or second follow-up), and “. .” indicates that no significant relation was found. (--) refers to comparisonsthat are generally meaningless, because the predictor and outcome are the same measure.SOURCE: U.S. Department of Education, National Center for Education Statistics, National Education Longitudinal Study, 1988(NELS:88); Base Year and First and Second Follow-up Student Surveys.

183
Table 5.28— Statistically significant associations of earlier and later student responses about the schoolevents with selected NELS:88 outcomes
12th Educ. Occu- Course Grade Locus Self- Enroll-Grade Aspr.& pation Diffi- Point of Con- mentMath Expect Expect culty Avg. Control cept Status
versus Base YearSchool spirit .. B+ S B+ B+ + + B+Discipline is fair + + + + + + + +Teaching is good + + S+ + + + + +Teachers are interested + + + + + + + +Feel safe at school + + + + + + + +Learning not disrupted + + + + + + S+ +Had something stolen .. .. S BWas offered drugs B
English as a 2nd lang. S .. ..Advanced placement + + + + + + + + Gifted and talented + + + + + + + + Homework completed + + + + + + + +Homework time for math + + + + + + S+ + Homework time for science S+ S+ S+ S+ S+ + S+ S+Homework time for English + + + + + + S+ ..Homework time for historyB+ + + B+ B+ + .. ..Cut class
Never attend w/out pencil/paper S+ + + + + + + B+Never attend w/out book .. + B+ B+ + + + B+Intramural sports B+ + .. + B+ B+ + + Interscholastic sports + + .. + + B+ + + Cheerleading � + S+ S+ + .. .. ..Drama S+ + S+ S+ S+ S+ S+ ..Government + + + + + + + S+Honor society + + + + + + + + Career clubs � S� S� � � B� .. B�
versus First Follow-upVocational track - - - - - - .. F-College Prep. track + + + + + + + +General track - - - - - - - -School spirit .. .. S .. .. + + ..Discipline is fair + + + + + + + +Teaching is good + + + + + + + +Teachers are interested + + + + + + + +Feel safe at school + + + + + + + +Learning not disrupted + S+ + + + + S+ +
Note: “+” and “-” refer to the direction of relation, B and S indicate that the relation is significant only for data from that source (baseyear or second follow-up), and “. .” indicates that no significant relation was found.SOURCE: U.S. Department of Education, National Center for Education Statistics, National Education Longitudinal Study, 1988(NELS:88); Base Year and First and Second Follow-up Student Surveys.

184
185
Chapter 6 Summary and Conclusions
Data from the base year (eighth grade), first follow-up (two years later), and second follow-up(two more years later) of the NELS:88 cohort of eighth graders in 1988 can provide a rich pictureof the cognitive and affective growth of teenagers from eighth grade to twelfth grade. Testingresearch hypotheses depends, however, on interpretations of descriptions and ratings by teenagers,their parents, and their teachers. This report addressed questions about discrepancies of answersbetween different sources of information about a teenager and about differential tendencies to omitsurvey items.
This report focuses on 64 pairs of measures from parents and teenagers, 12 from teachers andteenagers, and 112 from teenagers taken in two separate survey waves (base year and second follow-up or first and second follow-ups). It addresses four research questions:
1. How similar are the response distributions for an item from different sources?
2. How extensive is item omission and what nonresponse bias is there?
3. How do pair-convergence and item omission differ among subpopulations?
4. What difference does the source of information make on conclusions about impact onstudent outcomes?
Results relevant to these research questions were presented separately for the various pairsof measures. However, the set of measures is sufficiently large to examine overall patterns amongtypes of items, to determine which types of items are most sensitive to variations in the source of theinformation. This chapter briefly explores these patterns. Although the 188 measure pairs studieddo not represent a random sample from a well-defined domain, they represent a broad cross-sectionof the kinds of survey items that might be asked in studies of teenagers and high school students.Therefore, the patterns found in this uniquely rich dataset are presented as guidance to researchers.
The pairs of measures differed on a variety of dimensions. Those considered in accountingfor variations in convergence and percentage omissions in this chapter are the following:
& Source-pair: Parent versus student, teacher versus student, or student in earlier wave versus student at second follow-up
& Content: School-centered items versus home, family, and personal centereditems
& Wave: For parent versus student, base year or second follow-up; and forearlier student versus second follow-up student, whether the earlierwave is base year or first follow-up; teacher-student comparisonswere all at second follow-up

186
& Item Number: Items near the beginning or the end of the survey instruments
& Item Difficulty: Measured indirectly by the amount of difference in convergencebetween teenagers with high and low eighth grade readingscores.
& Item Stability: For comparisons between survey waves, measured indirectly bythe change in mean responses of students between waves
& Item Objectivity: Classification of items as either asking for objective information(e.g., number of siblings, native language), for ratings ofobservable behaviors (e.g., frequencies of discussions withparents on various topics), or for subjective ratings (e.g.,estimates of importance, expectations for future achievements)
& Item Sensitivity: A few items asked about behaviors and events that might beembarrassing or frightening for some participants toacknowledge (e.g., drug use, suspensions)
The definitions of the dimensions of objectivity and sensitivity are themselves subjective, based onthe first author’s judgment, but the other dimensions are apparent from the items. Although athorough cognitive analysis of the processes involved in responding to the items would add to thisanalysis, that is beyond the scope of this report.
Is convergence across time greater or less than convergence between parent and teenager?The distributions of polychoric correlations for parent-teenager item pairs (see Chapter 3, Table 3.14)and teenager item pairs over time (see Chapter 5, Tables 5.21 and 5.22) are shown in Figure 6.1.There is a great deal of overlap between these distributions, but possibly with greater variability(standard deviation of .24 versus .14) for the parent-teenager pairs. The sets of items included in thetwo sets of pairs differ, of course, so interpretation of this comparison is not simple. For example,the seven parent-teenager correlations greater than .8 include base year objective items, such as thenumber of siblings, which were not repeated at the second follow-up. Items asked at both base yearand second follow-up undoubtedly include many on which change was anticipated and few for whichno change was expected. The general pattern is that for the kinds of survey items used by NELS:88,discrepancies between parent and student responses are in the same range as discrepancies betweenteenagers’ responses from eighth grade to twelfth grade.
Is parent-teenager convergence greater at the base year or second follow-up? Thedistributions of polychoric correlations shown in Figure 6.2 suggest either (a) that there is a dramaticdropoff in parent-teenager convergence from eighth grade to twelfth grade (from a mean of .68 to.37) or (b) that NELS:88 included more items at the second follow-up on which parent-teenagerdisagreement was likely. Only three parent-teenager item pairs were very similar across the surveys.On these items, there was a much smaller dropoff: from .45 to .38 for expected education level (seediscussion of Table 3.10A in Chapter 3) , from .74 to about .55 for ratings of how often English wasused in multilingual homes (see Table 3.3A), and from .48 to .45 for ratings of the teenager’s safety
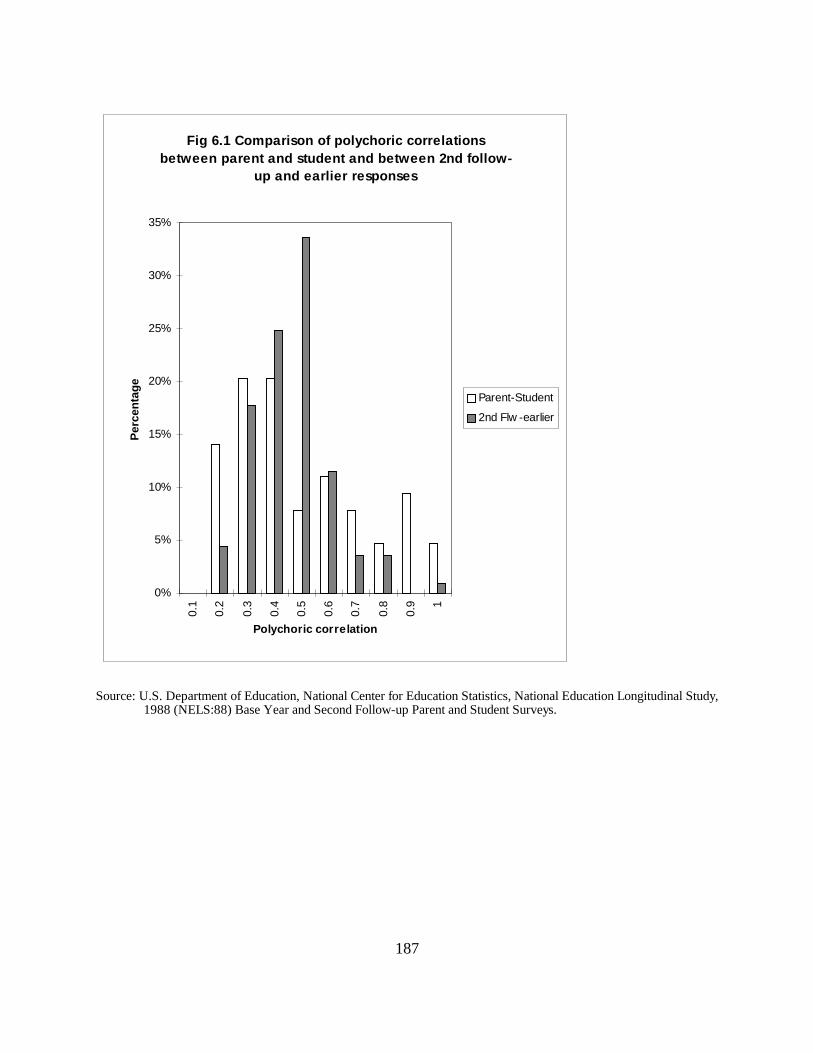
Fig 6.1 Comparison of polychoric correlations between parent and student and between 2nd follow-
up and earlier responses
0%
5%
10%
15%
20%
25%
30%
35%
0.1
0.2
0.3
0.4
0.5
0.6
0.7
0.8
0.9 1
Polychoric correlation
Per
cent
age
Parent-Student
2nd Flw -earlier
187
Source: U.S. Department of Education, National Center for Education Statistics, National Education Longitudinal Study,1988 (NELS:88) Base Year and Second Follow-up Parent and Student Surveys.
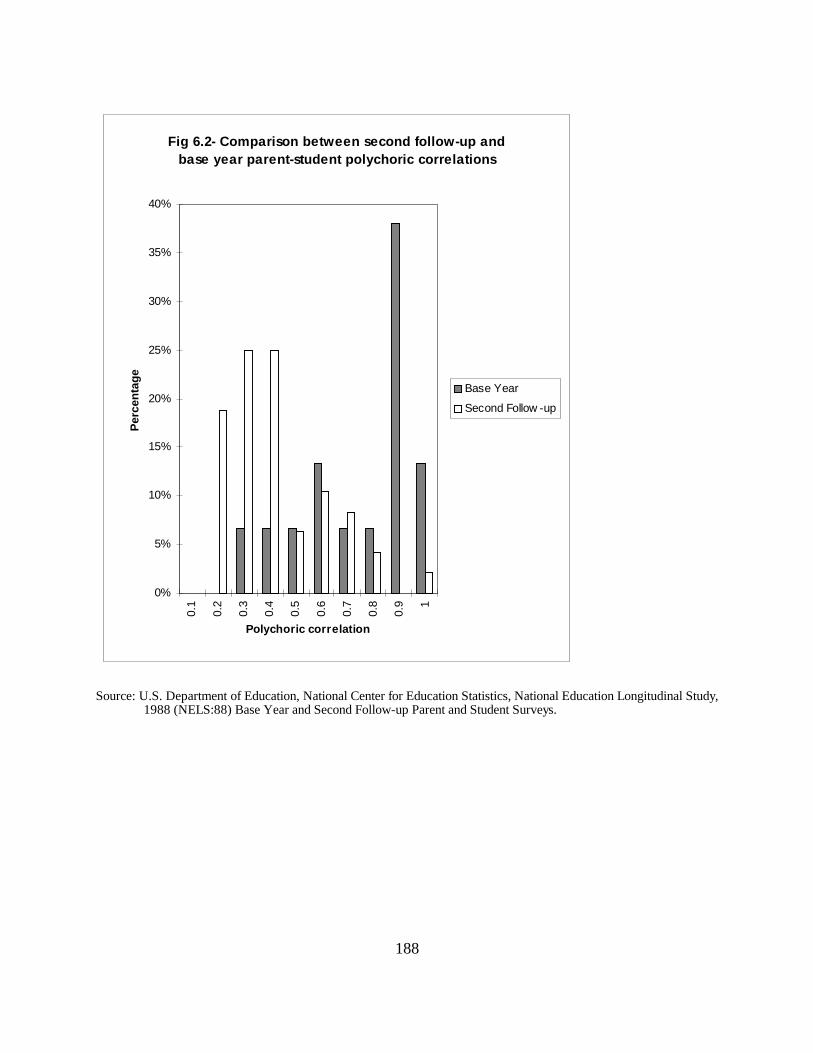
Fig 6.2- Comparison between second follow-up and base year parent-student polychoric correlations
0%
5%
10%
15%
20%
25%
30%
35%
40%0.
1
0.2
0.3
0.4
0.5
0.6
0.7
0.8
0.9 1
Polychoric correlation
Per
cent
age
Base Year
Second Follow -up
188
Source: U.S. Department of Education, National Center for Education Statistics, National Education Longitudinal Study,1988 (NELS:88) Base Year and Second Follow-up Parent and Student Surveys.
189
at school (see Table 3.6A). Of these three items, only the safety item was virtually unchanged inwording between base year and second follow-up surveys.
Does the length of time interval affect convergence of items? Second follow-up items werecompared to both base year and first follow-up items (see Chapter 5), and as shown in Figure 6.3,the convergence from base year to second follow-up tended to be much lower than for first follow-upto second follow-up. This is partially confounded by the fact that many of the items address aspectsof school and school activities: nearly all students changed schools between eighth and twelfthgrades, but most did not change schools between tenth and twelfth grades. Thus, questions aboutschool were generally about the same school in tenth to twelfth grade comparisons and aboutdifferent schools in eighth to twelfth grade comparisons. (In Chapter 5, items about home, family,and personal characteristics are considered in discussions of Tables 5.1A - 5.10A, and items aboutschool are presented in Tables 5.11A - 5.18A.) The mean polychoric correlations were: for baseyear/second follow-up pairs concerning school, .33, and not concerning school, .40; and for firstfollow-up/second follow-up pairs concerning school, .38, and not concerning school, .45. That is,doubling the time interval reduced the polychoric correlations on average by the same amount, .05,for both school-related item pairs and home, family, and personal item pairs.
Does reading ability contribute to convergence? The subpopulation comparison tables inChapters 3, 4, and 5 (see Tables 3.14, 4.5, 5.21, and 5.22) all showed differences between teenagerswith high and low eighth grade reading scores. As shown in the plot of polychoric correlations forhigh and low reading eighth graders in Figure 6.4, the effect of reading ability on convergenceoccurred for nearly every item, although in some cases the effect was more substantial than others.The average difference in polychoric correlations between high and low eighth grade readers was .08,with values ranging from -.09 to .23 across all items. There are at least two explanations forvariations in the sizes of differences between high and low readers. It may be that some items aremore difficult to read, so that poorer readers tend to make discrepant responses because they don’tunderstand the items. If so, then this difference can be used as an indirect measure of the readingdifficulty of items, because one of the primary reasons for lack of convergence is misinterpretationof the item by either or both of the sources of information. Of course, another cause of the readingability association, at least for some items, can be real differences in the sources of information: lowreading students may change more on some measures between eighth and twelfth grades than otherstudents and they may have greater differences of perspective relative to parents and teachers thanother students do.
How often does the choice of items make a difference in the conclusions reached fromresearch analyses? The significance tables in Chapters 3, 4, and 5 (see Tables 3.17, 4.8, 5.27, and5.28) show quite a number of comparisons that would be significant based on one source but not onanother. Overall, about 19 percent of the hypothetical significance tests had different outcomes
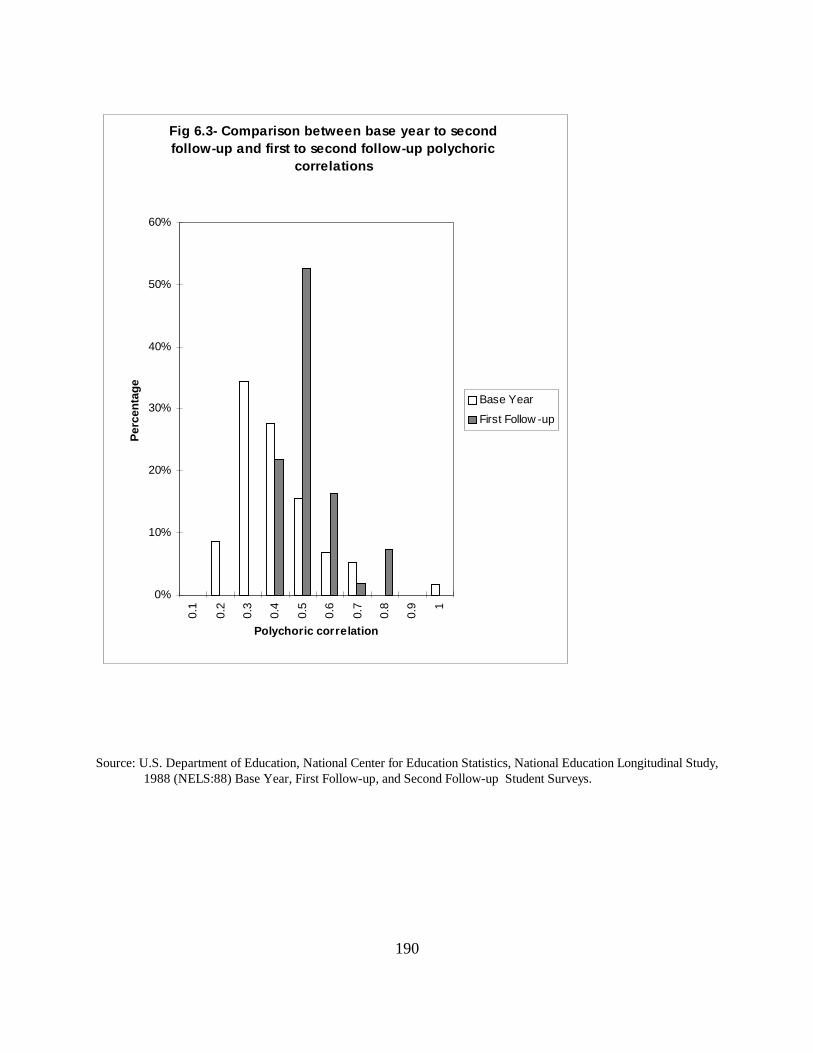
Fig 6.3- Comparison between base year to second follow-up and first to second follow-up polychoric
correlations
0%
10%
20%
30%
40%
50%
60%
0.1
0.2
0.3
0.4
0.5
0.6
0.7
0.8
0.9 1
Polychoric correlation
Per
cent
age
Base Year
First Follow -up
190
Source: U.S. Department of Education, National Center for Education Statistics, National Education Longitudinal Study,1988 (NELS:88) Base Year, First Follow-up, and Second Follow-up Student Surveys.
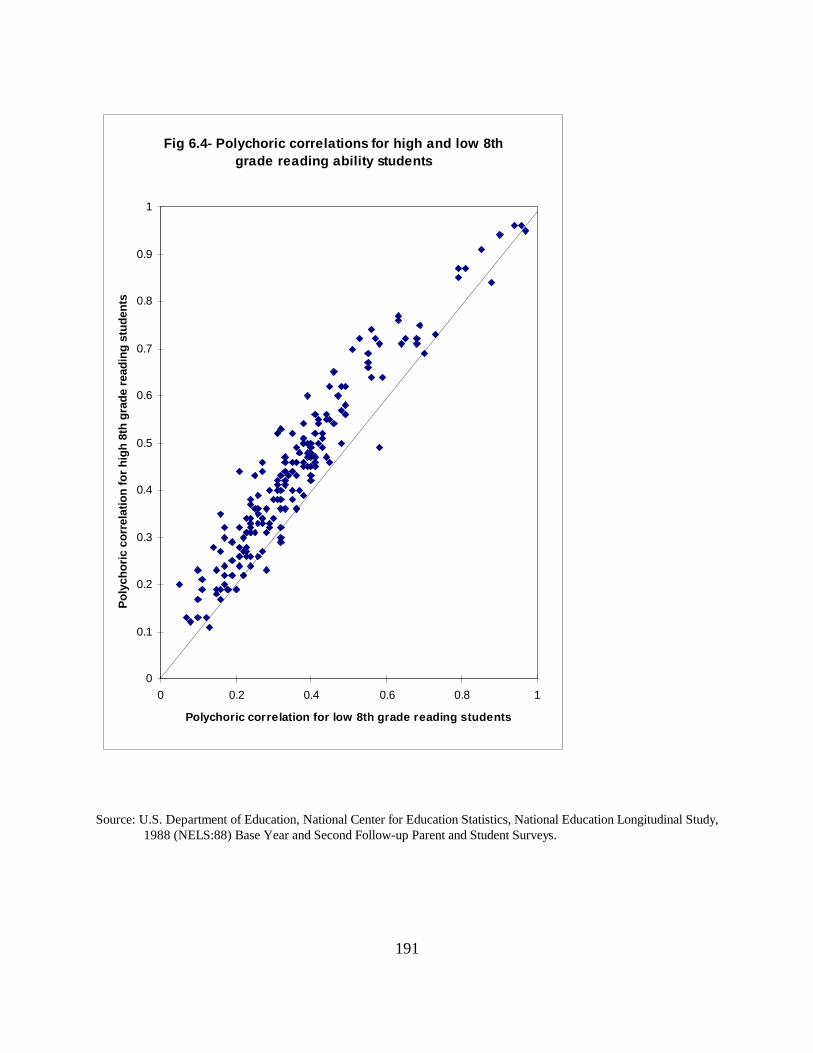
Fig 6.4- Polychoric correlations for high and low 8th grade reading ability students
0
0.1
0.2
0.3
0.4
0.5
0.6
0.7
0.8
0.9
1
0 0.2 0.4 0.6 0.8 1
Polychoric correlation for low 8th grade reading students
Pol
ycho
ric c
orre
latio
n fo
r hi
gh 8
th g
rade
rea
ding
stu
dent
s
191
Source: U.S. Department of Education, National Center for Education Statistics, National Education Longitudinal Study,1988 (NELS:88) Base Year and Second Follow-up Parent and Student Surveys.

The percentage of changes for enrollment (dropout) status, 29 percent, must be considered artifactual19
because of restriction of its range for many second follow-up comparison factors which assumed the teenager to be inschool.
192
depending on the source of the information about the comparison factor. The lowest percentage fora particular outcome (13 percent) was for twelfth grade mathematics scores, because these were moststrongly related to the factors being tested of any of the outcomes analyzed. That is, for thisoutcome, the attenuation of the relationship from neither source was sufficient to hide the overallsignificant relation. The highest percentage (26 percent) was for the prestige coding of the expectedoccupation at age 30, a measure more indirectly related to the comparison factors and therefore19
more likely hidden by any attenuation. In parent-student comparisons, other than for the enrollmentstatus outcome (see footnote 19), there was a noticeable tendency for more frequent significantresults based on student rather than on parent information (78 comparisons were significant onlywhen based on the student information; only 36 comparisons were significant only when based onparent information; while 319 comparisons were significant based on either source).
Meta-analysis of polychoric correlations
In order to sort out the various factors that affect convergence and tendency to omit an item,one can evaluate the fit of multifactor item models to the item data through multiple linear regression,using predictors based on item dimensions. The results of these meta-analyses indicate which factorsare effective in changing an item’s convergence and which are merely correlated through associationwith other factors. Moreover, examination of items that are most deviant from the model can provideclearer pictures of which items are either more or less convergent than would be predicted by a simplemodel. The purpose of this meta-analysis is to provide insights into the reasons that some items havegreater stability than others or lower omission rates than others. The multiple regressions that arereported below are not intended to be used to predict the convergence or omission rates of otheritems, only to summarize and clarify information on 187 different item pairs.
For 187 polychoric correlations, a model with six predictors was fit, with an adjusted r of2
.39. That model was reduced from an initial model with eleven predictors, due to elimination ofinsignificant measures. After omitting 22 poorly fitting items, that is, outliers from the regression line,which are discussed below, the following model was fit, with an adjusted r of .68. The mean,2
standard deviation, and correlation of each predictor with the dependent variable are shown inparentheses. All of the regression weights included in the model were statistically significant.
193
polychoric correlation = .722
.327, if the pair is between two sources at 2nd follow-up,(mean=.29, sdev=.46, r=-.30)
.323, if the pair is compared from base year to 2nd follow-up, (mean=.34, sdev=.47, r=-.23)
.248, if the pair is compared from 1st to 2nd follow-up,(mean=.29, sdev=.45, r=.15 (n.s.))
.103, if the content of the item concerns school,(mean=.20, sdev=.16, r=-.20)
.116, if the information is a subjective rating,(mean=.56, sdev=.50, r=-.19)
.397, for each full unit mean change between sources.(mean=.14, sdev=.16, r=-.38)
Based on the representations of predictors in the model, the excluded group of item-pairs,whose average polychoric correlation is indicated by the constant intercept term (.722), consists ofbase year home-related parent-student items that are not subjective ratings and for which the averageresponse was the same for parents and students. The regression weights indicate the effect of thecorresponding predictors on the average polychoric correlation.
The first three factors reflect the differences in correlations between the over-time pairs andthe pairs of sources at the second follow-up (teacher and student or parent and student). Thesenegative coefficients can be summarized as indicating that the base year parent-student item pairs hadthe greatest convergence.
The next two factors indicate that there was greater agreement on objective reports, asopposed to subjective ratings and on items about home, as compared to school. Separating itemsinvolving sensitive behaviors, such as drug use, as a factor in the model did not contributesignificantly to the prediction of polychoric correlations.
The final measure is indirect. The negative coefficient indicates that the polychoriccorrelations were lower for item pairs in which the different sources of information also differed intheir overall perceptions. For example, in parent-student comparisons, there were lower polychoriccorrelations when the parents and students had larger mean differences. Such a relation would beexpected to occur as an artifact if the simple product moment correlations were compared. However,because convergence was measured in terms of polychoric correlations, this represents a substantiverelation. The value of the coefficient of this factor must be interpreted in the context of typical valuesfor the mean change. The average absolute difference (by which the coefficient would be multiplied)was about .14, across all items.
Notably, several factors were not included in this equation, because they had no strongrelation to the polychoric correlations. One was the item number of the item in the student (or second
194
follow-up student) questionnaire. Also, separate explicit indicators of teacher-student pairs and ofparent-student pairs did not contribute significantly. Finally, the difference in convergence betweenstudents with high and low eighth grade reading scores, was not included, even though it would havemade a significant contribution to the prediction [t=5.14], because the sign of the coefficient(positive) was only explainable as a statistical artifact. An examination of the items with largedifferences in polychoric correlations between high and low ability readers did not reveal any surfacereadability difficulties; and in some cases it became apparent that the reasons for differences probablyreflected different characteristics of the respondents. For example, the item on discussions of 18college choice factors had some of the highest and lowest differences between high and low abilityreaders, and the pattern of differences does not appear to be related to reading difficulties of thefactor descriptions (compare tables 3.11A and 3.11C). In any case, it does not now appearappropriate to use subpopulation differences in polychoric correlations to predict the overallpolychoric correlation.
Of most interest are the items that did not fit this model. Thirteen items were from the parent-student comparisons. Seven items had higher convergence than expected from the model: whetherthe student was currently enrolled and/or had been suspended, which apparently were not “sensitive,”as they had been denoted in defining the factors for the meta-analysis (see the discussion of Table3.9A in Chapter 3); expected education level in the base year (see Table 3.10A); expected occupation(prestige) in the second follow-up (see Table 3.11A); and three college choice factors (see Table3.12A). The latter five items had been denoted as subjective ratings for the meta-analysis, but thereappears to have been more parent-student agreement on these items than was typically the case forsubjective ratings. Ability to live at home, availability of financial aid, and a religious environmentare likely to have been topics for family discussion for teenagers planning to go to college by the timeof the second follow-up.
Six other parent-student items had lower convergence than expected from the model: therating of whether the school was safe (see Table 3.6), the indicators that an adult neighbor, a sitter,or nobody was home when the teenager returned from school (see Table 3.5), the estimate of whenthe student stopped his or her most recent job (see Table 3.2), and the perceived importance oflocation in choosing a college (see Table 3.11). Each of these items had a unique problem. Thesafety-at-school item was stated as a negative rating for the teenager (“Do you agree that you don’tfeel safe at school?”). The question about an adult neighbor or a sitter at home could have beenconstrued as only the adult neighbor or sitter by some respondents and as an adult neighbor visitingthe parent by others, or the adult neighbor could have been considered by some to have been a sitter.The report of nobody at home may have appeared to be a socially undesirable response. The estimateof when the student stopped his or her most recent job presumed that the second follow-upquestionnaires were completed by parents and students in the same month (because parents wereinstructed to respond with the “current” month if the student had a job) and that they had the sameframe of reference for what was a job. Finally, the meaning of “location” as a college choice factorwas ambiguous, especially as the 17th factor in a list in which earlier items included “able to live athome”, “chance to live away from home”, and “low crime environment.” These items should be usedonly with great caution.

195
Teachers’ reports of whether a student’s native language was English (see the discussion ofTable 4.1A in Chapter 4) was noticeably more convergent with students’ reports than predicted bythe model, possibly because of cues available to the teacher, such as a student’s accent, or surname,or direct conversations with parents, not represented in the model. Also, math and science teachers’reports that the student was in a college preparatory track math or science course were moreconvergent than predicted from the model, possibly because tracking limited opportunities fordivergent responses.
Six items had greater stability across student surveys than predicted by the model: whetherthe teenager was a non-native English speaker (base year to second follow-up; see the discussion ofTable 5.2A in Chapter 5) , whether he or she was in a college prep program (base year to secondfollow-up; see Table 5.11A), enrolled in a gifted and talented program (base year to second follow-up; see Table 5.14), and expected to go to college (first to second follow-up; see Table 5.7A), andwhether he or she was a religiously oriented person who attended religious services frequently (baseyear to second follow-up; see Table 5.3A). These are characteristics of teenagers that may have beendetermined or planned for by the time he or she reached eighth or tenth grade.
Finally, one item had notably less stability between base year and second follow-up thanpredicted by the model: whether the student received special help for English language proficiency(see Table 5.2A). In the base year, it referred to ever having been enrolled in a program, and atsecond follow-up, it referred to having help with reading and writing since 1989.
Overall, this analysis leads in some cases to recommendations concerning factors to take intoaccount in the future wording of survey items and in other cases to a greater understanding of themeaning of the responses made by parents, teachers, and students.
Meta-analysis of Percentages of Omissions
A similar analysis was carried out for percentage of omissions by students for comparison withparents or teachers, or by students at the second follow-up. Although the same variables were usedin the equation, different factors were found to be significant. Initially, the equation was fit to thepercent missing, with an r of .54. However, after deleting 10 items with large deviations from the2
regression line, the r squared for the following equation was .76. Means, standard deviations, and2
correlations with the dependent variable are shown in parentheses.
percent missing = 0.43
+1.46, for every 10 serial positions in the survey instrument,(mean=52.5/10, sdev=30.6/10, r=.86)
- 1.25, for second follow-up items asked of both students andparents, (mean=.29, r=.46, r=.05 (n.s.))
- 1.66, for second follow-up items also asked at first follow-up(mean=.28, sdev=.45, r=-.06 (n.s.))

196
The serial position of the item in the questionnaire, which for the items analyzed varied from2 to 111, was highly significantly related to tendency to omit. Other things equal, a typical item atthe end of the questionnaire would have a likelihood of omission of more than 15 percent, comparedto less than 5 percent in the early parts of the questionnaire. Also, other things equal, there werefewer omissions at second follow-up than predicted by the model, for items also asked (a) of parentsor (b) at the first follow-up.
Other factors, including the reading difficulty estimate, the absolute mean change estimate,the school/home content dichotomy, and the objective/subjective indicators, which were significantin the prediction of polychoric correlations, were not included in this final equation because theregression coefficients associated with these factors were all nonsignificant.
The 10 items deleted from the final analysis because they did not fit the model were associatedwith either implicit or explicit skip patterns. Three second follow-up items presented near the endof the questionnaire had lower than predicted omission rates: indicating one was not a native Englishspeaker, indicating which other language was used in the home, and rating how frequently thatlanguage was used in the home (see Table 3.3A).
On the other hand, seven items had higher than predicted omission rates. These included fouritems relating to parents’ perspectives on education and three items that were to be answered onlyby a relatively small subset of the NELS:88 participants. Specifically, reports of father’s and mother’seducation levels (see Table 3.4A) and perceptions of father’s and mother’s educational aspirationsfor the teenager’s education (see Table 3.10A) had higher than predicted omissions; and the year andmonth the teenager stopped the most recent job (see Table 3.2A), which were only asked forteenagers who had had a job but were not employed at the time they completed the second follow-upsurvey, and self-ratings of school performance limits due to English language proficiency problems,which were answered only by non-native english speakers (see Table 5.2A).
In conclusion, the evidence from comparing measures from different sources supports theusefulness of gathering multiple measures. In nearly every case, the alternative sources providedeither slightly different or very different information. On the other hand, in some cases thecomparisons were confounded by changes in wording between items presented to different sources.Matching wordings (e.g., response alternatives for levels of education) more closely would allowresearchers to make further inferences about differences that are not due to wording variations.
The analyses conducted for this report provide the basis for recommending to researchers thatthey not simply use the NELS:88 survey items at face value but draw inferences about students fromthe differences in responses over time and from different sources. Although an equation forconvergence (i.e., for sample polychoric correlations) with six predictors accounted for 40 percentof the variance among items, convergence is item-specific. The interpretation of each item pairbenefits from a consideration of the processing that respondents engage in when deciding how (orwhether) to respond.
197
Finally, the serial position effect on item omissions was substantial. If some items that aresufficiently important to be included in the survey must be placed after a large number of other items,a mechanism to recapture the interest of students repeatedly throughout the response period isessential. One item that had an unusually low omission rate was the first item on the first page of asection on YOUR PLANS FOR THE FUTURE (item 40 on the second follow-up studentquestionnaire, see the discussion of Table 5.10A in Chapter 5). Perhaps a mechanism for increasingresponse rates can be developed from a comparison of this item’s context to that of other items.
198
References
Brick, J., Cahalan, M., Gray, L., and Severynse, J. (1994). A Study of Selected Nonsampling Errors in the 1991 Survey of Recent College Graduates. Washington, DC: U.S. Department of Education
Cohen, J., Khattri, N., and Ralph, J. (1996). Payoff of Effort: Homework in Achievement. Paperpresented at the Annual Meeting of the American Education Research Association, New York, NY.
Drasgow, Fritz. (1984). “Polychoric and Polyserial Correlation,” In Encyclopedia of Statistical Sciences, 7: 68-74. NY: John Wiley & Sons.
Mullis, I.V.S., Campbell, J.R., and Farstrup, A.E. (1993). NAEP 1992 Reading Report Card forthe Nation and the States. Washington, DC: U.S. Department of Education.
National Center for Education Statistics. (1994a). Second Follow-up: Student Component Data File User’s Manual. Washington, DC: U.S. Department of Education.
National Center for Education Statistics. (1994b). Second Follow-up: Teacher Component Data File User’s Manual. Washington, DC: U.S. Department of Education.
Rock, D.A., Pollack, J.M., and Quinn, P.. (1995). Psychometric Report for the NELS:88BaseYear Through Second Follow-up. (NCES 95-382) Washington, DC: U.S.Department of Education.
Rossi, R. and Wolman, J. (1996). Characteristics, Experiences, and Educational Outcomes ofStudents with Disabilities. Washington, DC: U.S. Department of Education.
Shah, B.V., Barnwell, B.G., Hunt, P.N., and LaVange, L.M. (1993). SUDAAN User’s Manual,Release 6.0, 1992. Research Triangle Park, NC.
Stevens, G. and Cho, J.H. (1985). “Sociologic Indexes and the New 1980 Census Occupational Classification Scheme.” Social Science Research, 14(2): 142-168.
199
Appendix A.
Index of Measures and Univariate Unweighted Distributions
This report makes use of more than 400 items from NELS:88. To facilitate its use byresearchers using the NELS:88 electronic codebook (ECB), we have included an index ofmeasures, labeled as in the ECB, indicating the page in this report on which a discussion of themeasure appears or begins.
In the following pages, the unweighted frequency distributions for the measures subjectedto bivariate comparisons are displayed. The measures are identified by NELS variable names asthey appear on the CD-ROM. The frequency distributions are for the 16,489 cases withF2PNLWT greater than zero. The value “NA” refers to cases in which the item was legitimatelyskipped. The value “missing” refers to any other form of missing data, such as omission, refusal,or multiple response. Frequencies of zero are denoted “.”
The measures are organized in order corresponding to their presentation in the report. Adjacent columns in the tables refer to the matched pairs of measures, parent and student formeasures examined in chapter 3, teacher and student for measures examined in Chapter 4, andeighth or tenth grade and twelfth grade for measures examined in Chapter 5.

200
Index of NELS:88 Measures in this report
Outcome Measures
NELS:88Variables Page LabelBY2XMTH 13 MATH IRT THETAF12XMTH 13 MATH IRT THETAF2CNCPT1 13 TEEN SELF CONCEPT, VERSION 1F22XMTH 13 MATH IRT THETAF2LOCUS1 13 TEEN LOCUS OF CONTROL, VERSION 1F2RHFOG2 13 AVERAGE GRADE IN FOREIGN LANG. (HS+B)F2RHMAG2 13 AVERAGE GRADE IN MATHEMATICS (HS+B)F2RHSCG2 13 AVERAGE GRADE IN SCIENCE (HS+B)F2RHSOG2 13 AVERAGE GRADE IN SOCIAL STUDIES (HS+B)F2RTROUT 13 TRANSCRIPT-INDICATED OUTCOMEF2RTRPRG 13 TRANSCRIPT-INDICATED HIGH SCHOOL PROGRAMF2S64B 13 OCCUPATION R EXPECTS TO HAVE AT AGE 30
Population Subgroup Measures
NELS:88Variables Page LabelG12CTRL2 17 SCHOOL CLASSIFICATIONG8CTRL 17 SCHOOL CONTROL COMPOSITESUBJECT 17 MATHEMATICS OR SCIENCE TEACHERF2SES2 17 F2 TEEN^S SOCIO-ECONOMIC STATUS, V.2F2SEX 17 COMPOSITE SEXF2P100A 17 SEX OF RESPONDENTF2SUBJCT 17 CLASS SUBJECTF2P2 17 AMT OF TIME TEEN LIVES W/RESPONDENTBY2XRSTD 17 READING STANDARDIZED SCORE
Measures Compared for Convergence
NELS:88Variables Page LabelBYP1B 21 AMT OF TIME STUDENT LIVES W/RESPONDENTBYP22A 29 LANG OTHR THN ENGLISH SPOKEN IN R^S HOMEBYP23 29 MAIN LANGUAGE USUALLY SPOKEN IN R^S HOMEBYP30 33 HIGHEST LEVEL OF EDUCATION R COMPLETEDBYP31 33 SPOUSE^S HIGHEST LEVEL OF EDUC COMPLETEDBYP3A 21 NUMBER OF SIBLINGS 8TH GRADER HASBYP4 21 NO. OF CHILDRN OLDER THAN R^S 8TH GRADERBYP72A-H 36 PERSON HOME WHEN CHILD RETURNS FROM SCHLBYP74I 39 THE SCHOOL IS A SAFE PLACEBYP76 52 HOW FAR IN SCHOOL R EXPECT CHILD TO GOBYS17 102 R SPEAK ANY LANG OTH THN ENGLISH BFR SCHBYS18 102 1ST LANG R LEARNED TO SPEAK AS A CHILD

201
NELS:88Variables Page LabelBYS21 29 ANY OTHER LANGUAGE SPOKEN IN R^S HOMEBYS22 29 LANG USUALLY SPOKN BY PEOPLE IN R^S HOMEBYS27A 102 HOW WELL R UNDERSTANDS SPOKEN ENGLISHBYS27B 102 HOW WELL R SPEAKS ENGLISHBYS27C 102 HOW WELL R READS ENGLISHBYS27D 102 HOW WELL R WRITES ENGLISHBYS29 102 R EVER IN A LANGUAGE ASSISTANCE PROGRAMBYS32 21 NUMBER OF SIBLINGS R HASBYS33 21 NUMBER OF SIBLINGS OLDER THAN RBYS34A 33 FATHER^S HIGHEST LEVEL OF EDUCATIONBYS34B 33 MOTHER^S HIGHEST LEVEL OF EDUCATIONBYS36A 111 DISCUSS PROGRAMS AT SCHOOL WITH PARENTSBYS36B 111 DISCUSS SCHOOL ACTIVITIES WITH PARENTSBYS36C 111 DISCUSS THNGS STUDIED IN CLASS WTH PRNTSBYS39A 107 PARENTS TRUST R TO DO WHAT THEY EXPECTBYS39B 107 OFTEN DK WHY I AM TO DO WHAT PARENTS SAYBYS39C 107 OFTEN COUNT ON PARENTS TO SOLVE PROBLEMSBYS40A-H 36 PERSON HOME WHEN R RETURNS FROM SCHOOLBYS42A 98 NO. OF HOURS R WATCHES TV ON WEEKDAYSBYS42B 98 NO. OF HOURS R WATCHES TV ON WEEKENDSBYS44A-M 114 SELF-CONCEPT AND LOCUS OF CONTROL ITEMSBYS45 52 HOW FAR IN SCH DO YOU THINK YOU WILL GETBYS45 121 HOW FAR IN SCH DO YOU THINK YOU WILL GETBYS46 126 HOW SURE THAT YOU WILL GRADUATE FROM H.SBYS48A 121 HOW FAR IN SCHL R^S FATHER WANTS R TO GOBYS48B 121 HOW FAR IN SCHL R^S MOTHER WANTS R TO GOBYS52 124 KIND OF WORK R EXPECTS TO DO AT AGE 30BYS57A 143 R HAD SOMETHING STOLEN AT SCHOOLBYS57B 143 SOMEONE OFFERED TO SELL R DRUGS AT SCHLBYS59B 139 THERE IS REAL SCHOOL SPIRITBYS59D 139 DISCIPLINE IS FAIRBYS59F 139 THE TEACHING IS GOODBYS59G 139 TEACHERS ARE INTERESTED IN STUDENTSBYS59K 39 I DON^T FEEL SAFE AT THIS SCHOOLBYS59K 139 I DON^T FEEL SAFE AT THIS SCHOOLBYS59L 139 STUDENT DISRUPTIONS INHIBIT LEARNINGBYS66A 145 IN ADVANCED,ENRICHED,ACCELERATED ENGLISHBYS66B 145 IN ADVANCD,ENRICHD,ACCELERTD SOC.STUDIESBYS66C 145 IN ADVANCED,ENRICHED,ACCELERATED SCIENCEBYS66D 145 IN ADVANCED,ENRICHED,ACCELERATED MATHBYS68A 145 ENROLLED IN CLASSES FOR GIFTED STUDENTSBYS68B 145 ENROLLED IN BILINGUAL EDUCATIONBYS76 152 HOW OFTEN DO YOU CUT OR SKIP CLASSESBYS78A 155 HOW OFTEN COME TO CLASS W/O PENCIL/PAPERBYS78B 155 HOW OFTEN COME TO CLASS WITHOUT BOOKSBYS78C 149 HOW OFTEN COME TO CLASS WITHOUT HOMEWKBYS79A 149 TIME SPENT ON MATH HOMEWORK EACH WEEKBYS79B 149 TIME SPENT ON SCIENCE HOMEWORK EACH WEEKBYS79C 149 TIME SPENT ON ENGLISH HOMEWORK EACH WEEKBYS79D 149 TIME SPENT ON SOC STUDIES HOMEWK EACH WKBYS82B 157 PARTICIPATED IN SCHOOL VARSITY SPORTSBYS82C 157 PARTICIPATED IN INTRAMURAL SPORTS
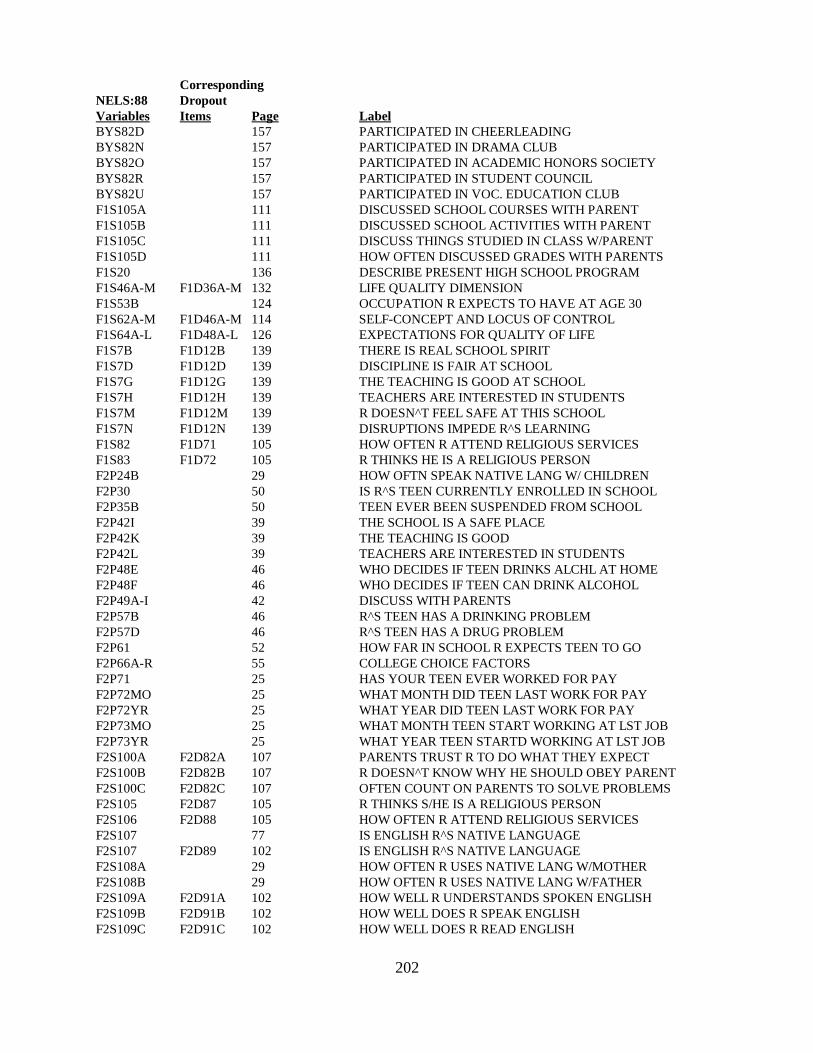
202
CorrespondingNELS:88 DropoutVariables Items Page LabelBYS82D 157 PARTICIPATED IN CHEERLEADINGBYS82N 157 PARTICIPATED IN DRAMA CLUBBYS82O 157 PARTICIPATED IN ACADEMIC HONORS SOCIETYBYS82R 157 PARTICIPATED IN STUDENT COUNCILBYS82U 157 PARTICIPATED IN VOC. EDUCATION CLUBF1S105A 111 DISCUSSED SCHOOL COURSES WITH PARENTF1S105B 111 DISCUSSED SCHOOL ACTIVITIES WITH PARENTF1S105C 111 DISCUSS THINGS STUDIED IN CLASS W/PARENTF1S105D 111 HOW OFTEN DISCUSSED GRADES WITH PARENTSF1S20 136 DESCRIBE PRESENT HIGH SCHOOL PROGRAMF1S46A-M F1D36A-M 132 LIFE QUALITY DIMENSIONF1S53B 124 OCCUPATION R EXPECTS TO HAVE AT AGE 30F1S62A-M F1D46A-M 114 SELF-CONCEPT AND LOCUS OF CONTROLF1S64A-L F1D48A-L 126 EXPECTATIONS FOR QUALITY OF LIFEF1S7B F1D12B 139 THERE IS REAL SCHOOL SPIRITF1S7D F1D12D 139 DISCIPLINE IS FAIR AT SCHOOLF1S7G F1D12G 139 THE TEACHING IS GOOD AT SCHOOLF1S7H F1D12H 139 TEACHERS ARE INTERESTED IN STUDENTSF1S7M F1D12M 139 R DOESN^T FEEL SAFE AT THIS SCHOOLF1S7N F1D12N 139 DISRUPTIONS IMPEDE R^S LEARNINGF1S82 F1D71 105 HOW OFTEN R ATTEND RELIGIOUS SERVICESF1S83 F1D72 105 R THINKS HE IS A RELIGIOUS PERSON F2P24B 29 HOW OFTN SPEAK NATIVE LANG W/ CHILDRENF2P30 50 IS R^S TEEN CURRENTLY ENROLLED IN SCHOOLF2P35B 50 TEEN EVER BEEN SUSPENDED FROM SCHOOLF2P42I 39 THE SCHOOL IS A SAFE PLACEF2P42K 39 THE TEACHING IS GOODF2P42L 39 TEACHERS ARE INTERESTED IN STUDENTSF2P48E 46 WHO DECIDES IF TEEN DRINKS ALCHL AT HOMEF2P48F 46 WHO DECIDES IF TEEN CAN DRINK ALCOHOLF2P49A-I 42 DISCUSS WITH PARENTSF2P57B 46 R^S TEEN HAS A DRINKING PROBLEMF2P57D 46 R^S TEEN HAS A DRUG PROBLEMF2P61 52 HOW FAR IN SCHOOL R EXPECTS TEEN TO GOF2P66A-R 55 COLLEGE CHOICE FACTORSF2P71 25 HAS YOUR TEEN EVER WORKED FOR PAYF2P72MO 25 WHAT MONTH DID TEEN LAST WORK FOR PAYF2P72YR 25 WHAT YEAR DID TEEN LAST WORK FOR PAYF2P73MO 25 WHAT MONTH TEEN START WORKING AT LST JOBF2P73YR 25 WHAT YEAR TEEN STARTD WORKING AT LST JOBF2S100A F2D82A 107 PARENTS TRUST R TO DO WHAT THEY EXPECTF2S100B F2D82B 107 R DOESN^T KNOW WHY HE SHOULD OBEY PARENTF2S100C F2D82C 107 OFTEN COUNT ON PARENTS TO SOLVE PROBLEMSF2S105 F2D87 105 R THINKS S/HE IS A RELIGIOUS PERSONF2S106 F2D88 105 HOW OFTEN R ATTEND RELIGIOUS SERVICESF2S107 77 IS ENGLISH R^S NATIVE LANGUAGEF2S107 F2D89 102 IS ENGLISH R^S NATIVE LANGUAGEF2S108A 29 HOW OFTEN R USES NATIVE LANG W/MOTHERF2S108B 29 HOW OFTEN R USES NATIVE LANG W/FATHERF2S109A F2D91A 102 HOW WELL R UNDERSTANDS SPOKEN ENGLISHF2S109B F2D91B 102 HOW WELL DOES R SPEAK ENGLISHF2S109C F2D91C 102 HOW WELL DOES R READ ENGLISH

203
CorrespondingNELS:88 DropoutVariables Items Page LabelF2S109D F2D91D 102 HOW WELL DOES R WRITE ENGLISHF2S110A 102 SPECIAL HELP IN READING,WRITING ENGLISHF2S111A 77 R^S ENG SKILLS MAKES IT HARD TO DO PAPERF2S111B 77 R^S ENG SKILLS MAKES ESSAY EXAM HARDF2S111C 77 R^S ENG SKILLS MAKE M.C. EXAM HARDF2S111D 77 HARD FOR R TO UNDERSTAND TEACHERF2S111E 77 HARD FOR R TO TAKE NOTES IN CLASSF2S111F 77 HARD FOR R TO DISCUSS IN CLASSF2S111G 77 HARD FOR R TO COMPLETE HOMEWORKF2S12A 87 DESCRIBE PRESENT HIGH SCHOOL PROGRAMF2S12A 136 DESCRIBE PRESENT HIGH SCHOOL PROGRAMF2S13D 145 EVER BEEN IN ENGLISH AS SECOND LANG PROGF2S13E 145 EVER BEEN IN ADVANCED PLACEMENT PROGRAMF2S13J 145 EVER BEEN IN A GIFTED/TALENTED PROGRAMF2S15BE 82 WATCH THE TCHR DEMONSTRATE AN EXPERIMENTF2S15BF 82 DO EXPERIMENT ALONE/IN GROUP IN SCIENCEF2S15BH 82 WRITE REPTS ON EXPERIMENTS/OBSERVATIONSF2S15BI 82 USE COMPUTER FOR COLLECTING SCIENCE DATAF2S19BB 82 LISTEN TO TEACHER LECTURE IN MATHF2S19BG 82 USE COMPUTERS IN MATH CLASSF2S19BI 82 PARTICIPATE IN STUDENT DISCUSSIONSF2S24A 155 GO TO CLASS WITHOUT PENCIL/PAPERF2S24B 155 GO TO CLASS WITHOUT BOOKSF2S24C 149 GO TO CLASS WITHOUT HOMEWORK DONEF2S25A1 149 TIME SPENT ON MATH HOMEWORK IN SCHOOLF2S25A2 149 TIME SPENT ON MATH HOMEWORK OUT OF SCHLF2S25B1 149 TIME SPENT ON SCIENCE HOMEWORK IN SCHLF2S25B2 149 TIME SPENT ON SCIENCE HOMEWRK OUT OF SCHF2S25C1 149 TIME SPENT ON ENGLISH HOMEWORK IN SCHLF2S25C2 149 TIME SPENT ON ENGLISH HOMEWRK OUT OF SCHF2S25D1 149 TIME ON HIST/SOC. STUD. HMWRK IN SCHLF2S25D2 149 TIME ON HIST/SOC.STUD. HMWRK OUT SCHF2S30AA 157 PARTICIPATED ON A TEAM SPORT AT SCHOOLF2S30AC 157 PARTICIPATED IN CHEERLEADING/POMPONF2S30BB 157 PARTICIPATED IN SCHOOL PLAY OR MUSICALF2S30BC 157 PARTICIPATED IN SCHOOL GOVERNMENTF2S30BD 157 PARTICIPATED IN ACADEMIC HONOR SOCIETYF2S30BI 157 PARTICIPATED IN SCHOOL FTA, FHA, FFAF2S30BJ 157 PARTICIPATED IN INTRAMURAL TEAM SPORTF2S35A 98 HOW MANY HOURS ON WEEKDAYS R WATCHES TVF2S35B 98 HOW MANY HOURS ON WEEKENDS R WATCHES TVF2S40A-M F2D36A-M 132 LIFE QUALITY DIMENSIONF2S42A F2D37A 52 HOW FAR IN SCHOOL FATHER WANTS R TO GOF2S42A F2D37A 121 HOW FAR IN SCHOOL FATHER WANTS R TO GOF2S42B F2D37B 52 HOW FAR IN SCHOOL MOTHER WANTS R TO GOF2S42B F2D37B 121 HOW FAR IN SCHOOL MOTHER WANTS R TO GOF2S43 F2D38 52 HOW FAR IN SCHOOL R THINKS S/HE WILL GETF2S43 F2D38 121 HOW FAR IN SCHOOL R THINKS S/HE WILL GETF2S59A-R 55 COLLEGE CHOICE FACTORSF2S64B 124 OCCUPATION R EXPECTS TO HAVE AT AGE 30F2S66A-M F2D57A-M 114 SELF-CONCEPT AND LOCUS OF CONTROL ITEMSF2S67A-L F2D58A-L 126 CHANCES THAT R WILL GRADUATE FROM H.S.

204
CorrespondingNELS:88 DropoutVariables Items Page LabelF2S7A F2D18A 139 THERE IS REAL SCHOOL SPIRITF2S7C 39 THE TEACHING IS GOOD AT SCHOOLF2S7C F2D18C 139 THE TEACHING IS GOOD AT SCHOOLF2S7D 39 TEACHERS ARE INTERESTED IN STUDENTSF2S7D F2D18D 139 TEACHERS ARE INTERESTED IN STUDENTSF2S7E 39 R DOESN^T FEEL SAFE AT THIS SCHOOLF2S7E F2D18E 139 R DOESN^T FEEL SAFE AT THIS SCHOOLF2S7F F2D18F 139 DISRUPTIONS IMPEDE R^S LEARNINGF2S7L 139 DISCIPLINE IS FAIR IN SCHOOLF2S85A F2D75A 46 AT SCHL,# TIMES UNDER INFLUENCE ALCOHOLF2S85B F2D75B 46 AT SCHL,# TIMES UNDR INFLUENCE MARIJUANAF2S85C F2D75C 46 AT SCHOOL,# TIMES UNDR INFLUENCE COCAINEF2S86A 25 HAS R EVER WORKED FOR PAY OUTSIDE HOMEF2S86BMO 25 MONTH, LAST TIME R WORKED FOR PAYF2S86BYR 25 YEAR, LAST TIME R WORKEDF2S87MO F2D45EM 25 MONTH STARTED CURENT JOBF2S87YR F2D45EY 25 YEAR STARTED CURRENT JOBF2S8A 143 HAD SOMETHING STOLEN AT SCHOOLF2S8B 157 SOMEONE OFFERED TO SELL R DRUGS AT SCHLF2S98E F2D81E 46 WHO DECIDES IF R CAN DRINK W/PARENTSF2S98F F2D81F 46 WHO DECIDES IF R CAN DRINK AT PARTIESF2S99A 42, 111 DISCUSSED SCHOOL COURSES WITH PARENTF2S99B 42, 111 DISCUSSED SCHOOL ACTIVITIES WITH PARENTF2S99C 42, 111 DISCUSS THINGS STUDIED IN CLASS W/PARENTF2S99D 42, 111 HOW OFTEN DISCUSSED GRADES WITH PARENTSF2S99E 42 DISCUSSED PREP FOR THE ACT/SAT TESTF2S99F 42 DISCUSSED GOING TO COLLEGE WITH PARENTSF2S99G 42 DISCUSSED JOB POSSIBILITIES AFTER HSF2S99H 42 DISCUSSED CURRENT EVENTS WITH PARENTSF2S99I 42 DISCUSSED TROUBLING THINGS WITH PARENTSF2S9B F2D19B 152 HOW MANY TIMES DID R CUT/SKIP CLASSESF2S9F 50 HOW MANY TIMES R SUSPENDED FROM SCHOOLF2T1_10 77 STU PERFORMNCE LIMITED BY ENGL PROFICNCYF2T1_9 77 STUDENT^S NATIVE LANGUAGE IS ENGLISHF2T213AA 82 TEACHER^S USE OF LECTUREF2T213AB 82 TEACHER^S USE OF COMPUTERSF2T213AF 82 TEACHER^S USE OF STUDENT-LED DISCUSSIONSF2T2_19A 82 HOW OFTEN HAVE STUDENTS DO AN EXPERIMENTF2T2_19B 82 HOW OFTEN DEMONSTRATE EXPERIMENTF2T2_19C 82 HOW OFTEN REQUIRE REPORTS ON EXPERIMENTSF2T2_19E 82 HOW OFTEN COMPUTERS USED TO COLLECT DATAF2T2_3 87 ^TRACK^ CLASS IS CONSIDERED TO BEF2UNIV1 50 SAMPLE MEMBER STATUS IN ALL THREE WAVES
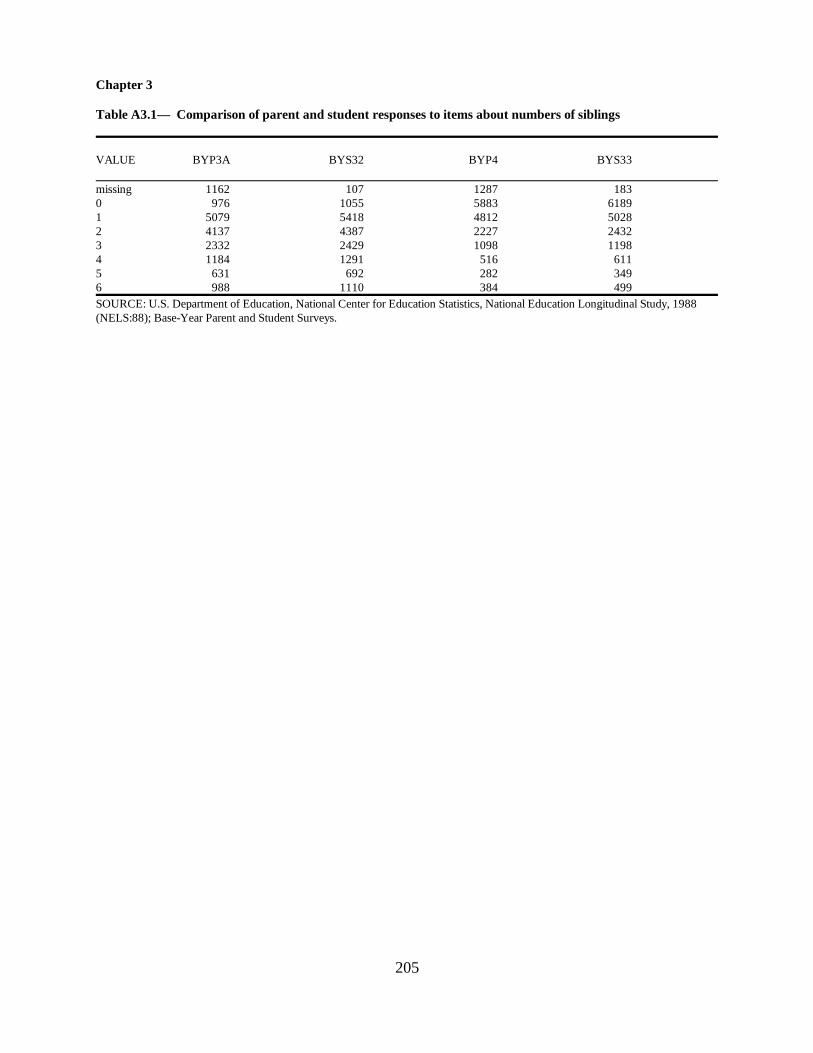
205
Chapter 3
Table A3.1— Comparison of parent and student responses to items about numbers of siblings
VALUE BYP3A BYS32 BYP4 BYS33
missing 1162 107 1287 1830 976 1055 5883 61891 5079 5418 4812 50282 4137 4387 2227 24323 2332 2429 1098 11984 1184 1291 516 6115 631 692 282 3496 988 1110 384 499SOURCE: U.S. Department of Education, National Center for Education Statistics, National Education Longitudinal Study, 1988(NELS:88); Base-Year Parent and Student Surveys.
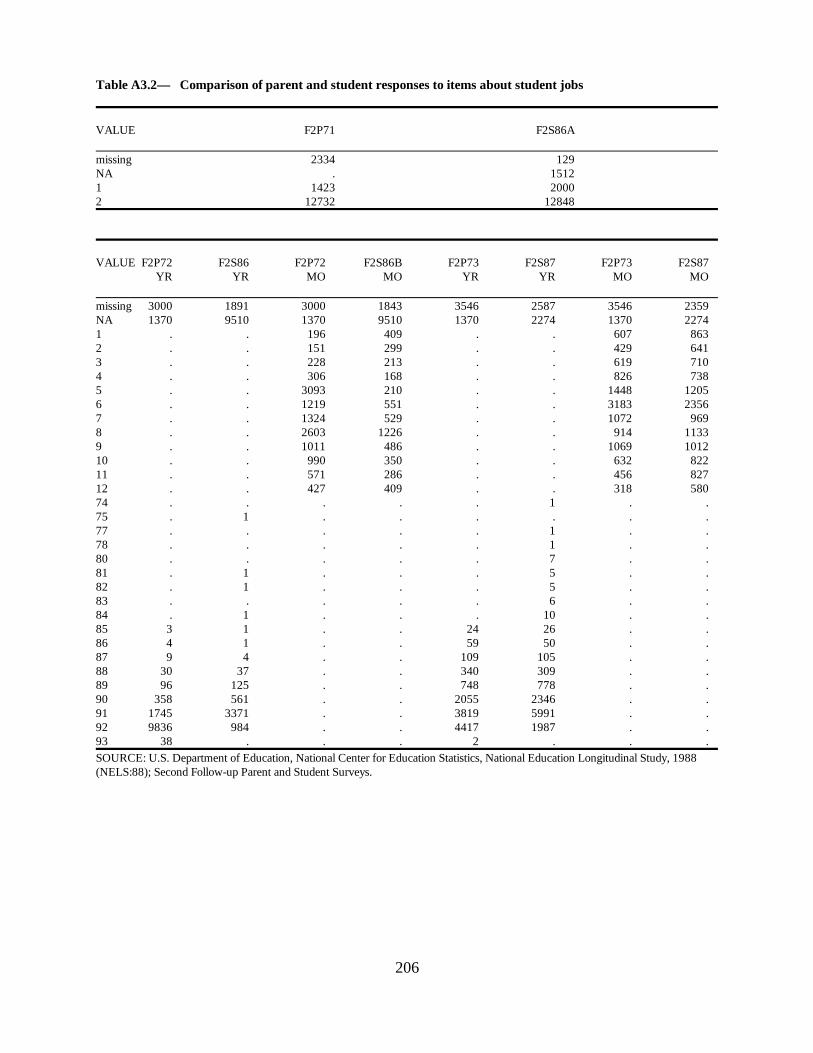
206
Table A3.2— Comparison of parent and student responses to items about student jobs
VALUE F2P71 F2S86A
missing 2334 129NA . 15121 1423 20002 12732 12848
VALUE F2P72 F2S86 F2P72 F2S86B F2P73 F2S87 F2P73 F2S87YR YR MO MO YR YR MO MO
missing 3000 1891 3000 1843 3546 2587 3546 2359NA 1370 9510 1370 9510 1370 2274 1370 22741 . . 196 409 . . 607 8632 . . 151 299 . . 429 6413 . . 228 213 . . 619 7104 . . 306 168 . . 826 7385 . . 3093 210 . . 1448 12056 . . 1219 551 . . 3183 23567 . . 1324 529 . . 1072 9698 . . 2603 1226 . . 914 11339 . . 1011 486 . . 1069 101210 . . 990 350 . . 632 82211 . . 571 286 . . 456 82712 . . 427 409 . . 318 58074 . . . . . 1 . .75 . 1 . . . . . .77 . . . . . 1 . .78 . . . . . 1 . .80 . . . . . 7 . .81 . 1 . . . 5 . .82 . 1 . . . 5 . .83 . . . . . 6 . .84 . 1 . . . 10 . .85 3 1 . . 24 26 . .86 4 1 . . 59 50 . .87 9 4 . . 109 105 . .88 30 37 . . 340 309 . .89 96 125 . . 748 778 . .90 358 561 . . 2055 2346 . .91 1745 3371 . . 3819 5991 . .92 9836 984 . . 4417 1987 . .93 38 . . . 2 . . .
SOURCE: U.S. Department of Education, National Center for Education Statistics, National Education Longitudinal Study, 1988(NELS:88); Second Follow-up Parent and Student Surveys.

207
Table A3.3— Comparison of parent and student responses to items about use of non-English languages
VALUE BYP22A BYS21 BYP23 BYS22
Missing 960 30 1108 140 NA . . 12638 12912 1 2891 3547 1573 1508 2 12638 12912 1170 1929
VALUE F2P24B F2S108A F2S108B
missing 80 68 12NA 11840 12783 134471 694 475 1412 382 145 723 493 178 614 251 89 255 25 27 7
SOURCE: U.S. Department of Education, National Center for Education Statistics, National Education Longitudinal Study, 1988(NELS:88); Base Year Parent and Student Surveys, Second Follow-up Parent and Student Surveys.
Table A3.4— Comparison of parent and student responses to items about parents’ education
VALUE BYP30/31 BYS34A BYP30/31 BYS34B(Father’s Ed) (Mother’s Ed)
missing 3038 2510 1361 1931NA 606 . 489 .1 2165 2298 2454 23222 2430 4300 3503 51973 1548 1537 2217 17734 2938 1150 3518 13385 1880 2352 1919 23096 1062 1359 864 12227 822 983 164 397
SOURCE: U.S. Department of Education, National Center for Education Statistics, National Education Longitudinal Study, 1988(NELS:88); Base-Year Parent and Student Surveys.
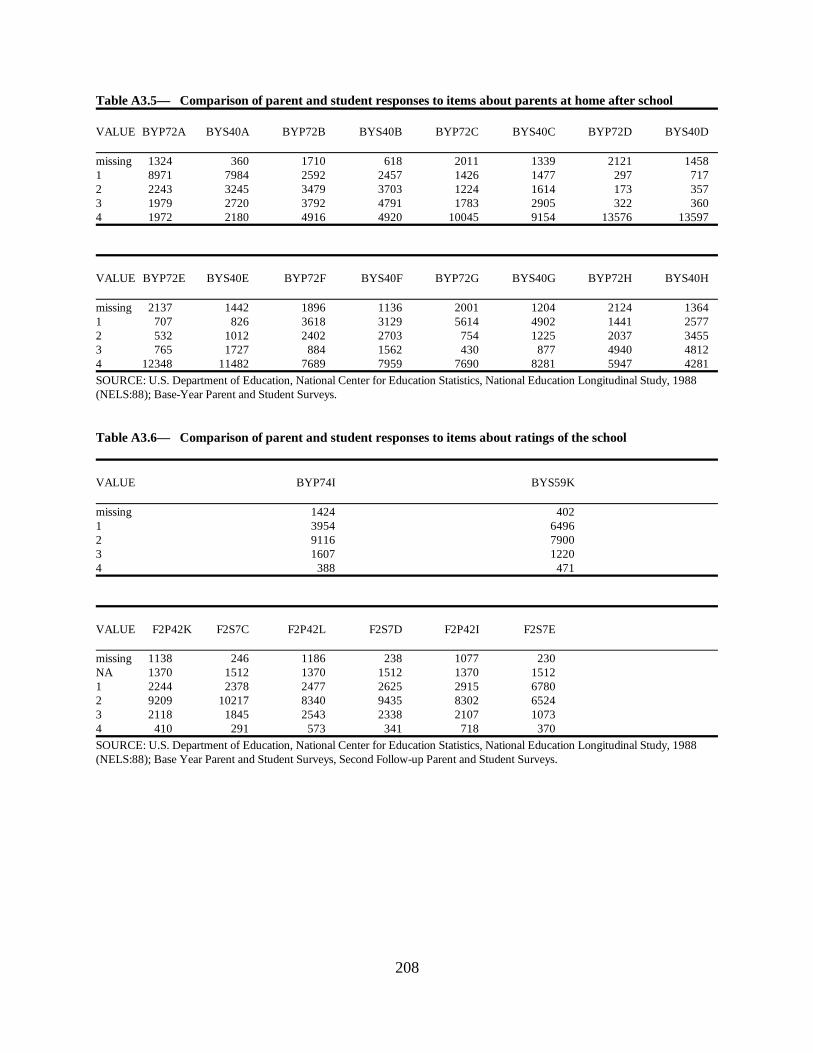
208
Table A3.5— Comparison of parent and student responses to items about parents at home after school
VALUE BYP72A BYS40A BYP72B BYS40B BYP72C BYS40C BYP72D BYS40D
missing 1324 360 1710 618 2011 1339 2121 14581 8971 7984 2592 2457 1426 1477 297 7172 2243 3245 3479 3703 1224 1614 173 3573 1979 2720 3792 4791 1783 2905 322 3604 1972 2180 4916 4920 10045 9154 13576 13597
VALUE BYP72E BYS40E BYP72F BYS40F BYP72G BYS40G BYP72H BYS40H
missing 2137 1442 1896 1136 2001 1204 2124 13641 707 826 3618 3129 5614 4902 1441 25772 532 1012 2402 2703 754 1225 2037 34553 765 1727 884 1562 430 877 4940 48124 12348 11482 7689 7959 7690 8281 5947 4281
SOURCE: U.S. Department of Education, National Center for Education Statistics, National Education Longitudinal Study, 1988(NELS:88); Base-Year Parent and Student Surveys.
Table A3.6— Comparison of parent and student responses to items about ratings of the school
VALUE BYP74I BYS59K
missing 1424 4021 3954 64962 9116 79003 1607 12204 388 471
VALUE F2P42K F2S7C F2P42L F2S7D F2P42I F2S7E
missing 1138 246 1186 238 1077 230NA 1370 1512 1370 1512 1370 15121 2244 2378 2477 2625 2915 67802 9209 10217 8340 9435 8302 65243 2118 1845 2543 2338 2107 10734 410 291 573 341 718 370
SOURCE: U.S. Department of Education, National Center for Education Statistics, National Education Longitudinal Study, 1988(NELS:88); Base Year Parent and Student Surveys, Second Follow-up Parent and Student Surveys.
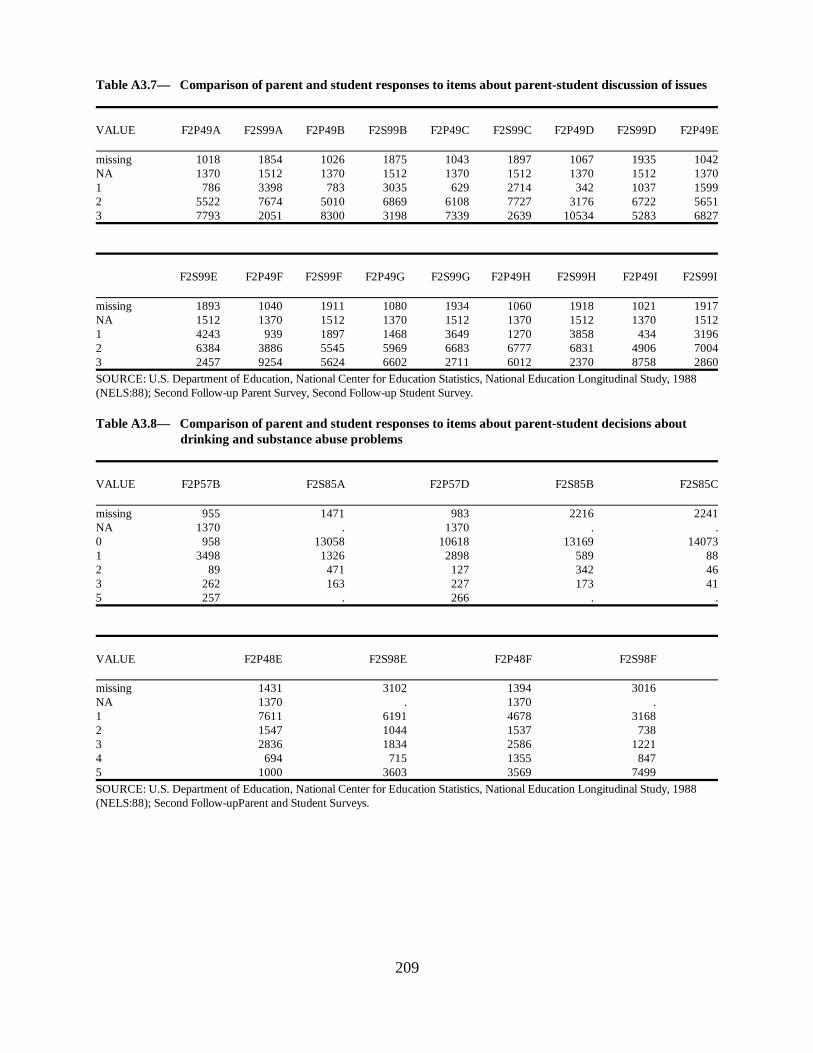
209
Table A3.7— Comparison of parent and student responses to items about parent-student discussion of issues
VALUE F2P49A F2S99A F2P49B F2S99B F2P49C F2S99C F2P49D F2S99D F2P49E
missing 1018 1854 1026 1875 1043 1897 1067 1935 1042NA 1370 1512 1370 1512 1370 1512 1370 1512 13701 786 3398 783 3035 629 2714 342 1037 15992 5522 7674 5010 6869 6108 7727 3176 6722 56513 7793 2051 8300 3198 7339 2639 10534 5283 6827
F2S99E F2P49F F2S99F F2P49G F2S99G F2P49H F2S99H F2P49I F2S99I
missing 1893 1040 1911 1080 1934 1060 1918 1021 1917NA 1512 1370 1512 1370 1512 1370 1512 1370 15121 4243 939 1897 1468 3649 1270 3858 434 31962 6384 3886 5545 5969 6683 6777 6831 4906 70043 2457 9254 5624 6602 2711 6012 2370 8758 2860
SOURCE: U.S. Department of Education, National Center for Education Statistics, National Education Longitudinal Study, 1988(NELS:88); Second Follow-up Parent Survey, Second Follow-up Student Survey.
Table A3.8— Comparison of parent and student responses to items about parent-student decisions about drinking and substance abuse problems
VALUE F2P57B F2S85A F2P57D F2S85B F2S85C
missing 955 1471 983 2216 2241NA 1370 . 1370 . .0 958 13058 10618 13169 140731 3498 1326 2898 589 882 89 471 127 342 463 262 163 227 173 415 257 . 266 . .
VALUE F2P48E F2S98E F2P48F F2S98F
missing 1431 3102 1394 3016NA 1370 . 1370 .1 7611 6191 4678 31682 1547 1044 1537 7383 2836 1834 2586 12214 694 715 1355 8475 1000 3603 3569 7499
SOURCE: U.S. Department of Education, National Center for Education Statistics, National Education Longitudinal Study, 1988(NELS:88); Second Follow-upParent and Student Surveys.
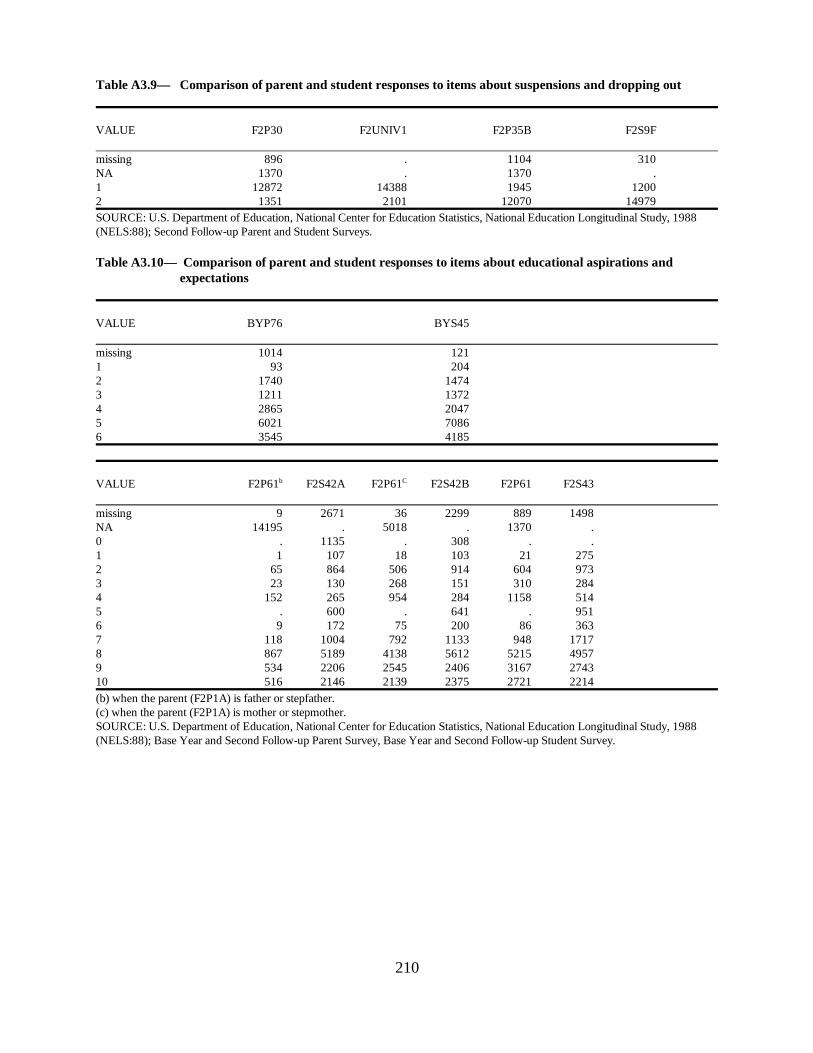
210
Table A3.9— Comparison of parent and student responses to items about suspensions and dropping out
VALUE F2P30 F2UNIV1 F2P35B F2S9F
missing 896 . 1104 310NA 1370 . 1370 .1 12872 14388 1945 12002 1351 2101 12070 14979SOURCE: U.S. Department of Education, National Center for Education Statistics, National Education Longitudinal Study, 1988(NELS:88); Second Follow-up Parent and Student Surveys.
Table A3.10— Comparison of parent and student responses to items about educational aspirations and expectations
VALUE BYP76 BYS45
missing 1014 1211 93 2042 1740 14743 1211 13724 2865 20475 6021 70866 3545 4185
VALUE F2P61 F2S42A F2P61 F2S42B F2P61 F2S43b C
missing 9 2671 36 2299 889 1498NA 14195 . 5018 . 1370 .0 . 1135 . 308 . .1 1 107 18 103 21 2752 65 864 506 914 604 9733 23 130 268 151 310 2844 152 265 954 284 1158 5145 . 600 . 641 . 9516 9 172 75 200 86 3637 118 1004 792 1133 948 17178 867 5189 4138 5612 5215 49579 534 2206 2545 2406 3167 274310 516 2146 2139 2375 2721 2214
(b) when the parent (F2P1A) is father or stepfather.(c) when the parent (F2P1A) is mother or stepmother.SOURCE: U.S. Department of Education, National Center for Education Statistics, National Education Longitudinal Study, 1988(NELS:88); Base Year and Second Follow-up Parent Survey, Base Year and Second Follow-up Student Survey.

211
Table A3.11— Comparison of parent and student responses to items about college choice factors
VALUE F2P66A F2S59A F2P66B F2S59B F2P66C F2S59C F2P66D F2S59D F2P66E
missing 1039 705 1024 716 1037 741 1026 733 1034NA 5569 1989 5569 1989 5569 1989 5569 1989 55691 1868 3054 2197 3060 362 975 6824 8896 46102 4511 6791 2612 4723 2642 4226 1853 3535 41503 3502 3950 5087 6001 6879 8558 1217 1336 1126
VALUE F2S59E F2P66F F2S59F F2P66G F2S59G F2P66H F2S59H F2P66I F2S59I F2P66J
missing 734 1024 733 1050 741 1026 740 1032 741 1039NA 1989 5569 1989 5569 1989 5569 1989 5569 1989 55691 3663 5144 7827 3669 5136 4679 9527 678 3366 7012 7129 2033 3520 3861 5327 3186 3324 2846 6167 30113 2974 2719 2420 2340 3296 2029 909 6364 4226 6169
VALUE F2S59J F2P66K F2S59K F2P66L F2S59L F2P66M F2S59M F2P66N F2S59N F2P66O
missing 749 1067 774 1034 772 1101 770 1031 769 1090NA 1989 5569 1989 5569 1989 5569 1989 5569 1989 55691 1624 1577 3338 286 1709 4784 5961 386 1042 53882 4940 3336 5456 2144 4989 3186 5563 1950 3594 30183 7187 4940 4932 7456 7030 1849 2206 7553 9095 1424
VALUE F2S59O F2P66P F2S59P F2P66Q F2S59Q F2P66R F2S59R
missing 792 1055 759 1044 771 1058 765 NA 1989 5569 1989 5569 1989 5569 1989 1 8031 3744 5190 2043 3929 9007 12583 2 4400 4395 6540 4960 6913 603 939 3 1277 1726 2011 2873 2887 252 213
SOURCE: U.S. Department of Education, National Center for Education Statistics, National Education Longitudinal Study, 1988(NELS:88); Second Follow-up Parent Survey, Second Follow-up Student Survey.
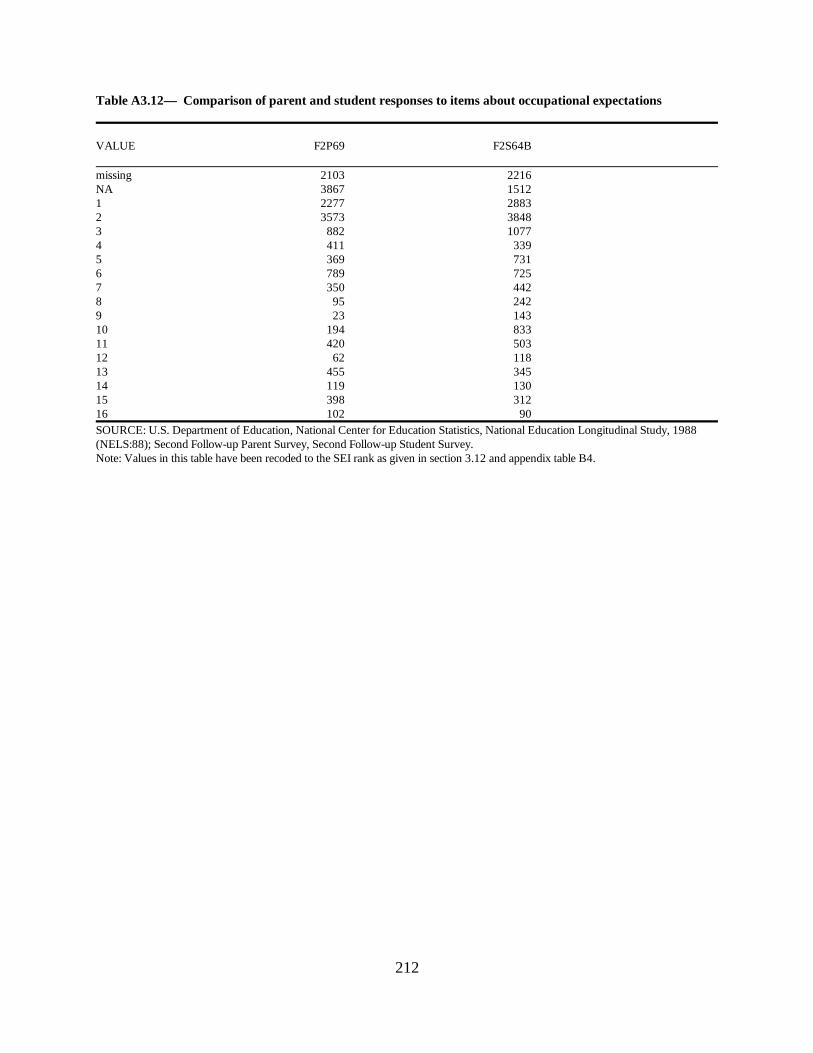
212
Table A3.12— Comparison of parent and student responses to items about occupational expectations
VALUE F2P69 F2S64B
missing 2103 2216NA 3867 15121 2277 28832 3573 38483 882 10774 411 3395 369 7316 789 7257 350 4428 95 2429 23 14310 194 83311 420 50312 62 11813 455 34514 119 13015 398 31216 102 90SOURCE: U.S. Department of Education, National Center for Education Statistics, National Education Longitudinal Study, 1988(NELS:88); Second Follow-up Parent Survey, Second Follow-up Student Survey.Note: Values in this table have been recoded to the SEI rank as given in section 3.12 and appendix table B4.
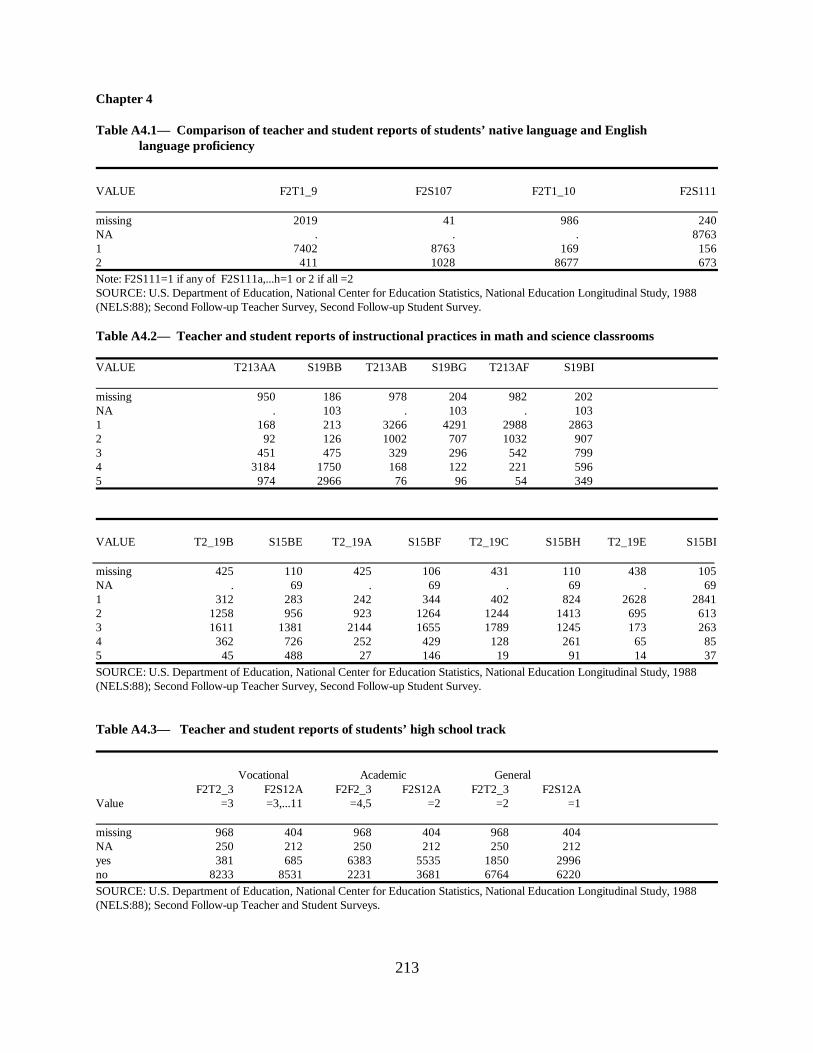
213
Chapter 4
Table A4.1— Comparison of teacher and student reports of students’ native language and English language proficiency
VALUE F2T1_9 F2S107 F2T1_10 F2S111
missing 2019 41 986 240NA . . . 87631 7402 8763 169 1562 411 1028 8677 673Note: F2S111=1 if any of F2S111a,...h=1 or 2 if all =2SOURCE: U.S. Department of Education, National Center for Education Statistics, National Education Longitudinal Study, 1988(NELS:88); Second Follow-up Teacher Survey, Second Follow-up Student Survey.
Table A4.2— Teacher and student reports of instructional practices in math and science classrooms
VALUE T213AA S19BB T213AB S19BG T213AF S19BI
missing 950 186 978 204 982 202NA . 103 . 103 . 1031 168 213 3266 4291 2988 28632 92 126 1002 707 1032 9073 451 475 329 296 542 7994 3184 1750 168 122 221 5965 974 2966 76 96 54 349
VALUE T2_19B S15BE T2_19A S15BF T2_19C S15BH T2_19E S15BI
missing 425 110 425 106 431 110 438 105NA . 69 . 69 . 69 . 691 312 283 242 344 402 824 2628 28412 1258 956 923 1264 1244 1413 695 6133 1611 1381 2144 1655 1789 1245 173 2634 362 726 252 429 128 261 65 855 45 488 27 146 19 91 14 37
SOURCE: U.S. Department of Education, National Center for Education Statistics, National Education Longitudinal Study, 1988(NELS:88); Second Follow-up Teacher Survey, Second Follow-up Student Survey.
Table A4.3— Teacher and student reports of students’ high school track
Vocational Academic General F2T2_3 F2S12A F2F2_3 F2S12A F2T2_3 F2S12A
Value =3 =3,...11 =4,5 =2 =2 =1
missing 968 404 968 404 968 404NA 250 212 250 212 250 212yes 381 685 6383 5535 1850 2996no 8233 8531 2231 3681 6764 6220
SOURCE: U.S. Department of Education, National Center for Education Statistics, National Education Longitudinal Study, 1988(NELS:88); Second Follow-up Teacher and Student Surveys.

214
Chapter 5
Table A5.1— Comparison of second follow-up and base year student responses to items about television viewing
VALUE BYS42A F2S35A BYS42B F2S35B
missing 1561 574 1889 705NA . 1512 . 15120 494 673 535 6081 1347 2619 872 15842 3481 3756 1870 26293 3446 3664 2614 34704 4337 2527 5033 34045 1823 1164 3676 2577SOURCE: U.S. Department of Education, National Center for Education Statistics, National Education Longitudinal Study, 1988(NELS:88); Base Year and Second Follow-up Student Surveys.
Table A5.2— Comparison of second follow-up and base year student responses to items about Englishlanguage competence
VALUE BYS29 F2S110A BYS17 F2S107 BYS27A F2S109A
390 324 93 79 73 331NA 12912 14707 2 2 12912 147071 2659 1324 1951 1703 24 162 528 134 14445 14707 104 103 . . . . 365 2204 . . . . 3011 1205
VALUE BYS27B F2S109B BYS27C F2S109C BYS27D F2S109 D
75 331 75 331 76 334NA 12912 14707 12912 14707 12912 147071 35 6 44 7 49 62 136 16 141 22 161 43 523 307 503 313 557 3504 2808 1122 2814 1109 2734 1051
Note: when BYS18=1, BYS17 was recoded from 1 to 2 here. That is, BYS17=1 if students' native language is not EnglishSOURCE: U.S. Department of Education, National Center for Education Statistics, National Education Longitudinal Study, 1988(NELS:88); Base Year and Second Follow-up Student Surveys.

215
Table A5.3— Comparison of first and second follow-up student responses to items about religious attitudes
VALUE F1S83 F2S105 F1S82 F2S106
missing 1131 2062 1119 20891 4350 4692 3035 34212 9207 7693 2933 32543 1801 2042 1167 12114 . . 1545 14245 . . 4504 35516 . . 2186 1539SOURCE: U.S. Department of Education, National Center for Education Statistics, National Education Longitudinal Study, 1988(NELS:88); First and Second Follow-up Student Surveys.
Table A5.4— Comparison of second follow-up and base year student responses to items about views on parental trust
VALUE BYS39A F2S100A BYS39B F2S100B BYS39C F2S100C
missing 154 3167 180 3242 213 32411 3334 1702 4562 3498 12767 106932 13001 11620 11747 9749 3509 2555
SOURCE: U.S. Department of Education, National Center for Education Statistics, National Education Longitudinal Study, 1988(NELS:88); Base Year, First and Second Follow-up Student Surveys.
Table A5.5— Comparison of second follow-up and earlier student responses to items about discussions withparents
VALUE BYS36A F2S99A BYS36B F2S99B BYS36C F2S99C
missing 261 1854 221 1846 238 1897NA . 1512 . 1512 . 15121 2104 3398 1328 3035 1730 27142 7579 7674 5303 6869 5728 77273 6545 2051 9637 3198 8793 2439
VALUE F1S105A F1S105B F1S105C F1S105D F2S99 D
missing 1389 1408 1414 1413 1935NA 634 634 634 634 15121 2406 2750 2666 816 10372 9095 7962 8752 6826 67223 2965 3735 3023 6900 5283
SOURCE: U.S. Department of Education, National Center for Education Statistics, National Education Longitudinal Study, 1988(NELS:88); Base Year, First and Second Follow-up Student Surveys.

216
Table A5.6— Comparison of second follow-up and earlier student responses to items about self-esteem and locus of control
VALUE BYS44A F2S66A BYS44B F2S66B BYS44C F2S66C BYS44D F2S66D
missing 149 1508 169 1563 210 1581 326 16471 141 178 774 731 483 405 214 2072 1045 850 2321 2454 1284 1195 1000 7453 9325 7817 7861 7756 7625 8269 8313 76834 5829 6136 5364 3985 6887 5039 6636 6207
VALUE BYS44E F2S66E BYS44F F2S66F BYS44G F2S66G BYS44H F2S66H BYS44I
missing 265 1631 198 1608 195 1651 267 1627 2971 159 147 908 638 801 583 271 233 13432 1082 717 3360 2859 2230 2288 1577 1549 67823 8530 8012 9282 8913 8604 8644 8767 8047 58364 6453 5982 2741 2471 4659 3323 5607 5033 2231
VALUE F2S66I BYS44J F2S66J BYS44K F2S66K BYS44L F2S66 BYS44M F2S66M
missing 1622 265 1679 248 1654 240 1667 192 16471 700 1243 660 387 243 563 500 1535 7262 5799 5237 4068 2838 2343 1581 1597 4543 30933 6090 5822 6456 9692 9432 6731 7427 6781 72704 2278 3922 3626 3324 2817 7374 5298 3438 3753
VALUE F1S62A F1S62B F1S62C F1S62D
missing 852 925 954 9381 196 639 343 1882 1090 2852 1418 10503 9061 8094 8658 89494 5290 3979 5116 5364
VALUE F1S62E F1S62F F1S62G F1S62H F1S62I
missing 987 945 994 987 10211 138 577 530 321 7842 1015 3372 2638 1982 68673 9305 9246 9146 8916 58244 5044 2349 3181 4283 1993
VALUE F1S62J F1S62K F1S62L F1S62M
missing 1000 1013 1029 10351 785 354 464 6762 4973 2888 2078 36393 6475 9989 7915 76644 3256 2245 5003 3475
SOURCE: U.S. Department of Education, National Center for Education Statistics, National Education Longitudinal Study, 1988(NELS:88); Base Year, First and Second Follow-up Student Surveys.
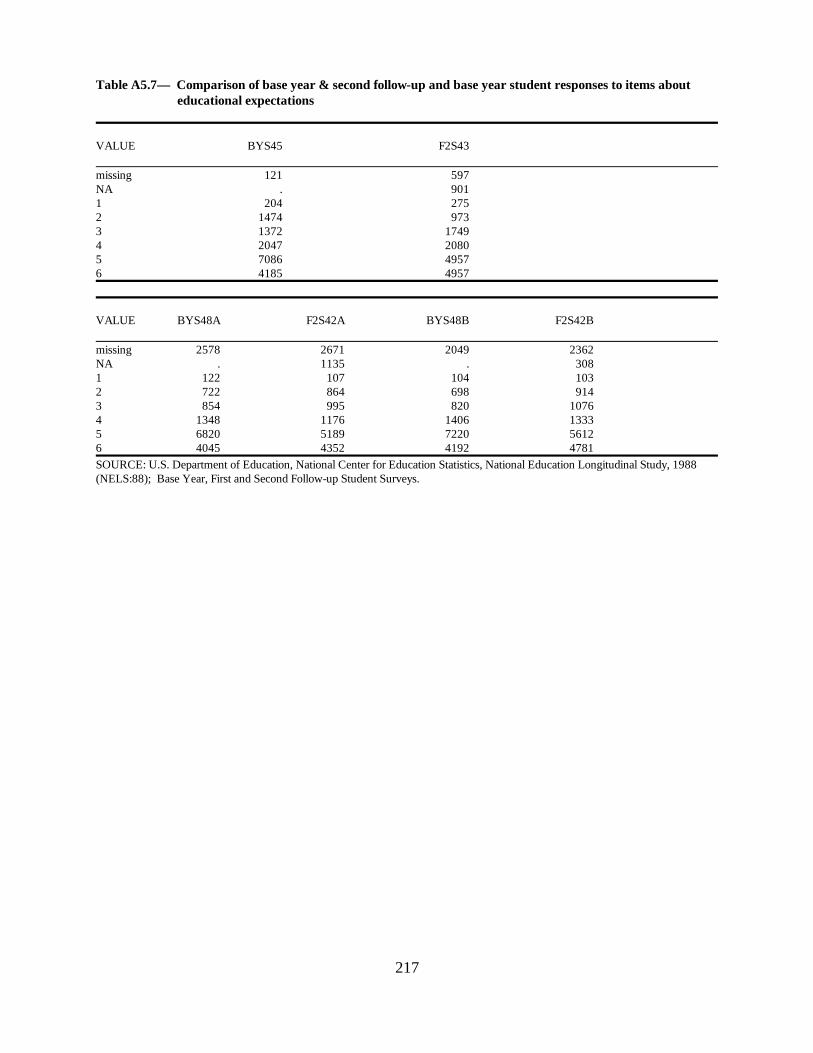
217
Table A5.7— Comparison of base year & second follow-up and base year student responses to items about educational expectations
VALUE BYS45 F2S43
missing 121 597NA . 9011 204 2752 1474 9733 1372 17494 2047 20805 7086 49576 4185 4957
VALUE BYS48A F2S42A BYS48B F2S42B
missing 2578 2671 2049 2362NA . 1135 . 3081 122 107 104 1032 722 864 698 9143 854 995 820 10764 1348 1176 1406 13335 6820 5189 7220 56126 4045 4352 4192 4781
SOURCE: U.S. Department of Education, National Center for Education Statistics, National Education Longitudinal Study, 1988(NELS:88); Base Year, First and Second Follow-up Student Surveys.

218
Table A5.8— Comparison of second follow-up and earlier student responses to items about expected occupation at 30
VALUE BYS52 F2S64B F1S53B F2S64B
missing 2185 725 2373 725NA 2621 3003 1850 30031 4924 2883 3137 28832 1046 3848 3445 38483 352 1220 658 10774 955 725 404 3395 461 1415 744 7316 1384 842 731 7257 979 833 419 4428 140 118 281 2429 633 475 249 14310 738 312 723 83311 71 90 382 50312 . . 135 11813 . . 498 34514 . . 136 13015 . . 237 31216 . . 87 90Note: F2S64B recoded to match categories in BYS52SOURCE: U.S. Department of Education, National Center for Education Statistics, National Education Longitudinal Study, 1988 (NELS:88); Base Year, First and Second Follow-up Student Surveys.
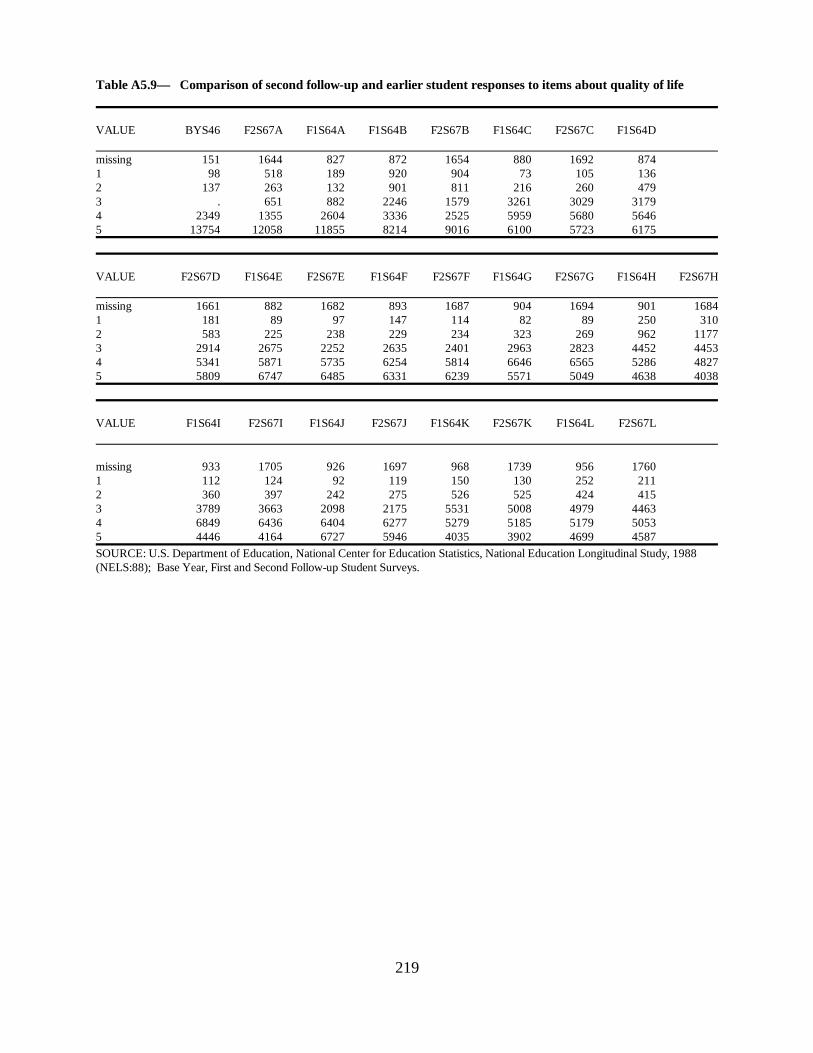
219
Table A5.9— Comparison of second follow-up and earlier student responses to items about quality of life
VALUE BYS46 F2S67A F1S64A F1S64B F2S67B F1S64C F2S67C F1S64D
missing 151 1644 827 872 1654 880 1692 8741 98 518 189 920 904 73 105 1362 137 263 132 901 811 216 260 4793 . 651 882 2246 1579 3261 3029 31794 2349 1355 2604 3336 2525 5959 5680 56465 13754 12058 11855 8214 9016 6100 5723 6175
VALUE F2S67D F1S64E F2S67E F1S64F F2S67F F1S64G F2S67G F1S64H F2S67H
missing 1661 882 1682 893 1687 904 1694 901 16841 181 89 97 147 114 82 89 250 3102 583 225 238 229 234 323 269 962 11773 2914 2675 2252 2635 2401 2963 2823 4452 44534 5341 5871 5735 6254 5814 6646 6565 5286 48275 5809 6747 6485 6331 6239 5571 5049 4638 4038
VALUE F1S64I F2S67I F1S64J F2S67J F1S64K F2S67K F1S64L F2S67L
missing 933 1705 926 1697 968 1739 956 17601 112 124 92 119 150 130 252 2112 360 397 242 275 526 525 424 4153 3789 3663 2098 2175 5531 5008 4979 44634 6849 6436 6404 6277 5279 5185 5179 50535 4446 4164 6727 5946 4035 3902 4699 4587
SOURCE: U.S. Department of Education, National Center for Education Statistics, National Education Longitudinal Study, 1988(NELS:88); Base Year, First and Second Follow-up Student Surveys.

220
Table A5.10— Comparison of first and second follow-up student responses to items about importance of life attainments
VALUE F1S46A F2S40A F1S46B F2S40B F1S46C F2S40C F1S46D F2S40D
missing 214 144 208 145 212 154 229 1481 229 169 884 698 1164 1566 281 3122 2284 1757 2925 2590 7976 8654 2810 30123 13762 14419 12472 13056 7137 6115 13169 13017
VALUE F2S46E F1S40E F2S46F F1S40F F2S46G F1S40G F2S46H F1S40H F2S46I
missing 238 157 239 165 249 170 261 161 2461 306 200 1403 1185 798 704 3427 4414 82012 2249 1712 9646 9667 3382 3265 8863 9034 51823 13696 14420 5201 5472 12060 12350 3938 2880 2860
VALUE F2S40I F1S46J F2S40J F1S46K F2S40K F1S46L F2S40L F1S46M F2S40M
missing 170 270 186 240 166 240 170 225 1761 6989 4841 4317 2694 2682 381 340 7235 78082 5986 8370 8768 6456 6351 5165 5625 6338 62673 3344 3008 3218 7099 7290 10703 10354 2691 2238
SOURCE: U.S. Department of Education, National Center for Education Statistics, National Education Longitudinal Study, 1988(NELS:88); First and Second Follow-up Student Surveys.
Table A5.11— Comparison of first and second follow-up student responses to items about the school program
Vocational Accdemic GeneralF1S20 F2S12A F1S20 F2S12A F1S20 F2S12A
VALUE 3,...,11 3,...,11 = 2 = 2 = 1 = 1
missing 318 115 318 115 318 115NA 634 1512 634 1512 634 1512yes 1346 1636 5817 6901 6364 5191no 14191 13226 9720 7961 9173 9671
SOURCE: U.S. Department of Education, National Center for Education Statistics, National Education Longitudinal Study, 1988(NELS:88); First and Second Follow-up Student Surveys.
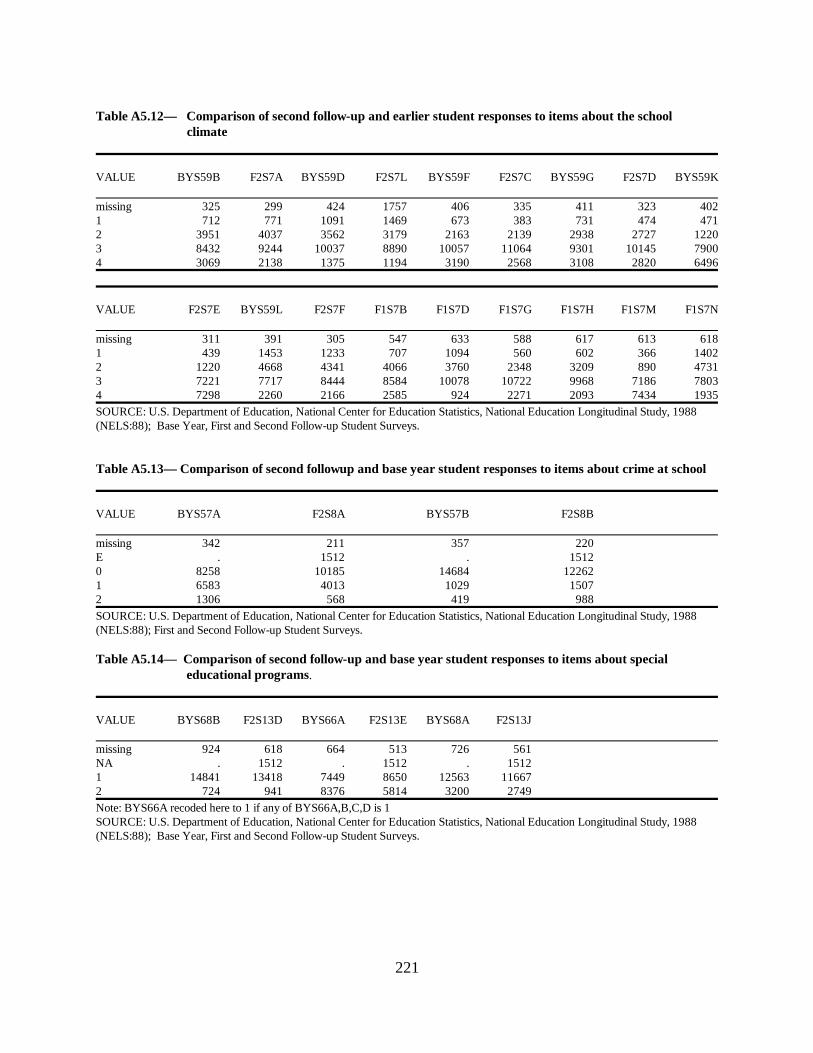
221
Table A5.12— Comparison of second follow-up and earlier student responses to items about the school climate
VALUE BYS59B F2S7A BYS59D F2S7L BYS59F F2S7C BYS59G F2S7D BYS59K
missing 325 299 424 1757 406 335 411 323 4021 712 771 1091 1469 673 383 731 474 4712 3951 4037 3562 3179 2163 2139 2938 2727 12203 8432 9244 10037 8890 10057 11064 9301 10145 79004 3069 2138 1375 1194 3190 2568 3108 2820 6496
VALUE F2S7E BYS59L F2S7F F1S7B F1S7D F1S7G F1S7H F1S7M F1S7N
missing 311 391 305 547 633 588 617 613 6181 439 1453 1233 707 1094 560 602 366 14022 1220 4668 4341 4066 3760 2348 3209 890 47313 7221 7717 8444 8584 10078 10722 9968 7186 78034 7298 2260 2166 2585 924 2271 2093 7434 1935
SOURCE: U.S. Department of Education, National Center for Education Statistics, National Education Longitudinal Study, 1988(NELS:88); Base Year, First and Second Follow-up Student Surveys.
Table A5.13— Comparison of second followup and base year student responses to items about crime at school
VALUE BYS57A F2S8A BYS57B F2S8B
missing 342 211 357 220E . 1512 . 15120 8258 10185 14684 122621 6583 4013 1029 15072 1306 568 419 988
SOURCE: U.S. Department of Education, National Center for Education Statistics, National Education Longitudinal Study, 1988(NELS:88); First and Second Follow-up Student Surveys.
Table A5.14— Comparison of second follow-up and base year student responses to items about special educational programs.
VALUE BYS68B F2S13D BYS66A F2S13E BYS68A F2S13J
missing 924 618 664 513 726 561NA . 1512 . 1512 . 15121 14841 13418 7449 8650 12563 116672 724 941 8376 5814 3200 2749
Note: BYS66A recoded here to 1 if any of BYS66A,B,C,D is 1SOURCE: U.S. Department of Education, National Center for Education Statistics, National Education Longitudinal Study, 1988(NELS:88); Base Year, First and Second Follow-up Student Surveys.

222
Table A5.15— Comparison of second follow-up and base year student responses to items about homework
BY F2 BY F2 BY F2 BY F2 BY F2VALUE S78C S24C S79A S25A2 S79B S25B2 S79C S25C2 S79D S25D2
missing 910 312 701 436 745 426 785 591 797 526NA . 1512 . 6866 . 8456 . 2432 . 61310 . . 1292 1291 2591 1090 1701 1436 2124 13111 1128 847 6412 2063 7085 2005 7166 3341 6473 29602 1984 1541 6548 3335 5535 2764 6044 5107 6274 36393 7977 8778 1217 1645 398 1118 608 2317 620 13084 4490 3499 206 520 85 399 132 791 144 4025 . . 113 333 50 231 53 474 57 212SOURCE: U.S. Department of Education, National Center for Education Statistics, National Education Longitudinal Study, 1988(NELS:88); Base Year, First and Second Follow-up Student Surveys.
Table A5.16— Comparison of second follow-up and base year student responses to items about cutting class
VALUE BYS76 F2S9B
missing 681 3480 14554 116521 975 30572 197 5343 82 898
SOURCE: U.S. Department of Education, National Center for Education Statistics, National Education Longitudinal Study, 1988(NELS:88); Base Year, First and Second Follow-up Student Surveys.
Table A5.17— Comparison of second follow-up and base year student responses to items about preparing for class
VALUE BYS78A F2S24A BYS78B F2S24B
missing 728 305 927 314 NA . 1512 . 1512 1 1282 653 553 602 2 2121 858 848 612 3 7518 5628 6343 5748 4 4840 7533 7818 7701
SOURCE: U.S. Department of Education, National Center for Education Statistics, National Education Longitudinal Study, 1988(NELS:88); Base Year, First and Second Follow-up Student Surveys.
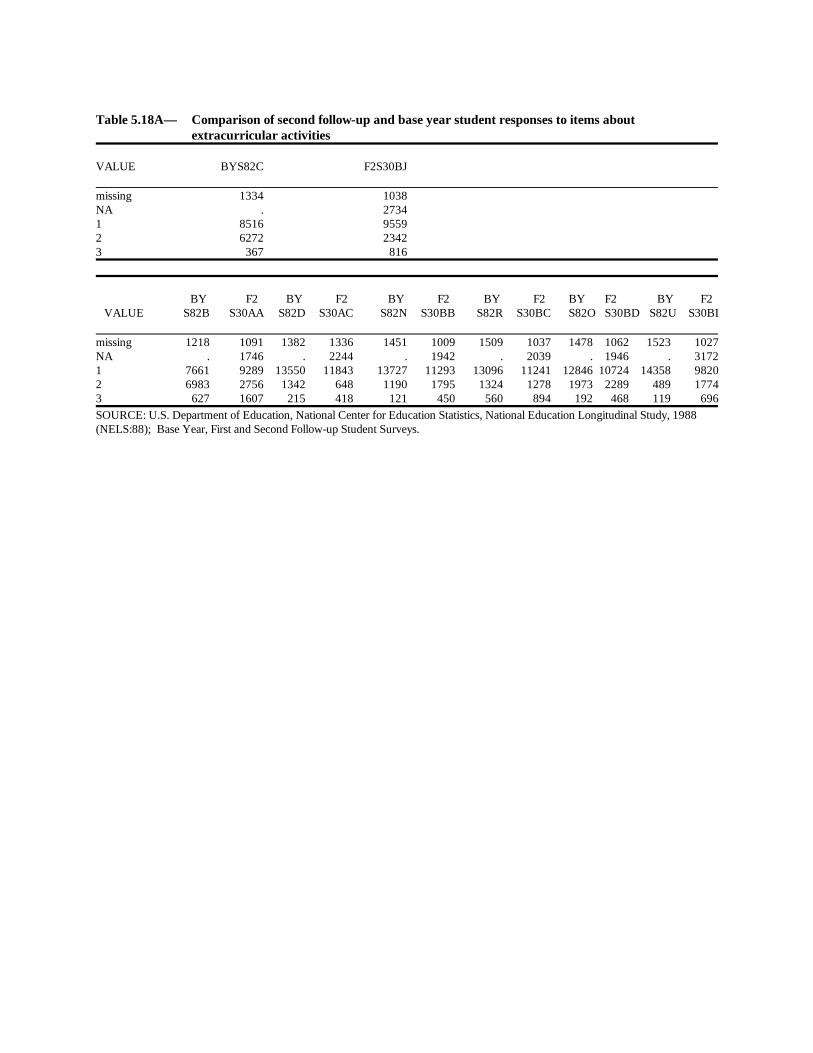
Table 5.18A— Comparison of second follow-up and base year student responses to items aboutextracurricular activities
VALUE BYS82C F2S30BJ
missing 1334 1038NA . 27341 8516 95592 6272 23423 367 816
BY F2 BY F2 BY F2 BY F2 BY F2 BY F2 VALUE S82B S30AA S82D S30AC S82N S30BB S82R S30BC S82O S30BD S82U S30BI
missing 1218 1091 1382 1336 1451 1009 1509 1037 1478 1062 1523 1027NA . 1746 . 2244 . 1942 . 2039 . 1946 . 31721 7661 9289 13550 11843 13727 11293 13096 11241 12846 10724 14358 98202 6983 2756 1342 648 1190 1795 1324 1278 1973 2289 489 17743 627 1607 215 418 121 450 560 894 192 468 119 696
SOURCE: U.S. Department of Education, National Center for Education Statistics, National Education Longitudinal Study, 1988(NELS:88); Base Year, First and Second Follow-up Student Surveys.

224
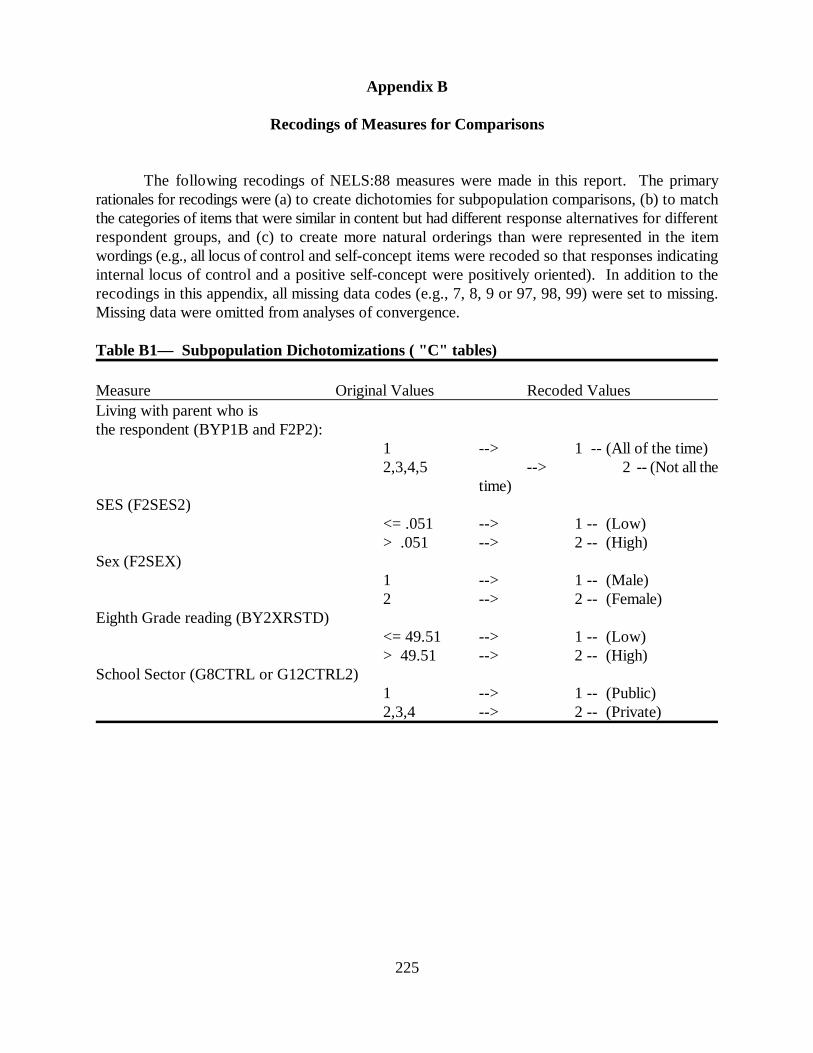
225
Appendix B
Recodings of Measures for Comparisons
The following recodings of NELS:88 measures were made in this report. The primaryrationales for recodings were (a) to create dichotomies for subpopulation comparisons, (b) to matchthe categories of items that were similar in content but had different response alternatives for differentrespondent groups, and (c) to create more natural orderings than were represented in the itemwordings (e.g., all locus of control and self-concept items were recoded so that responses indicatinginternal locus of control and a positive self-concept were positively oriented). In addition to therecodings in this appendix, all missing data codes (e.g., 7, 8, 9 or 97, 98, 99) were set to missing.Missing data were omitted from analyses of convergence.
Table B1— Subpopulation Dichotomizations ( "C" tables)
Measure Original Values Recoded ValuesLiving with parent who is the respondent (BYP1B and F2P2):
1 --> 1 -- (All of the time) 2,3,4,5 --> 2 -- (Not all the
time) SES (F2SES2)
<= .051 --> 1 -- (Low)> .051 --> 2 -- (High)
Sex (F2SEX)1 --> 1 -- (Male)2 --> 2 -- (Female)
Eighth Grade reading (BY2XRSTD)<= 49.51 --> 1 -- (Low)> 49.51 --> 2 -- (High)
School Sector (G8CTRL or G12CTRL2)1 --> 1 -- (Public)2,3,4 --> 2 -- (Private)
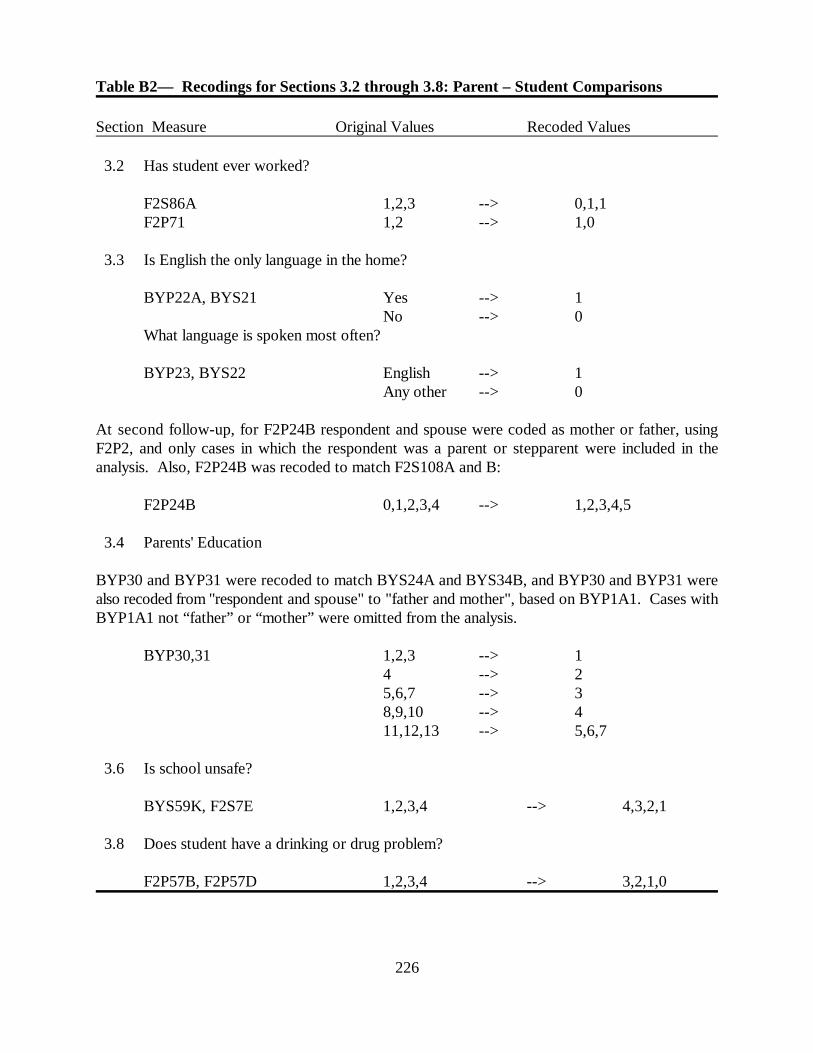
226
Table B2— Recodings for Sections 3.2 through 3.8: Parent – Student Comparisons
Section Measure Original Values Recoded Values
3.2 Has student ever worked?
F2S86A 1,2,3 --> 0,1,1F2P71 1,2 --> 1,0
3.3 Is English the only language in the home?
BYP22A, BYS21 Yes --> 1No --> 0
What language is spoken most often?
BYP23, BYS22 English --> 1Any other --> 0
At second follow-up, for F2P24B respondent and spouse were coded as mother or father, usingF2P2, and only cases in which the respondent was a parent or stepparent were included in theanalysis. Also, F2P24B was recoded to match F2S108A and B:
F2P24B 0,1,2,3,4 --> 1,2,3,4,5
3.4 Parents' Education BYP30 and BYP31 were recoded to match BYS24A and BYS34B, and BYP30 and BYP31 werealso recoded from "respondent and spouse" to "father and mother", based on BYP1A1. Cases withBYP1A1 not “father” or “mother” were omitted from the analysis.
BYP30,31 1,2,3 --> 14 --> 25,6,7 --> 38,9,10 --> 411,12,13 --> 5,6,7
3.6 Is school unsafe?
BYS59K, F2S7E 1,2,3,4 --> 4,3,2,1
3.8 Does student have a drinking or drug problem?
F2P57B, F2P57D 1,2,3,4 --> 3,2,1,0
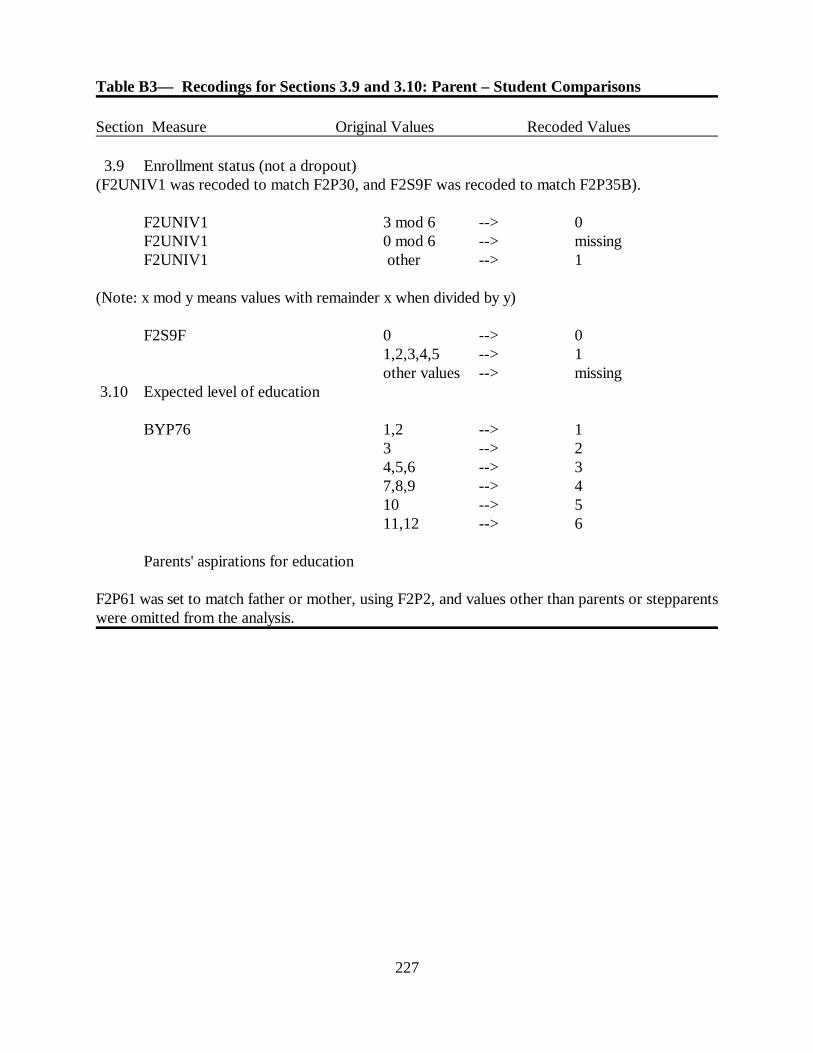
227
Table B3— Recodings for Sections 3.9 and 3.10: Parent – Student Comparisons
Section Measure Original Values Recoded Values
3.9 Enrollment status (not a dropout) (F2UNIV1 was recoded to match F2P30, and F2S9F was recoded to match F2P35B).
F2UNIV1 3 mod 6 --> 0F2UNIV1 0 mod 6 --> missingF2UNIV1 other --> 1
(Note: x mod y means values with remainder x when divided by y)
F2S9F 0 --> 01,2,3,4,5 --> 1other values --> missing
3.10 Expected level of education
BYP76 1,2 --> 13 --> 24,5,6 --> 37,8,9 --> 410 --> 511,12 --> 6
Parents' aspirations for education
F2P61 was set to match father or mother, using F2P2, and values other than parents or stepparentswere omitted from the analysis.

228
Table B4— Recodings for Occupations (Sections 3.12 and 5.8)Occupations were recoded to match each other and reordered by Duncan’s SEI . a
Base Year Follow-upStudent and Parent Base Year Follow-upResponse Response SEI Rank SEI Rank
professional (6) professional #1 (10) 1 1 science (10) professional #2 (9) 2 2 homemaker (3) teacher (14) 3 3 homemaker (4) 3 9 technical (8) technical (16) 4 6 office,sales (9) manager (6) 5 5 clerical (1) 5 7 sales (13) 5 8 military,police (5) military (7) 6 4 protective (12) 6 11 owner (7) owner (11) 7 10 farmer (2) farmer (3) 8 12 crafts, operator (1) crafts (2) 9 13 operator (8) 9 14 service (11) service (15) 10 15 laborer (4) laborer (5) 11 16
Measure Original Recoded Original Recoded Original RecodedBYS52
6 --> 1 10 --> 2 3 --> 38 --> 4 9 --> 5 5 --> 67 --> 7 2 --> 8 1 --> 911 --> 10 4 --> 11
F2P69,F1S53B,F2S64B10 --> 1 9 --> 2 14 --> 37 --> 4 6 --> 5 16 --> 61 --> 7 13 --> 8 4 --> 911 --> 10 12 --> 11 3 --> 122 --> 13 8 --> 14 15 --> 155 --> 16
For comparison to BYS52, F2S64B was recoded as:10 --> 1 9 --> 2 4,14 --> 316 --> 4 1,6,13 --> 5 7,12 --> 611 --> 7 3 --> 8 2,8 --> 915 --> 10 5 --> 11
(a) The values for SEI were taken from NELS:88 Second Follow-up Student Component Data File User’s Manual, p. H-7.
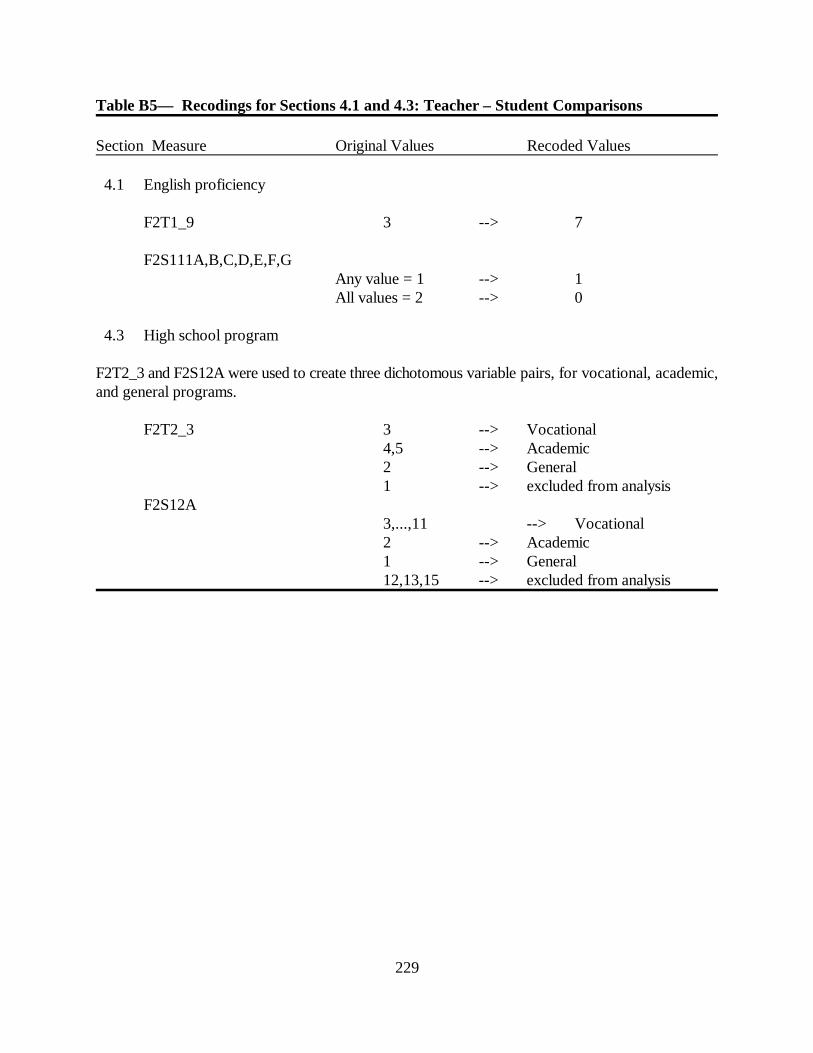
229
Table B5— Recodings for Sections 4.1 and 4.3: Teacher – Student Comparisons
Section Measure Original Values Recoded Values
4.1 English proficiency
F2T1_9 3 --> 7
F2S111A,B,C,D,E,F,G Any value = 1 --> 1
All values = 2 --> 0
4.3 High school program
F2T2_3 and F2S12A were used to create three dichotomous variable pairs, for vocational, academic,and general programs.
F2T2_3 3 --> Vocational4,5 --> Academic2 --> General1 --> excluded from analysis
F2S12A3,...,11 --> Vocational2 --> Academic1 --> General12,13,15 --> excluded from analysis

230
Table B6— Recodings for Sections 5.1 through 5.6: Student Comparisons over Time
Section Measure Original Values Recoded Values
5.1 Television watching
BYS42A,B 5 --> 46 --> 5
5.2 English language questions
BYS17 2 --> 0if BYS18=1, then 1 --> 1if BYS18=2,...13, then 1 --> 0
F2S107 1,2 --> 1,0
BYS27A,B,C,D and F2S109A,B,C,D 1,2,3,4 --> 4,3,2,1
BYS29 and F2S110A 1,2 --> 1,0
5.3 Religiousness
F1S82 and F2S106 1,2,3,4,5,6 --> 6,5,4,3,2,1F1S83 and F2S105 1,2,3 --> 3,2,1
5.4 Ratings of parental trust
BYS39A and BYS39C 1,2 --> 1,0
F2S100A and F2S100C 1,2,3 --> 14,5,6 --> 0
F2S100B 1,2,3 --> 04,5,6 --> 1
5.6 Locus of control and self-concept items
BYS44A,D,E,H,K,F1S62A,D,E,H,K, and
F2S66A,D,E,H,K 1,2,3,4 --> 4,3,2,1

231
Table B7— Recodings for Sections 5.7 through 5.14: Student Comparisons over Time
Section Measure Original Values Recoded Values
5.7 Expected education
F2S43 and F2S42A,B 1 --> 12 --> 23,4,5 --> 36,7 --> 48 --> 59,10 --> 6
5.10 Ratings of chances of success
BYS46 1 --> 52 --> 43 --> 24 --> 1
5.11 Curricular program:
F1S20 and F2S12A 3,...,11 --> Vocational2 --> Academic1 --> General12,13,15 --> none of the above
5.12 Evaluation of schools
BYS59 B,D,F,G and F1S7 B,D,G,H and F2S7 A,L,C,D 1,2,3,4 --> 4,3,2,1
5.14 In a special program
BYS66Aif any of BYS66A,B,C,D=1 --> 1
If none of BYS66A,B,C,D=1 --> 0BYS68A,B, andF2S13D,E,J 1,2 --> 1,0

232
Table B8— Recodings for Sections 5.15 through 5.18: Student Comparisons over Time
Section Measure Original Values Recoded Values
5.15 Homework
BYS70C and F2S24C >4 --> missing
BYS79A,B,C,D 1 --> 1 2 --> 23 --> 24 --> 25 --> 36 --> 47 --> 5
F2S25A2,B2,C2,D2 0 --> legitimate skip1 --> 1 2 --> 23 --> 34 --> 45 --> 56 --> 57 --> 5
5.16 Cutting classes
F2S9B 0 --> 01 --> 0 2 --> 13 --> 14 --> 25 --> 3
5.18 Extracurricular activities
F2S30BB,BC,BD,BI,BJ 1 --> legitimate skip2,3,4 --> 1,2,3
F2S30AA and AC 1 --> legitimate skip2 --> 13,4 --> 25 --> 3
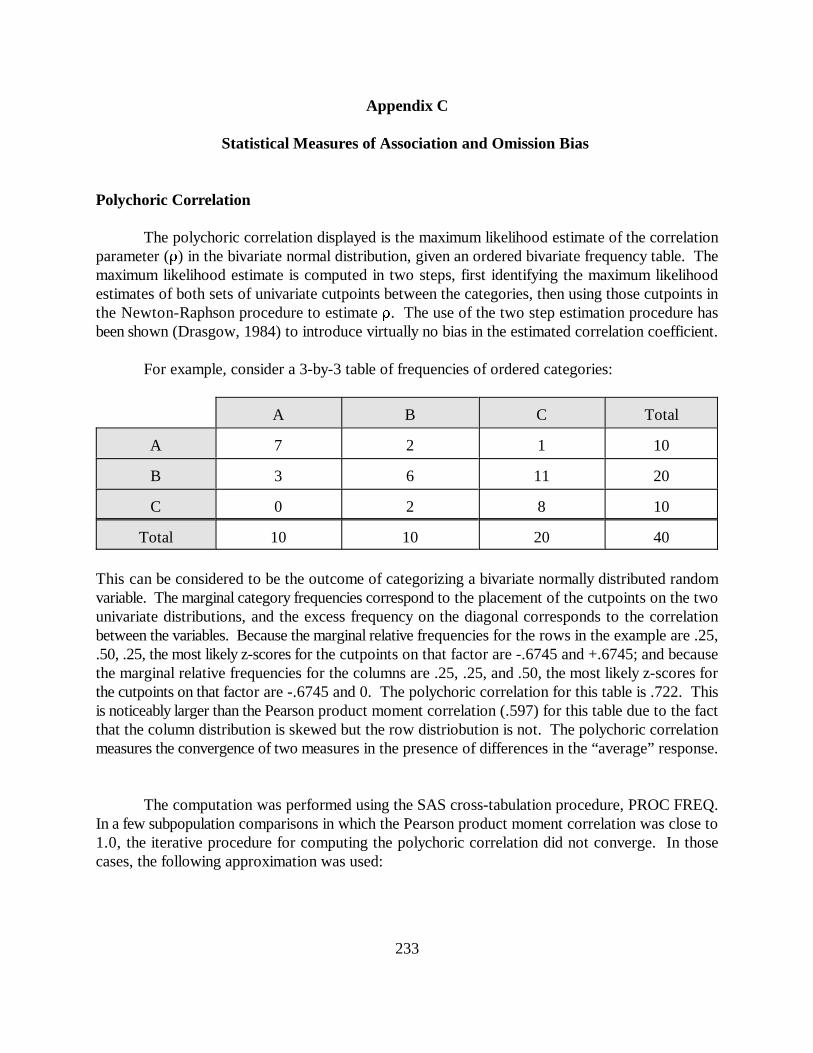
233
Appendix C
Statistical Measures of Association and Omission Bias
Polychoric Correlation
The polychoric correlation displayed is the maximum likelihood estimate of the correlationparameter (') in the bivariate normal distribution, given an ordered bivariate frequency table. Themaximum likelihood estimate is computed in two steps, first identifying the maximum likelihoodestimates of both sets of univariate cutpoints between the categories, then using those cutpoints inthe Newton-Raphson procedure to estimate '. The use of the two step estimation procedure hasbeen shown (Drasgow, 1984) to introduce virtually no bias in the estimated correlation coefficient.
For example, consider a 3-by-3 table of frequencies of ordered categories:
A B C Total
A 7 2 1 10
B 3 6 11 20
C 0 2 8 10
Total 10 10 20 40
This can be considered to be the outcome of categorizing a bivariate normally distributed randomvariable. The marginal category frequencies correspond to the placement of the cutpoints on the twounivariate distributions, and the excess frequency on the diagonal corresponds to the correlationbetween the variables. Because the marginal relative frequencies for the rows in the example are .25,.50, .25, the most likely z-scores for the cutpoints on that factor are -.6745 and +.6745; and becausethe marginal relative frequencies for the columns are .25, .25, and .50, the most likely z-scores forthe cutpoints on that factor are -.6745 and 0. The polychoric correlation for this table is .722. Thisis noticeably larger than the Pearson product moment correlation (.597) for this table due to the factthat the column distribution is skewed but the row distriobution is not. The polychoric correlationmeasures the convergence of two measures in the presence of differences in the “average” response.
The computation was performed using the SAS cross-tabulation procedure, PROC FREQ.In a few subpopulation comparisons in which the Pearson product moment correlation was close to1.0, the iterative procedure for computing the polychoric correlation did not converge. In thosecases, the following approximation was used:
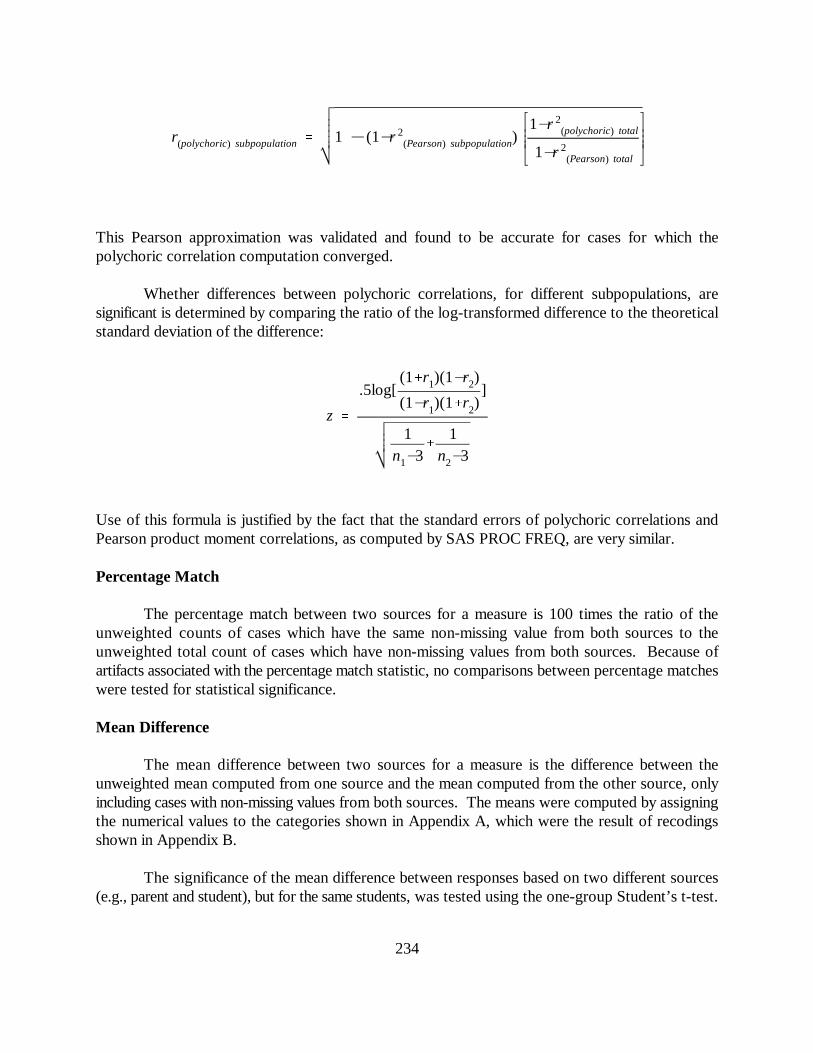
r(polychoric) subpopulation 1 (1r 2(Pearson) subpopulation)
1r 2(polychoric) total
1r 2(Pearson) total
z
.5log[(1�r1)(1r2)
(1r1)(1�r2)]
1n13
�
1n23
234
This Pearson approximation was validated and found to be accurate for cases for which thepolychoric correlation computation converged.
Whether differences between polychoric correlations, for different subpopulations, aresignificant is determined by comparing the ratio of the log-transformed difference to the theoreticalstandard deviation of the difference:
Use of this formula is justified by the fact that the standard errors of polychoric correlations andPearson product moment correlations, as computed by SAS PROC FREQ, are very similar. Percentage Match
The percentage match between two sources for a measure is 100 times the ratio of theunweighted counts of cases which have the same non-missing value from both sources to theunweighted total count of cases which have non-missing values from both sources. Because ofartifacts associated with the percentage match statistic, no comparisons between percentage matcheswere tested for statistical significance.
Mean Difference
The mean difference between two sources for a measure is the difference between theunweighted mean computed from one source and the mean computed from the other source, onlyincluding cases with non-missing values from both sources. The means were computed by assigningthe numerical values to the categories shown in Appendix A, which were the result of recodingsshown in Appendix B.
The significance of the mean difference between responses based on two different sources(e.g., parent and student), but for the same students, was tested using the one-group Student’s t-test.
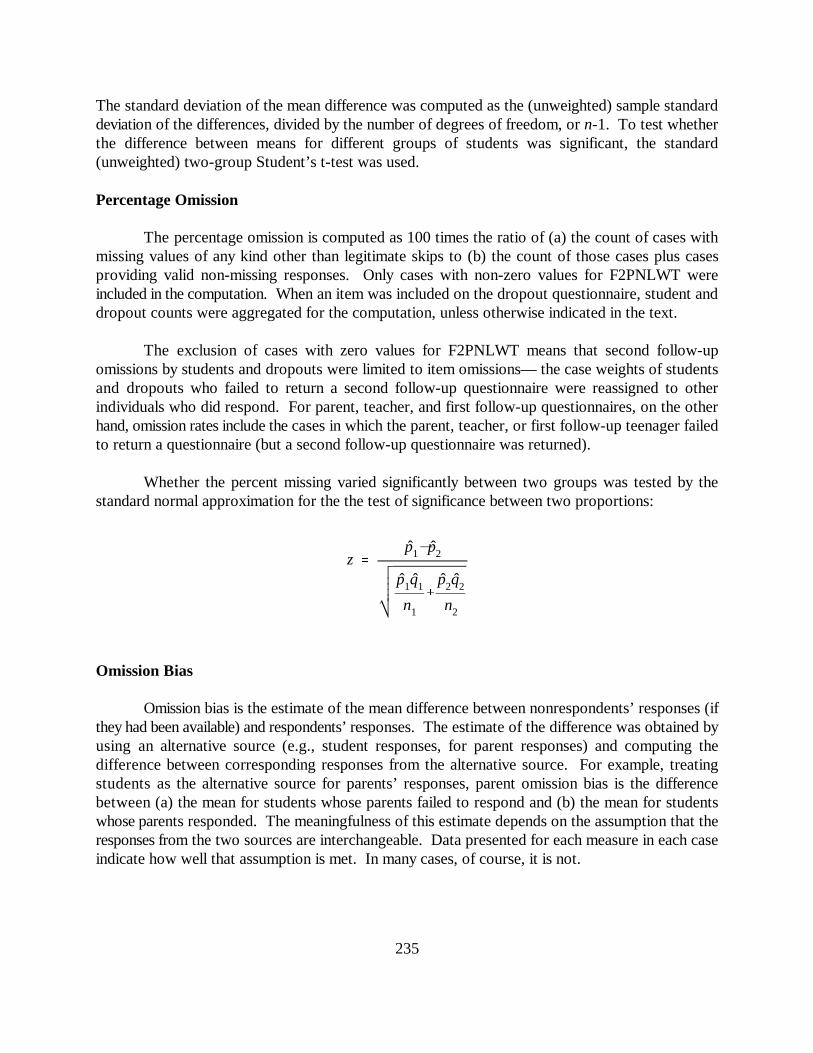
z
p̂1p̂2
p̂1q̂1
n1
�
p̂2q̂2
n2
235
The standard deviation of the mean difference was computed as the (unweighted) sample standarddeviation of the differences, divided by the number of degrees of freedom, or n-1. To test whetherthe difference between means for different groups of students was significant, the standard(unweighted) two-group Student’s t-test was used.
Percentage Omission
The percentage omission is computed as 100 times the ratio of (a) the count of cases withmissing values of any kind other than legitimate skips to (b) the count of those cases plus casesproviding valid non-missing responses. Only cases with non-zero values for F2PNLWT wereincluded in the computation. When an item was included on the dropout questionnaire, student anddropout counts were aggregated for the computation, unless otherwise indicated in the text.
The exclusion of cases with zero values for F2PNLWT means that second follow-upomissions by students and dropouts were limited to item omissions— the case weights of studentsand dropouts who failed to return a second follow-up questionnaire were reassigned to otherindividuals who did respond. For parent, teacher, and first follow-up questionnaires, on the otherhand, omission rates include the cases in which the parent, teacher, or first follow-up teenager failedto return a questionnaire (but a second follow-up questionnaire was returned).
Whether the percent missing varied significantly between two groups was tested by thestandard normal approximation for the the test of significance between two proportions:
Omission Bias
Omission bias is the estimate of the mean difference between nonrespondents’ responses (ifthey had been available) and respondents’ responses. The estimate of the difference was obtained byusing an alternative source (e.g., student responses, for parent responses) and computing thedifference between corresponding responses from the alternative source. For example, treatingstudents as the alternative source for parents’ responses, parent omission bias is the differencebetween (a) the mean for students whose parents failed to respond and (b) the mean for studentswhose parents responded. The meaningfulness of this estimate depends on the assumption that theresponses from the two sources are interchangeable. Data presented for each measure in each caseindicate how well that assumption is met. In many cases, of course, it is not.

236
The significance of omission bias was tested using the standard two-group Student’s t-test,comparing the mean responses from the alternative source, for respondents and nonrespondents tothe particular NELS:88 component.
Significance of Relations to Outcome Measures
Relations to outcome measures were estimated using SUDAAN, taking into account thecomplex sampling design of NELS:88 and the differential case weights (NCES 1994a). All tests weremade at the two-tailed .05 level; that is, the values of Student’s t were compared to 1.96. Thesignificance levels were not controlled for multiple comparisons through a Bonferroni adjustmentbecause they are intended to be descriptive—they denote the findings that researchers might obtainif they were using the NELS:88 measures to test theoretical hypotheses. For this report, theimportant question concerned whether such findings of significant results depended on the source ofthe measure.