Embed Size (px)
Citation preview
BGD11, 14239–14267, 2014
Nematode diversity,abundance and
community structure
K. Ilieva-Makulec et al.
Title Page
Abstract Introduction
Conclusions References
Tables Figures
J I
J I
Back Close
Full Screen / Esc
Printer-friendly Version
Interactive Discussion
Discussion
Paper
|D
iscussionP
aper|
Discussion
Paper
|D
iscussionP
aper|
Biogeosciences Discuss., 11, 14239–14267, 2014www.biogeosciences-discuss.net/11/14239/2014/doi:10.5194/bgd-11-14239-2014© Author(s) 2014. CC Attribution 3.0 License.
This discussion paper is/has been under review for the journal Biogeosciences (BG).Please refer to the corresponding final paper in BG if available.
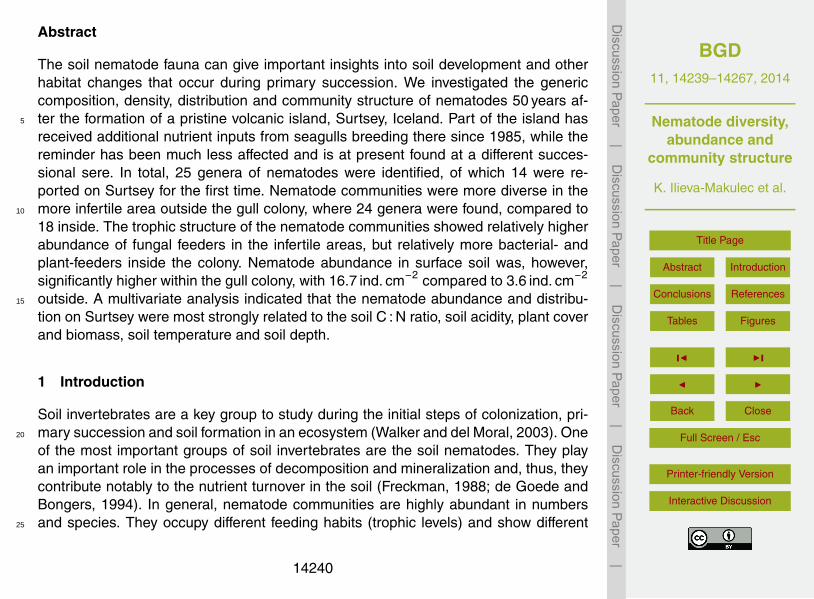
Nematode diversity, abundance andcommunity structure 50 years after theformation of the volcanic island ofSurtsey
K. Ilieva-Makulec1, B. Bjarnadottir2, and B. D. Sigurdsson3
1Cardinal St. Wyszynski University in Warsaw, 01-938 Warsaw, Poland2University of Akureyri, Sólborg v. Norðurslóð 600 Akureyri, Iceland3Agricultural University of Iceland, Hvanneyri, 311 Borgarnes, Iceland
Received: 9 April 2014 – Accepted: 15 September 2014 – Published: 2 October 2014
Correspondence to: B. D. Sigurdsson ([email protected])
Published by Copernicus Publications on behalf of the European Geosciences Union.
14239
BGD11, 14239–14267, 2014
Nematode diversity,abundance and
community structure
K. Ilieva-Makulec et al.
Title Page
Abstract Introduction
Conclusions References
Tables Figures
J I
J I
Back Close
Full Screen / Esc
Printer-friendly Version
Interactive Discussion
Discussion
Paper
|D
iscussionP
aper|
Discussion
Paper
|D
iscussionP
aper|
Abstract
The soil nematode fauna can give important insights into soil development and otherhabitat changes that occur during primary succession. We investigated the genericcomposition, density, distribution and community structure of nematodes 50 years af-ter the formation of a pristine volcanic island, Surtsey, Iceland. Part of the island has5
received additional nutrient inputs from seagulls breeding there since 1985, while thereminder has been much less affected and is at present found at a different succes-sional sere. In total, 25 genera of nematodes were identified, of which 14 were re-ported on Surtsey for the first time. Nematode communities were more diverse in themore infertile area outside the gull colony, where 24 genera were found, compared to10
18 inside. The trophic structure of the nematode communities showed relatively higherabundance of fungal feeders in the infertile areas, but relatively more bacterial- andplant-feeders inside the colony. Nematode abundance in surface soil was, however,significantly higher within the gull colony, with 16.7 ind. cm−2 compared to 3.6 ind. cm−2
outside. A multivariate analysis indicated that the nematode abundance and distribu-15
tion on Surtsey were most strongly related to the soil C : N ratio, soil acidity, plant coverand biomass, soil temperature and soil depth.
1 Introduction
Soil invertebrates are a key group to study during the initial steps of colonization, pri-mary succession and soil formation in an ecosystem (Walker and del Moral, 2003). One20
of the most important groups of soil invertebrates are the soil nematodes. They playan important role in the processes of decomposition and mineralization and, thus, theycontribute notably to the nutrient turnover in the soil (Freckman, 1988; de Goede andBongers, 1994). In general, nematode communities are highly abundant in numbersand species. They occupy different feeding habits (trophic levels) and show different25
14240
BGD11, 14239–14267, 2014
Nematode diversity,abundance and
community structure
K. Ilieva-Makulec et al.
Title Page
Abstract Introduction
Conclusions References
Tables Figures
J I
J I
Back Close
Full Screen / Esc
Printer-friendly Version
Interactive Discussion
Discussion
Paper
|D
iscussionP
aper|
Discussion
Paper
|D
iscussionP
aper|
responses to the soil physical- (temperature, moisture, etc.), chemical- (acidity, etc.)and vegetation-characteristics (Yeates et al., 1993; de Goede and Bongers, 1994).
Nematode communities have been studied during the primary succession of differ-ent substrate types, including sand dunes (Wasilewska, 1970, 1979; de Goede et al.,1993; Wall et al., 2002), mined lands (Dunger et al., 2004), in front of retreating glaciers5
(Doblas-Miranda et al., 2008; Ilieva-Makulec and Gryziak, 2009) and on pristine vol-canic islands (Suatmadji et al., 1988). These studies have shown that the populationdensity, community and trophic structure of nematodes can provide valuable insightsinto the changes in the soil environment and soil development during primary succes-sion.10
The island of Surtsey was formed in a volcanic eruption south of Iceland between1963 and 1967. Since its formation, the island has been strictly protected for scientificresearch and for 50 years it has been visited annually by scientists interested in plantand faunal primary succession (Fridriksson, 1965, 1992; Frederiksen et al., 2001; Mag-nússon et al., 2014).15
Studies on nematodes in Surtsey are relatively scarce despite their importance toprimary succession, but still there are enough studies to coarsely follow how nema-tode communities have established on the island. The first report on nematodes fromSurtsey dates from 1970. The first species found there was the bacterial feeder Acro-beloides nanus, but until 1972 the only other nematodes obtained from soil samples20
from Surtsey belonged to the genus Ditylenchus (Holmberg and Pejler, 1972; Sohle-nius, 1972). The next study on the microfauna of the Surtsey soil was performed in1976 and the only nematodes reported belonged to the genus Monhystera (Hedin,1978). These results showed that the nematode colonization on Surtsey developedvery slowly during the first decade of the island’s formation.25
The rate of primary succession of vascular plants on a confined part of Surtsey wassignificantly enhanced in the late 1980s as a result of seagull nesting, which startedin 1985 (del Moral and Magnusson, 2014). Within the seagull colony, the level of soilnitrogen (N) increased, leading to higher vegetation cover and growth of several new
14241
BGD11, 14239–14267, 2014
Nematode diversity,abundance and
community structure
K. Ilieva-Makulec et al.
Title Page
Abstract Introduction
Conclusions References
Tables Figures
J I
J I
Back Close
Full Screen / Esc
Printer-friendly Version
Interactive Discussion
Discussion
Paper
|D
iscussionP
aper|
Discussion
Paper
|D
iscussionP
aper|
vascular plant species (Fridriksson, 1992). Enhanced organic matter (OM) inputs intothe soil within the colony led to enhanced soil development (Sigurdsson and Mag-nusson, 2010; Leblans et al., 2014) and increased the abundance of microorganisms(Frederiksen et al., 2000; Marteinsson et al., 2014), which are known to serve as foodfor bacterial- and fungal-feeding nematodes.5
In 1995, almost 20 years after the initial studies on nematodes in Surtsey, Frederik-sen et al. (2001) investigated the state of nematode succession. They reported 16nematode taxa and compared the abundance and taxon diversity in plots with differ-ent vegetation types. They also pointed out the role of seagull colonies on Surtsey asa factor which indirectly influenced nematode communities.10
The aim of our study was (i) to find out how abundant, diverse and complex ne-matode communities are 50 years after the formation of the island, (ii) to compare thenematode community parameters in permanent survey plots located within and outsidethe seagull colony; and (iii) to relate nematode community structure and abundance toenvironmental variables measured in the permanent study plots.15
2 Materials and methods
2.1 Sampling sites and environmental conditions
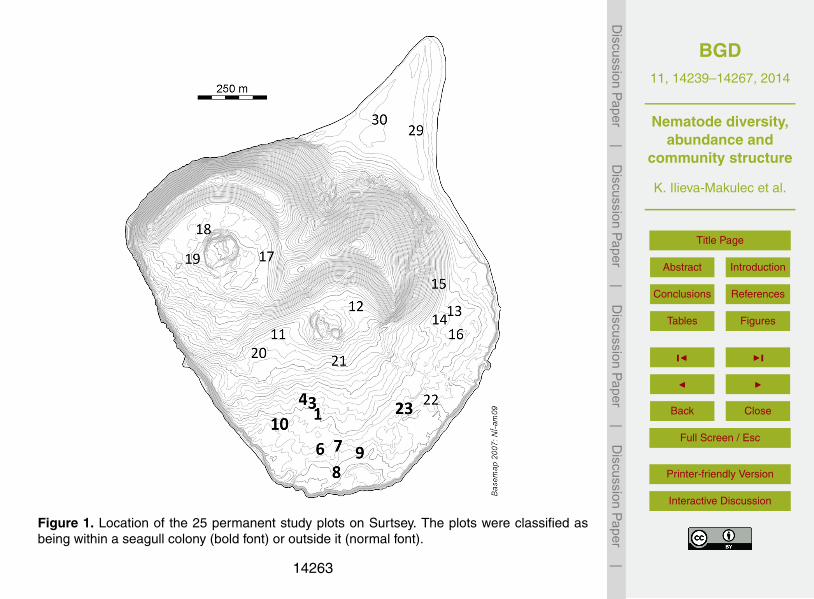
The sampling of nematodes in Surtsey took place on 20–21 July 2012, adjacent to eachof the 25 permanent sample plots which were distributed with respect to the substratetype and the influence of seagulls (Fig. 1). The average breeding density of seag-20
ulls within the colony was 3.7 pairs per 1000 m2, while it was zero outside the colony(Table 1). The seagulls have had a major impact on the soil development within theircolony; in 2008, the soil pH was 14 % lower and the soil carbon:nitrogen ratio (C : Nratio) was 70 % higher there than outside (Table 1; Sigurdsson and Magnusson, 2010).The average N addition rate within the seagull colony has been 47 kg N ha−1 y−1 since25
the seagull colonisation, while it has only been 0.7 kg N ha−1 y−1 outside the colony
14242
BGD11, 14239–14267, 2014
Nematode diversity,abundance and
community structure
K. Ilieva-Makulec et al.
Title Page
Abstract Introduction
Conclusions References
Tables Figures
J I
J I
Back Close
Full Screen / Esc
Printer-friendly Version
Interactive Discussion
Discussion
Paper
|D
iscussionP
aper|
Discussion
Paper
|D
iscussionP
aper|
(Leblans et al., 2014). This has greatly influenced the vegetation succession; the av-erage aboveground vascular plant biomass was ten times higher within the seagullcolony than in the plots outside it and vascular plant species composition has becomecompletely different (Table 1; Magnússon et al., 2014).
2.2 Further auxiliary measurements in 20125
Measurements of the ecosystem respiration and gross photosynthetic rate (Re andGPP, µmol CO2 m−2 s−1), the plant surface cover (%), the soil temperature (◦C) andvolumetric water content (%) were performed during the sample days in 2012 as de-scribed by Sigurdsson and Magnusson (2010) and Marteinsson et al. (2014). The sum-mer of 2012 was exceptionally dry in S-Iceland, and within the seagull colony the soil10
water content was 60 % lower than in the sparsely vegetated soils outside the colony(Table 1), and the Re and GPP values were lower than reported in earlier years (Sig-urdsson and Magnusson, 2010; Marteinsson et al., 2014).
2.3 Nematode sampling
Samples were collected according to the generally accepted procedures for nematode15
sampling. Two soil cores (labeled A and B) were taken adjacent to each of the 25 per-manent plots down to a depth of 20 cm. The cores were split into two layers: topsoil(0–10 cm) and subsoil (10–20 cm), where the soil depth allowed; i.e. 4 samples wereprocessed from each permanent plot. The samples were kept in a cooler until extractedby modified Baermann method (Flegg and Hooper, 1970), at the soil lab at Möðruvellir,20
N-Iceland. The extracted nematodes were preserved in 4 % formaldehyde and thenshipped to Poland where they were identified to genus level. In each sample, all ne-matodes were identified. Only in three samples, where more than 100 individuals werefound, a representative subsample of 100 nematodes was identified. For the nema-tode identification the keys of Andrássy (1976, 1981, 1983), Bongers (1988), Goodey25
14243
BGD11, 14239–14267, 2014
Nematode diversity,abundance and
community structure
K. Ilieva-Makulec et al.
Title Page
Abstract Introduction
Conclusions References
Tables Figures
J I
J I
Back Close
Full Screen / Esc
Printer-friendly Version
Interactive Discussion
Discussion
Paper
|D
iscussionP
aper|
Discussion
Paper
|D
iscussionP
aper|
(1963) and Maggenti et al. (1987) were used. Classification into trophic groups wasdone according to Yeates et al. (1993).
2.4 Data processing
In order to analyse the nematode communities, we chose the following parametersand indices: (i) total nematode abundance, (ii) the relative abundance of nematode5
trophic groups, (iii) generic richness, (iv) Shannon–Wiener index of diversity (South-wood, 1978); (v) the index of similarity according to Sørensen (Southwood et al.,2000); and (vi) Maturity index, an index based on nematode’s life history parametersand ecological requirements, which can be used in assessing the stage of nematodesuccession (Bongers, 1990). In addition, three functional indices of nematode commu-10
nities were calculated: (vii) Enrichment Index (EI), (viii) Structure Index (SI) and (ix)Channel Index (CI); (Ferris et al., 2001). EI takes into account the relative abundanceof bacterial- and fungal-feeding nematodes, which have short life cycles. When foodresources increase, these nematodes (especially bacterial feeders) respond quickly,reaching high population densities, albeit very often for a short period. Thus, high EI15
values indicate a resource-rich environment. SI takes into account nematodes withlonger life cycles and more stable population dynamics, which are located on highertrophic levels (omnivores and predators). CI indicates the predominant OM decompo-sition pathway in the soil (Ferris et al., 2001), i.e. whether it is dominated by fungi orbacteria.20
2.5 Statistical analyses
An analysis of variance (ANOVA) was applied to test the effect of plot type (inside andoutside the seagull colony) and soil layer (topsoil and subsoil) on nematode abundance(total and for trophic groups). The significance (P < 0.05) of the differences between themean values of the studied parameters was estimated with the non-parametric Mann–25
Whitney test (Sokal and Rohlf, 1981). Canonical correspondence analysis (CCA) was
14244
BGD11, 14239–14267, 2014
Nematode diversity,abundance and
community structure
K. Ilieva-Makulec et al.
Title Page
Abstract Introduction
Conclusions References
Tables Figures
J I
J I
Back Close
Full Screen / Esc
Printer-friendly Version
Interactive Discussion
Discussion
Paper
|D
iscussionP
aper|
Discussion
Paper
|D
iscussionP
aper|
performed to relate the generic composition and abundance of the nematode commu-nities to the soil physicochemical and vegetation characteristics of plots located insideand outside the gull colony (CANOCO programme (ter Braak, 1986). A Monte Carlopermutation test was applied to determine the significance of the first axis and for theoverall test.5
3 Results
3.1 Nematode density
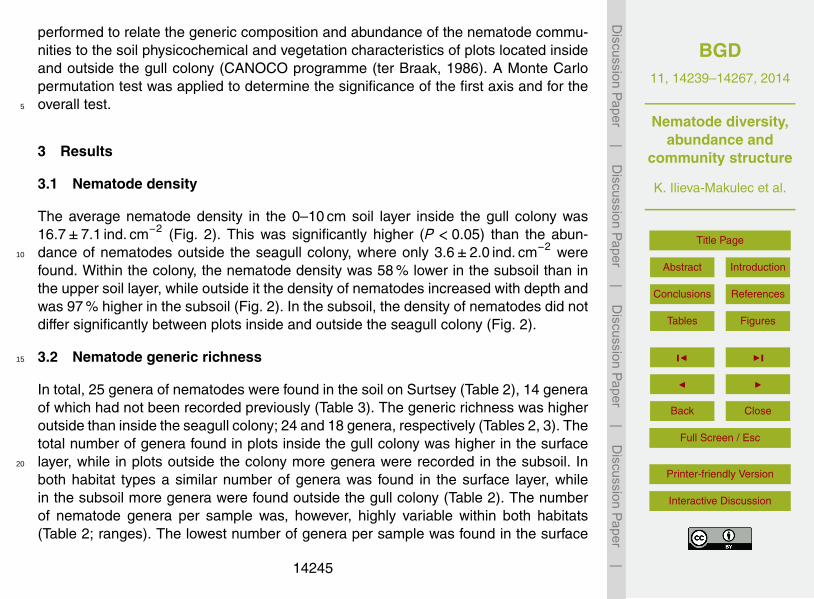
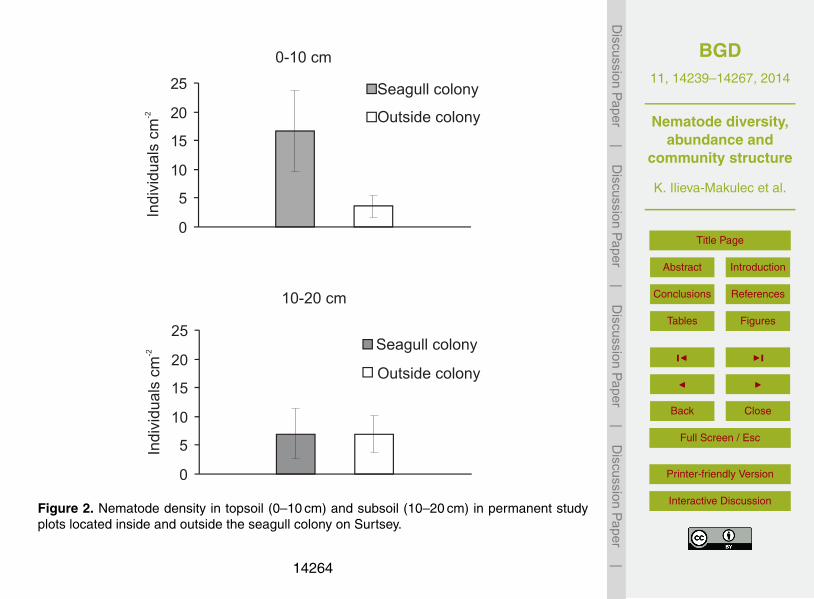
The average nematode density in the 0–10 cm soil layer inside the gull colony was16.7±7.1 ind. cm−2 (Fig. 2). This was significantly higher (P < 0.05) than the abun-dance of nematodes outside the seagull colony, where only 3.6±2.0 ind. cm−2 were10
found. Within the colony, the nematode density was 58 % lower in the subsoil than inthe upper soil layer, while outside it the density of nematodes increased with depth andwas 97 % higher in the subsoil (Fig. 2). In the subsoil, the density of nematodes did notdiffer significantly between plots inside and outside the seagull colony (Fig. 2).
3.2 Nematode generic richness15
In total, 25 genera of nematodes were found in the soil on Surtsey (Table 2), 14 generaof which had not been recorded previously (Table 3). The generic richness was higheroutside than inside the seagull colony; 24 and 18 genera, respectively (Tables 2, 3). Thetotal number of genera found in plots inside the gull colony was higher in the surfacelayer, while in plots outside the colony more genera were recorded in the subsoil. In20
both habitat types a similar number of genera was found in the surface layer, whilein the subsoil more genera were found outside the gull colony (Table 2). The numberof nematode genera per sample was, however, highly variable within both habitats(Table 2; ranges). The lowest number of genera per sample was found in the surface
14245
BGD11, 14239–14267, 2014
Nematode diversity,abundance and
community structure
K. Ilieva-Makulec et al.
Title Page
Abstract Introduction
Conclusions References
Tables Figures
J I
J I
Back Close
Full Screen / Esc
Printer-friendly Version
Interactive Discussion
Discussion
Paper
|D
iscussionP
aper|
Discussion
Paper
|D
iscussionP
aper|
layer in plots outside gull colonies, while the highest number was found in the subsoillayer in the same habitat.
3.3 Nematode diversity and dominance structure
Nematode generic diversity differed between the two habitats (Table 2). Shannon Diver-sity index H’ was both the highest (subsoil) and the lowest (topsoil) outside the seagull5
colony, while it was intermediate for both layers inside the seagull colony (Table 2). TheSørensen’s Index of similarity was lower within the seagull colony than outside, or 67 %compared to 74 %, respectively (Table 2). Moreover an index of similarity of 65 % wasfound between the two habitats, across both soil layers.
The frequency of occurrence was quite low for most nematode genera. Most oc-10
curred in less than 20 % of the samples (Table 3). Nematodes from the genera Ty-lenchorhynchus, Cephalobus, Anaplectus, and Panagrolaimus were among the mostfrequently recorded inside the colony (Table 3). The first two genera were also veryfrequent in the plots outside, where the genera Aphelenchoides and Acrobeloides alsooccurred with a high frequency (Table 3).15
The structure of dominance of nematode genera within the seagull colony, where nosubdominants were found, seemed sharper than in plots outside the colony (Table 3).Most abundant (eudominants) in the plots inside the gull colony were two bacterialfeeding genera Panagrolaimus and Rhabditis and one plant feeder Tylenchorhynchus,while in plots outside the eudominants were the bacterial feeder Cephalobus, the fungal20
feeder Aphelenchoides and the plant feeder Tylenchorhynchus (Table 3).
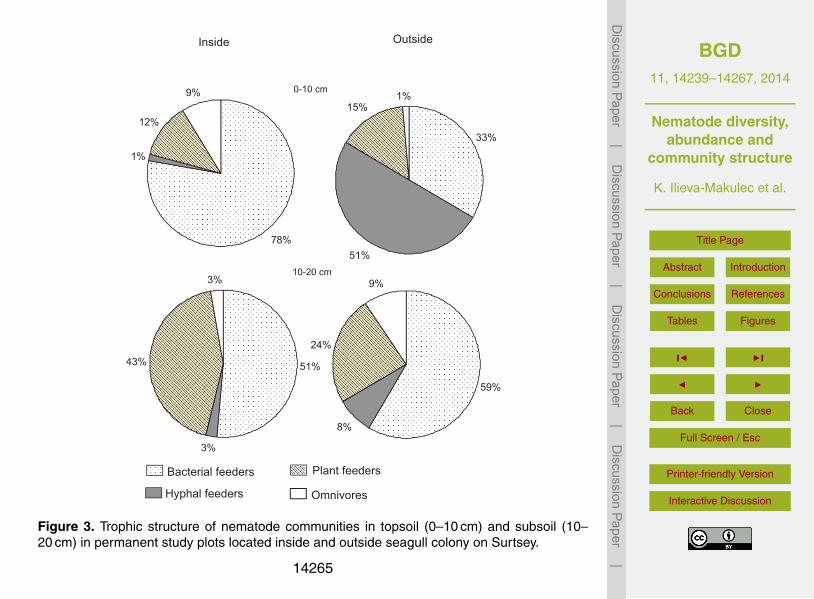
3.4 Nematode trophic structure
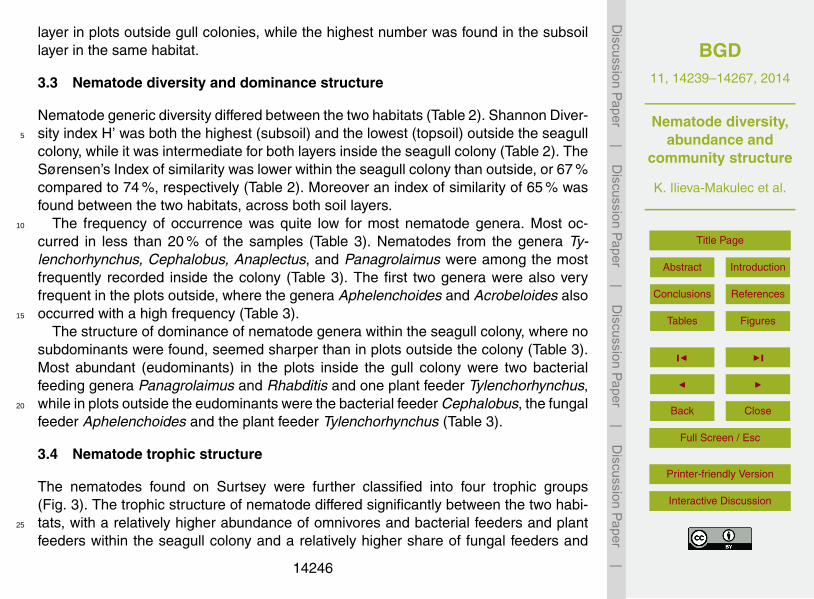
The nematodes found on Surtsey were further classified into four trophic groups(Fig. 3). The trophic structure of nematode differed significantly between the two habi-tats, with a relatively higher abundance of omnivores and bacterial feeders and plant25
feeders within the seagull colony and a relatively higher share of fungal feeders and
14246
BGD11, 14239–14267, 2014
Nematode diversity,abundance and
community structure
K. Ilieva-Makulec et al.
Title Page
Abstract Introduction
Conclusions References
Tables Figures
J I
J I
Back Close
Full Screen / Esc
Printer-friendly Version
Interactive Discussion
Discussion
Paper
|D
iscussionP
aper|
Discussion
Paper
|D
iscussionP
aper|
more omnivores outside the seagull colony (Fig. 3). The trophic structure also differeddistinctly between the two soil layers in both habitats; in the topsoil of the seagull colonythere were relatively more bacterial feeders and omnivorous nematodes, while in thesubsoil, more plant feeders occurred. In plots outside the gull colony an extremely highpercentage of fungal feeders was noted in the topsoil, while the abundance of bacterial5
feeders and omnivores increased relatively in the subsoil (Fig. 3; Table 3).
3.5 Nematode ecological indices
The mean values of the Maturity Index (MI) were quite low and similar for the twohabitats (around 2 for both; Table 2). MI was, however, more variable in plots withinthe gull colony, where it ranged between 1.1 (plots 1A, 7A) and 4.1 (plot 4A). Outside10
the gull colony, the MI was ca. 2.0 in most plots, but the lowest MI value (1.0) for theisland was found there in plot 29A and among the highest values (4.0) in plots 21A and31B. In both soil layers the Enrichment Index (EI) was higher within the seagull colony,while the Channel Index was distinctly higher outside the seagull colony (Table 2). TheStructure Index (SI) was significantly higher for the upper layer the within the seagull15
colony, while SI was higher in the subsoil in plots outside of the colony (Table 2).
3.6 Environmental factors and nematode abundance and distribution
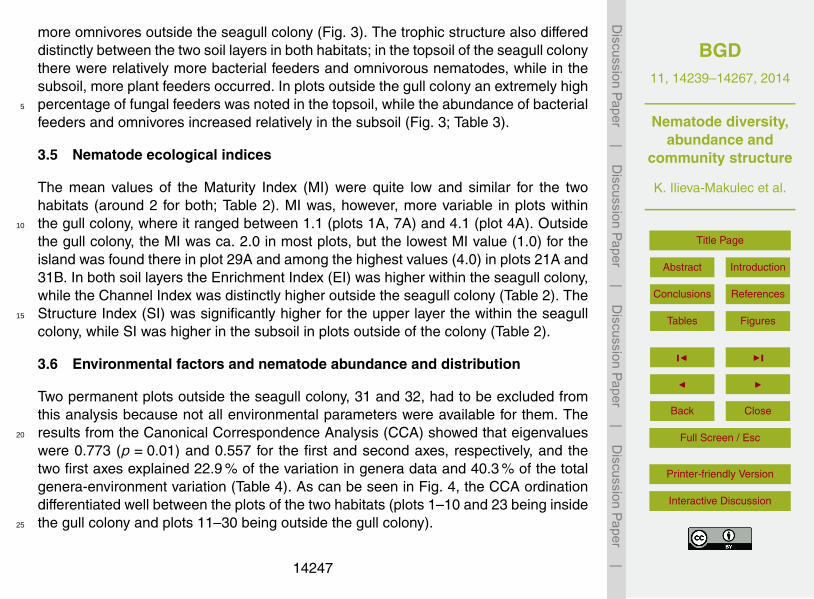
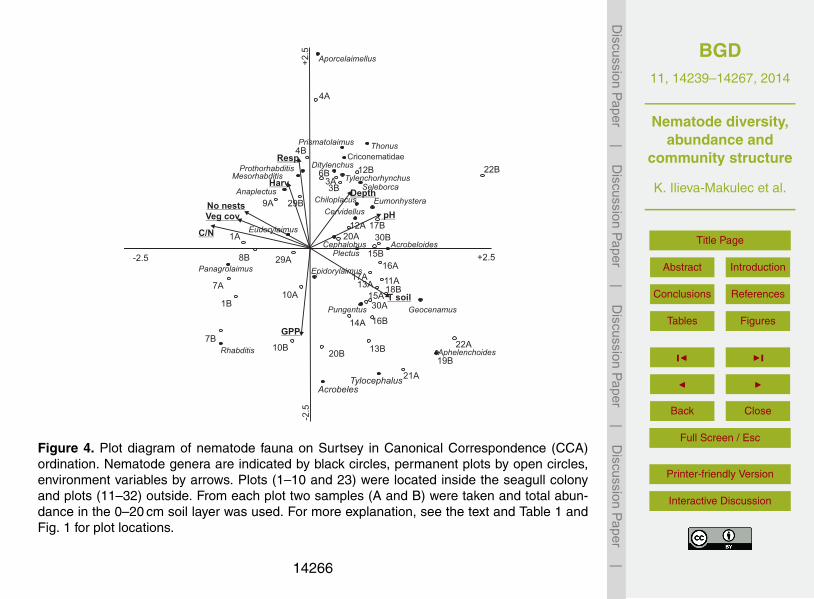
Two permanent plots outside the seagull colony, 31 and 32, had to be excluded fromthis analysis because not all environmental parameters were available for them. Theresults from the Canonical Correspondence Analysis (CCA) showed that eigenvalues20
were 0.773 (p = 0.01) and 0.557 for the first and second axes, respectively, and thetwo first axes explained 22.9 % of the variation in genera data and 40.3 % of the totalgenera-environment variation (Table 4). As can be seen in Fig. 4, the CCA ordinationdifferentiated well between the plots of the two habitats (plots 1–10 and 23 being insidethe gull colony and plots 11–30 being outside the gull colony).25
14247
BGD11, 14239–14267, 2014
Nematode diversity,abundance and
community structure
K. Ilieva-Makulec et al.
Title Page
Abstract Introduction
Conclusions References
Tables Figures
J I
J I
Back Close
Full Screen / Esc
Printer-friendly Version
Interactive Discussion
Discussion
Paper
|D
iscussionP
aper|
Discussion
Paper
|D
iscussionP
aper|
The position of genera which were not concentrated in the center of the diagram in-dicated relationships with the environmental variables (Fig. 4). The strongest relation-ships (p < 0.05) between the environmental variables and the abundance and distribu-tion of nematode genera to the 1st CCA axis were: (i) plant surface cover (F = 3.57;p = 0.01), (ii) aboveground plant biomass (F = 3.35; p = 0.01), (iii) soil pH (F = 2.46,5
p = 0.01), (iv) C : N ratio (F = 2.43, p = 0.01), (v) soil depth (F = 1.99, p = 0.02) andsoil temperature (F = 1.97, p = 0.05). Higher July soil temperatures and higher pHwere most strongly associated with the abundance and distribution of nematode gen-era outside the seagull colony, while higher C : N ratios, plant cover and biomass wereassociated with these variables within the colony. Higher soil (or loose mineral sub-10
strate) depth was, however, associated within nematode community assemblage onplots both inside and outside the seagull colony (e.g. plots 3, 12, 17 and 20), indicatingthat it was an important controlling factor for nematode community structure, irrespec-tive of vascular plant successional stage.
4 Discussion15
4.1 Nematode generic diversity
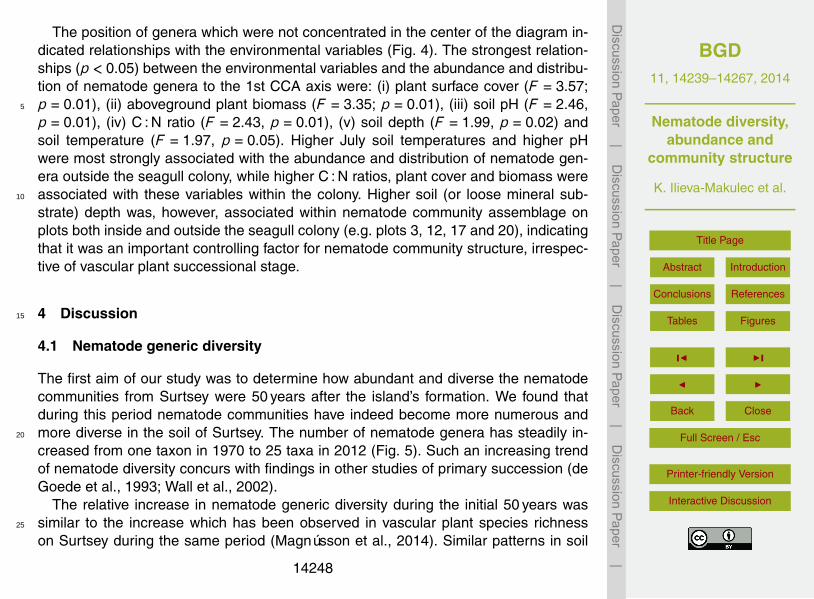
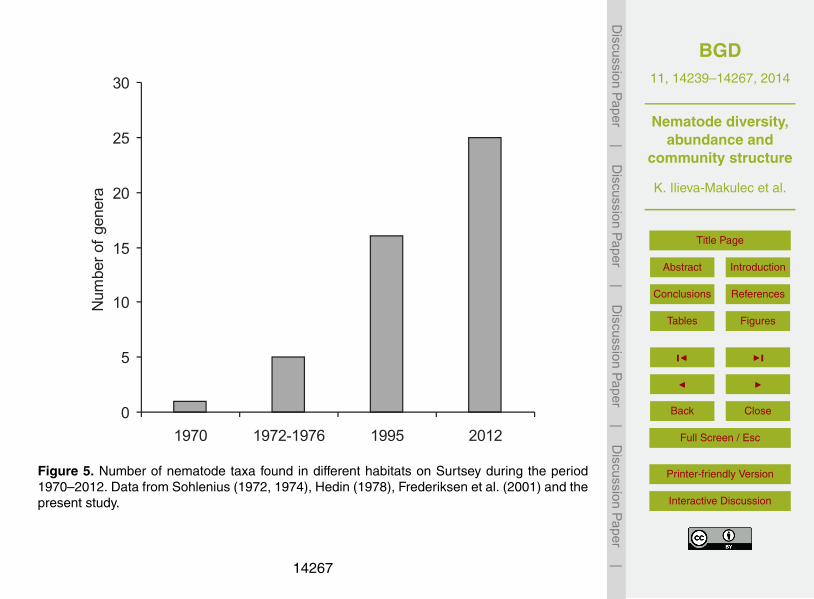
The first aim of our study was to determine how abundant and diverse the nematodecommunities from Surtsey were 50 years after the island’s formation. We found thatduring this period nematode communities have indeed become more numerous andmore diverse in the soil of Surtsey. The number of nematode genera has steadily in-20
creased from one taxon in 1970 to 25 taxa in 2012 (Fig. 5). Such an increasing trendof nematode diversity concurs with findings in other studies of primary succession (deGoede et al., 1993; Wall et al., 2002).
The relative increase in nematode generic diversity during the initial 50 years wassimilar to the increase which has been observed in vascular plant species richness25
on Surtsey during the same period (Magnússon et al., 2014). Similar patterns in soil
14248
BGD11, 14239–14267, 2014
Nematode diversity,abundance and
community structure
K. Ilieva-Makulec et al.
Title Page
Abstract Introduction
Conclusions References
Tables Figures
J I
J I
Back Close
Full Screen / Esc
Printer-friendly Version
Interactive Discussion
Discussion
Paper
|D
iscussionP
aper|
Discussion
Paper
|D
iscussionP
aper|
invertebrate communities and plant communities have been reported before, e.g. ina study on primary succession following glacial retreats (Doblas-Miranda et al., 2008).
The number of taxa and the abundance of nematodes we found on Surtsey is stilllow, and well below the normal lower ranges of species diversity (74 species) anddensity (0.6×10⁶ m−2) for nematodes in grasslands (Wasilewska, 1979). No compa-5
rable studies exist from mainland Iceland, but higher generic diversity and densitieshave generally been found in other high-latitude ecosystems (Kuzmin, 1976; Doblas-Miranda et al., 2008). We would, however, like to draw attention to a certain similaritybetween nematode primary succession on Surtsey and the course of nematode colo-nization following climate-induced glacial retreats of Antarctic glaciers (Ilieva-Makulec10
and Gryziak, 2009). There, only 16 genera of nematodes were found on the oldestsites, more than 50 years after glacier retreat.
Our results showed that even if the number of nematode taxa has increased, theirdistribution was still patchy and their abundance highly variable within the island. Therewere some samples where no nematodes were found and in this respect our data was15
in agreement with the earlier results of Frederiksen (2001) from Surtsey. It seems,therefore, that the development of nematode communities is still in its early phase.This is in sharp contrast to the findings of e.g. Wasilewska (1970), who found that ne-matode generic diversity can reach stable numbers after the first decade of primarysuccession of sand dunes in Poland. The values of the maturity index (MI) of the ne-20
matode community in both types of habitats (with and without influence of gulls) werelow and still similar to the values calculated for Surtsey by Frederiksen (2001) and alsoto values found in the 50 year old glacial retreat areas on Antarctica (Ilieva-Makulecand Gryziak, 2009). Such values of MI indicate a weak organisation and low maturityof nematode communities in Surtsey.25
4.2 The effect of the seagulls on nematode abundance and diversity
The nematode colonization on Surtsey accelerated significantly after the gulls estab-lished their colony on the island in 1985, as shown by Frederiksen et al. (2001). The
14249
BGD11, 14239–14267, 2014
Nematode diversity,abundance and
community structure
K. Ilieva-Makulec et al.
Title Page
Abstract Introduction
Conclusions References
Tables Figures
J I
J I
Back Close
Full Screen / Esc
Printer-friendly Version
Interactive Discussion
Discussion
Paper
|D
iscussionP
aper|
Discussion
Paper
|D
iscussionP
aper|
present study confirmed this finding. The nesting activity of the gulls, through enhancedseed dispersal, disturbance, and not least enhanced nutrient transport from sea to land,increased the habitat heterogeneity on the island. The seagulls increased significantlythe soil fertility and organic matter contents (Leblans et al., 2014), vegetation coverand biomass (Magnússon et al., 2014), soil bacteria (Marteinsson et al., 2014) and5
ecosystem respiration activity (Sigurdsson and Magnusson, 2010) of the area withinthe seagull colony. This habitat became suitable for new nematode colonization anddevelopment. Among the dominant nematode genera found there were Panagrolaimusand Rhabditis, both of which are enrichment opportunists according to Bongers (1999),with short life cycles and large food resource requirements. They were most strongly10
associated with those permanent plots which had the highest densities of gull nests, aswell as the highest plant biomass and soil C values. Sohlenius (1988) also found twospecies of Panagrolaumus in bird nest from Surtsey. Outside the seagull colony, nema-todes from Cephalobus and Acrobeloides dominated, but they are habitat generalistswith longer life cycles and lower food requirements (Bongers, 1999; Ilieva-Makulec,15
2001a, b).It is worth emphasizing that the nematode generic diversity within the seagull colony
has decreased to some extent when compared to the more infertile areas outside thecolony, even if the nematode abundance showed the opposite. A decrease in the tax-onomic diversity of nematodes with higher successional stage has been related to20
a retrogressive (decline) phase due to reduced nutrient availability over time (Doblas-Miranda et al., 2008). However, the nutrient availability on Surtsey was clearly muchhigher inside the seagull colony than outside it (Leblans et al., 2014). Such shifts in ne-matode taxonomic diversity have also been related to corresponding changes in plantdiversity (de Goede et al., 1993), but the plant diversity on Sutsey was also higher25
inside the gull colony than outside it (Magnússon et al., 2014). Therefore, it seemsplausible that the more abundant nematode populations within the seagull colony haveinduced competitive exclusion of some genera (Ettema, 1998).
14250
BGD11, 14239–14267, 2014
Nematode diversity,abundance and
community structure
K. Ilieva-Makulec et al.
Title Page
Abstract Introduction
Conclusions References
Tables Figures
J I
J I
Back Close
Full Screen / Esc
Printer-friendly Version
Interactive Discussion
Discussion
Paper
|D
iscussionP
aper|
Discussion
Paper
|D
iscussionP
aper|
We also found a strong relationship between the abundance of nematodes and theoccurrence of certain plant species. Outside the gull colony, the highest nematodedensity was noticed in plots where the plant species Honckenya pebloides dominated,while inside the colony more numerous nematodes populations were found in plotswhere Poa pratenses was present. The quality of the plant litter is likely to play an5
important role in the nematode plant preferences. According to the research of Ilieva-Makulec et al. (2006), nematode density and diversity are well correlated with the qual-ity of plant litter. In their study the highest density but the lowest nematode diversitywas found in litter with the lowest C : N ratio.
It appeared that Shannon Index of diversity, traditionally used to assess the commu-10
nity diversity, was not very helpful in the present study. This is most likely due to thefact that most nematode genera found in the soil of Surtsey were rare and in low densi-ties (subrecedents), which led to low sensitivity of the index. We found that multivariateanalysis (CANOCO) was better in relating the generic composition and abundance ofthe nematode communities to the soil and vegetation characteristics of plots located15
inside and outside the gull colony.We also found that food-web indices based on nematode faunal analysis (Ferris
et al., 2001) were a more appropriate tool than Shannon Index of diversity to assessand compare the conditions in the habitats within and outside the seagull colony. Thehigher values of EI within the gull colony indicated an environment rich in resources,20
which offered substrates of low C : N ratio where nematodes (mainly bacterial feedersfrom Rhabditis and Panagrolaimus) had responded with increase in their populationdensities. The values of CI indicated contrasting ways of organic matter decompositionin the two habitats. Across all gull-influenced plots the bacterial energy channel waspredominant over the fungal, while in all plots outside the colony the fungal channel25
predominated over the bacterial. The results of Marteinsson et al. (2014) on bacterialcounts in surface soils from inside and outside the seagull colony partly support thisfinding.
14251
BGD11, 14239–14267, 2014
Nematode diversity,abundance and
community structure
K. Ilieva-Makulec et al.
Title Page
Abstract Introduction
Conclusions References
Tables Figures
J I
J I
Back Close
Full Screen / Esc
Printer-friendly Version
Interactive Discussion
Discussion
Paper
|D
iscussionP
aper|
Discussion
Paper
|D
iscussionP
aper|
4.3 Comparison to Krakatau
It is interesting to compare the status of the nematode fauna on Surtsey after 50 yearswith the nematode diversity and trophic structure on the volcanic islands of Krakatauarchipelago, Indonesia, ca. 100 years after their formation (Suatmadji et al.,1988). Thehigher number of nematode genera on Krakatau (77) in comparison to Surtsey (25)5
could partly be the result of the longer duration of nematode succession there anda larger island size (cf. MacArthur and Wilson, 1967). Direct comparison betweenthese two locations is, however, difficult due to the differences in geographic, climatic,and edaphic factors, which are bound to impact the number of potential genera thatcould colonize. Nonetheless, it was noteworthy that most nematode genera found on10
Krakatao were microbivorous, mainly different genera of Cephalobidae, which were thepioneer colonizers there (Suatmadji et al., 1988). Similar predominance of the microbiv-orous Cephalobus and Acrobeloides genera was found in the infertile habitats outsidethe seabird colony on Surtsey. Dorylaimids (mainly omnivores) were found to be thesecond dominant group on Krakatao, while on Surtsey omnivores were less dominant.15
On Surtsey, on the other hand, we found two additional feeding groups that had a largeshare in the community; fungal feeders (mainly outside the colony) and plant feeders(in both habitats, but especially inside the gull colony). Hence, the foodweb structure ofthe nematode communities of Surtsey seemed to be more diverse than on Krakatao,even if the number of genera was lower there.20
4.4 Successional trends in the nematode community
Over the course of the 50 years since the island’s formation, the community trophicstructure of nematodes on Surtsey has become more complex. Initially only nema-todes feeding on bacteria and algae (bacterial feeders and omnivores) were recordedon the island (Sohlenius, 1972, 1974; Hedin, 1978; Frederiksen et al., 2001). In the25
present study a significant share of nematodes feeding on fungi (fungal feeders) andvascular plants were recorded. The absence of plant feeders in the earlier study of
14252
BGD11, 14239–14267, 2014
Nematode diversity,abundance and
community structure
K. Ilieva-Makulec et al.
Title Page
Abstract Introduction
Conclusions References
Tables Figures
J I
J I
Back Close
Full Screen / Esc
Printer-friendly Version
Interactive Discussion
Discussion
Paper
|D
iscussionP
aper|
Discussion
Paper
|D
iscussionP
aper|
Frederiksen et al. (2001), even within then recently established seagull colony, may bepartly explained by the fact that they only took samples from the upper 5 cm of soil, butthe plant feeders were more abundant in the subsoil in the present study. Nevertheless,there were clear trends for more complex soil food-webs had developed in the presentstudy, even in the sparsely vegetated areas outside the seagull colony (see later).5
When compared across the whole island, the changes in nematode trophic structurehave followed the vegetation succession. Within the seagull colony, the increased plantdiversity and biomass (Magnússon et al., 2014) has on the one hand increased thepool of potential hosts (root systems) for plant feeding nematodes (obligatory plantparasites) and on the other hand provided larger resources of dead OM for bacterial10
feeding nematodes. Outside the seagull colony, where less changes have occurredin aboveground plant cover and biomass (Magnússon et al., 2014), increased rootexploration (Stefansdottir et al., 2014) has clearly resulted in increasing populationsof soil fungi, which may serve as food for the fungal feeders there. In total, 33 soilfungal species have been recorded on Surtsey (Henriksson and Henriksson, 1974;15
Eyjolfsdottir, 2009), mostly based on fruitbody surveys. An interesting extension of thepresent work would be to further study the occurrence and growth of soil fungi onSurtsey, since it clearly plays an important role in the island’s food web, especially inthe more infertile areas.
We also found that the changes which had occurred at the lower trophic levels (the20
level of microbial feeders) were reflected at higher trophic levels. For example the twodominant nematode genera among omnivores showed different habitat preferenceson Surtsey. Nematodes from the genus Aporcelaimellus preferred topsoil within theseagull colony, while Eudorylaimus preferred subsoil of plots outside the colony. Thehigher relative abundance of Aporcelaimellus could be related to a high abundance25
of bacterial feeders there; which may have caused diet shift in Aporcelaimellus, andnematodes from this genus start behaving as predators (Bongers, 1999).
It is still an open question why until now no typical predators from Mononchida havebeen noticed on Surtsey. The presence of mononchids has, however, often been re-
14253
BGD11, 14239–14267, 2014
Nematode diversity,abundance and
community structure
K. Ilieva-Makulec et al.
Title Page
Abstract Introduction
Conclusions References
Tables Figures
J I
J I
Back Close
Full Screen / Esc
Printer-friendly Version
Interactive Discussion
Discussion
Paper
|D
iscussionP
aper|
Discussion
Paper
|D
iscussionP
aper|
lated to the occurrence of mosses (Suatmadji et al., 1988; Ilieva-Makulec and Gryziak,2009), but mosses are mostly confined to relatively small sheltered areas on Surtsey(Magnússon et al., 2014).
5 Conclusions
The present study showed that even if only minor changes have been observed in5
vegetation composition and cover during the past two decades in the infertile areasoutside the gull colony, the soil nematode communities have continued to change andthe number of taxa to increase, probably indicating gradual changes in the soil envi-ronment. Within the seagull colony, where vegetation succession and soil developmenthas been greatly accelerated, the nematode communities have increased in population10
density and now show more complex foodwebs, but still they have become less diversewith fewer taxa than found outside. This finding was rather unexpected, partly becauseof the low Maturity Index values obtained in both habitats. It will therefore be inter-esting to follow the nematode succession further into the future; on one hand it mayseem likely that the number of nematode taxa may start to decrease when the infertile15
Leymus-Honckenya plant community will gradually change into more fertile grasslands,but on the other hand more time may still be needed for nematode taxa from highertrophic levels to reach the island, which may reverse the declining diversity trend seenat present in the more fertile areas.
Acknowledgements. The Surtsey Research Society, Icelandic Institute of Natural History and20
the Icelandic Coastguard provided logistical support for the present study. Anette Th. Meiermade the elevation map of the island and Bjarni E. Gudleifsson helped with extraction of soilnematodes. This work contributes to the COST-ClimMani project and was initiated during theESF-ClimMani project.
14254
BGD11, 14239–14267, 2014
Nematode diversity,abundance and
community structure
K. Ilieva-Makulec et al.
Title Page
Abstract Introduction
Conclusions References
Tables Figures
J I
J I
Back Close
Full Screen / Esc
Printer-friendly Version
Interactive Discussion
Discussion
Paper
|D
iscussionP
aper|
Discussion
Paper
|D
iscussionP
aper|
References
Andrássy, I.: Evolution as a Basis for the Systematization of Nematodes, Pitman, London,1976.
Andrássy, I.: Revision of the order Monhysterida (Nematoda) inhabiting soil and inland waters,Opusc. Zool. Bp., 17–18, 13–47, 1981.5
Andrássy, I.: A taxonomic review of the suborder Rhabditina (Nematoda: Secernentea), EotvosLorand University, Budapest, 1983.
Bongers, T.: De nematoden van Nederland (The nematodes of the Netherlands), Stichting Uit-geverij Koninklijke Nederlandse Natuurhistorische Vereniging, Utrecht, 1988.
Bongers, T.: The maturity index: an ecological measure of environmental disturbance based on10
nematode species composition, Oecologia, 83, 14–19, 1990.Bongers, T.: The maturity index, the evlution of nematode life history traits, adaptive radiation
and cp-scaling, Plant Soil, 212, 13–22, 1999.de Goede, R. G. M. and Bongers, T.: Nematode community structure in relation to soil and
vegetation characteristics, Appl. Soil Ecol., 1, 29–44, doi:10.1016/0929-1393(94)90021-3,15
1994.de Goede, R. G. M., Verschoor, B. C., and Georgieva, S. S.: Nematode distribution, trophic
structure and biomass in a primary succession of blown-out areas in a drift sand landscape,Fundam. Appl. Nemalol., 16, 525–538, 1993.
del Moral, R. and Magnússon, B.: Surtsey and Mount St. Helens: a comparison of early suc-20
cession rates, Biogeosciences, 11, 2099–2111, doi:10.5194/bg-11-2099-2014, 2014.Doblas-Miranda, E., Wardle, D. A., Peltzer, D. A., and Yeates, G. W.: Changes in the community
structure and diversity of soil invertebrates across the Franz Josef Glacier chronosequence,Soil Biol. Biochem., 40, 1069–1081, doi:10.1016/j.soilbio.2007.11.026, 2008.
Dunger, W., Schulz, H.-J., Zimdars, B., and Hohberg, K.: Changes in collembolan species com-25
position in Eastern German mine sites over fifty years of primary succession, Pedobiologia,48, 503–517, doi:10.1016/j.pedobi.2004.07.005, 2004.
Ettema, C., H.: Soil nematode diversity: species coexistence and ecosystem function, J. Ne-matol., 30, 159–169, 1998.
Eyjolfsdottir, G. G.: Investigation of the funga of Surtsey 2008, Surtsey Res., 12, 105–111,30
2009.
14255
BGD11, 14239–14267, 2014
Nematode diversity,abundance and
community structure
K. Ilieva-Makulec et al.
Title Page
Abstract Introduction
Conclusions References
Tables Figures
J I
J I
Back Close
Full Screen / Esc
Printer-friendly Version
Interactive Discussion
Discussion
Paper
|D
iscussionP
aper|
Discussion
Paper
|D
iscussionP
aper|
Ferris, H., Bongers, T., and de Goede, R. G. M.: A framework for soil food web diag-nostics: extension of the nematode faunal analysis concept, Appl. Soil Ecol., 18, 13–29,doi:10.1016/S0929-1393(01)00152-4, 2001.
Flegg, J. J. M. and Hooper, D. J.: Laboratory methods for work with plant soil nematodes, in:Technical Bulletin of Ministry of Agriculture, Fisheries and Food, edited by: Southey, J. P.,5
London, 2, 5–23, 1970.Freckman, D. W.: Bacterivorous nematodes and organic-matter decomposition, Agr. Ecosyst.
Environ., 24, 195–217, 1988.Frederiksen, H. B., Pedersen, A. L., and Christensen, S.: Substrate induced respiration and
microbial growth in soil during the primary succession on Surtsey, Iceland, Surtsey Res.10
Prog. Rep., 11, 29–35, 2000.Frederiksen, H. B., Kraglund, H.-O., and Ekelund, F.: Microfaunal primary succession on the
volcanic island of Surtsey, Iceland, Polar Res., 20, 61–73, 2001.Fridriksson, S.: Biological records on Surtsey, Surtsey Res. Prog. Rep., 1, 19–22, 1965.Fridriksson, S.: Vascular plants on Surtsey 1981–1990, Surtsey Res. Prog. Rep., 10, 17–30,15
1992.Goodey, T.: Soil and Freshwater Nematodes, John Wiley and Sons, New York, 1963.Hedin, H.: On the terrestrial microfauna of Surtsey during the summer of 1976 with special
reference to the Ciliates, Surtsey Res. Prog. Rep., 8, 47–50, 1978.Henriksson, L. E. and Henriksson, E.: Occurrence of fungi on the volcanic island of Surtsey,20
Iceland, Act. Bot. Isl., 3, 82–88, 1974.Holmberg, O. and Pejler, B.: On the terrestrial microfauna of Surtsey during the summer 1970,
Surtsey Res. Prog. Rep., 6, 69–72, 1972.Ilieva-Makulec, K.: A comparative study of the life strategies of two bacterial-feeding nematodes
under laboratory conditions I. Influence of culture conditions on selected life-history param-25
eters of Acrobeloides nanus (de Man 1880) Anderson 1968 and Dolichorhabditis dolichura(Schneider 1866) Andrássy 1983, Pol. J. Ecol., 49, 29–43, 2001a.
Ilieva-Makulec, K.: A comparative study of the life strategies of two bacterial-feeding nematodesunder laboratory conditions II. Influence of the initial food level on the population dynamics ofAcrobeloides nanus (de Man 1880) Anderson 1968 and Dolichorhabditis dolichura (Schnei-30
der 1866) Andrrássy 1983, Pol. J. Ecol., 49, 123–135, 2001b.Ilieva-Makulec, K. and Gryziak, G.: Response of soil nematodes to climate-induced melting of
Antarctic glaciers, Pol. J. Ecol., 57, 811–816, 2009.
14256
BGD11, 14239–14267, 2014
Nematode diversity,abundance and
community structure
K. Ilieva-Makulec et al.
Title Page
Abstract Introduction
Conclusions References
Tables Figures
J I
J I
Back Close
Full Screen / Esc
Printer-friendly Version
Interactive Discussion
Discussion
Paper
|D
iscussionP
aper|
Discussion
Paper
|D
iscussionP
aper|
Ilieva-Makulec, K., Olejniczak, I., and Szanser, M.: Response of soil micro- andmesofauna to diversity and quality of plant litter, Eur. J. Soil Biol., 42, 244–249,doi:10.1016/j.ejsobi.2006.07.030, 2006.
Kuzmin, L. L.: Free-living nematodes in the tundra of western Taimyr, Oikos, 27, 501–505,1976.5
Leblans, N. I. W., Sigurdsson, B. D., Roefs, P., Thuys, R., Magnússon, B., and Janssens, I. A.:Effects of seabird nitrogen input on biomass and carbon accumulation after 50 years ofprimary succession on a young volcanic island, Surtsey, Biogeosciences Discuss., 11, 6269–6302, doi:10.5194/bgd-11-6269-2014, 2014.
Maggenti, A. R., Luc, M., Raski, D. J., Fortuner, R., and Geraert, E.: A reappraisal of Tylenchina10
(Nemata). 2. Classification of the suborder Tylenchina (Nemata: Diplogasteria), Rev. Néma-tol., 10, 135–142, 1987
Magnússon, B., Magnússon, S. H., Ólafsson, E., and Sigurdsson, B. D.: Plant colonization,succession and ecosystem development on Surtsey with reference to neighbouring islands,Biogeosciences Discuss., 11, 9379–9420, doi:10.5194/bgd-11-9379-2014, 2014.15
Marteinsson, V., Klonowski, A., Reynisson, E., Vannier, P., Sigurdsson, B. D., and Ólafsson,M.: Microbial colonisation in diverse surface soil types in Surtsey and diversity analysis ofits subsurface microbiota, Biogeosciences Discuss., 11, 13775–13808, doi:10.5194/bgd-11-13775-2014, 2014.
MacArthur, W. and Wilson, O. E.: The Theory of Island Biogeography, Princeton University20
Press, ISBN: 0-691-08836-5, 1967.Sigurdsson, B. D. and Magnusson, B.: Effects of seagulls on ecosystem respiration, soil nitro-
gen and vegetation cover on a pristine volcanic island, Surtsey, Iceland, Biogeosciences, 7,883–891, doi:10.5194/bg-7-883-2010, 2010.
Sohlenius, B.: Nematodes from Surtsey, Surtsey Res. Prog. Rep., 6, 97–98, 1972.25
Sohlenius, B.: Nematodes from Surtsey II, Surtsey Res. Prog. Rep., 7, 35, 1974.Sohlenius, B.: Interactions between two species of Panagrolaimus in agar cultures, Nemato-
logica, 34, 208–217, 1988.Sokal, R. R. and Rohlf, F. J.: Biometry, W. H. Freeman and Company, San Francisco, 1981.Southwood, T. R. E.: Ecological Methods, Chapman and Hall, London, 1978.30
Southwood, T. R. E. and Henderson, P. A.: Ecological Methods, Blackwell Science Ltd, London,2000.
14257
BGD11, 14239–14267, 2014
Nematode diversity,abundance and
community structure
K. Ilieva-Makulec et al.
Title Page
Abstract Introduction
Conclusions References
Tables Figures
J I
J I
Back Close
Full Screen / Esc
Printer-friendly Version
Interactive Discussion
Discussion
Paper
|D
iscussionP
aper|
Discussion
Paper
|D
iscussionP
aper|
Stefansdottir, G., Aradottir, A. L., and Sigurdsson, B. D.: Accumulation of nitrogen and organicmatter during primary succession of Leymus arenarius dunes on the volcanic island Surtsey,Iceland, Biogeosciences Discuss., 11, 6591–6613, doi:10.5194/bgd-11-6591-2014, 2014.
Suatmadji, R. W., Coomans, A., Rashid, F., Geraert, E., and Mclaren, D.: Nematodes of theKrakatau archipelago, Indonesia: a preliminary overview, Philos. T. R. Soc. Lon. B, 322,5
369–37, 1988ter Braak, C. J. F.: Unimodel Models to Relate Species to Environment, DLO Agricultural Math-
ematics Group, Wageningen, the Netherlands, 1986.Wall, J. W., Skene, K. R., and Neilson, R.: Nematode community and trophic structure along
a sand dune succession, Biol. Fert. Soils, 35, 293–301, doi:10.1007/s00374-002-0478-0,10
2002.Walker, L. R. and del Moral, R.: Primary Succession and Ecosystem Rehabilitation, Cambridge
University Press, Cambridge, UK, 2003.Wasilewska, L.: Nematodes of the sand dunes in the Kampinos Forest. I. Species structure,
Ekologia Polska, 18, 429–443, 1970.15
Wasilewska, L.: The structure and function of soil nematode communities in natural ecosystemsand agrocenoses, Pol. Ecol. Studies, 5, 97–145, 1979.
Yeates, G. W., Bongers, T., de Goede, R. G. M., Freckman, D. W., and Georgieva, S. S.: Feedinghabits in soil nematode families and genera-an outline for soil ecologists, J. Nematol., 25,315–331, 1993.20
14258
BGD11, 14239–14267, 2014
Nematode diversity,abundance and
community structure
K. Ilieva-Makulec et al.
Title Page
Abstract Introduction
Conclusions References
Tables Figures
J I
J I
Back Close
Full Screen / Esc
Printer-friendly Version
Interactive Discussion
Discussion
Paper
|D
iscussionP
aper|
Discussion
Paper
|D
iscussionP
aper|
Table 1. Characteristics (mean values± s.e.) of permanent plots inside and outside the gullcolony in Surtsey 2012. Data modified from different sources (see footnotes).
Characteristic Inside Outside
Soil depth (cm)a 19.8±3.9 49.1±7.1Ecosystem respiration (Re; µmol m−2 s−1)b 0.6±0.2 0.2±0.04Gross Photosynthesis (GPP; µmol m−2 s−1)b −0.4±0.1 −0.3±0.1Soil volumetric water content (0–5 cm; %)b 0.9±0.2 2.3±0.3Soil temperature (0–10 cm; ◦C)b 19.2±0.5 25±0.5Plant surface cover (%)b 88.6±2.6 13.3±3.1Aboveground biomass (g m−2)c 311.6±60.8 31.3±10.0Breeding density (nests 1000 m−2)c 3.7±0.6 0pH (2008)c 7.09±0.1 8.24±0.1C : N ratio (2008)d 11.7±0.5 6.88±0.5Dominant plant speciesc
(year of first colonization in the brackets)Poa pratensis (1975), Festucarichardsonii (1973), Leymus ari-narius (1966), Honkenia pe-bloides (1967), Rumex longi-folius (1996), Puccinelia distans(1972) Empetrum nigrum (1993)
Honkenia pebloides (1967), Ley-mus arinarius (1966), Armeriauniflora (1986), Sagina procum-bens (1986)
a Leblans et al. (2014)b cf. Marteinsson et al. (2014)c Magnússon et al. (2014)d Sigurdsson and Magnusson (2010)
14259
BGD11, 14239–14267, 2014
Nematode diversity,abundance and
community structure
K. Ilieva-Makulec et al.
Title Page
Abstract Introduction
Conclusions References
Tables Figures
J I
J I
Back Close
Full Screen / Esc
Printer-friendly Version
Interactive Discussion
Discussion
Paper
|D
iscussionP
aper|
Discussion
Paper
|D
iscussionP
aper|
Table 2. Diversity, similarity and functional indices (mean values±SE) of nematode communi-ties inside and outside of seagull colony in the permanent study plots in Surtsey in 2012.
Parameter Inside Outside0–10 cm 10–20 cm 0–10 cm 10–20 cm
Number of genera per sample 4 (0–6) 4 (0–7) 2 (0–3) 5 (0–10)Total number of genera 16 11 15 23Shannon Diversity index H’ 0.85±0.2 0.85±0.1 0.45±0.1 1.44±0.2Sørensen’s Index of similarity (%)a 67 74Maturity Index (MI)b 2.28±0.3 1.8±0.4 2.11±0.2 1.9±0.2Enrichment Index (%)c 48.3±13.3 59.5±22.3 33.8±8.5 54.2±11.6Structure Index (%)c 49.8±11.7 26.3±17.9 10.4±7.1 35.4±9.6Channel Index (%)c 45.7±17.2 1.5±1.5 60±16.3 31.4±14.9
a According to Southwood et al. (2000).b According to Bongers (1990).c Accoding to Ferris et al. (2001).
14260

BGD11, 14239–14267, 2014
Nematode diversity,abundance and
community structure
K. Ilieva-Makulec et al.
Title Page
Abstract Introduction
Conclusions References
Tables Figures
J I
J I
Back Close
Full Screen / Esc
Printer-friendly Version
Interactive Discussion
Discussion
Paper
|D
iscussionP
aper|
Discussion
Paper
|D
iscussionP
aper|
Table 3. Nematode generic composition adjacent to the permanent study plots in Surtsey in2012. The frequency (% of samples in which each genus occurred), dominant status, relativeoccurrence in topsoil (0–10 cm), feeding habits (trophic group) and c-p value of each genusoccurring in samples outside (32 samples) and inside (16 samples) the seagull colony.
Genus Outside the colony Inside the colony Trophic c-pFreq. Domin.a Top soil Freq. Domin. Top soil group valueb
Originally found before this studyAcrobeloides 31 % D 26 % 6 % SR 0 % Bacterial feeder 2Mesorhabditis 3 % SR 100 % 0 − − Bacterial feeder 1Rhabditis 16 % SD 31 % 19 % ED 96 % Bacterial feeder 1Panagrolaimus 16 % D 33 % 38 % ED 90 % Bacterial feeder 1Prothorhabditis 13 % D 27 % 0 − − Bacterial feeder 1Plectus 13 % SD 47 % 6 % SR 0 % Bacterial feeder 2Eumonhystera 3 % SR 0 % 6 % SR 100 % Bacterial feeder 1Prismatolaimus 3 % SR 0 % 13 % SR 100 % Bacterial feeder 3Ditylenchus 3 % SR 0 % 19 % R 67 % Hyphal feeder 2Aporcelaimellus 3 % SR 0 % 25 % D 98 % Omniv./Predator 5Aphelenchoides 34 % ED 85 % 19 % SR 100 % Hyphal feeder 2
New genera, both outside and inside seagull colony:Anaplectus 13 % SD 17 % 56 % D 82 % Bacterial feeder 2Cephalobus 47 % ED 35 % 44 % D 96 % Bacterial feeder 2Chiloplacus 13 % R 83 % 13 % R 75 % Bacterial feeder 2Seleborca 6 % R 0 % 6 % SR 100 % Bacterial feeder 2Epidorylaimus 6 % SR 50 % 13 % SR 100 % Omnivorous 4Eudorylaimus 16 % SD 5 % 31 % R 86 % Omnivorous 4Geocenamus 22 % SD 46 % 6 % SR 100 % Plant feeder 3Tylenchorhynchus 38 % ED 30 % 50 % ED 62 % Plant feeder 3
New genera, found either outside or inside colony:Pungentus 9 % SR 35 % 0 − − Omnivorous 4Acrobeles 3 % SR 0 % 0 − − Bacterial feeder 2Cervidellus 3 % SR 0 % 0 − − Bacterial feeder 2Tylocephalus 3 % SR 0 % 0 − − Bacterial feeder 2Thonus 3 % SR 0 % 0 − − Omnivorous 4Criconematidae 0 − − 6 % SR 100 % Plant feeder 3
a Dominance classes (Domin.): relative abundance < 1= subrecedent (SR); 1.1–2= recedent (R); 2.1–5= subdominant (SD);5.1–10=dominant (D); > 10.1=eudominant (ED).b According to Bongers (1990).
14261

BGD11, 14239–14267, 2014
Nematode diversity,abundance and
community structure
K. Ilieva-Makulec et al.
Title Page
Abstract Introduction
Conclusions References
Tables Figures
J I
J I
Back Close
Full Screen / Esc
Printer-friendly Version
Interactive Discussion
Discussion
Paper
|D
iscussionP
aper|
Discussion
Paper
|D
iscussionP
aper|
Table 4. The results of Canonical Correspondence analysis (CCA) on nematode abundanceand distribution in relation to environmental characteristics of the permanent surveyed plots onSurtsey. For more information see Table 1.
Axes 1 2 3 4
Eigenvalues 0.773 0.557 0.469 0.335Species-environment correlations 0.980 0.951 0.915 0.925Cumulative percentage variance:of species dataof species–environment relation
12.822.6
22.940.3
31.455.4
37.566.3
Sum of all unconstrained eigenvalues 5.511Sum of all canonical eigenvalues 3.112
Summary of Monte Carlo test:test of significance of first canonical axis
F ratio=2.92, P =0.01
overall test F ratio=1.3, P =0.01
14262
BGD11, 14239–14267, 2014
Nematode diversity,abundance and
community structure
K. Ilieva-Makulec et al.
Title Page
Abstract Introduction
Conclusions References
Tables Figures
J I
J I
Back Close
Full Screen / Esc
Printer-friendly Version
Interactive Discussion
Discussion
Paper
|D
iscussionP
aper|
Discussion
Paper
|D
iscussionP
aper|
Figure 1. Location of the 25 permanent study plots on Surtsey. The plots were classified asbeing within a seagull colony (bold font) or outside it (normal font).
14263
BGD11, 14239–14267, 2014
Nematode diversity,abundance and
community structure
K. Ilieva-Makulec et al.
Title Page
Abstract Introduction
Conclusions References
Tables Figures
J I
J I
Back Close
Full Screen / Esc
Printer-friendly Version
Interactive Discussion
Discussion
Paper
|D
iscussionP
aper|
Discussion
Paper
|D
iscussionP
aper|
0
5
10
15
20
25
Indiv
iduals
cm
-2
Seagull colony
Outside colony
0
5
10
15
20
25
Indiv
iduals
cm
-2
Seagull colony
Outside colony
0-10 cm
10-20 cm
Figure 2. Nematode density in topsoil (0–10 cm) and subsoil (10–20 cm) in permanent studyplots located inside and outside the seagull colony on Surtsey.
14264
BGD11, 14239–14267, 2014
Nematode diversity,abundance and
community structure
K. Ilieva-Makulec et al.
Title Page
Abstract Introduction
Conclusions References
Tables Figures
J I
J I
Back Close
Full Screen / Esc
Printer-friendly Version
Interactive Discussion
Discussion
Paper
|D
iscussionP
aper|
Discussion
Paper
|D
iscussionP
aper|
Inside Outside
0-10 cm
10-20 cm
Bacterial feeders
Hyphal feeders
Plant feeders
Omnivores
78%
1%
12%
9%
33%
51%
15%1%
51%
3%
43%
3%
59%
8%
24%
9%
Figure 3. Trophic structure of nematode communities in topsoil (0–10 cm) and subsoil (10–20 cm) in permanent study plots located inside and outside seagull colony on Surtsey.
14265
BGD11, 14239–14267, 2014
Nematode diversity,abundance and
community structure
K. Ilieva-Makulec et al.
Title Page
Abstract Introduction
Conclusions References
Tables Figures
J I
J I
Back Close
Full Screen / Esc
Printer-friendly Version
Interactive Discussion
Discussion
Paper
|D
iscussionP
aper|
Discussion
Paper
|D
iscussionP
aper|
1A
1B
3A3B
4A
4B
6B
7A
7B
8B
9A
10A
10B
11A
12A
12B
13A
13B
14A
15A
15B
16A
16B
17A
17B
18B
19B
20A
20B
21A
22A
22B
29A
29B
30A
30B
+2.5-2.5
-2.5
Panagrolaimus
Eudorylaimus
ProthorhabditisMesorhabditis
Anaplectus
Rhabditis
ThonusPrismatolaimus
Criconematidae
SeleborcaTylenchorhynchus
Eumonhystera
Cervidellus
CephalobusPlectus
Acrobeloides
Epidorylaimus
Pungentus Geocenamus
AcrobelesTylocephalus
Aporcelaimellus
Ditylenchus
Chiloplacus
Aphelenchoides
+2
.5
GPP
T soil
Resp
C/N
pHVeg covNo nests
HarvDepth
Figure 4. Plot diagram of nematode fauna on Surtsey in Canonical Correspondence (CCA)ordination. Nematode genera are indicated by black circles, permanent plots by open circles,environment variables by arrows. Plots (1–10 and 23) were located inside the seagull colonyand plots (11–32) outside. From each plot two samples (A and B) were taken and total abun-dance in the 0–20 cm soil layer was used. For more explanation, see the text and Table 1 andFig. 1 for plot locations.
14266
BGD11, 14239–14267, 2014
Nematode diversity,abundance and
community structure
K. Ilieva-Makulec et al.
Title Page
Abstract Introduction
Conclusions References
Tables Figures
J I
J I
Back Close
Full Screen / Esc
Printer-friendly Version
Interactive Discussion
Discussion
Paper
|D
iscussionP
aper|
Discussion
Paper
|D
iscussionP
aper|
0
5
10
15
20
25
30
1970 1972-1976 1995 2012
Num
ber
of
genera
Figure 5. Number of nematode taxa found in different habitats on Surtsey during the period1970–2012. Data from Sohlenius (1972, 1974), Hedin (1978), Frederiksen et al. (2001) and thepresent study.
14267