Embed Size (px)
Citation preview

1
Nematode Diversity in Central
Massachusetts
A Major Qualifying Project Report:
Submitted to the Faculty
of the
WORCESTER POLYTECHNIC INSTITUTE
in partial fulfillment of the requirements for the
Degree of Bachelor of Science
By
Laura Aurilio BB ‘13
Advisors:
Professor Jagan Srinivasan, Biology and Biotechnology
Professor Michael Buckholt, Biology and Biotechnology
2
Table of Contents
LIST OF FIGURES .............................................................................................................................................. 4
LIST OF TABLES................................................................................................................................................ 5
ABSTRACT .......................................................................................................................................................... 6
1. INTRODUCTION ........................................................................................................................................ 7
2. BACKGROUND .......................................................................................................................................... 9
2.1 WHAT ARE NEMATODES? ................................................................................................................................... 9
2.1.1 C. elegans as a Model System ................................................................................................................ 10
2.2 BIODIVERSITY AND ENVIRONMENTAL HEALTH ....................................................................................................... 11
2.3 THE REGION OF CENTRAL MASSACHUSETTS ......................................................................................................... 12
2.4 SPECIES IDENTIFICATION .......................................................................................................................................... 13
3. METHODS ..................................................................................................................................................... 15
3.1 SOIL SAMPLING ...................................................................................................................................................... 15
3.1.1 Choosing Locations .................................................................................................................................... 15
3.1.2 Soil Collection ............................................................................................................................................. 15
3.2 NEMATODE EXTRACTION ......................................................................................................................................... 16
3.2.1 Simple Plating ............................................................................................................................................ 16
3.2.2 Baermann Funnel ....................................................................................................................................... 17
3.3 SOIL CONDITIONS ................................................................................................................................................... 18
3.3.1 pH Testing .................................................................................................................................................. 18
3.3.2 Other Location Conditions .......................................................................................................................... 19
3.4 WORM ANALYSIS ................................................................................................................................................... 20
3.4.1 Worm DNA Isolation .................................................................................................................................. 20
3.4.2 Choosing a molecular marker .................................................................................................................... 20
3.4.3 PCR Reaction to amplify SSU markers ........................................................................................................ 21
3.4.4 Worm DNA Sequencing .............................................................................................................................. 21
3.5 PRESERVING WORMS FOR FUTURE USE ...................................................................................................................... 22
3.5.1 Freezing and Storing .................................................................................................................................. 22
3.5.2 Catalog Naming ......................................................................................................................................... 23
4. RESULTS AND DISCUSSION ...................................................................................................................... 24
4.1 GEOGRAPHICAL LOCATIONS ...................................................................................................................................... 24
4.2 NEMATODE EXTRACTION DATA ................................................................................................................................. 27
4.2.1 Simple Plating Extraction ........................................................................................................................... 27
4.2.2 Baermann Funnel Extraction ...................................................................................................................... 29
4.2.3 Comparing Extraction Methods ................................................................................................................. 29
4.3 SOIL PH CONDITIONS .............................................................................................................................................. 31
4.4 SMALL SUBUNIT RNA AS A MOLECULAR MARKER ........................................................................................................ 33
4.5 DNA SEQUENCE ANALYSIS ....................................................................................................................................... 34
4.6 FROZEN STRAINS .................................................................................................................................................... 35
5. CONCLUSION ............................................................................................................................................... 36
3
APPENDICES......................................................................................................................................................... 39
APPENDIX A: SOIL SAMPLE PROTOCOL ............................................................................................................................. 39
APPENDIX B: BAERMANN FUNNEL PROTOCOL ................................................................................................................... 40
APPENDIX C: CATALOG OF SAMPLE NAMING CHART ........................................................................................................... 41
APPENDIX D: BAERMANN FUNNEL EXTRACTION DATA ......................................................................................................... 43
APPENDIX E: SOIL PH DATA ........................................................................................................................................... 47
APPENDIX F: SIMPLE PLATING EXTRACTION DATA .............................................................................................................. 51
APPENDIX G: HOPEDALE SAMPLE #1 DNA SEQUENCE ........................................................................................................ 54
APPENDIX H: HOPEDALE SAMPLE #2 DNA SEQUENCE ........................................................................................................ 55
APPENDIX I: HOPEDALE SAMPLE #3 DNA SEQUENCE .......................................................................................................... 56
APPENDIX J: HOPEDALE SAMPLE #4 DNA SEQUENCE ......................................................................................................... 57
APPENDIX K: HOPEDALE SAMPLE #5 DNA SEQUENCE......................................................................................................... 59
APPENDIX L: FINAL FROZEN WORM STRAIN INFORMATION .................................................................................................. 61
ACKNOWLEDGEMENTS ........................................................................................................................................ 62
REFERENCES ......................................................................................................................................................... 63

4
List of Figures Figure 1: C. elegans on an Agar Plate (Simon Fraser University, 2008) ..................................... 10
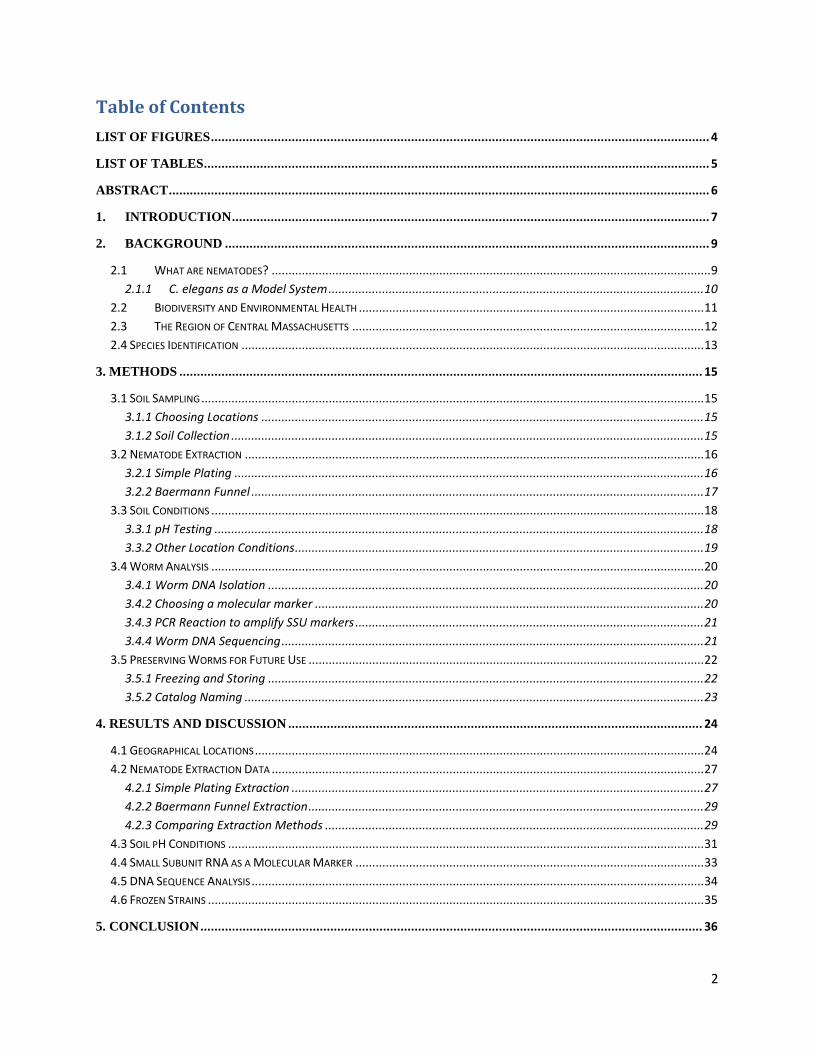
Figure 2: Map of Worcester County (Ajemian & Gamble, 2013) ................................................ 13
Figure 4: Figure 8 Sampling Example .......................................................................................... 15
Figure 3: Soil Sample Collection Tubes ....................................................................................... 15
Figure 5: Simple Soil Plating ........................................................................................................ 16
Figure 6: Baermann Funnel Set-Up .............................................................................................. 17
Figure 7: Example Results of Soil pH Test with pH Strips .......................................................... 19
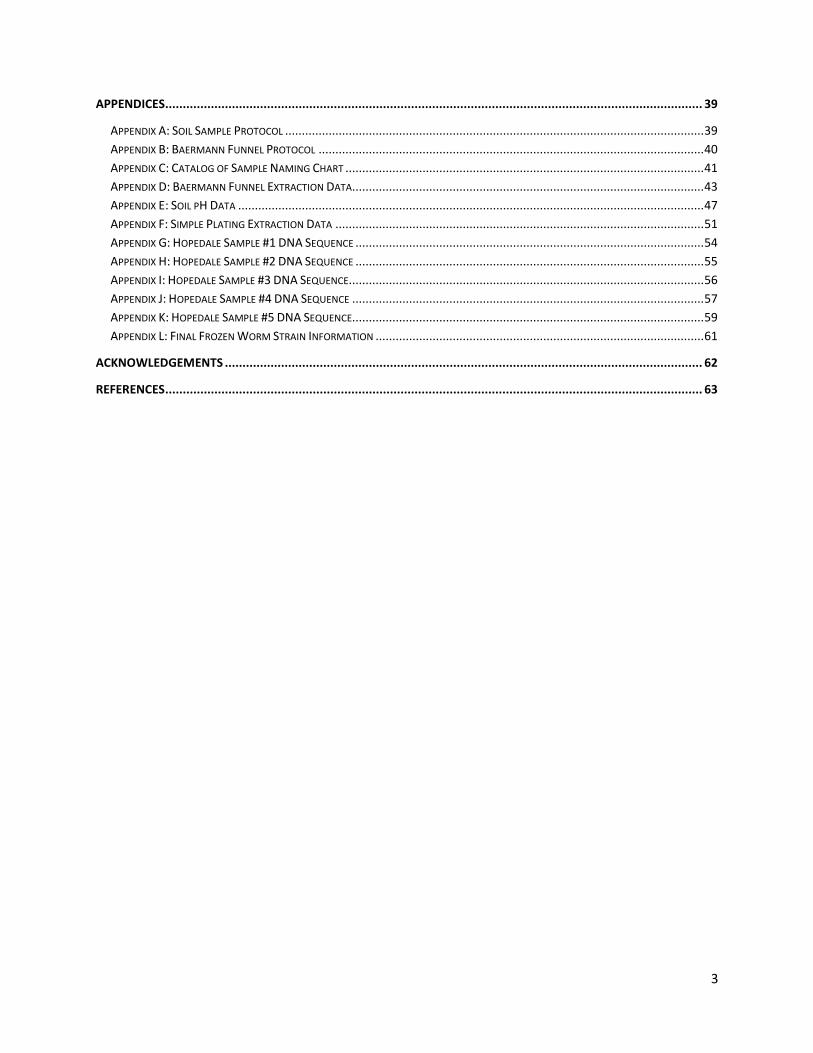
Figure 8: Towns Sampled in Worcester County Highlighted in Yellow (Ajemian & Gamble,
2013) ............................................................................................................................................. 24
Figure 9: Number of Worms Found Through Simple Plating Extraction .................................... 27
Figure 10: Average Number of Worms Found Per Region through Simple Plating .................... 28
Figure 11: Total Number of Worms Found Per Region through Simple Plating ......................... 28
Figure 12: Comparison of Nematode Isolation Success between Simple Plating and the
Baermann Funnel Methods ........................................................................................................... 29
Figure 13: Total Number of Worms Found Per Day of Observation through Simple Plating ..... 30
Figure 15: Average pH of Soil Selected for Sampling per Location ............................................ 31
Figure 14: Average pH of Soil Selected for Sampling per Location ............................................ 31

5
List of Tables Table 1: Sample Collection Information....................................................................................... 26
Table 2: Species Identified Through NCBI Website .................................................................... 34

6
Abstract Soil nematodes can be found in a wide variety of natural habitats and environmental
conditions. The presence of these animals, while not regularly recognized, has a huge impact on
the area’s ecology as far as soil turnover and nutrient availability (Yeates, 2003). Knowing what
specific types of nematodes can be found in defined areas can help to assess factors such as
environmental health (Yeates, 2003). While gamma and beta-diversity (biodiversity between
ecosystems) of nematodes has been assessed in the past, little attention has been paid to small
scale nematode biodiversity, also known as alpha-diversity. This project, through two different
extraction methods, examines the alpha-diversity of nematodes in the Central Massachusetts
region of New England, where no nematode-specific biodiversity studies have been done before.
Nematodes were isolated from seventeen towns within the Central Massachusetts region, from
five separate sub-regions. It was found that nematodes could, in fact, be isolated from each of the
seventeen towns through one or both isolation methods, but abundance of nematodes and time to
isolate the nematodes varied from location to location. Environmental factors from isolation sites
were also noted. The most attention was given to soil pH conditions for each town. It was found
that there is a certain pH range most optimal for nematode isolation falling within 4.51-5.00.
After isolation, PCR was completed on single worms to amplify the DNA using the Small
Subunit rRNA molecular marker (SSU). Sequencing was then done on the amplified nematode
DNA samples from Hopedale and two Pristionchus species were found: P. marianneae and P.
pauli.
7
1. Introduction There are many things that can be predicted about an ecosystem based upon what species
are found in that specific environment. Because of the biological, biochemical and chemical
complexity of soils, they are often great indicators of the health status of the environment. Soils
also hold a larger picture of the species found in the area because the biodiversity below ground
is much larger than the biodiversity above the surface of the soil (Boag & Yeates, 1998).
Of the organisms found in soil, nematodes are one of the most important because of their
contributions to the functions of the ecosystem. Nematodes are very a diverse group of
organisms and can be found in abundance in most ecosystems (Yeates, 2003). On average, 40%
of nutrient mineralization is due to nematode presence because of enhanced nutrient release by
excretion and the maintenance of bacterial populations by way of bacterial-feeding nematodes
(Yeates, 2003).
In the past, it has been the general assumption that the greater the number of nematodes
present the better the soil and environmental health, but there is now evidence that the specific
species of nematodes present plays an even larger role than number of nematodes present
(Yeates, 2003). By collecting soil samples and analyzing both quantities and types of nematodes
found in the samples, a general environmental health prediction can be made about the area
sampled.
To date, little attention has been paid to smaller-region analyses of nematode abundance in
soils, with the focus generally being on larger scale ecosystems and areas. Efforts have been
given to gamma-diversity studies (regional analyses) rather than alpha-diversity (species richness
solely determined within-area, not than between-area) (Boag & Yeates, 1998). By sampling soil
from various cities and towns all across Central Massachusetts, a better understanding of both
nematode biodiversity across our region and the environmental health of our region can be
8
assessed. This allows for many things such as future conservation efforts and a larger-scale
understanding of how our particular environment varies even within a small area.
In this project, wild-type nematodes were isolated from soil samples collected by hand from
the Central Massachusetts region through two different methods: simple soil plating and the
Baermann funnel. By isolating nematodes, their genotype can be analyzed allowing for alpha-
diversity to be evaluated. Environmental factors such as elevation and soil pH were documented
as well to see any correlation between them and nematode presence. By knowing which specific
nematodes are present in the Central Massachusetts region, environmental health estimates can
be made. Reliability and success of the two isolation methods were compared and assessed as
well. It is predicted that nematodes can be isolated from all samples collected, but quantity and
type of nematode will vary slightly from location to location.
9
2. Background
2.1 What are nematodes? Nematodes are small, colorless, roundworms that can be found in a varying array of
environments and conditions. These worms are not like regular earthworms as they are un-
segmented and require a microscope to be observed (Univeristy of California, 2013). Nematodes,
commonly called roundworms, have a wide array of roles in our world, both harmful and helpful.
While the majority of nematodes are harmless there are several that are considered predaceous or
parasitic. These worms are usually found in third world countries or environments that are
considered unclean (Hotez, Brindley, Bethony, King, Pearce, & Jacobson, 2008). Climate and
topography as well as the lack of sanitary measures result in the high frequency of these parasites
in the countries considered to be third world (mostly tropical countries) (Hotez, Brindley,
Bethony, King, Pearce, & Jacobson, 2008) They are not something that people in the United
States have to worry about, because of our sanitary practices and cooler climate. The United
States is considered only an area where transmission of these worms is possible and not a public
health problem (Klinkenberg, 2013).
For the purposes of this project, soil nematodes are the focus. These are worms that can be
commonly found in soil and are harmless to humans. They are either bacterial feeders, fungal
feeders, or are predatory to small organisms like protozoa (Ingham, 2013). These worms play a
huge role in our ecosystem not only because they are so diverse and plentiful, but because of
their nutrient cycling, microbe dispersal, ability to be natural biological insecticides and their
role as a food sources themselves (Ingham, 2013). They are often creatures that are not thought
about, yet have a very strong tie to humans. This is the case not only in environmental
circumstances but as far as human health and research goes as well.

10
2.1.1 C. elegans as a Model System
One of the most important soil nematode species is Caenorhabditis elegans or C. elegans.
This nematode, seen in Figure 1, plays a very important role in our scientific research process
and methods. It is a great genetic research model for things such as drug discovery, animal
behavior analyses, disease, and genetics. It was first used in the 1960s by Sydney Brenner in a
laboratory at Cambridge in England as a model organism to study embryonic development
(Simon Fraser University, 2008).
The use of C. elegans as a research model has both scientific and economic benefits. Because
it is so easy to find, easy to cultivate and inexpensive to both obtain and maintain it is an
economical model organism to
study. Scientifically speaking,
its physical properties allow for
successful research. This
organism is very small and yet
still multicellular. It has a very
simple anatomy that is easy to
understand. Not only is it easy
to understand but since the
animal is transparent we can physically see what is going on internally at all times. Its short life
cycle and quick reproductive rates also allow for mass production and fast experimental results.
The most interesting and perhaps beneficial feature of C. elegans is that its genome is
surprisingly similar to that of humans. It is 40% homologous to the human genome making it an
excellent model for understanding human genes and diseases (Laboratory for Optical and
Figure 1: C. elegans on an Agar Plate (Simon Fraser University, 2008)
11
Computational Instrumentation, 2013). Not only are these human homolog gene present, but
approximately 75% of human disease genes have genes that are potentially related by a common
ancestral DNA sequence in C. elegans (Hodgkin, 2013). This is a large percentage, which makes
this worm a favorite to study in the laboratory.
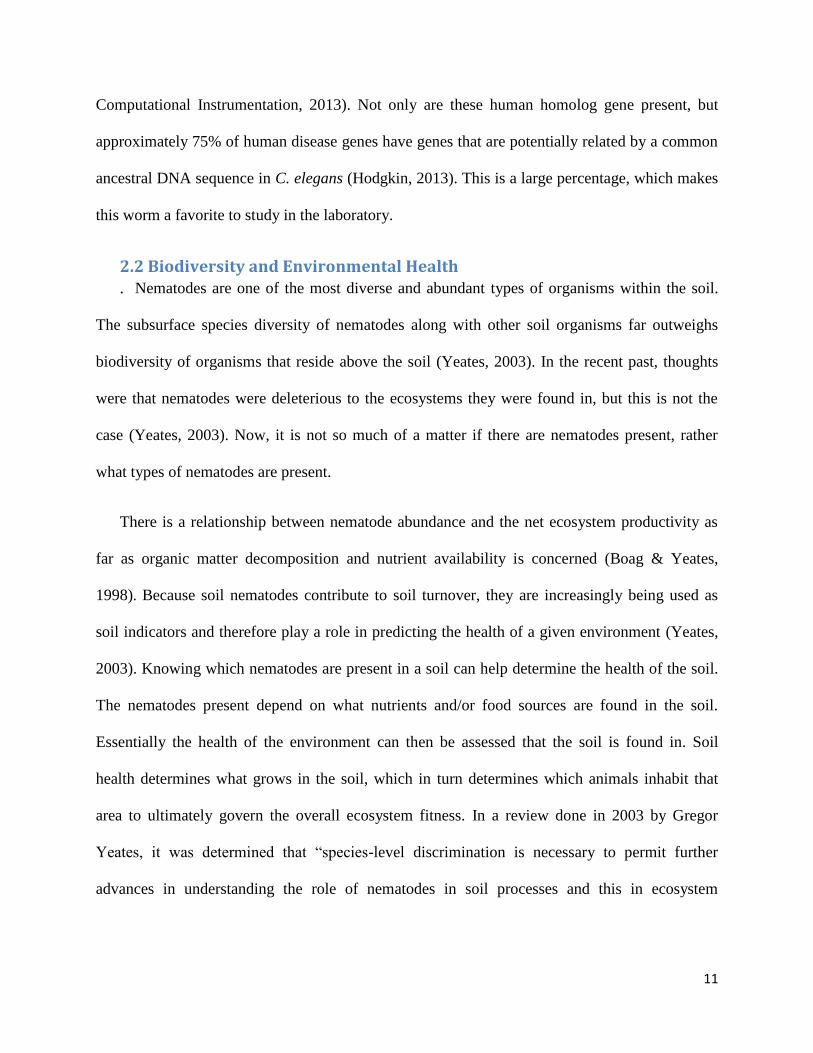
2.2 Biodiversity and Environmental Health . Nematodes are one of the most diverse and abundant types of organisms within the soil.
The subsurface species diversity of nematodes along with other soil organisms far outweighs
biodiversity of organisms that reside above the soil (Yeates, 2003). In the recent past, thoughts
were that nematodes were deleterious to the ecosystems they were found in, but this is not the
case (Yeates, 2003). Now, it is not so much of a matter if there are nematodes present, rather
what types of nematodes are present.
There is a relationship between nematode abundance and the net ecosystem productivity as
far as organic matter decomposition and nutrient availability is concerned (Boag & Yeates,
1998). Because soil nematodes contribute to soil turnover, they are increasingly being used as
soil indicators and therefore play a role in predicting the health of a given environment (Yeates,
2003). Knowing which nematodes are present in a soil can help determine the health of the soil.
The nematodes present depend on what nutrients and/or food sources are found in the soil.
Essentially the health of the environment can then be assessed that the soil is found in. Soil
health determines what grows in the soil, which in turn determines which animals inhabit that
area to ultimately govern the overall ecosystem fitness. In a review done in 2003 by Gregor
Yeates, it was determined that “species-level discrimination is necessary to permit further
advances in understanding the role of nematodes in soil processes and this in ecosystem
12
resilience”. This means that in order to better understand the part nematodes play in our
ecosystems we need to first know which nematodes are actually present in that ecosystem.
Previous nematode biodiversity research has been focused on gamma or beta-diversity.
Gamma-diversity focuses on large-scale, “overall diversity for different ecosystems” within a
specific area (Harrison, Laverty, & Sterling, 2004). Beta diversity centers on the change in
species between ecosystems (Harrison, Laverty, & Sterling, 2004). Not a lot of attention has
been given to the alpha-diversity, which is simply put as “species richness” within a defined
region (Harrison, Laverty, & Sterling, 2004). In a review done by Brian Boag and Gregor Yeates
in 1998, there was research done on nematode inhabitants and species richness in relationship to
distance their from the equator. It was found that there was contradicting evidence that nematode
diversity increases as latitude increases. This is a great example of the large-scale biodiversity
focus of the recent past.
Despite that fact that there is an increasing amount of data on abundance of soil
nematodes, it is still not a simple task to evaluate their importance in soil processes and
environmental health (Sohlenius, 1980). This current project helps to fill this gap in biodiversity
research by conducting alpha-diversity research in the region of Central Massachusetts.
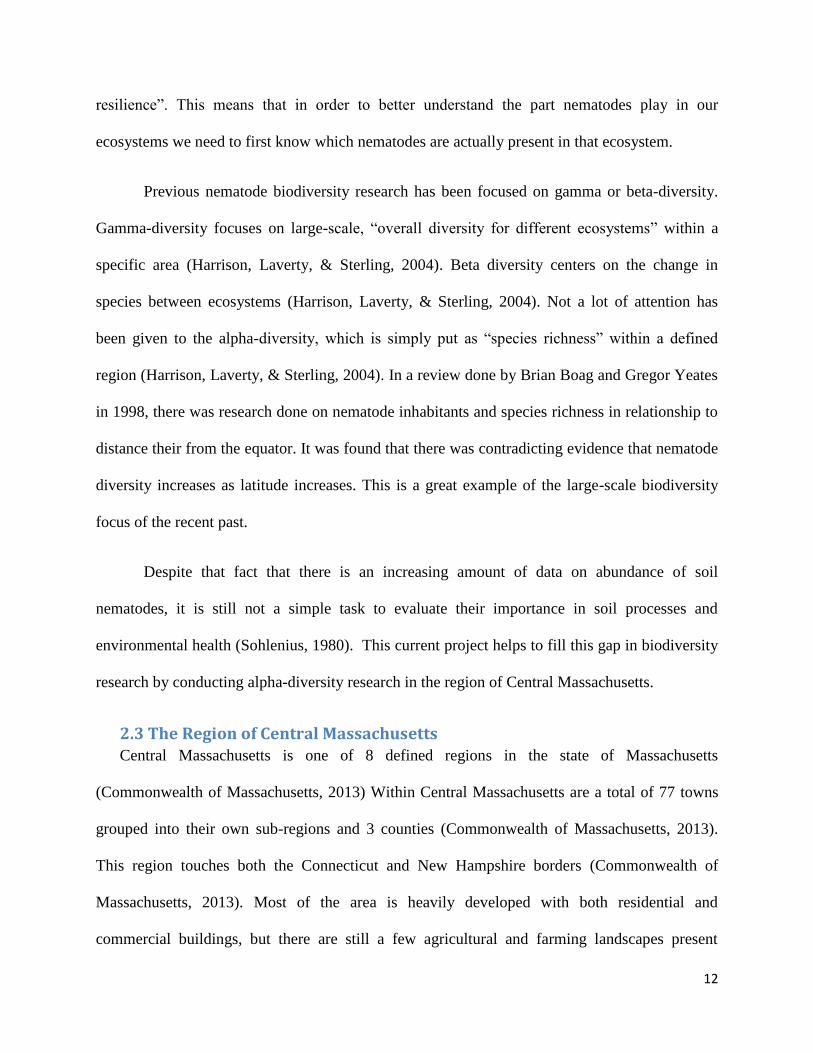
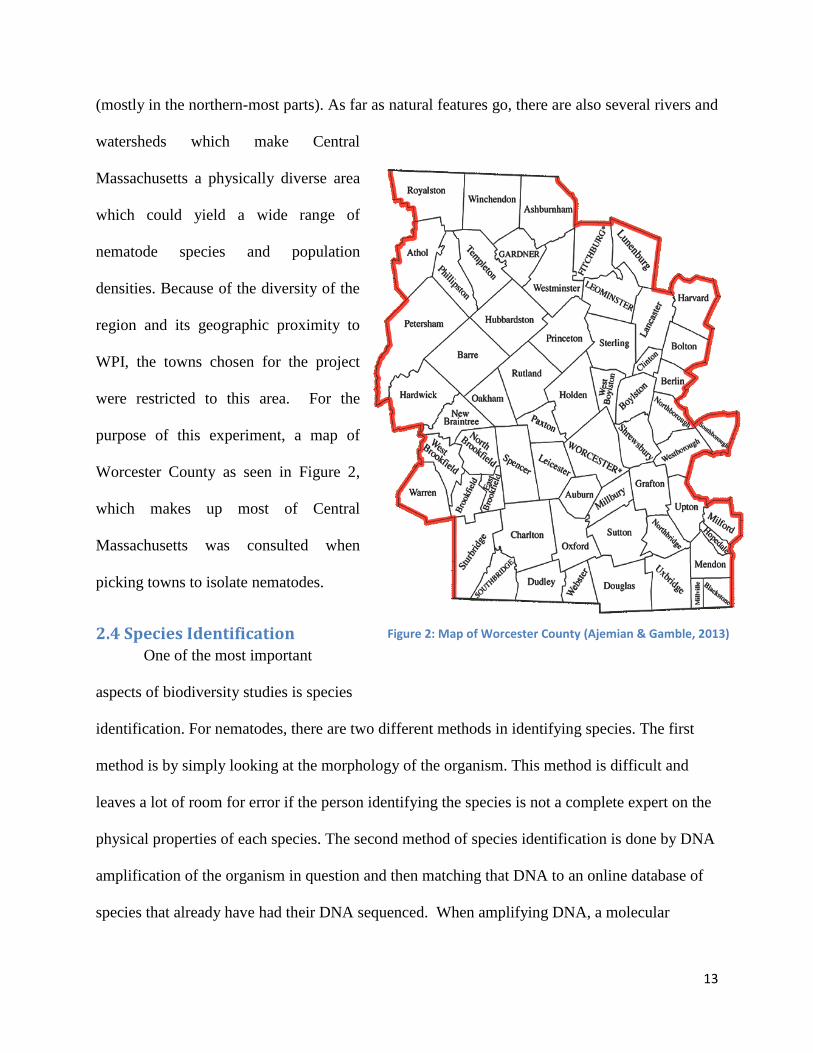
2.3 The Region of Central Massachusetts Central Massachusetts is one of 8 defined regions in the state of Massachusetts
(Commonwealth of Massachusetts, 2013) Within Central Massachusetts are a total of 77 towns
grouped into their own sub-regions and 3 counties (Commonwealth of Massachusetts, 2013).
This region touches both the Connecticut and New Hampshire borders (Commonwealth of
Massachusetts, 2013). Most of the area is heavily developed with both residential and
commercial buildings, but there are still a few agricultural and farming landscapes present
13
Figure 2: Map of Worcester County (Ajemian & Gamble, 2013)
(mostly in the northern-most parts). As far as natural features go, there are also several rivers and
watersheds which make Central
Massachusetts a physically diverse area
which could yield a wide range of
nematode species and population
densities. Because of the diversity of the
region and its geographic proximity to
WPI, the towns chosen for the project
were restricted to this area. For the
purpose of this experiment, a map of
Worcester County as seen in Figure 2,
which makes up most of Central
Massachusetts was consulted when
picking towns to isolate nematodes.
2.4 Species Identification One of the most important
aspects of biodiversity studies is species
identification. For nematodes, there are two different methods in identifying species. The first
method is by simply looking at the morphology of the organism. This method is difficult and
leaves a lot of room for error if the person identifying the species is not a complete expert on the
physical properties of each species. The second method of species identification is done by DNA
amplification of the organism in question and then matching that DNA to an online database of
species that already have had their DNA sequenced. When amplifying DNA, a molecular
14
marker must be chosen. The best molecular marker is usually a DNA or RNA sequence that is
highly conserved between species and yet shows enough variation so that individual species can
be identified. The molecular marker chosen for this project was the Small Subunit rRNA gene.
This molecular marker is specific to the phylum Nematoda and was proven successful in
isolating nematode genes in the past (Flyod, Rodgers, Lambshead, & Smith, 2005). This
molecular marker is also useful because it works even with samples that have a lot of potential
contamination due to complex living environments which makes nematodes the perfect
candidates (Flyod, Rodgers, Lambshead, & Smith, 2005).
By being able to isolate and identify nematodes, connections can begin to be made
between soil condition and biodiversity of nematodes. The more we know about what inhabits
out soils, the better predictions can be made as to why and what that means for the immediate
environment.
15
3. Methods
3.1 Soil Sampling In order to isolate nematodes from Central Massachusetts, soil was collected from several
towns within the area.
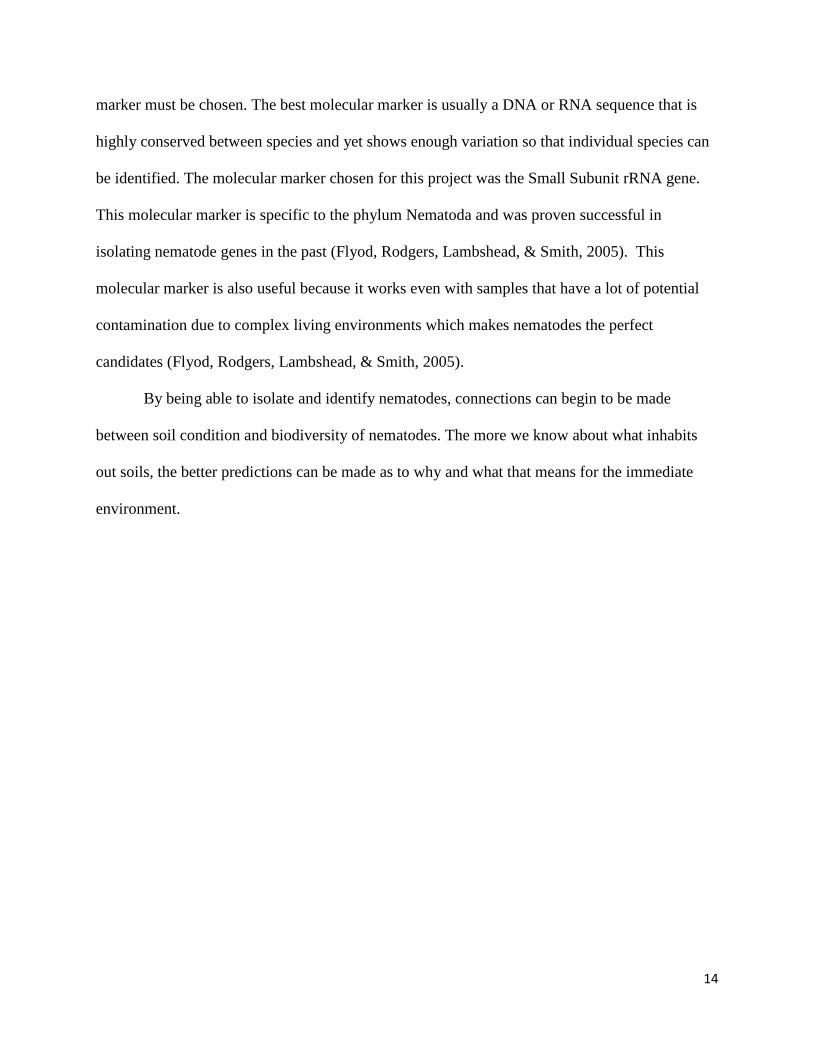
3.1.1 Choosing Locations
Because Central Massachusetts has a large number of municipalities, not all towns were
sampled due to resource and time constraints.
Locations were chosen after consulting a map
of the area and picking the towns best suited for
the experiment. The towns chosen were deemed
best for the project because they allowed for
geographical diversity of sampling locations.
They were the most spread out within the
region A “figure 8” method of choosing
locations was used as to sample as many towns as possible with the most geographical diversity.
This figure 8 method of sampling can be seen in Figure 4 where the red stars distinguish
approximate locations for sampling.
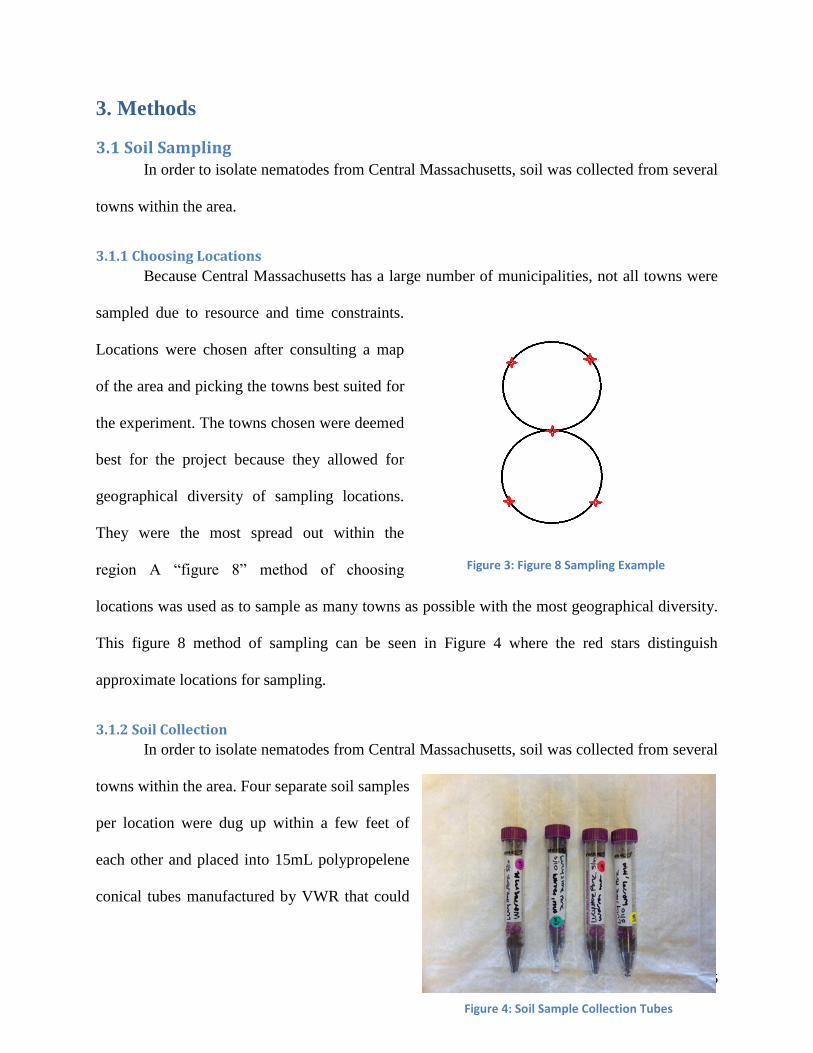
3.1.2 Soil Collection
In order to isolate nematodes from Central Massachusetts, soil was collected from several
towns within the area. Four separate soil samples
per location were dug up within a few feet of
each other and placed into 15mL polypropelene
conical tubes manufactured by VWR that could
Figure 4: Soil Sample Collection Tubes
Figure 3: Figure 8 Sampling Example
16
be capped for proper storage and contamination prevention as seen in Figure 3. On each tube
date, time, location and certain environmental conditions were noted such as weather and
elevation. As another sample contamination prevention measure, gloves were worn while
digging up the soil and changed between samples. Each soil sample was collected 3-6 inches
below the top soil line to get the best quality soil in that location with no use of tools. Soil
samples were stored at room temperature after collection See Appendix A for the Soil Sample
protocol.
3.2 Nematode Extraction Once soil samples were collected, nematodes were extracted through two separate
isolation methods. Two extraction methods were employed to help eliminate false negative
results. Each sample was analyzed using both methods once.. Should a sample be found with no
nematodes through one method, the second method can either confirm or deny their presence in
that sample. After several isolation methods were considered, simple soil plating and the
Baermann Funnel methods were chosen.
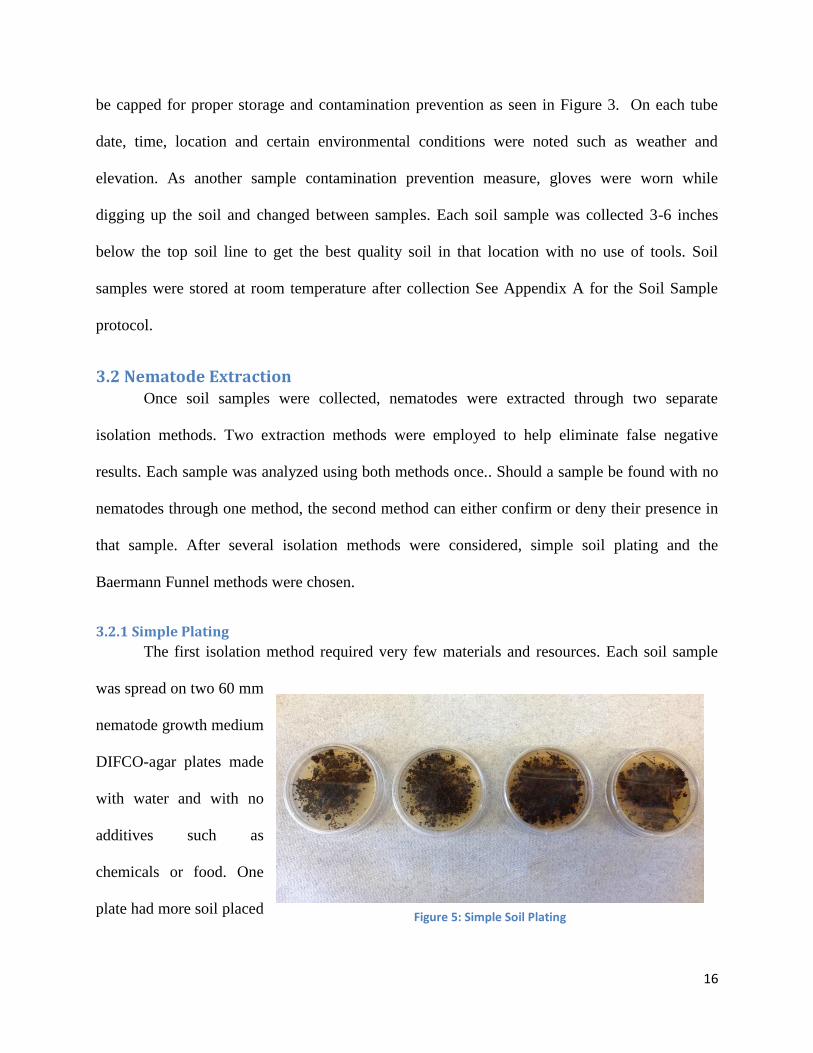
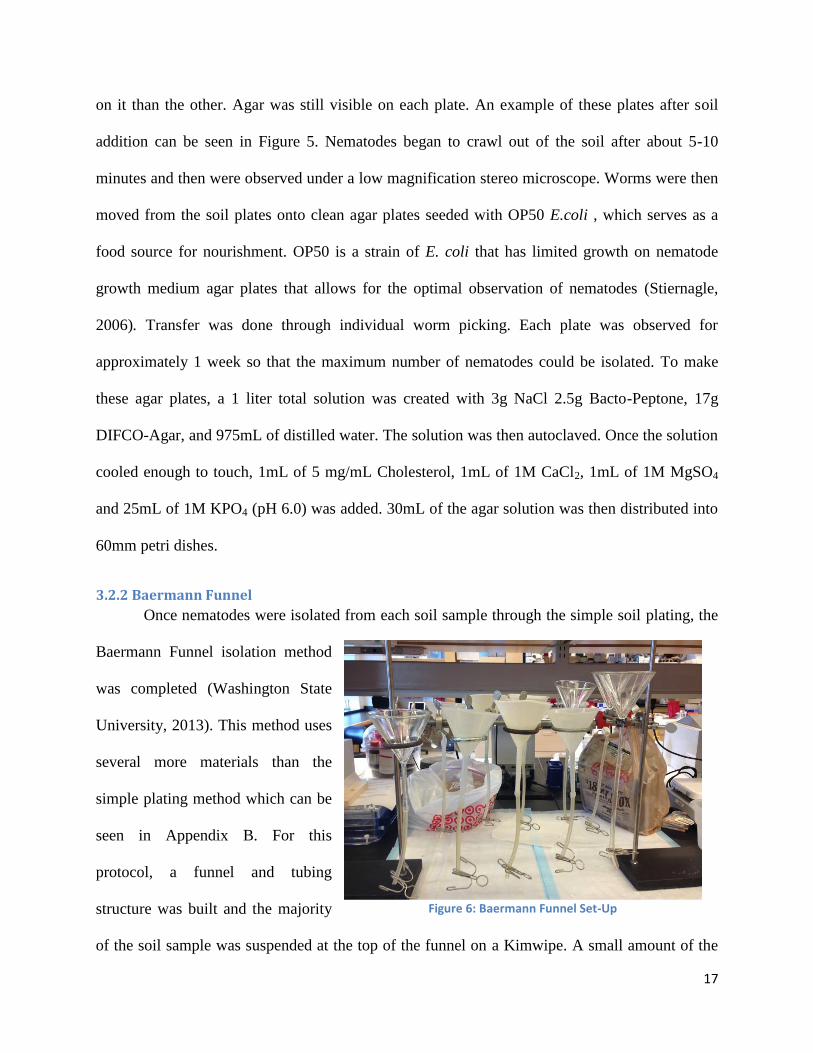
3.2.1 Simple Plating
The first isolation method required very few materials and resources. Each soil sample
was spread on two 60 mm
nematode growth medium
DIFCO-agar plates made
with water and with no
additives such as
chemicals or food. One
plate had more soil placed Figure 5: Simple Soil Plating
17
on it than the other. Agar was still visible on each plate. An example of these plates after soil
addition can be seen in Figure 5. Nematodes began to crawl out of the soil after about 5-10
minutes and then were observed under a low magnification stereo microscope. Worms were then
moved from the soil plates onto clean agar plates seeded with OP50 E.coli , which serves as a
food source for nourishment. OP50 is a strain of E. coli that has limited growth on nematode
growth medium agar plates that allows for the optimal observation of nematodes (Stiernagle,
2006). Transfer was done through individual worm picking. Each plate was observed for
approximately 1 week so that the maximum number of nematodes could be isolated. To make
these agar plates, a 1 liter total solution was created with 3g NaCl 2.5g Bacto-Peptone, 17g
DIFCO-Agar, and 975mL of distilled water. The solution was then autoclaved. Once the solution
cooled enough to touch, 1mL of 5 mg/mL Cholesterol, 1mL of 1M CaCl2, 1mL of 1M MgSO4
and 25mL of 1M KPO4 (pH 6.0) was added. 30mL of the agar solution was then distributed into
60mm petri dishes.
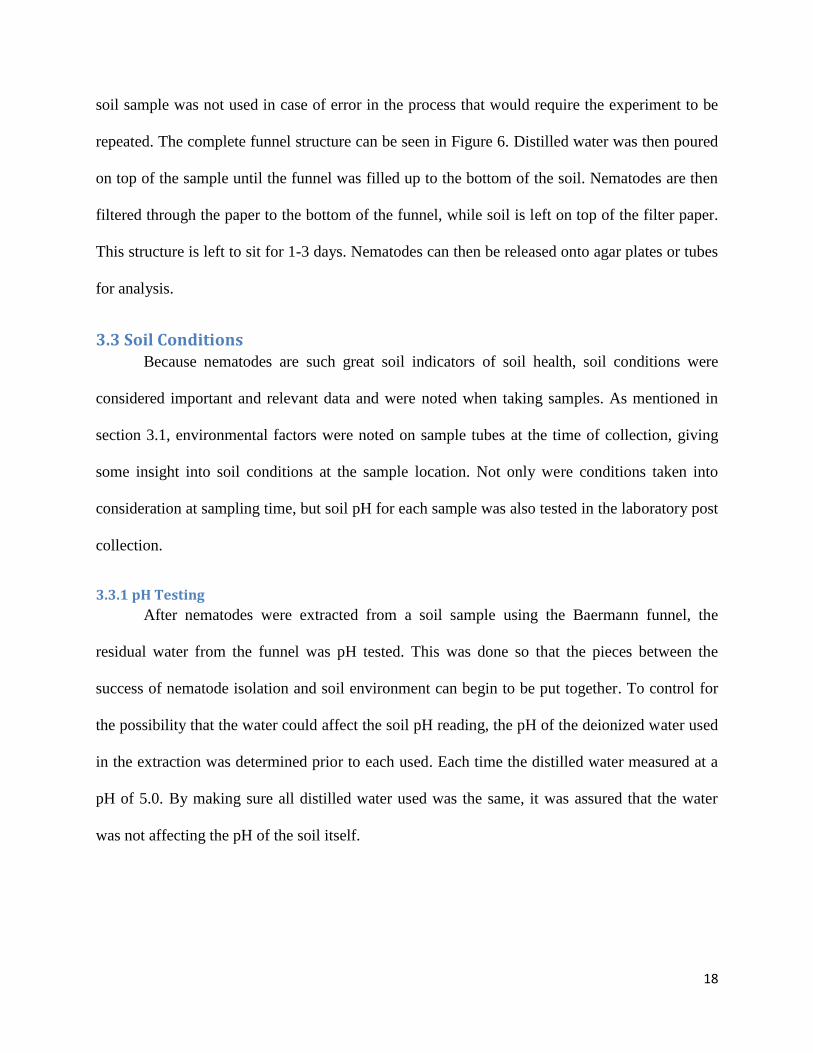
3.2.2 Baermann Funnel
Once nematodes were isolated from each soil sample through the simple soil plating, the
Baermann Funnel isolation method
was completed (Washington State
University, 2013). This method uses
several more materials than the
simple plating method which can be
seen in Appendix B. For this
protocol, a funnel and tubing
structure was built and the majority
of the soil sample was suspended at the top of the funnel on a Kimwipe. A small amount of the
Figure 6: Baermann Funnel Set-Up
18
soil sample was not used in case of error in the process that would require the experiment to be
repeated. The complete funnel structure can be seen in Figure 6. Distilled water was then poured
on top of the sample until the funnel was filled up to the bottom of the soil. Nematodes are then
filtered through the paper to the bottom of the funnel, while soil is left on top of the filter paper.
This structure is left to sit for 1-3 days. Nematodes can then be released onto agar plates or tubes
for analysis.
3.3 Soil Conditions Because nematodes are such great soil indicators of soil health, soil conditions were
considered important and relevant data and were noted when taking samples. As mentioned in
section 3.1, environmental factors were noted on sample tubes at the time of collection, giving
some insight into soil conditions at the sample location. Not only were conditions taken into
consideration at sampling time, but soil pH for each sample was also tested in the laboratory post
collection.
3.3.1 pH Testing
After nematodes were extracted from a soil sample using the Baermann funnel, the
residual water from the funnel was pH tested. This was done so that the pieces between the
success of nematode isolation and soil environment can begin to be put together. To control for
the possibility that the water could affect the soil pH reading, the pH of the deionized water used
in the extraction was determined prior to each used. Each time the distilled water measured at a
pH of 5.0. By making sure all distilled water used was the same, it was assured that the water
was not affecting the pH of the soil itself.
19
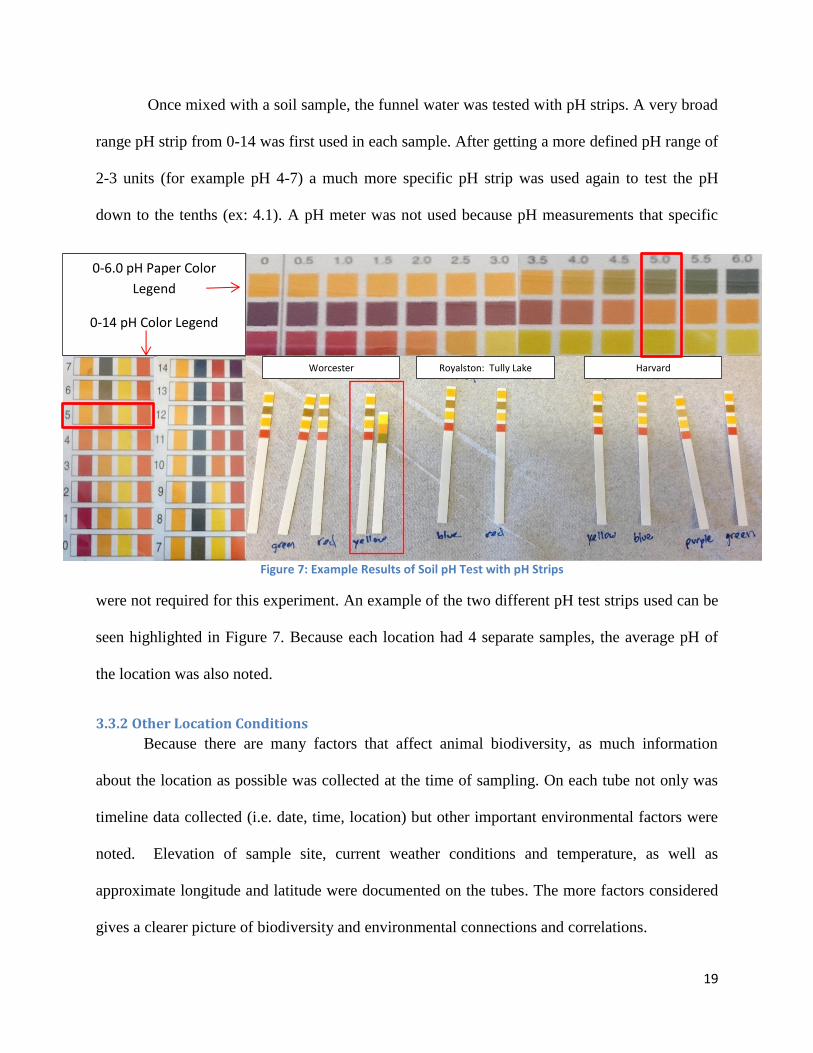
Figure 7: Example Results of Soil pH Test with pH Strips
Worcester Royalston: Tully Lake Harvard
0-6.0 pH Paper Color
Legend
0-14 pH Color Legend
Once mixed with a soil sample, the funnel water was tested with pH strips. A very broad
range pH strip from 0-14 was first used in each sample. After getting a more defined pH range of
2-3 units (for example pH 4-7) a much more specific pH strip was used again to test the pH
down to the tenths (ex: 4.1). A pH meter was not used because pH measurements that specific
were not required for this experiment. An example of the two different pH test strips used can be
seen highlighted in Figure 7. Because each location had 4 separate samples, the average pH of
the location was also noted.
3.3.2 Other Location Conditions
Because there are many factors that affect animal biodiversity, as much information
about the location as possible was collected at the time of sampling. On each tube not only was
timeline data collected (i.e. date, time, location) but other important environmental factors were
noted. Elevation of sample site, current weather conditions and temperature, as well as
approximate longitude and latitude were documented on the tubes. The more factors considered
gives a clearer picture of biodiversity and environmental connections and correlations.
20
3.4 Worm Analysis In order to determine what species of worm were isolated from each sample, DNA
isolation and amplification was done on individual worms. It is important to note that no
morphological worm analysis was done. For the process to work successfully a molecular marker
was chosen. Polymerase chain reaction (PCR) was then completed for genetic information
amplification.
3.4.1 Worm DNA Isolation
Worm DNA isolation was done by using a worm pick to individually remove a specimen
from a worm growth agar plate and into a 1.5ml microcentrifuge tube. 10µl of worm lysis buffer
was then added to the microcentrifuge tube until the worm was completely dissolved. The
dissolved worm solution contains the entirety of the worm’s DNA and was used as the genetic
template in the PCR master mix to get the PCR products. The worm lysis buffer was created was
for a stock of 500ml. Ingredients include 35ml of 1M Kl, 5ml of 1M Tris (pH 8.0), 1.25ml of 1M
MgCl2, 2.25ml of Nonidet P40 (NP-40), 2.25ml of Tween 20, 0.05g of Gelatin, and 464.25ml of
distilled water. This mixture was then heated and mixed on a stir plate followed by filter
sterilization. Just before use, 6µl of 10mg/ml Proteinase K (in distilled water) was added to 1ml
of lysis buffer to complete the mixture.
3.4.2 Choosing a molecular marker
. For the purpose of this experiment, three different nematode molecular markers
were taken into consideration when deciding the best way to amplify individual organisms’
DNA. In the end, the Small Subunit rRNA region was chosen. A reverse primer and a forward
primer for this molecular marker e were created. These primer sequences were given from Dr.
Matthias Herrmann at the Max Planck Institute for Developmental Biology in Tübingen,
21
Germany. The reverse primer had the sequence 5’- CATTCTTGGCAAATGCTTTCG-3’ and the
forward primer had the sequence 5’- AAAGATTAAGCCATGCATC-3’.
3.4.3 PCR Reaction to amplify SSU markers
Once the molecular marker was chosen and the primers for the marker designed, the PCR
process was used. The PCR process amplifies the DNA of the sample that binds to the designed
primers. For this process to work a master mix of reagents was created. This master mix includes
5µl of 10X buffer, 1.25µl of 10mM dNTPs, 1.5µl of the forward primer at 26.6µM/µl, 1.5µl of
the reverse primer at 37µM/µl, 35.05µl of distilled water, 0.75µl of the enzyme and 5µl of the
genomic DNA from the worm sample made with the lysis buffer. The complete master mix totals
a 50µl reaction. In this experiment, the Expand High Fidelity PCR System, dNTPack kit by
Roche was used.
When the master mix was created, the solution went into a thermo-cycling machine with
a specific program to amplify SSU sequences from genomic DNA. This program begins with
94°C for 2 minutes. Then, 34 cycles of 94°C for 30 seconds, 50°C for 30 seconds, 72°C for 2
minutes. Finally, one cycle of 72°C for 7 minutes and 4°C overnight. After the PCR product was
done, it was run on a 0.8% agarose gel for approximately 1 hour. The DNA was then visualized
with UV light to make sure the PCR worked. If the PCR process works, a 0.75 kb DNA fragment
would be visible on the gel with the use of UV light.
3.4.4 Worm DNA Sequencing
After the PCR product was run and visualized on the gel using UV light, the DNA band
was cut out. Since there is still gel mixed into the band, a Zymoclean Gel DNA Recovery Kit
was used to elute the DNA from the gel. Once the PCR product was purified, it was quantified
using a Nano drop and sequencing reactions were prepared and sent out for sequencing. Once the
sequence of the DNA was known, it can be matched to an online database through NCBI. Based
22
on sequence similarity to existing sequences in the database, the species of worm from the
samples were identified. The match to the database does not need to be 100% positive to identify
a species; rather the most similar sequence is the most probable identity of the species
sequenced. The higher the match percentage, the better the species identification is.
3.5 Preserving Worms for Future Use Since this project will be continued, the nematodes isolated were stored for future project
use. Since the worms were preserved, not only can they be used again but there is also an
informative catalog of which worms were isolated from our sampled regions.
3.5.1 Freezing and Storing
There are a couple of different ways to store worms for later use. For this project, a
freezing method that allows worm preservation for several decades was used. Clean worm plates
were washed down with M9 buffer solution. To make 1liter of M9 buffer solution 3g of KH2PO4,
11.3g of Na2HPO4.2H2O, and 5g of NaCl was added to distilled water and autoclaved. M9, now
mixed with worms, was transferred to a 15ml centrifuge tube. The tube was centrifuged at 4000
RPM in a 4x15ml centrifuge machine for 1 minute. Since the worms are now pelleted at the
bottom on the tube, the M9 supernatant was removed until only 2mL was left in the centrifuge
tube. These suspensions were then mixed with 2mL worm freezing solution. For 1 liter of worm
freezing solution, 500mL S-Basal without cholesterol solution (5.85g NaCl, 1g K2 HPO4, 6g
KH2PO4, and distilled H2O to 1 liter) was mixed with 500mL 30% per-volume Glycerol
Solution. The mixture was transferred into two 1L bottles of 500mL each and autoclaved. The
new solution of M9 and worm freezing solution was then transferred into about 4 separate
Cryotubes (about 1mL per Cryotube), labeled with sample name and current date, placed into a
Cryobox with the same labeling and frozen at -80 degrees Celsius.

23
3.5.2 Catalog Naming
Each different worm strain needs to be stored with a specific code so that it is known
which strain it is exactly. Since these worms were isolated without knowing what they are, new
codes had to be created. As much specific information about the worm strain needs to be stated
in the code name as concisely as possible. The strains collected were labeled according to who
collected them and their location. For example, in this project worms were collected by both
Laura Aurilio and Carli Barnes so all worm samples start with LACB for their initials. Then the
code for where the worm sample was collected from was added in as well as the sample color
(each sample from the same town was given one of five colors to distinguish it a separate
sample). For example, worms collected in Worcester would have a name like LACB-WR. This
would mean that the sample was collected in Worcester and was the red sample. By giving the
worms a code, they can then be cross referenced to a physical worm catalog which gives the
complete information about the strain as can be seen in Appendix C.
24
4. Results and Discussion
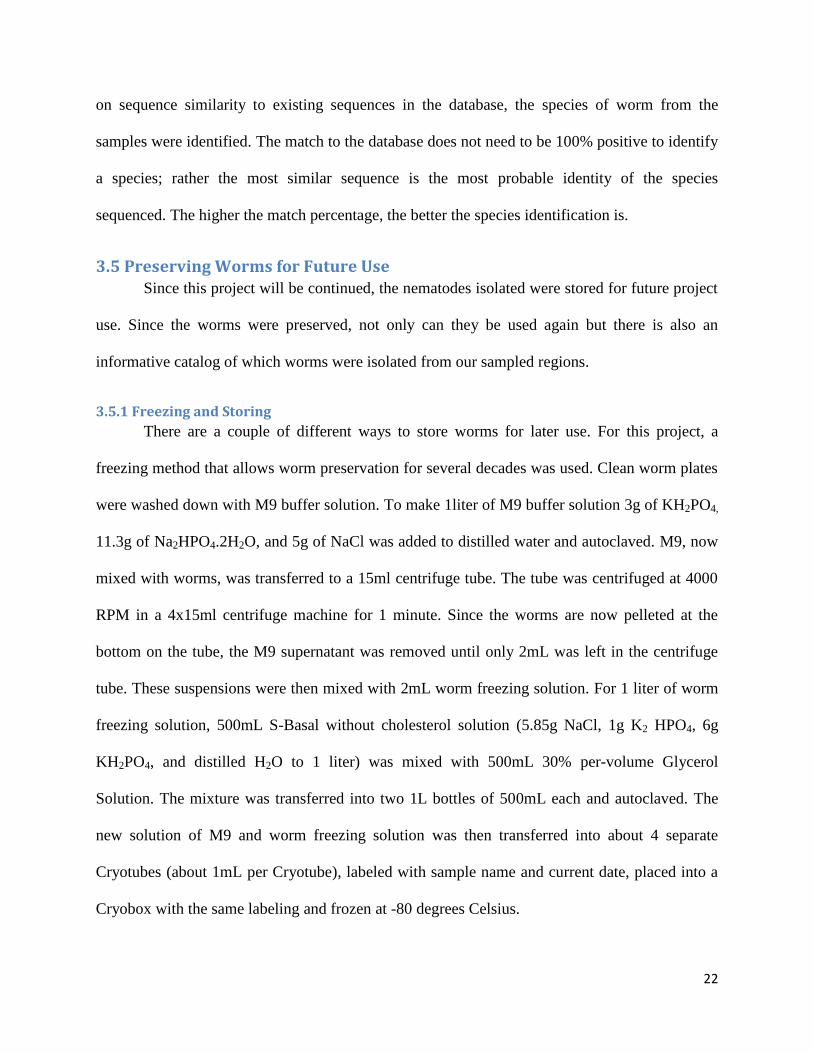
4.1 Geographical Locations Out of the towns in Worcester County, 16 original towns were selected to isolate
nematodes from. These towns were selected by breaking down the area into 5 sub-areas and
choosing at least 2 towns within each of the sub-areas. Towns were selected simply for both
geographic distribution and
availability and accessibility of a
relatively undisturbed area for
sample collection. In the Northwest
sub-area Royalston, Gardner, and
Athol were chosen. In the Northeast
sub-area Harvard, Bolton, and
Lancaster were sampled. In the
Southeast sub-area Mendon,
Millville, Hopedale, Blackstone
and Milford were chosen. In the
Southwest sub-area, Sturbridge and
Warren were selected. Finally, in
the Central sub-area Holden, Worcester and Shrewsbury were chosen. By sampling each of these
sub-areas the largest variation in the region could be covered without actually sampling each
individual town. This was not possible due to time constraints.
Of the 16 towns selected for sampling, Royalston was sampled at two separate locations
within the town. This was done to see if there was any variation in diversity even within a
Figure 8: Towns Sampled in Worcester County Highlighted in Yellow (Ajemian & Gamble, 2013)

25
smaller area constraint. After the original 16 towns were sampled, Westborough was added
through outside sample submission by my colleague Carli Barnes. Two other samples were also
analyzed taken from an unknown forest and an unknown garden. These samples were done
purely for process mastering and were not taken into consideration when calculating results. The
resultant map in Figure 8 shows all areas sampled.
Once the towns were chosen it was important to locate a relatively undisturbed area
within that town to collect soil samples. Because of this a state park, forest, field, or other similar
area was chosen in each town. A complete list of locations in each town sampled can be seen in
Table 1. Date, time of day, number of samples taken, elevation weather, and longitude and
latitude can also be seen. Each sample was taken in the afternoon and within a 3 week period to
try and limit variables as far as drastic weather changes and daily temperature.
Because latitude and longitude does not change so much within this small area, there
were no analysis done using those variables. This would matter more if you were analyzing
biodiversity on the beta or gamma level rather than the alpha level. Westborough samples only
had date and elevation recorded. No other information was known.

26
City
Loca
tion
Date
Tim
eEl
evat
ion
Wea
ther
# of
Sam
ples
Colle
cted
Long
itude
and
Latit
ude
Nem
atod
es
foun
d?
Roya
lsto
n Ro
yals
ton
Stat
e Fo
rest
04
/21/
133:
11 P
M24
5 m
Sunn
y, 4
74
Lat:
42.7
0312
7 Lo
n: -7
2.23
5794
Yes
Roya
lsto
n Tu
lly La
ke04
/21/
133:
37 P
M20
3 m
Sunn
y, 4
72
Lat:
42.6
4431
4 Lo
n: -7
2.21
3135
Yes
Atho
lBe
arsd
en C
onse
rvat
ion
Park
04/2
1/13
4:05
PM
305
mSu
nny,
45
4La
t: 42
.612
233
Lon:
-72.
1856
69Ye
s
Gar
dner
Dunn
Par
k04
/21/
134:
47 P
M34
4 m
Sunn
y, 4
54
Lat:
42.5
7583
8 Lo
n: -7
1.96
1136
Yes
Blac
ksto
neBl
acks
tone
Gor
ge04
/22/
131:
30 P
M67
mSu
nny,
52
4La
t: 42
.104
845
Lon:
-71.
6336
06Ye
s
Men
don
Gro
ver P
ark
04/2
2/13
1:45
PM
65 m
Sunn
y, 5
24
Lat:
42.0
6576
6 Lo
n: -7
1.52
1339
Yes
Mill
ville
Mill
ville
Lock
04/2
2/13
1:07
PM
75 m
Sunn
y, 5
24
Lat:
42.0
2628
0 Lo
n: -7
1.58
0820
Yes
Milf
ord
Plai
ns P
ark
04/2
2/13
2:39
PM
84 m
Sunn
y, 5
24
Lat:
42.1
5659
6 Lo
n: -7
1.50
9752
Yes
Hope
dale
Park
land
s04
/22/
132:
07 P
M86
mSu
nny,
52
4La
t: 42
.135
086
Lon:
-71.
5458
87Ye
s
Wor
cest
erIn
stitu
te P
ark
04/2
3/13
1:02
PM
157
mDr
izzl
ing,
39
4La
t: 42
.275
642
Lon:
-71.
8047
31Ye
s
Hold
enHo
lden
Tow
n Fo
rest
04/2
3/13
1:31
PM
182
mDr
izzl
ing,
39
4La
t: 42
.366
218
Lon:
-71.
8289
57Ye
s
Harv
ard
Ryan
Land
Fie
lds
05/0
8/13
1:43
PM
102
mHu
mid
, Clo
udy,
63
4La
t: 42
.510
577
Lon:
-71.
5931
80Ye
s
Lanc
aste
rPe
llecc
hia
Cons
erva
tion
05/0
8/13
2:15
PM
84 m
Hum
id, C
loud
y, 6
44
Lat:
42.4
8589
7 Lo
n: -7
1.69
0941
Yes
Bolto
nVa
ughn
Hill
s Con
serv
atio
n05
/08/
131:
25 P
M83
mHu
mid
, Clo
udy
634
Lat:
42.4
6108
0 Lo
n: -7
1.61
8671
Yes
Shre
wsb
ury
Pros
pect
Par
k05
/08/
133:
01 P
M20
6 m
Hum
id, D
rizzl
ing,
66
4La
t: 42
.304
991
Lon:
-71.
7137
72Ye
s
Stur
brid
geW
ells
Sta
te P
ark
05/1
0/13
12:5
2 PM
193
mHu
mid
, Sun
ny, 7
04
Lat:
42.1
4736
9 Lo
n: -7
2.06
7394
Yes
War
ren
Lucy
Sto
ne P
ark
05/1
0/13
2:01
PM
190
mHu
mid
, Sun
ny, 7
24
Lat:
42.2
1663
1 Lo
n:-7
2.19
2278
Yes
Wes
tbor
ough
xxxx
xxxx
xxxx
xxxx
6/3/
2013
xxxx
xxxx
xxx
150
mxx
xxxx
xxxx
xxxx
5xx
xxxx
xxxx
xxYe
s
Table 1: Sample Collection Information
27
05
101520253035404550
Nu
mb
er
of
Wo
rms
Town/Location
Worms Found Through Simple Plating
Number of Worms
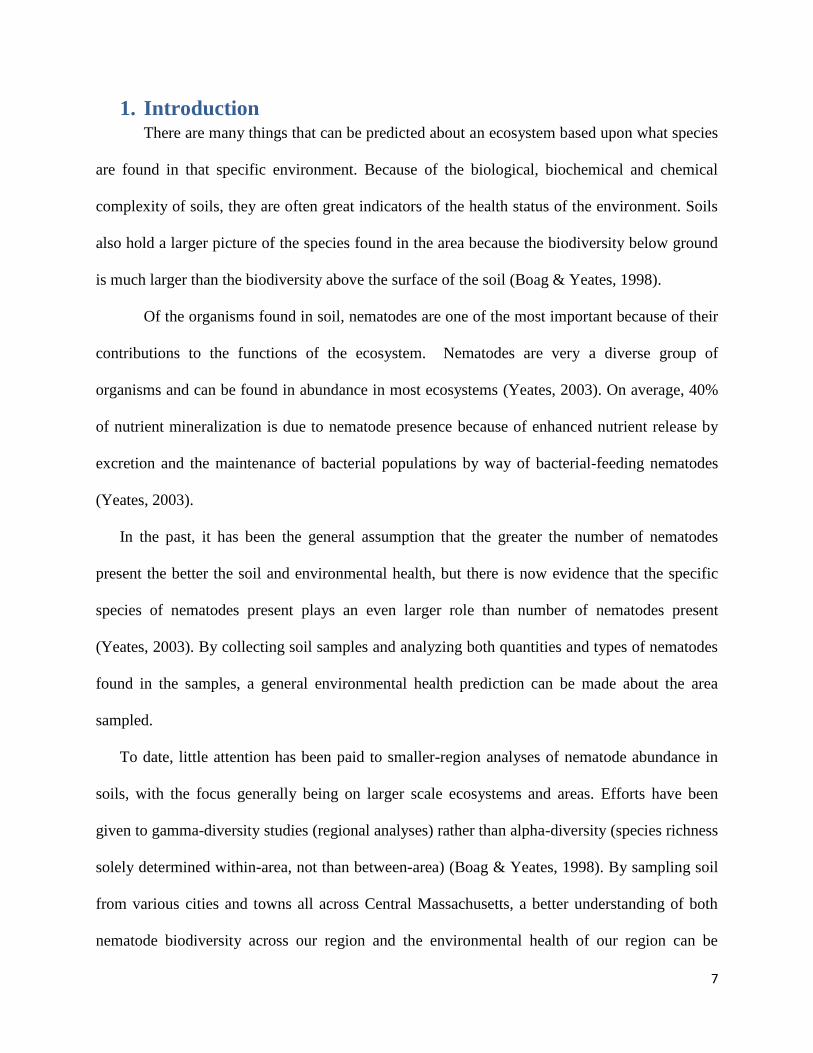
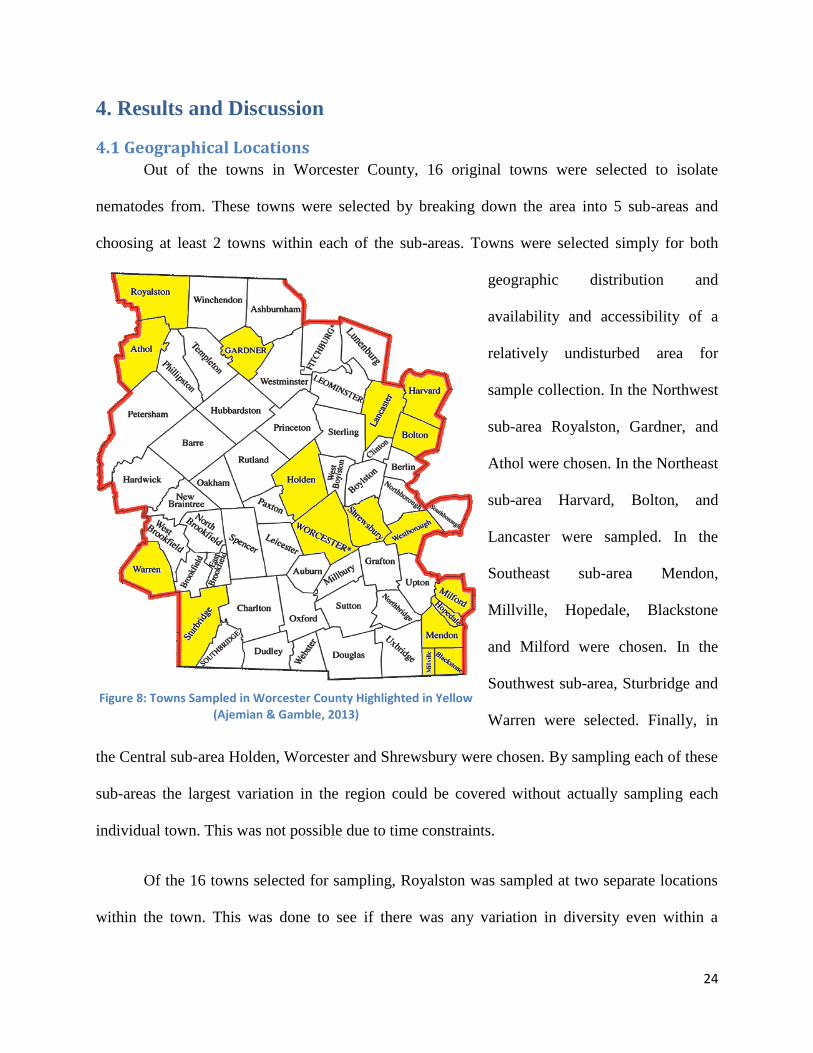
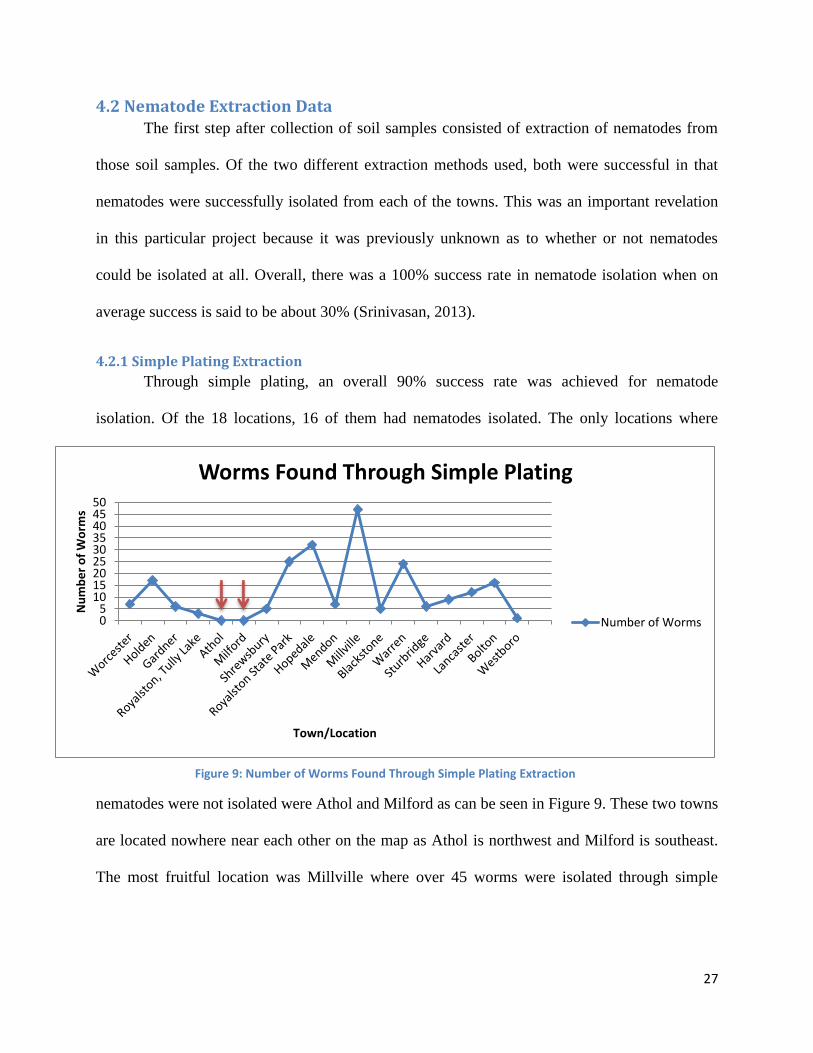
Figure 9: Number of Worms Found Through Simple Plating Extraction
4.2 Nematode Extraction Data The first step after collection of soil samples consisted of extraction of nematodes from
those soil samples. Of the two different extraction methods used, both were successful in that
nematodes were successfully isolated from each of the towns. This was an important revelation
in this particular project because it was previously unknown as to whether or not nematodes
could be isolated at all. Overall, there was a 100% success rate in nematode isolation when on
average success is said to be about 30% (Srinivasan, 2013).
4.2.1 Simple Plating Extraction
Through simple plating, an overall 90% success rate was achieved for nematode
isolation. Of the 18 locations, 16 of them had nematodes isolated. The only locations where
nematodes were not isolated were Athol and Milford as can be seen in Figure 9. These two towns
are located nowhere near each other on the map as Athol is northwest and Milford is southeast.
The most fruitful location was Millville where over 45 worms were isolated through simple
28
plating. Millville is located in the southeast sub-region as well. The complete simple plating
extraction information can be seen in Appendix F.
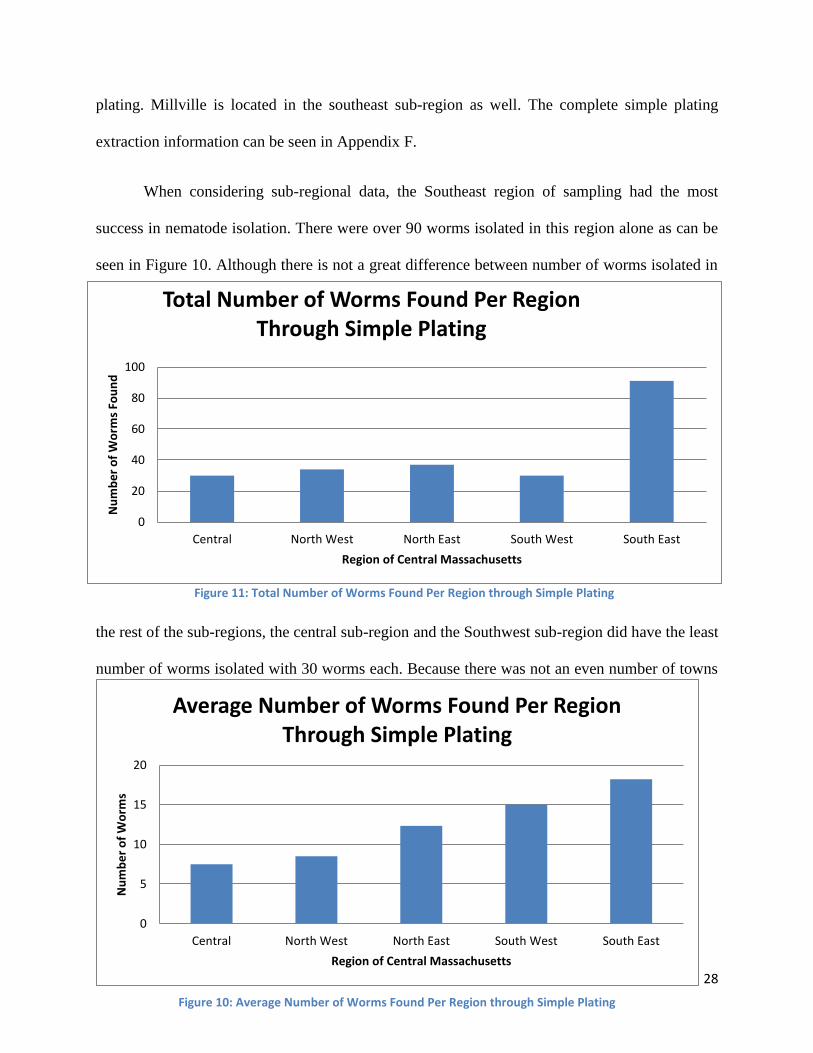
When considering sub-regional data, the Southeast region of sampling had the most
success in nematode isolation. There were over 90 worms isolated in this region alone as can be
seen in Figure 10. Although there is not a great difference between number of worms isolated in
the rest of the sub-regions, the central sub-region and the Southwest sub-region did have the least
number of worms isolated with 30 worms each. Because there was not an even number of towns
0
5
10
15
20
Central North West North East South West South East
Nu
mb
er
of
Wo
rms
Region of Central Massachusetts
Average Number of Worms Found Per Region Through Simple Plating
Figure 10: Average Number of Worms Found Per Region through Simple Plating
0
20
40
60
80
100
Central North West North East South West South East
Nu
mb
er
of
Wo
rms
Fou
nd
Region of Central Massachusetts
Total Number of Worms Found Per Region Through Simple Plating
Figure 11: Total Number of Worms Found Per Region through Simple Plating
29
sampled per region, an average number of worms per area were figured as well. The Southeast
region again had the most success with an average of 18.2 worms per town followed by the
Southwest region and then the Northeast region. The central region had the least success with an
average of 7.5 worms per town which can be seen in Figure 11.
4.2.2 Baermann Funnel Extraction
With the Baermann Funnel extraction technique, there was a 100% success rate for
nematode isolation. The number of nematodes found was not quantifiable because of the way
this isolation takes place. Funneling filters both worms and eggs and so the specific number of
specimens isolated would be too much to count by eye. Success was simply measured as to
whether nematodes were found or not. Each sample had at least one worm that was extracted
from the funnel technique which makes this method a great choice. The complete Baermann
Funnel extraction method data can be seen in Appendix D.
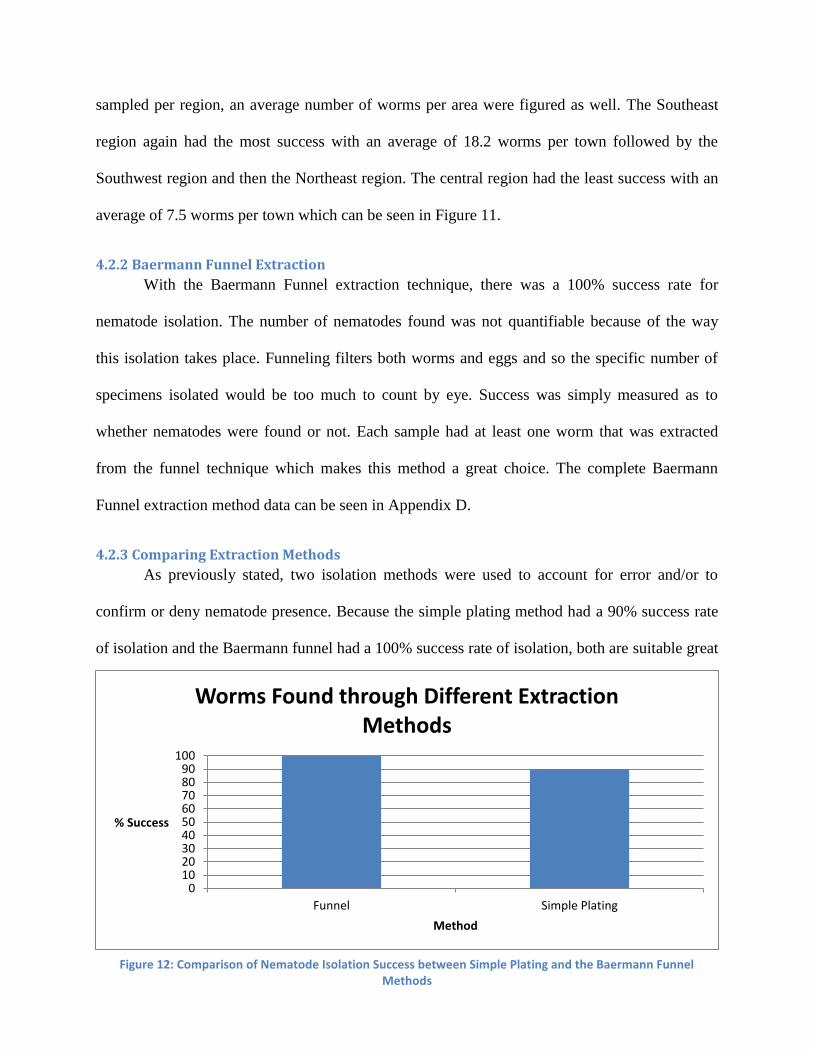
4.2.3 Comparing Extraction Methods
As previously stated, two isolation methods were used to account for error and/or to
confirm or deny nematode presence. Because the simple plating method had a 90% success rate
of isolation and the Baermann funnel had a 100% success rate of isolation, both are suitable great
0102030405060708090
100
Funnel Simple Plating
% Success
Method
Worms Found through Different Extraction Methods
Figure 12: Comparison of Nematode Isolation Success between Simple Plating and the Baermann Funnel Methods

30
choices for nematode isolation. Since this is the case, when choosing between which isolation
method to use there are other factors that should be taken into consideration. The Baermann
funnel did yield full results as can be seen in Figure 12 and so is a good choice if simply
choosing a method by the highest success rate.
Both simple plating and the Baermann funnel methods run on two very different
timelines. This could be a huge factor when deciding which method to use. For a shorter
timeline, the Baermann funnel is recommended as it can be completed in as little as 24 hours and
no longer than 72 hours. At the end of the 72 hours, you either have isolated nematodes or they
simply are not present in the sample. You can choose, should you want to, to plate the resultant
water from the funnel and see if eggs are present for hatching if no worms are visible. This will
take more time. For simple plating, the best results occur after about 4-5 days. While it is
possible to isolate worms within 10 minutes of plating, this is rare. In this experiment no more
0
15
30
45
60
75
90
105
120
135
150
165
180
0 1 2 3 4 5 6
Nu
mb
er
of
Wo
rms
Fou
nd
Number of Days After Plating
Total Worms Found Through Simple Plating
Figure 13: Total Number of Worms Found Per Day of Observation through Simple Plating
31
than 30 worms per day were isolated until day 4 when there were too many worms to count as
can be seen in Figure 13. Because of this, it is recommended to observe plates for up to a week.
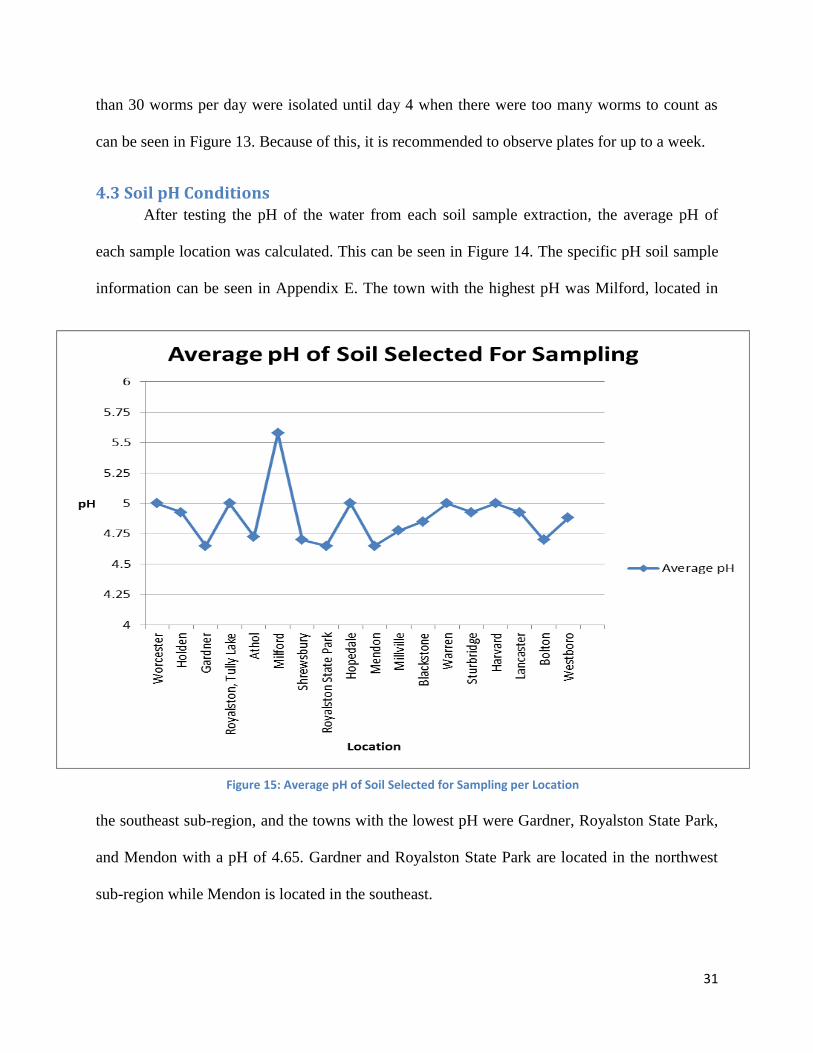
4.3 Soil pH Conditions After testing the pH of the water from each soil sample extraction, the average pH of
each sample location was calculated. This can be seen in Figure 14. The specific pH soil sample
information can be seen in Appendix E. The town with the highest pH was Milford, located in
the southeast sub-region, and the towns with the lowest pH were Gardner, Royalston State Park,
and Mendon with a pH of 4.65. Gardner and Royalston State Park are located in the northwest
sub-region while Mendon is located in the southeast.
Figure 15: Average pH of Soil Selected for Sampling per Location Figure 15: Average pH of Soil Selected for Sampling per Location

32
To see if there is any association between the presence of worms and the pH of the soil,
the number of worms found through simple plating in each measured pH was charted as can be
seen in Figure 15. There is no specific pattern that can be seen as the number of worms found
varies. The most successful pH was 5.0 where 75 worms were isolated. Samples with an average
pH of 5.575 and 4.725 had no worms isolated; Milford and Athol respectively. Since there
appears to be no clear connection between specific pH and nematode isolation success another
analysis that breaks pH down into range was done as shown in Figure 16. What can be seen is
that there is more success of isolating nemaotdes when they are found in soil that falls within a
pH range rather than a specific pH. With a lower pH of 4.00-4.50 there were only 5 worms that
were isolated as compared to a higher pH of 4.51-5.00 where 225 worms were isolated. This
0
5
10
15
20
25
30
35
40
45
50
55
60
65
70
75
80
4.5 4.65 4.7 4.725 4.775 4.85 4.88 4.925 5 5.575
Nu
mb
er
of
Wo
rms
Fou
nd
Average pH
Total Number of Worms Found in Each pH Condition through Simple Plating
Figure 15: Total Number of Worms Found in each pH Condition through Simple Plating

33
suggests that the worms found have a tolerance for a specific pH range and do favor a more
neutral environment rather than acidic.
4.4 Small Subunit RNA as a Molecular Marker As a control, genomic DNA from a laboratory C. elegans
strain was extracted and used for PCR with the Small Subunit
rRNA primers. The PCR product was run on an agarose gel and
a band was successfully seen at 0.750 kb which shows that the
PCR with the SSU primers was successful worked. This can be
seen in Figure 17 next to the 1kb ladder.
Because this molecular marker worked for the C. elegans
genomic DNA, a sample with isolated worms was then analyzed.
This specific soil sample used was from the town of Hopedale.
0
50
100
150
200
250
4.00-4.50 4.51-5.00
Nu
mb
er
of
Wo
rms
Fou
nd
pH Range
Total Number of Worms Found in Each pH Range through Simple Plating
Figure 16: Total Number of Worms Found through Simple Plating in each Specified pH Range
SSU PCR: C. elegans
CONTROL
1 KB
Ladder
0.75 KB
Fragment
Figure 17: PCR Control: SSU Band of C. elegans
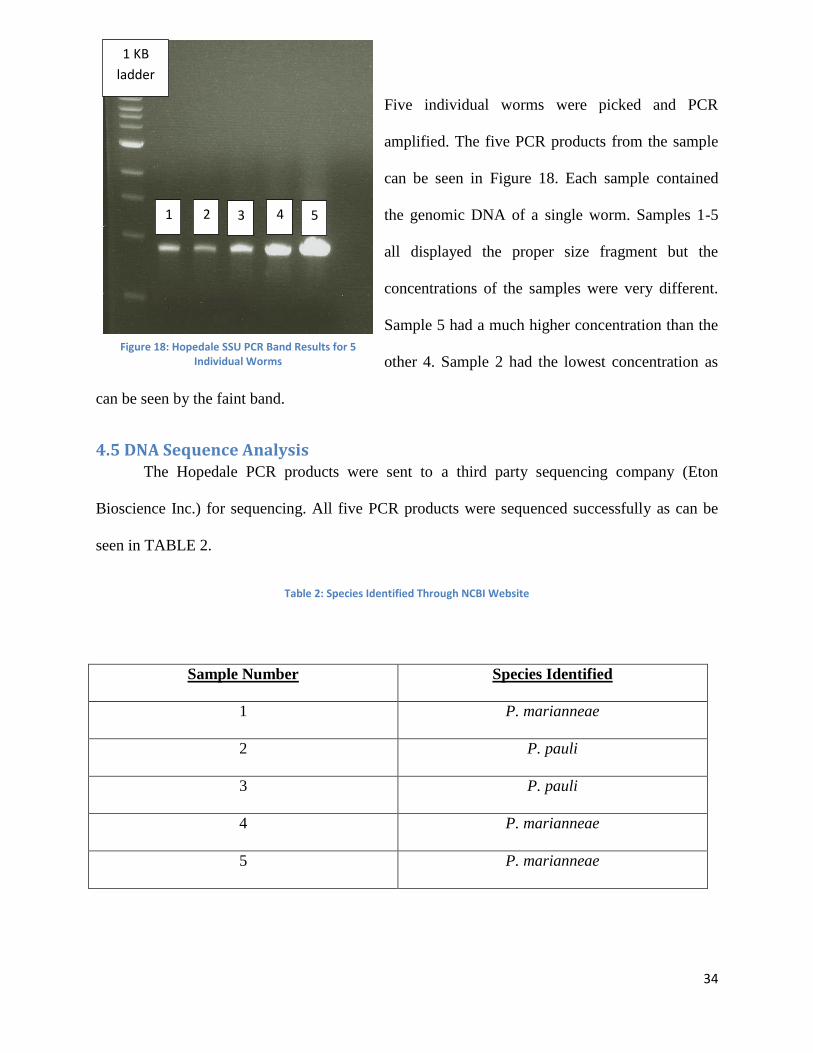
34
Five individual worms were picked and PCR
amplified. The five PCR products from the sample
can be seen in Figure 18. Each sample contained
the genomic DNA of a single worm. Samples 1-5
all displayed the proper size fragment but the
concentrations of the samples were very different.
Sample 5 had a much higher concentration than the
other 4. Sample 2 had the lowest concentration as
can be seen by the faint band.
4.5 DNA Sequence Analysis The Hopedale PCR products were sent to a third party sequencing company (Eton
Bioscience Inc.) for sequencing. All five PCR products were sequenced successfully as can be
seen in TABLE 2.
Table 2: Species Identified Through NCBI Website
Sample Number Species Identified
1 P. marianneae
2 P. pauli
3 P. pauli
4 P. marianneae
5 P. marianneae
1 KB
ladder
1 2
3
4
5
Figure 18: Hopedale SSU PCR Band Results for 5 Individual Worms
35
The first sequence for sample one can be seen in Appendix G. When matched to the NCBI
online database for DNA sequences, the nematode species that was found was Pristionchus
marianneae. The sequence for sample number two can be seen in Appendix H. When searched
against the non-redundant database at NCBI, our sequence displayed a high degree of similarity
to nematode species Pristionchus pauli. For the third sample, the DNA sequence can be seen in
Appendix I. This sequence when matched resulted in identifying Pristionchus pauli as well, just
like in sample two. For sample number four, the DNA sequence can be seen in Appendix J. This
DNA sequence resulted in identifying another Pristionchus marianneae. For the last sample,
sample five, the DNA sequence can be seen in Appendix K. This sequence was also was
matched to Pristionchus marianneae. This indicates that this one location has two species of the
same genus which shows variation with some ancestral similarities. Pristionchus nematodes are
usually found in close connection with beetles (Max Planck Institute of Developmental Biology,
2013). This is interesting to note because there were no beetles isolated within the soil sample
collected from Hopedale. The connection between the presence of these species and the absence
of beetles in the sample is not yet known, however P. marianneae and P. pauli are two of several
American nematode species (Sommer, 2013). The population exchange between beetle and soil
populations of these species is still an area for examination (Sommer, 2013).
4.6 Frozen Strains Not all samples were able to be frozen. Some samples simply did not have enough worms
isolated so that the frozen sample would be dense enough. Because of this, some samples from
the same town were combined so that the density would be high enough for worm recovery
during the thawing process. The total list of frozen strains as well as freezing information can be
seen in Appendix L.
36
5. Conclusion As far as nematode isolation and extraction go, all methods used are appropriate and
successful. There was a much higher isolation success rate than expected, and this is assumed to
be due to the fact that most of the attention of this project was given to isolation over all other
methods. This shows that success is partially based upon patience and care given to each
isolation process. The Baermann funnel would be a personal suggestion purely based upon
preference, but as mentioned before simple plating isolation is sufficient should your main
concern not be the chance of false negative results. The other factor to consider when deciding
between isolation methods is materials. Simple plating is the best choice if least amount of
equipment is required. The Baermann funnel, of course requires much more than a nematode
growth medium agar plate. It is also important to note that while there are more materials
required for this method, the materials are easy to locate and relatively inexpensive.
By being able to isolate nematodes from every town shows that distribution of nematodes is
very widespread. When it comes to nematode presence in conjunction with soil pH, there is an
apparent range of tolerance where nematodes prefer to reside in of the towns that were sampled.
It is expected that having less acidic soil will induce a higher nematode presence. For the towns
that have soil that fall within the lower and less tolerable pH range, the assumption is that the
environmental health is poorer due to the more acidic soil and less worm presence.
Due to limited time constraints, the DNA from only 5 worms was amplified using the PCR
process. While this number is low, the results show that this approach to assessing biodiversity is
successful. The SSU as a molecular marker is useful for nematode specific assessments as is
works great with single worm genetic information. Should this process have been continued, it is
predicted that results would be the same in that DNA would be able to be isolated and amplified

37
successfully using the SSU primers and PCR cycle. With complete worm analysis, the two
different Pristionchus species of worms found show that there is variation in the biodiversity
even within one sample location.
To be able to make solid conclusions about population numbers and diversities, samples for
each town within the region should be collected in at least the same quantity as was done in this
project. Once there is both a wider-spread and more in-depth sampling distribution it should be a
sufficient enough representation of the region’s population in its entirety to make conclusions
about environmental biodiversity and health.
Objectively speaking, this experiment was highly successful in the high nematode isolation
rate as well as the single worm DNA amplification success. While time did not allow for
complete worm analysis of all samples, being able to show results for the one town that was
analyzed demonstrates proof of principle of the method. This project will be continued by other
undergraduate researchers using these methods.
For next steps, the frozen worms should be analyzed in the same way as the Hopedale sample
was analyzed. Once all worms are analyzed a concise map should be created as well as a
phylogenetic tree allowing for the visualization of worm species location within the Central
Massachusetts area. This project should then be extended by either sampling more towns within
the same area or expanding the area of sampling to other Massachusetts regions and so forth.
As another extension to this venture, there is also great opportunity for community outreach
through a citizen science project. By asking members of the community to submit their own soil
samples to be analyzed, information can be collected quicker, easier, and from a wider variety of
areas. This method has been proven successful in soil sample collection as it was tested at the
38
Touch Tomorrow event held at Worcester Polytechnic Institute in June of 2013. After informing
visitors of the project goals and how they can help as citizens of the community, there were over
10 soil sample submissions from individual households and even a box full of soil samples sent
from a local school. This shows that people are interested in the findings of this research and
willing to help.
With the results of this project, further analysis can begin to happen as far as connecting
nematodes with specific soil conditions. In doing background research, there was little to no
information found on specific species inhabitants and soil and environmental conditions. By now
being able to know the species of nematodes present in this region, these connections can begin
to be made.
39
Appendices
Appendix A: Soil Sample Protocol
1. Obtain map of central Massachusetts
2. Mark cities/towns of interest
3. Find relatively undisturbed area within town (forest, park, conservation site etc.)
4. Map out route to location and visit to sample.
5. With gloves, take 4 separate soil samples within the specified area.
6. Fill each sample tube until full. Close tubes fully to avoid contamination.
7. Measure elevation of site using the Elevation app for iPhone.
8. Mark sample tubes with date, location, city, time of day, and elevation.
9. Keep samples at around 4 degrees Celsius for optimal preservation (samples can last up
to several weeks).
Use large centrifuge tubes for sampling if possible
*If using any tools to dig up soil, make sure they are clean from area to area as to not
cross contaminate soil samples.
As adapted from Wormwood by Paul De Ley:
http://xyala.cap.ed.ac.uk/research/nematodes/fgn/worm/extrafix.html#extratop
40
Appendix B: Baermann Funnel Protocol Adapted From ED-STEEP: Education Solutions to Environmental and Economic
Problems
Materials:
Small funnel
Ring stand
Flexible tubing (clear works best)
Clamp
Filter paper or Kimwipes
Soil samples
Collection vessel (tube or dish)
Pipette
Procedure:
1. Construct funnel:
a. Attach approximately 10cm of tubing to end of funnel
b. Place funnel in ring stand so tubing is not touching the table
c. Clamp the bottom of the tubing shut
2. Take two Kimwipes, fold in half and place on top of one another. Put Kimwipes into
opening of funnel.
3. Add soil sample on top of the Kimwipes.
4. Add water slowly to the soil sample so that it is just saturated. Soil sample must always
be in contact with water for best results.
5. Leave funnel undisturbed for 1-3 days, adding water as necessary to keep saturated.
Worms will fall to bottom of tube.
6. Release water from tube by releasing clamp. Empty water into centrifuge tube.
7. Centrifuge sample at 4000 RPM for 1 minute in a 4x15ml rotor centrifuge machine.
8. Remove excess water from tube with pipette leaving nematode pellet and a small amount
of water.
9. Mix pellet and water with pipette and plate onto small seeded plate. Label plate and
observe or pick worms as needed.
41
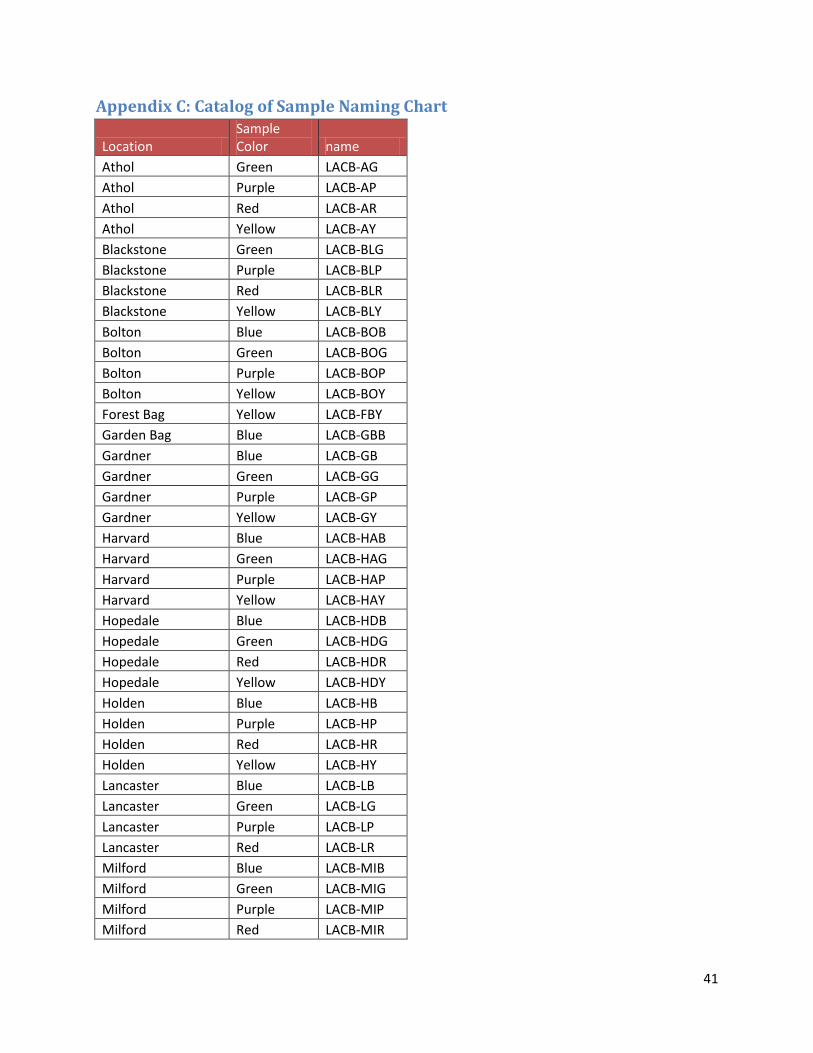
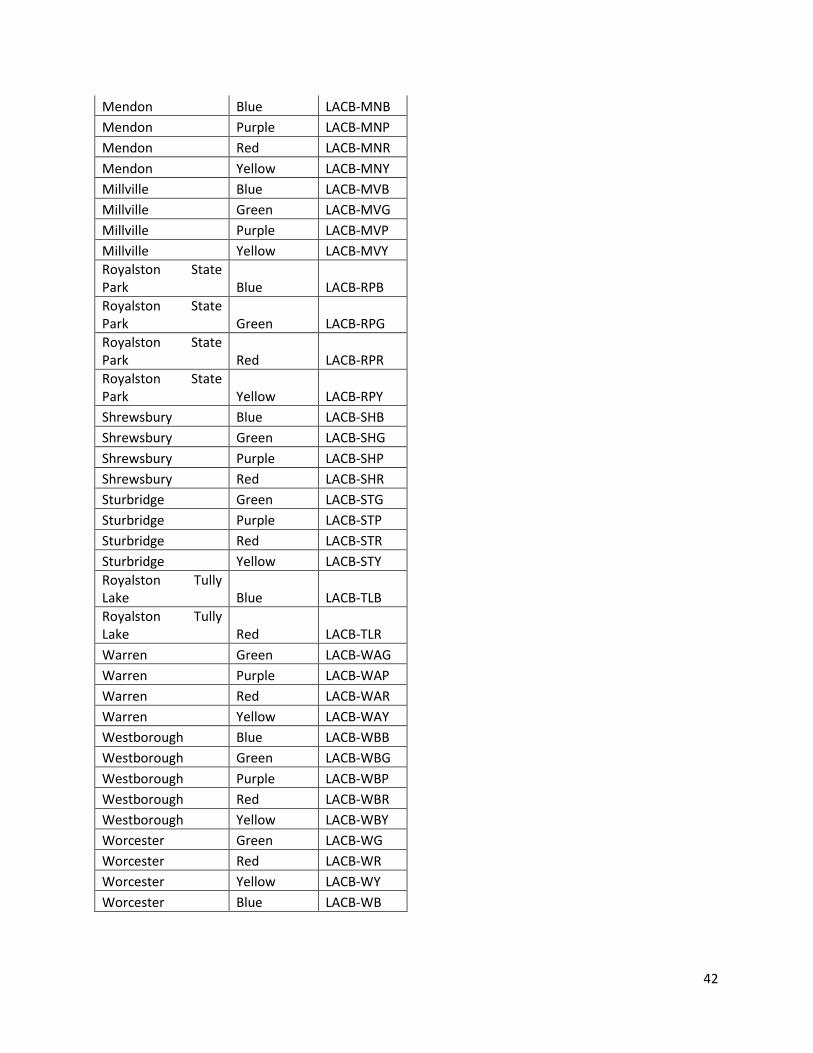
Appendix C: Catalog of Sample Naming Chart
Location Sample Color name
Athol Green LACB-AG
Athol Purple LACB-AP
Athol Red LACB-AR
Athol Yellow LACB-AY
Blackstone Green LACB-BLG
Blackstone Purple LACB-BLP
Blackstone Red LACB-BLR
Blackstone Yellow LACB-BLY
Bolton Blue LACB-BOB
Bolton Green LACB-BOG
Bolton Purple LACB-BOP
Bolton Yellow LACB-BOY
Forest Bag Yellow LACB-FBY
Garden Bag Blue LACB-GBB
Gardner Blue LACB-GB
Gardner Green LACB-GG
Gardner Purple LACB-GP
Gardner Yellow LACB-GY
Harvard Blue LACB-HAB
Harvard Green LACB-HAG
Harvard Purple LACB-HAP
Harvard Yellow LACB-HAY
Hopedale Blue LACB-HDB
Hopedale Green LACB-HDG
Hopedale Red LACB-HDR
Hopedale Yellow LACB-HDY
Holden Blue LACB-HB
Holden Purple LACB-HP
Holden Red LACB-HR
Holden Yellow LACB-HY
Lancaster Blue LACB-LB
Lancaster Green LACB-LG
Lancaster Purple LACB-LP
Lancaster Red LACB-LR
Milford Blue LACB-MIB
Milford Green LACB-MIG
Milford Purple LACB-MIP
Milford Red LACB-MIR
42
Mendon Blue LACB-MNB
Mendon Purple LACB-MNP
Mendon Red LACB-MNR
Mendon Yellow LACB-MNY
Millville Blue LACB-MVB
Millville Green LACB-MVG
Millville Purple LACB-MVP
Millville Yellow LACB-MVY
Royalston State Park Blue LACB-RPB
Royalston State Park Green LACB-RPG
Royalston State Park Red LACB-RPR
Royalston State Park Yellow LACB-RPY
Shrewsbury Blue LACB-SHB
Shrewsbury Green LACB-SHG
Shrewsbury Purple LACB-SHP
Shrewsbury Red LACB-SHR
Sturbridge Green LACB-STG
Sturbridge Purple LACB-STP
Sturbridge Red LACB-STR
Sturbridge Yellow LACB-STY
Royalston Tully Lake Blue LACB-TLB
Royalston Tully Lake Red LACB-TLR
Warren Green LACB-WAG
Warren Purple LACB-WAP
Warren Red LACB-WAR
Warren Yellow LACB-WAY
Westborough Blue LACB-WBB
Westborough Green LACB-WBG
Westborough Purple LACB-WBP
Westborough Red LACB-WBR
Westborough Yellow LACB-WBY
Worcester Green LACB-WG
Worcester Red LACB-WR
Worcester Yellow LACB-WY
Worcester Blue LACB-WB
43
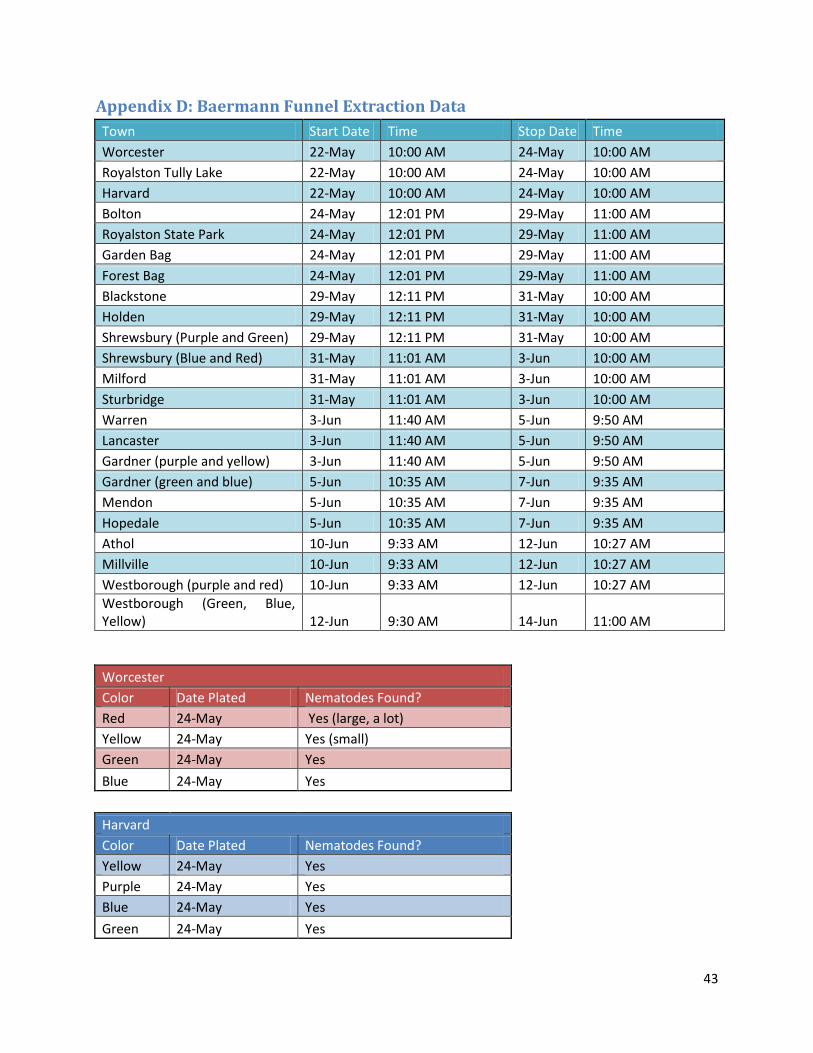
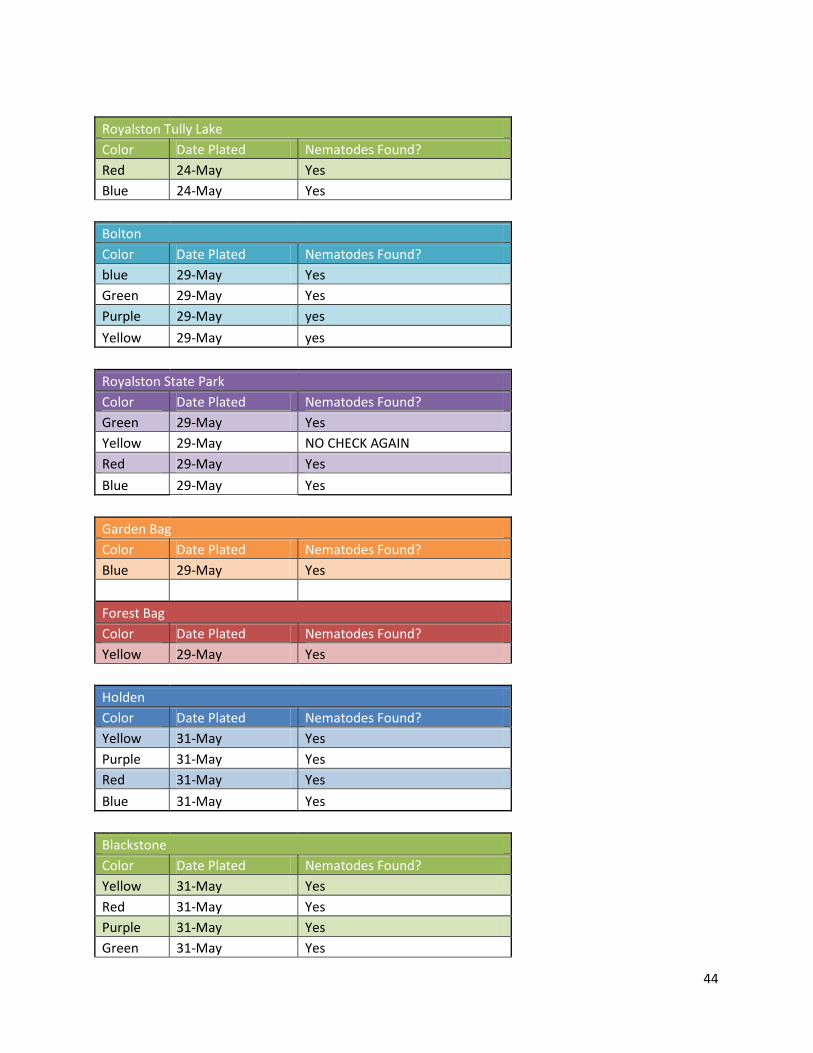
Appendix D: Baermann Funnel Extraction Data
Town Start Date Time Stop Date Time
Worcester 22-May 10:00 AM 24-May 10:00 AM
Royalston Tully Lake 22-May 10:00 AM 24-May 10:00 AM
Harvard 22-May 10:00 AM 24-May 10:00 AM
Bolton 24-May 12:01 PM 29-May 11:00 AM
Royalston State Park 24-May 12:01 PM 29-May 11:00 AM
Garden Bag 24-May 12:01 PM 29-May 11:00 AM
Forest Bag 24-May 12:01 PM 29-May 11:00 AM
Blackstone 29-May 12:11 PM 31-May 10:00 AM
Holden 29-May 12:11 PM 31-May 10:00 AM
Shrewsbury (Purple and Green) 29-May 12:11 PM 31-May 10:00 AM
Shrewsbury (Blue and Red) 31-May 11:01 AM 3-Jun 10:00 AM
Milford 31-May 11:01 AM 3-Jun 10:00 AM
Sturbridge 31-May 11:01 AM 3-Jun 10:00 AM
Warren 3-Jun 11:40 AM 5-Jun 9:50 AM
Lancaster 3-Jun 11:40 AM 5-Jun 9:50 AM
Gardner (purple and yellow) 3-Jun 11:40 AM 5-Jun 9:50 AM
Gardner (green and blue) 5-Jun 10:35 AM 7-Jun 9:35 AM
Mendon 5-Jun 10:35 AM 7-Jun 9:35 AM
Hopedale 5-Jun 10:35 AM 7-Jun 9:35 AM
Athol 10-Jun 9:33 AM 12-Jun 10:27 AM
Millville 10-Jun 9:33 AM 12-Jun 10:27 AM
Westborough (purple and red) 10-Jun 9:33 AM 12-Jun 10:27 AM
Westborough (Green, Blue, Yellow) 12-Jun 9:30 AM 14-Jun 11:00 AM
Worcester
Color Date Plated Nematodes Found?
Red 24-May Yes (large, a lot)
Yellow 24-May Yes (small)
Green 24-May Yes
Blue 24-May Yes
Harvard
Color Date Plated Nematodes Found?
Yellow 24-May Yes
Purple 24-May Yes
Blue 24-May Yes
Green 24-May Yes
44
Royalston Tully Lake
Color Date Plated Nematodes Found?
Red 24-May Yes
Blue 24-May Yes
Bolton
Color Date Plated Nematodes Found?
blue 29-May Yes
Green 29-May Yes
Purple 29-May yes
Yellow 29-May yes
Royalston State Park
Color Date Plated Nematodes Found?
Green 29-May Yes
Yellow 29-May NO CHECK AGAIN
Red 29-May Yes
Blue 29-May Yes
Garden Bag
Color Date Plated Nematodes Found?
Blue 29-May Yes
Forest Bag
Color Date Plated Nematodes Found?
Yellow 29-May Yes
Holden
Color Date Plated Nematodes Found?
Yellow 31-May Yes
Purple 31-May Yes
Red 31-May Yes
Blue 31-May Yes
Blackstone
Color Date Plated Nematodes Found?
Yellow 31-May Yes
Red 31-May Yes
Purple 31-May Yes
Green 31-May Yes

45
Shrewsbury
Color Date Plated Nematodes Found?
Purple 31-May No
Green 31-May Yes, dead?
Blue 3-Jun No
Red 3-Jun No
Sturbridge
Color Date Plated Nematodes Found?
purple 3-Jun Yes
Yellow 3-Jun Yes
green 3-Jun yes
Red 3-Jun yes
Milford
Color Date Plated Nematodes Found?
Purple 3-Jun No
Green 3-Jun Yes
Red 3-Jun Yes
Blue 3-Jun Yes
Warren
Color Date Plated Nematodes Found?
Red 5-Jun Yes
Green 5-Jun Yes
Yellow 5-Jun No
Purple 5-Jun No
Lancaster
Color Date Plated Nematodes Found?
Green 5-Jun Yes
Purple 5-Jun Yes
Red 5-Jun Yes
Blue 5-Jun No
Gardner
Color Date Plated Nematodes Found?
Yellow 5-Jun Yes
Purple 5-Jun Yes
Green 7-Jun Yes
46
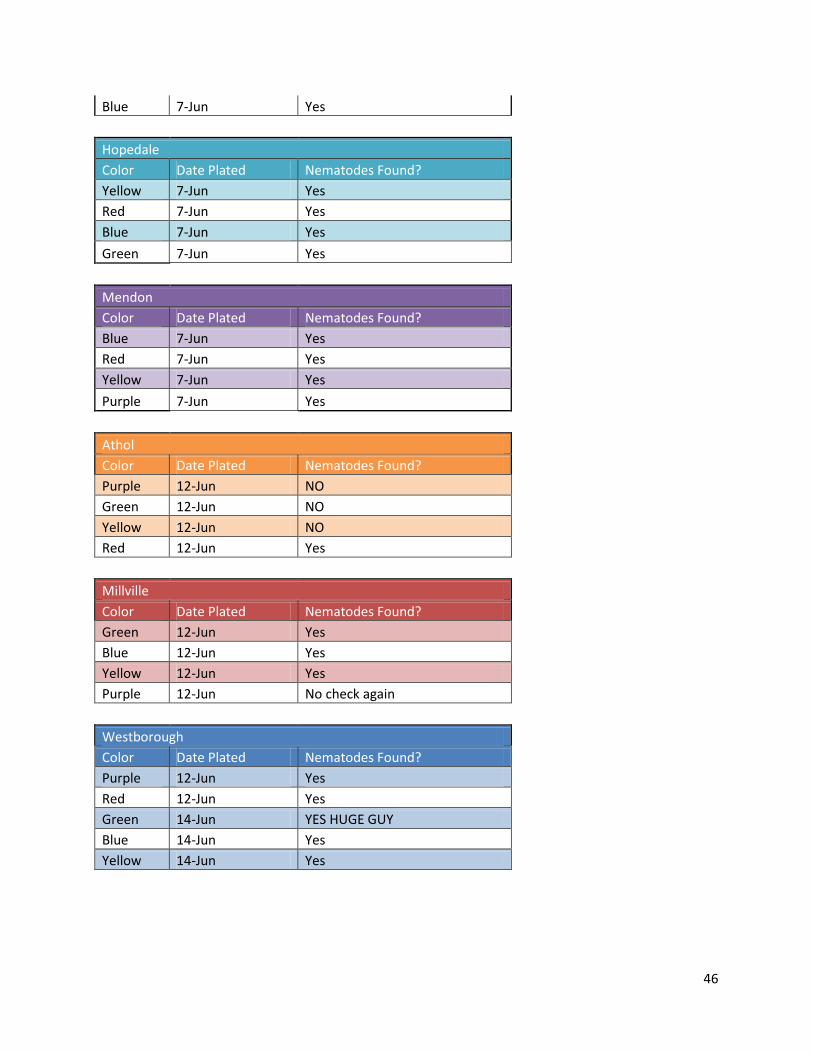
Blue 7-Jun Yes
Hopedale
Color Date Plated Nematodes Found?
Yellow 7-Jun Yes
Red 7-Jun Yes
Blue 7-Jun Yes
Green 7-Jun Yes
Mendon
Color Date Plated Nematodes Found?
Blue 7-Jun Yes
Red 7-Jun Yes
Yellow 7-Jun Yes
Purple 7-Jun Yes
Athol
Color Date Plated Nematodes Found?
Purple 12-Jun NO
Green 12-Jun NO
Yellow 12-Jun NO
Red 12-Jun Yes
Millville
Color Date Plated Nematodes Found?
Green 12-Jun Yes
Blue 12-Jun Yes
Yellow 12-Jun Yes
Purple 12-Jun No check again
Westborough
Color Date Plated Nematodes Found?
Purple 12-Jun Yes
Red 12-Jun Yes
Green 14-Jun YES HUGE GUY
Blue 14-Jun Yes
Yellow 14-Jun Yes
47
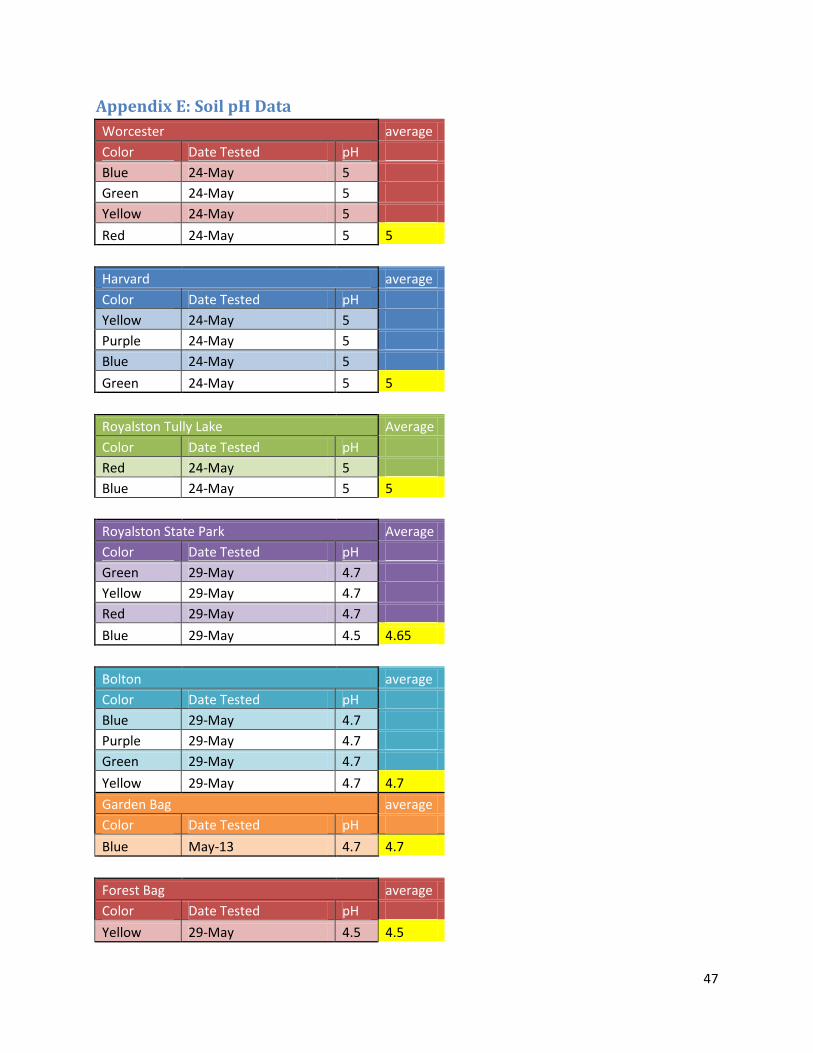
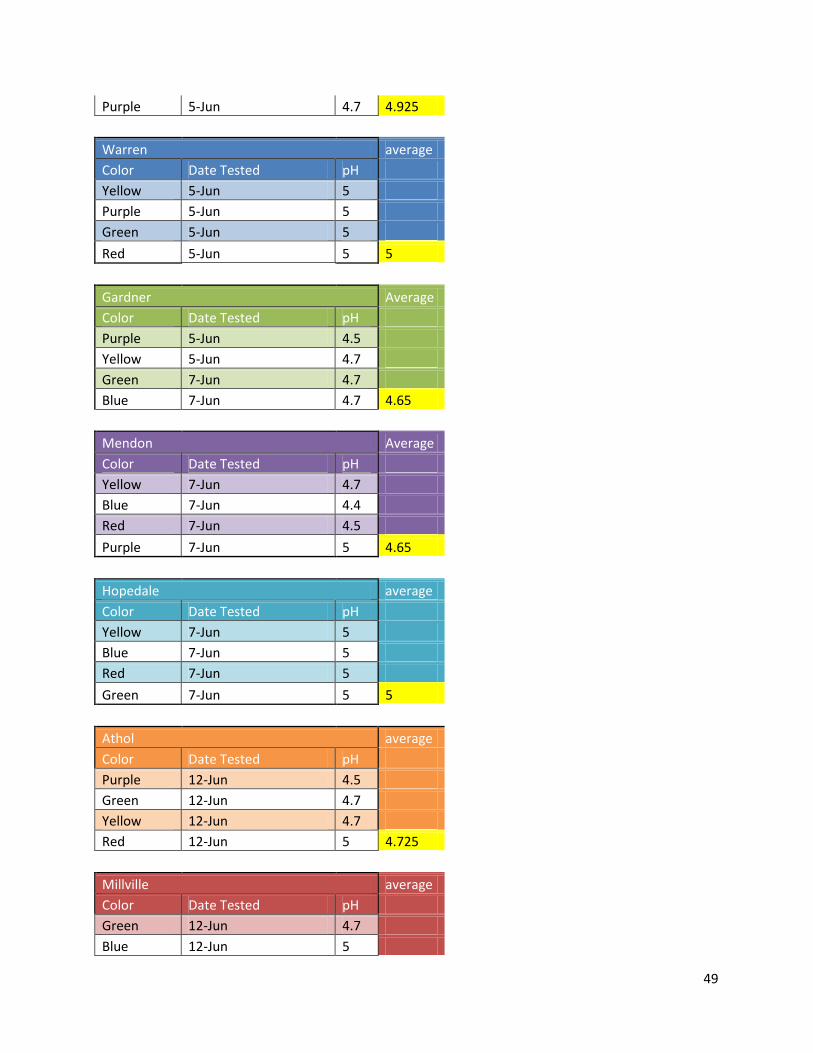
Appendix E: Soil pH Data
Worcester average
Color Date Tested pH
Blue 24-May 5
Green 24-May 5
Yellow 24-May 5
Red 24-May 5 5
Harvard average
Color Date Tested pH
Yellow 24-May 5
Purple 24-May 5
Blue 24-May 5
Green 24-May 5 5
Royalston Tully Lake Average
Color Date Tested pH
Red 24-May 5
Blue 24-May 5 5
Royalston State Park Average
Color Date Tested pH
Green 29-May 4.7
Yellow 29-May 4.7
Red 29-May 4.7
Blue 29-May 4.5 4.65
Bolton average
Color Date Tested pH
Blue 29-May 4.7
Purple 29-May 4.7
Green 29-May 4.7
Yellow 29-May 4.7 4.7
Garden Bag average
Color Date Tested pH
Blue May-13 4.7 4.7
Forest Bag average
Color Date Tested pH
Yellow 29-May 4.5 4.5
48
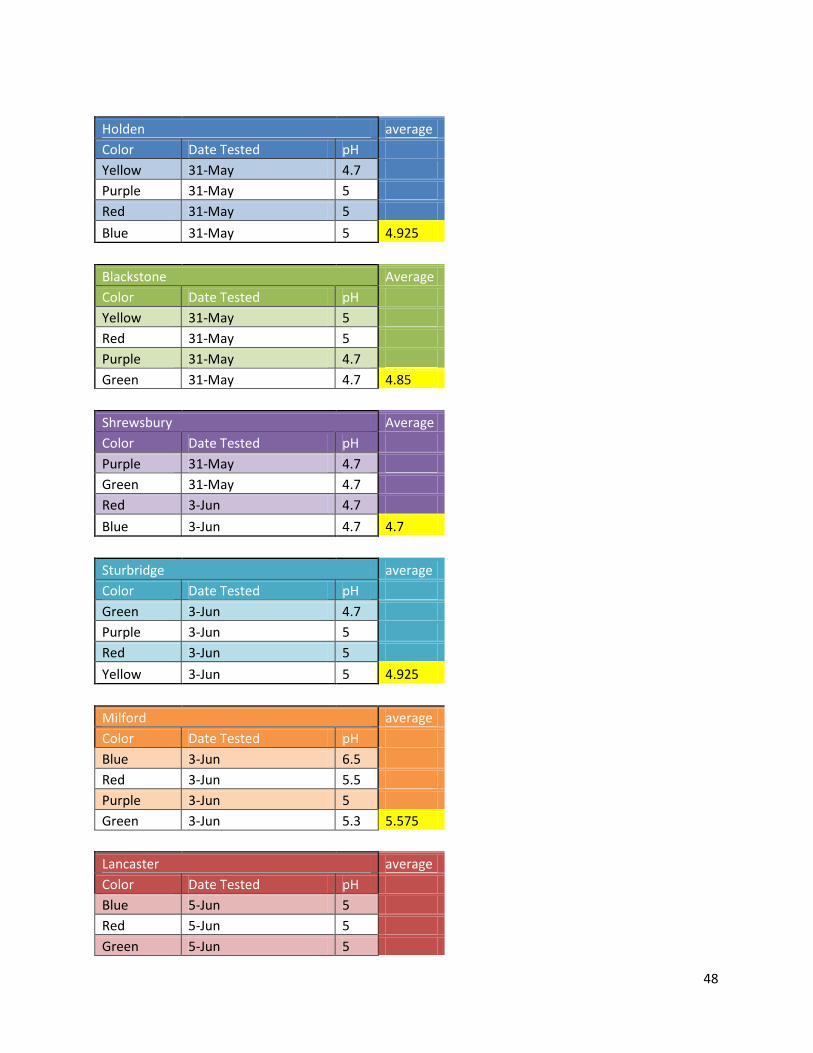
Holden average
Color Date Tested pH
Yellow 31-May 4.7
Purple 31-May 5
Red 31-May 5
Blue 31-May 5 4.925
Blackstone Average
Color Date Tested pH
Yellow 31-May 5
Red 31-May 5
Purple 31-May 4.7
Green 31-May 4.7 4.85
Shrewsbury Average
Color Date Tested pH
Purple 31-May 4.7
Green 31-May 4.7
Red 3-Jun 4.7
Blue 3-Jun 4.7 4.7
Sturbridge average
Color Date Tested pH
Green 3-Jun 4.7
Purple 3-Jun 5
Red 3-Jun 5
Yellow 3-Jun 5 4.925
Milford average
Color Date Tested pH
Blue 3-Jun 6.5
Red 3-Jun 5.5
Purple 3-Jun 5
Green 3-Jun 5.3 5.575
Lancaster average
Color Date Tested pH
Blue 5-Jun 5
Red 5-Jun 5
Green 5-Jun 5
49
Purple 5-Jun 4.7 4.925
Warren average
Color Date Tested pH
Yellow 5-Jun 5
Purple 5-Jun 5
Green 5-Jun 5
Red 5-Jun 5 5
Gardner Average
Color Date Tested pH
Purple 5-Jun 4.5
Yellow 5-Jun 4.7
Green 7-Jun 4.7
Blue 7-Jun 4.7 4.65
Mendon Average
Color Date Tested pH
Yellow 7-Jun 4.7
Blue 7-Jun 4.4
Red 7-Jun 4.5
Purple 7-Jun 5 4.65
Hopedale average
Color Date Tested pH
Yellow 7-Jun 5
Blue 7-Jun 5
Red 7-Jun 5
Green 7-Jun 5 5
Athol average
Color Date Tested pH
Purple 12-Jun 4.5
Green 12-Jun 4.7
Yellow 12-Jun 4.7
Red 12-Jun 5 4.725
Millville average
Color Date Tested pH
Green 12-Jun 4.7
Blue 12-Jun 5
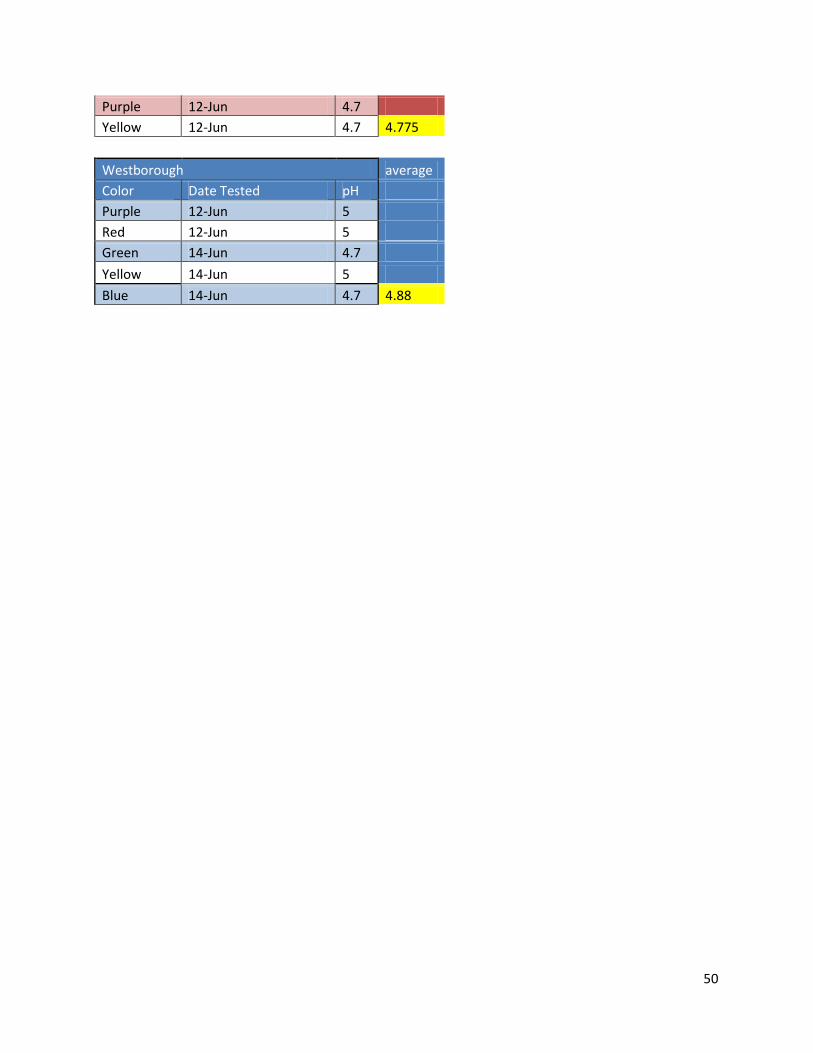
50
Purple 12-Jun 4.7
Yellow 12-Jun 4.7 4.775
Westborough average
Color Date Tested pH
Purple 12-Jun 5
Red 12-Jun 5
Green 14-Jun 4.7
Yellow 14-Jun 5
Blue 14-Jun 4.7 4.88
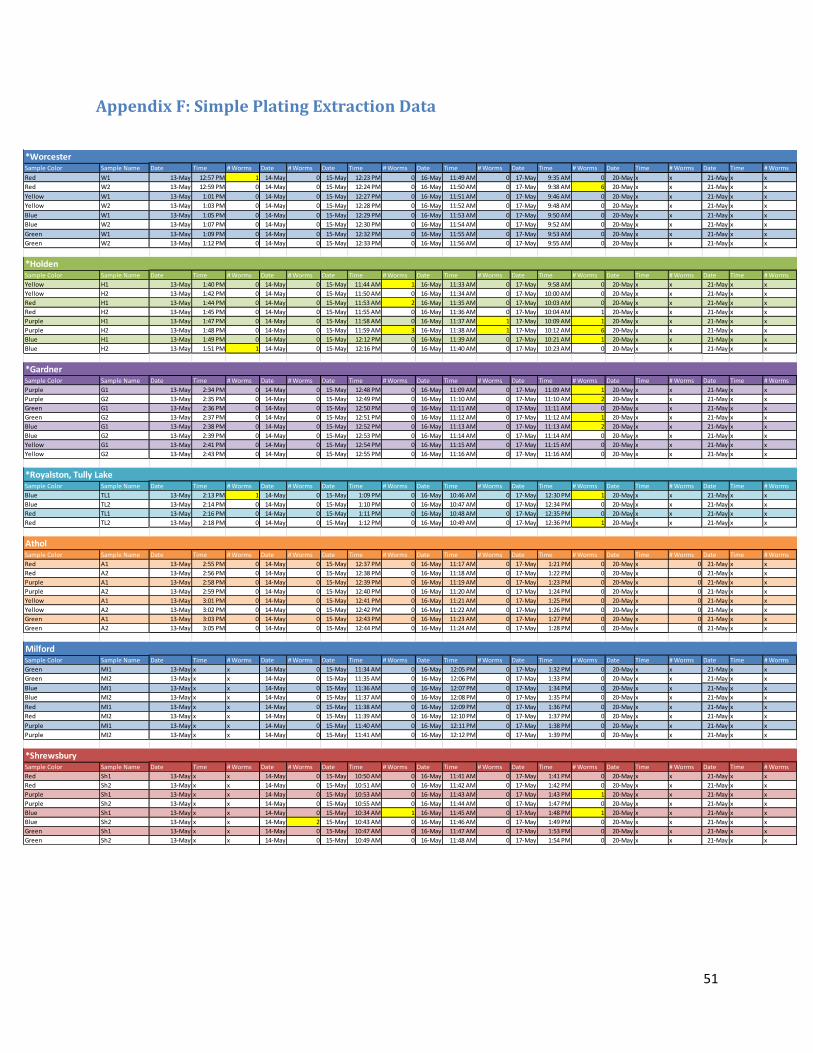
51
Appendix F: Simple Plating Extraction Data
Sample Color Sample Name Date Time # Worms Date # Worms Date Time # Worms Date Time # Worms Date Time # Worms Date Time # Worms Date Time # Worms
Red W1 13-May 12:57 PM 1 14-May 0 15-May 12:23 PM 0 16-May 11:49 AM 0 17-May 9:35 AM 0 20-May x x 21-May x x
Red W2 13-May 12:59 PM 0 14-May 0 15-May 12:24 PM 0 16-May 11:50 AM 0 17-May 9:38 AM 6 20-May x x 21-May x x
Yellow W1 13-May 1:01 PM 0 14-May 0 15-May 12:27 PM 0 16-May 11:51 AM 0 17-May 9:46 AM 0 20-May x x 21-May x x
Yellow W2 13-May 1:03 PM 0 14-May 0 15-May 12:28 PM 0 16-May 11:52 AM 0 17-May 9:48 AM 0 20-May x x 21-May x x
Blue W1 13-May 1:05 PM 0 14-May 0 15-May 12:29 PM 0 16-May 11:53 AM 0 17-May 9:50 AM 0 20-May x x 21-May x x
Blue W2 13-May 1:07 PM 0 14-May 0 15-May 12:30 PM 0 16-May 11:54 AM 0 17-May 9:52 AM 0 20-May x x 21-May x x
Green W1 13-May 1:09 PM 0 14-May 0 15-May 12:32 PM 0 16-May 11:55 AM 0 17-May 9:53 AM 0 20-May x x 21-May x x
Green W2 13-May 1:12 PM 0 14-May 0 15-May 12:33 PM 0 16-May 11:56 AM 0 17-May 9:55 AM 0 20-May x x 21-May x x
Sample Color Sample Name Date Time # Worms Date # Worms Date Time # Worms Date Time # Worms Date Time # Worms Date Time # Worms Date Time # Worms
Yellow H1 13-May 1:40 PM 0 14-May 0 15-May 11:44 AM 1 16-May 11:33 AM 0 17-May 9:58 AM 0 20-May x x 21-May x x
Yellow H2 13-May 1:42 PM 0 14-May 0 15-May 11:50 AM 0 16-May 11:34 AM 0 17-May 10:00 AM 0 20-May x x 21-May x x
Red H1 13-May 1:44 PM 0 14-May 0 15-May 11:53 AM 2 16-May 11:35 AM 0 17-May 10:03 AM 0 20-May x x 21-May x x
Red H2 13-May 1:45 PM 0 14-May 0 15-May 11:55 AM 0 16-May 11:36 AM 0 17-May 10:04 AM 1 20-May x x 21-May x x
Purple H1 13-May 1:47 PM 0 14-May 0 15-May 11:58 AM 0 16-May 11:37 AM 1 17-May 10:09 AM 1 20-May x x 21-May x x
Purple H2 13-May 1:48 PM 0 14-May 0 15-May 11:59 AM 3 16-May 11:38 AM 1 17-May 10:12 AM 6 20-May x x 21-May x x
Blue H1 13-May 1:49 PM 0 14-May 0 15-May 12:12 PM 0 16-May 11:39 AM 0 17-May 10:21 AM 1 20-May x x 21-May x x
Blue H2 13-May 1:51 PM 1 14-May 0 15-May 12:16 PM 0 16-May 11:40 AM 0 17-May 10:23 AM 0 20-May x x 21-May x x
Sample Color Sample Name Date Time # Worms Date # Worms Date Time # Worms Date Time # Worms Date Time # Worms Date Time # Worms Date Time # Worms
Purple G1 13-May 2:34 PM 0 14-May 0 15-May 12:48 PM 0 16-May 11:09 AM 0 17-May 11:09 AM 1 20-May x x 21-May x x
Purple G2 13-May 2:35 PM 0 14-May 0 15-May 12:49 PM 0 16-May 11:10 AM 0 17-May 11:10 AM 2 20-May x x 21-May x x
Green G1 13-May 2:36 PM 0 14-May 0 15-May 12:50 PM 0 16-May 11:11 AM 0 17-May 11:11 AM 0 20-May x x 21-May x x
Green G2 13-May 2:37 PM 0 14-May 0 15-May 12:51 PM 0 16-May 11:12 AM 0 17-May 11:12 AM 1 20-May x x 21-May x x
Blue G1 13-May 2:38 PM 0 14-May 0 15-May 12:52 PM 0 16-May 11:13 AM 0 17-May 11:13 AM 2 20-May x x 21-May x x
Blue G2 13-May 2:39 PM 0 14-May 0 15-May 12:53 PM 0 16-May 11:14 AM 0 17-May 11:14 AM 0 20-May x x 21-May x x
Yellow G1 13-May 2:41 PM 0 14-May 0 15-May 12:54 PM 0 16-May 11:15 AM 0 17-May 11:15 AM 0 20-May x x 21-May x x
Yellow G2 13-May 2:43 PM 0 14-May 0 15-May 12:55 PM 0 16-May 11:16 AM 0 17-May 11:16 AM 0 20-May x x 21-May x x
Sample Color Sample Name Date Time # Worms Date # Worms Date Time # Worms Date Time # Worms Date Time # Worms Date Time # Worms Date Time # Worms
Blue TL1 13-May 2:13 PM 1 14-May 0 15-May 1:09 PM 0 16-May 10:46 AM 0 17-May 12:30 PM 1 20-May x x 21-May x x
Blue TL2 13-May 2:14 PM 0 14-May 0 15-May 1:10 PM 0 16-May 10:47 AM 0 17-May 12:34 PM 0 20-May x x 21-May x x
Red TL1 13-May 2:16 PM 0 14-May 0 15-May 1:11 PM 0 16-May 10:48 AM 0 17-May 12:35 PM 0 20-May x x 21-May x x
Red TL2 13-May 2:18 PM 0 14-May 0 15-May 1:12 PM 0 16-May 10:49 AM 0 17-May 12:36 PM 1 20-May x x 21-May x x
Sample Color Sample Name Date Time # Worms Date # Worms Date Time # Worms Date Time # Worms Date Time # Worms Date Time # Worms Date Time # Worms
Red A1 13-May 2:55 PM 0 14-May 0 15-May 12:37 PM 0 16-May 11:17 AM 0 17-May 1:21 PM 0 20-May x 0 21-May x x
Red A2 13-May 2:56 PM 0 14-May 0 15-May 12:38 PM 0 16-May 11:18 AM 0 17-May 1:22 PM 0 20-May x 0 21-May x x
Purple A1 13-May 2:58 PM 0 14-May 0 15-May 12:39 PM 0 16-May 11:19 AM 0 17-May 1:23 PM 0 20-May x 0 21-May x x
Purple A2 13-May 2:59 PM 0 14-May 0 15-May 12:40 PM 0 16-May 11:20 AM 0 17-May 1:24 PM 0 20-May x 0 21-May x x
Yellow A1 13-May 3:01 PM 0 14-May 0 15-May 12:41 PM 0 16-May 11:21 AM 0 17-May 1:25 PM 0 20-May x 0 21-May x x
Yellow A2 13-May 3:02 PM 0 14-May 0 15-May 12:42 PM 0 16-May 11:22 AM 0 17-May 1:26 PM 0 20-May x 0 21-May x x
Green A1 13-May 3:03 PM 0 14-May 0 15-May 12:43 PM 0 16-May 11:23 AM 0 17-May 1:27 PM 0 20-May x 0 21-May x x
Green A2 13-May 3:05 PM 0 14-May 0 15-May 12:44 PM 0 16-May 11:24 AM 0 17-May 1:28 PM 0 20-May x 0 21-May x x
Sample Color Sample Name Date Time # Worms Date # Worms Date Time # Worms Date Time # Worms Date Time # Worms Date Time # Worms Date Time # Worms
Green MI1 13-May x x 14-May 0 15-May 11:34 AM 0 16-May 12:05 PM 0 17-May 1:32 PM 0 20-May x x 21-May x x
Green MI2 13-May x x 14-May 0 15-May 11:35 AM 0 16-May 12:06 PM 0 17-May 1:33 PM 0 20-May x x 21-May x x
Blue MI1 13-May x x 14-May 0 15-May 11:36 AM 0 16-May 12:07 PM 0 17-May 1:34 PM 0 20-May x x 21-May x x
Blue MI2 13-May x x 14-May 0 15-May 11:37 AM 0 16-May 12:08 PM 0 17-May 1:35 PM 0 20-May x x 21-May x x
Red MI1 13-May x x 14-May 0 15-May 11:38 AM 0 16-May 12:09 PM 0 17-May 1:36 PM 0 20-May x x 21-May x x
Red MI2 13-May x x 14-May 0 15-May 11:39 AM 0 16-May 12:10 PM 0 17-May 1:37 PM 0 20-May x x 21-May x x
Purple MI1 13-May x x 14-May 0 15-May 11:40 AM 0 16-May 12:11 PM 0 17-May 1:38 PM 0 20-May x x 21-May x x
Purple MI2 13-May x x 14-May 0 15-May 11:41 AM 0 16-May 12:12 PM 0 17-May 1:39 PM 0 20-May x x 21-May x x
Sample Color Sample Name Date Time # Worms Date # Worms Date Time # Worms Date Time # Worms Date Time # Worms Date Time # Worms Date Time # Worms
Red Sh1 13-May x x 14-May 0 15-May 10:50 AM 0 16-May 11:41 AM 0 17-May 1:41 PM 0 20-May x x 21-May x x
Red Sh2 13-May x x 14-May 0 15-May 10:51 AM 0 16-May 11:42 AM 0 17-May 1:42 PM 0 20-May x x 21-May x x
Purple Sh1 13-May x x 14-May 0 15-May 10:53 AM 0 16-May 11:43 AM 0 17-May 1:43 PM 1 20-May x x 21-May x x
Purple Sh2 13-May x x 14-May 0 15-May 10:55 AM 0 16-May 11:44 AM 0 17-May 1:47 PM 0 20-May x x 21-May x x
Blue Sh1 13-May x x 14-May 0 15-May 10:34 AM 1 16-May 11:45 AM 0 17-May 1:48 PM 1 20-May x x 21-May x x
Blue Sh2 13-May x x 14-May 2 15-May 10:43 AM 0 16-May 11:46 AM 0 17-May 1:49 PM 0 20-May x x 21-May x x
Green Sh1 13-May x x 14-May 0 15-May 10:47 AM 0 16-May 11:47 AM 0 17-May 1:53 PM 0 20-May x x 21-May x x
Green Sh2 13-May x x 14-May 0 15-May 10:49 AM 0 16-May 11:48 AM 0 17-May 1:54 PM 0 20-May x x 21-May x x
*Shrewsbury
Milford
Athol
*Royalston, Tully Lake
*Gardner
*Worcester
*Holden

52
Sample Color Sample Name Date Time # Worms Date # Worms Date Time # Worms Date Time # Worms Date Time # Worms Date Time # Worms Date Time # Worms
Yellow RP1 13-May x x 14-May 1 15-May 12:59 PM 0 16-May 10:51 AM 0 17-May x x 20-May 9:23 AM 0 21-May x x
Yellow RP2 13-May x x 14-May 0 15-May 1:00 PM 0 16-May 10:52 AM 0 17-May x x 20-May 9:24 AM 1 21-May x x
Green RP1 13-May x x 14-May 0 15-May 1:01 PM 0 16-May 10:53 AM 0 17-May x x 20-May 9:30 AM 20 21-May x x
Green RP2 13-May x x 14-May 0 15-May 1:02 PM 0 16-May 10:54 AM 0 17-May x x 20-May 10:20 AM 2 21-May x x
Red RP1 13-May x x 14-May 0 15-May 1:03 PM 0 16-May 10:55 AM 0 17-May x x 20-May 10:28 AM 0 21-May x x
Red RP2 13-May x x 14-May 2 15-May 1:04 PM 0 16-May 10:56 AM 0 17-May x x 20-May 10:29 AM 0 21-May x x
Blue RP1 13-May x x 14-May 0 15-May 1:05 PM 0 16-May 10:57 AM 0 17-May x x 20-May 10:30 AM 0 21-May x x
Blue RP2 13-May x x 14-May 0 15-May 1:07 PM 0 16-May 10:58 AM 0 17-May x x 20-May 10:31 AM 0 21-May x x
Sample Color Sample Name Date Time # Worms Date # Worms Date Time # Worms Date Time # Worms Date Time # Worms Date Time # Worms Date Time # Worms
Red HD1 13-May x x 14-May 0 15-May 11:25 AM 0 16-May 11:15 AM 0 17-May x x 20-May 10:36 AM 9 21-May x x
Red HD2 13-May x x 14-May 0 15-May 11:26 AM 0 16-May 11:26 AM 0 17-May x x 20-May 11:00 AM 2 21-May x x
Blue HD1 13-May x x 14-May 0 15-May 11:27 AM 0 16-May 11:27 AM 0 17-May x x 20-May 11:05 AM 10 21-May x x
Blue HD2 13-May x x 14-May 0 15-May 11:28 AM 0 16-May 11:28 AM 1 17-May x x 20-May 11:32 AM 10 21-May x x
Green HD1 13-May x x 14-May 0 15-May 11:29 AM 0 16-May 11:29 AM 0 17-May x x 20-May 12:01 PM 0 21-May x x
Green HD2 13-May x x 14-May 0 15-May 11:30 AM 0 16-May 11:30 AM 0 17-May x x 20-May 12:02 PM 0 21-May x x
Yellow HD1 13-May x x 14-May 0 15-May 11:31 AM 0 16-May 11:31 AM 0 17-May x x 20-May 12:03 PM 0 21-May x x
Yellow HD2 13-May x x 14-May 0 15-May 11:32 AM 0 16-May 11:32 AM 0 17-May x x 20-May 12:04 PM 0 21-May x x
Sample Color Sample Name Date Time # Worms Date # Worms Date Time # Worms Date Time # Worms Date Time # Worms Date Time # Worms Date Time # Worms
Purple MN1 13-May x x 14-May 0 15-May 9:51 AM 0 16-May 11:01 AM 0 17-May x x 20-May x x 21-May x x
Purple MN2 13-May x x 14-May 0 15-May 9:54 AM 0 16-May 11:02 AM 0 17-May x x 20-May x x 21-May x x
Yellow MN1 13-May x x 14-May 0 15-May 9:55 AM 0 16-May 11:03 AM 0 17-May x x 20-May x x 21-May x x
Yellow MN2 13-May x x 14-May 0 15-May 9:56 AM 0 16-May 11:04 AM 0 17-May x x 20-May x x 21-May x x
Blue MN1 13-May x x 14-May 3 15-May 9:58 AM 0 16-May 11:05 AM 0 17-May x x 20-May x x 21-May x x
Blue MN2 13-May x x 14-May 2 15-May 10:10 AM 0 16-May 11:06 AM 0 17-May x x 20-May x x 21-May x x
Red MN1 13-May x x 14-May 0 15-May 10:12 AM 2 16-May 11:07 AM 0 17-May x x 20-May x x 21-May x x
Red MN2 13-May x x 14-May 0 15-May 10:28 AM 0 16-May 11:08 AM 0 17-May x x 20-May x x 21-May x x
*Mendon
*Hopedale
*Royalston State Park
Sample Color Sample Name Date Time # Worms Date # Worms Date Time # Worms Date Time # Worms Date Time # Worms Date Time # Worms Date Time # Worms
Green MV1 13-May x x 14-May x 15-May 9:06 AM 0 16-May 11:57 AM 0 17-May x x 20-May x x 21-May 9:20 AM 10
Green MV2 13-May x x 14-May x 15-May 9:08 AM 0 16-May 11:58 AM 0 17-May x x 20-May x x 21-May 9:34 AM 10
Blue MV1 13-May x x 14-May x 15-May 9:12 AM 0 16-May 11:59 AM 0 17-May x x 20-May x x 21-May 9:44 AM 10
Blue MV2 13-May x x 14-May x 15-May 9:15 AM 0 16-May 12:00 PM 0 17-May x x 20-May x x 21-May 9:51 AM 4
Purple MV1 13-May x x 14-May x 15-May 9:17 AM 0 16-May 12:01 PM 0 17-May x x 20-May x x 21-May 9:58 AM 0
Purple MV2 13-May x x 14-May x 15-May 9:19 AM 0 16-May 12:02 PM 0 17-May x x 20-May x x 21-May 9:59 AM 0
Yellow MV1 13-May x x 14-May x 15-May 9:21 AM 0 16-May 12:03 PM 2 17-May x x 20-May x x 21-May 10:00 AM 12:00 AM
Yellow MV2 13-May x x 14-May x 15-May 9:23 AM 0 16-May 12:04 PM 0 17-May x x 20-May x x 21-May 10:09 AM 1
Sample Color Sample Name Date Time # Worms Date # Worms Date Time # Worms Date Time # Worms Date Time # Worms Date Time # Worms Date Time # Worms
Purple BL1 13-May x x 14-May x 15-May 9:31 AM 0 16-May 12:13 PM 0 17-May x x 20-May x x 21-May 12:16 PM 0
Purple BL2 13-May x x 14-May x 15-May 9:32 AM 0 16-May 12:14 PM 0 17-May x x 20-May x x 21-May 12:17 PM 0
Red BL1 13-May x x 14-May x 15-May 9:37 AM 0 16-May 12:15 PM 0 17-May x x 20-May x x 21-May 12:18 PM 3
Red BL2 13-May x x 14-May x 15-May 9:38 AM 0 16-May 12:16 PM 0 17-May x x 20-May x x 21-May 12:20 PM 0
Yellow BL1 13-May x x 14-May x 15-May 9:40 AM 0 16-May 12:17 PM 0 17-May x x 20-May x x 21-May 12:25 PM 0
Yellow BL2 13-May x x 14-May x 15-May 9:41 AM 0 16-May 12:18 PM 0 17-May x x 20-May x x 21-May 12:27 PM 0
Green BL1 13-May x x 14-May x 15-May 9:42 AM 0 16-May 12:19 PM 0 17-May x x 20-May x x 21-May 12:29 PM 0
Green BL2 13-May x x 14-May x 15-May 9:44 AM 0 16-May 12:20 PM 0 17-May x x 20-May x x 21-May 12:26 PM 2
Sample Color Sample Name Date Time # Worms Date # Worms Date Time # Worms Date Time # Worms Date Time # Worms Date Time # Worms Date Time # Worms
Red WA1 13-May x x 14-May x 15-May 2:10 PM 0 16-May 10:24 AM 0 17-May x x 20-May x x 21-May 11:23 AM 16
Red WA2 13-May x x 14-May x 15-May 2:11 PM 0 16-May 10:25 AM 0 17-May x x 20-May x x 21-May 11:33 AM 0
Purple WA1 13-May x x 14-May x 15-May 2:12 PM 0 16-May 10:26 AM 0 17-May x x 20-May x x 21-May 11:34 AM 0
Purple WA2 13-May x x 14-May x 15-May 2:13 PM 0 16-May 10:27 AM 0 17-May x x 20-May x x 21-May 11:35 AM 0
Yellow WA1 13-May x x 14-May x 15-May 2:14 PM 0 16-May 10:28 AM 0 17-May x x 20-May x x 21-May 11:36 AM 0
Yellow WA2 13-May x x 14-May x 15-May 2:15 PM 0 16-May 10:29 AM 0 17-May x x 20-May x x 21-May 11:37 AM 3
Green WA1 13-May x x 14-May x 15-May 2:16 PM 0 16-May 10:30 AM 0 17-May x x 20-May x x 21-May 11:43 AM 4
Green WA2 13-May x x 14-May x 15-May 2:17 PM 0 16-May 10:31 AM 1 17-May x x 20-May x x 21-May 11:52 AM 0
*SturbridgeSample Color Sample Name Date Time # Worms Date # Worms Date Time # Worms Date Time # Worms Date Time # Worms Date Time # Worms Date Time # Worms
Purple St1 13-May x x 14-May x 15-May 2:19 PM 0 16-May 10:37 AM 0 17-May x x 20-May x x 21-May 10:51 AM 0
Purple St2 13-May x x 14-May x 15-May 2:20 PM 0 16-May 10:38 AM 1 17-May x x 20-May x x 21-May 10:52 AM 0
Green St1 13-May x x 14-May x 15-May 2:21 PM 0 16-May 10:39 AM 0 17-May x x 20-May x x 21-May 10:53 AM 0
Green St2 13-May x x 14-May x 15-May 2:22 PM 2 16-May 10:40 AM 0 17-May x x 20-May x x 21-May 10:54 AM 0
Red St1 13-May x x 14-May x 15-May 2:24 PM 0 16-May 10:41 AM 0 17-May x x 20-May x x 21-May 10:55 AM 0
Red St2 13-May x x 14-May x 15-May 2:25 PM 0 16-May 10:42 AM 0 17-May x x 20-May x x 21-May 10:56 AM 1
Yellow St1 13-May x x 14-May x 15-May 2:26 PM 0 16-May 10:43 AM 0 17-May x x 20-May x x 21-May 11:00 AM 0
Yellow St2 13-May x x 14-May x 15-May 2:27 PM 0 16-May 10:44 AM 0 17-May x x 20-May x x 21-May 11:01 AM 2
Sample Color Sample Name Date Time # Worms Date # Worms Date Time # Worms Date Time # Worms Date Time # Worms Date Time # Worms Date Time # Worms
Purple Ha1 13-May x x 14-May x 15-May 2:29 PM 1 16-May 10:13 AM 0 17-May x x 20-May x x 21-May 10:19 AM 0
Purple Ha2 13-May x x 14-May x 15-May 2:30 PM 0 16-May 10:14 AM 0 17-May x x 20-May x x 21-May 10:20 AM 0
Blue Ha1 13-May x x 14-May x 15-May 2:31 PM 0 16-May 10:15 AM 0 17-May x x 20-May x x 21-May 10:21 AM 4
Blue Ha2 13-May x x 14-May x 15-May 2:32 PM 0 16-May 10:16 AM 0 17-May x x 20-May x x 21-May 10:30 AM 0
Green Ha1 13-May x x 14-May x 15-May 2:33 PM 0 16-May 10:17 AM 0 17-May x x 20-May x x 21-May 10:31 AM 0
Green Ha2 13-May x x 14-May x 15-May 2:34 PM 0 16-May 10:18 AM 0 17-May x x 20-May x x 21-May 10:32 AM 0
Yellow Ha1 13-May x x 14-May x 15-May 2:35 PM 0 16-May 10:19 AM 0 17-May x x 20-May x x 21-May 10:33 AM 0
Yellow Ha2 13-May x x 14-May x 15-May 2:36 PM 0 16-May 10:20 AM 0 17-May x x 20-May x x 21-May 10:34 AM 4
Sample Color Sample Name Date Time # Worms Date # Worms Date Time # Worms Date Time # Worms Date Time # Worms Date Time # Worms Date Time # Worms
Purple L1 13-May x x 14-May x 15-May 2:37 PM 0 16-May 10:02 AM 0 17-May x x 20-May x x 21-May 11:11 AM 0
Purple L2 13-May x x 14-May x 15-May 2:38 PM 0 16-May 10:03 AM 0 17-May x x 20-May x x 21-May 11:12 AM 0
Green L1 13-May x x 14-May x 15-May 2:39 PM 0 16-May 10:04 AM 0 17-May x x 20-May x x 21-May 11:13 AM 0
Green L2 13-May x x 14-May x 15-May 2:40 PM 0 16-May 10:05 AM 0 17-May x x 20-May x x 21-May 11:14 AM 6
Blue L1 13-May x x 14-May x 15-May 2:41 PM 0 16-May 10:06 AM 0 17-May x x 20-May x x 21-May 11:20 AM 0
Blue L2 13-May x x 14-May x 15-May 2:42 PM 0 16-May 10:07 AM 0 17-May x x 20-May x x 21-May 11:21 AM 0
Red L1 13-May x x 14-May x 15-May 2:43 PM 0 16-May 10:08 AM 0 17-May x x 20-May x x 21-May 11:09 AM 4
Red L2 13-May x x 14-May x 15-May 2:44 PM 0 16-May 10:09 AM 0 17-May x x 20-May x x 21-May 11:08 AM 2
*Millville
*Harvard
*Lancaster
*Warren
*Blackstone
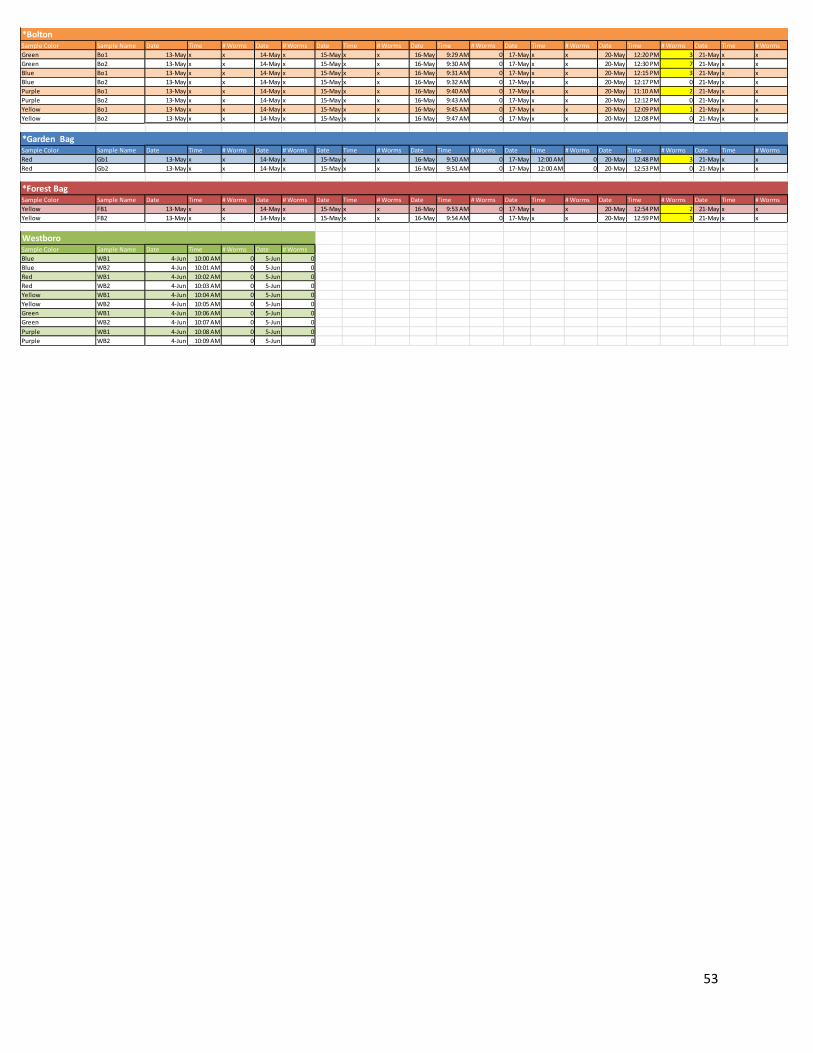
53
Sample Color Sample Name Date Time # Worms Date # Worms Date Time # Worms Date Time # Worms Date Time # Worms Date Time # Worms Date Time # Worms
Green Bo1 13-May x x 14-May x 15-May x x 16-May 9:29 AM 0 17-May x x 20-May 12:20 PM 3 21-May x x
Green Bo2 13-May x x 14-May x 15-May x x 16-May 9:30 AM 0 17-May x x 20-May 12:30 PM 7 21-May x x
Blue Bo1 13-May x x 14-May x 15-May x x 16-May 9:31 AM 0 17-May x x 20-May 12:15 PM 3 21-May x x
Blue Bo2 13-May x x 14-May x 15-May x x 16-May 9:32 AM 0 17-May x x 20-May 12:17 PM 0 21-May x x
Purple Bo1 13-May x x 14-May x 15-May x x 16-May 9:40 AM 0 17-May x x 20-May 11:10 AM 2 21-May x x
Purple Bo2 13-May x x 14-May x 15-May x x 16-May 9:43 AM 0 17-May x x 20-May 12:12 PM 0 21-May x x
Yellow Bo1 13-May x x 14-May x 15-May x x 16-May 9:45 AM 0 17-May x x 20-May 12:09 PM 1 21-May x x
Yellow Bo2 13-May x x 14-May x 15-May x x 16-May 9:47 AM 0 17-May x x 20-May 12:08 PM 0 21-May x x
Sample Color Sample Name Date Time # Worms Date # Worms Date Time # Worms Date Time # Worms Date Time # Worms Date Time # Worms Date Time # Worms
Red Gb1 13-May x x 14-May x 15-May x x 16-May 9:50 AM 0 17-May 12:00 AM 0 20-May 12:48 PM 3 21-May x x
Red Gb2 13-May x x 14-May x 15-May x x 16-May 9:51 AM 0 17-May 12:00 AM 0 20-May 12:53 PM 0 21-May x x
Sample Color Sample Name Date Time # Worms Date # Worms Date Time # Worms Date Time # Worms Date Time # Worms Date Time # Worms Date Time # Worms
Yellow FB1 13-May x x 14-May x 15-May x x 16-May 9:53 AM 0 17-May x x 20-May 12:54 PM 2 21-May x x
Yellow FB2 13-May x x 14-May x 15-May x x 16-May 9:54 AM 0 17-May x x 20-May 12:59 PM 3 21-May x x
WestboroSample Color Sample Name Date Time # Worms Date # Worms
Blue WB1 4-Jun 10:00 AM 0 5-Jun 0
Blue WB2 4-Jun 10:01 AM 0 5-Jun 0
Red WB1 4-Jun 10:02 AM 0 5-Jun 0
Red WB2 4-Jun 10:03 AM 0 5-Jun 0
Yellow WB1 4-Jun 10:04 AM 0 5-Jun 0
Yellow WB2 4-Jun 10:05 AM 0 5-Jun 0
Green WB1 4-Jun 10:06 AM 0 5-Jun 0
Green WB2 4-Jun 10:07 AM 0 5-Jun 0
Purple WB1 4-Jun 10:08 AM 0 5-Jun 0
Purple WB2 4-Jun 10:09 AM 0 5-Jun 0
*Forest Bag
*Bolton
*Garden Bag
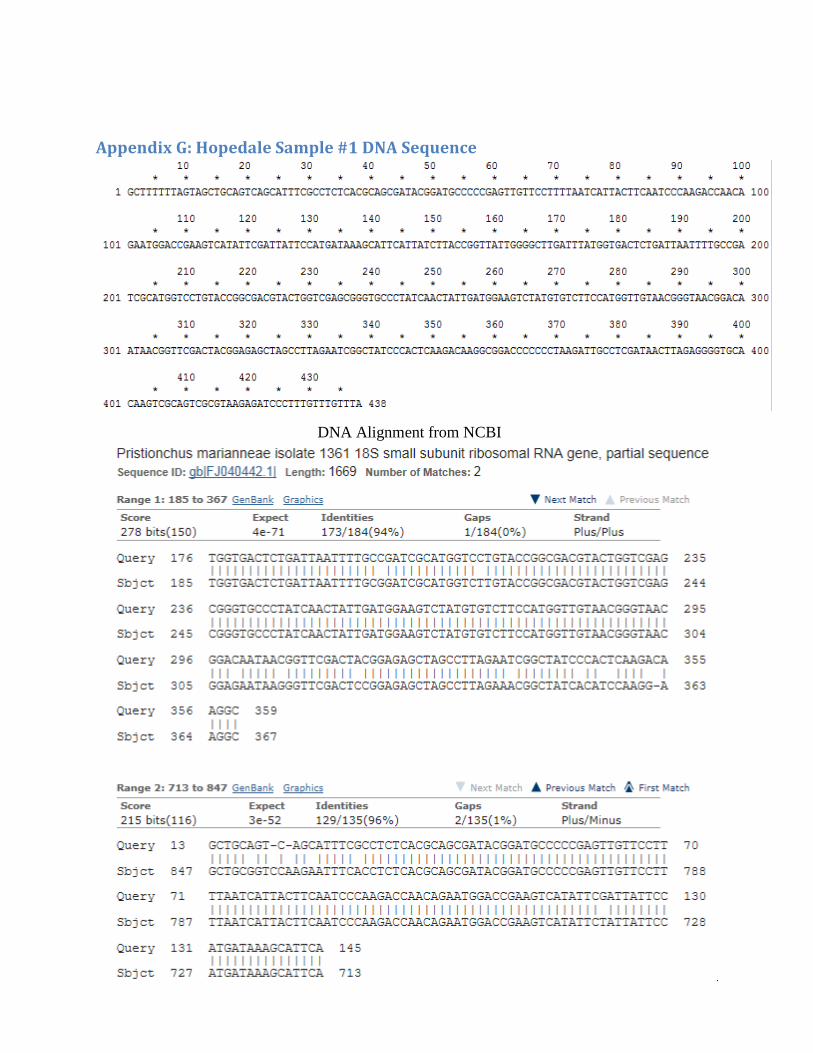
54
Appendix G: Hopedale Sample #1 DNA Sequence
DNA Alignment from NCBI
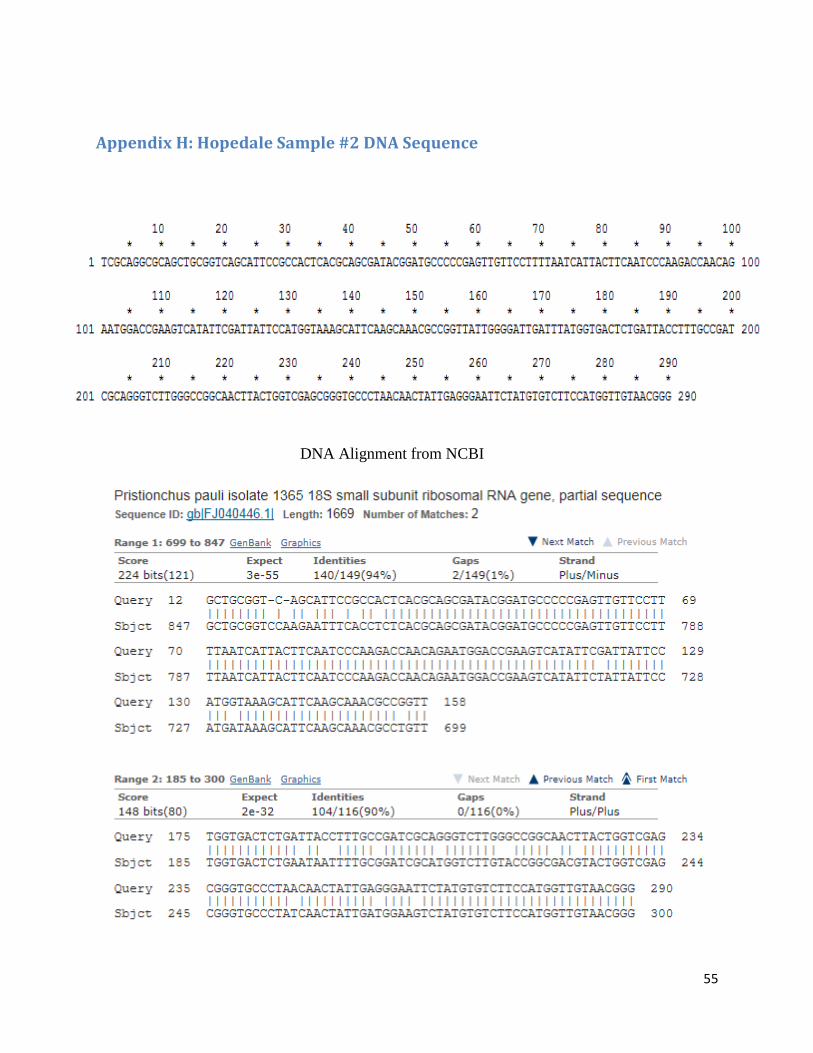
55
Appendix H: Hopedale Sample #2 DNA Sequence
DNA Alignment from NCBI
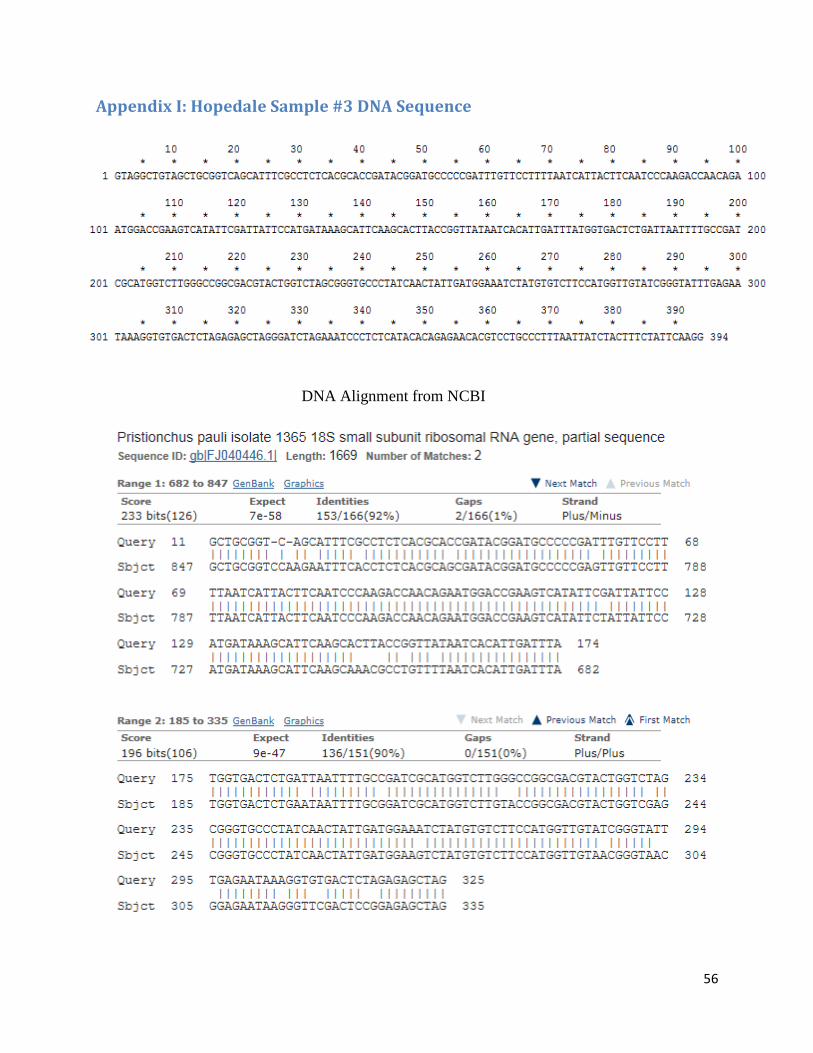
56
Appendix I: Hopedale Sample #3 DNA Sequence
DNA Alignment from NCBI
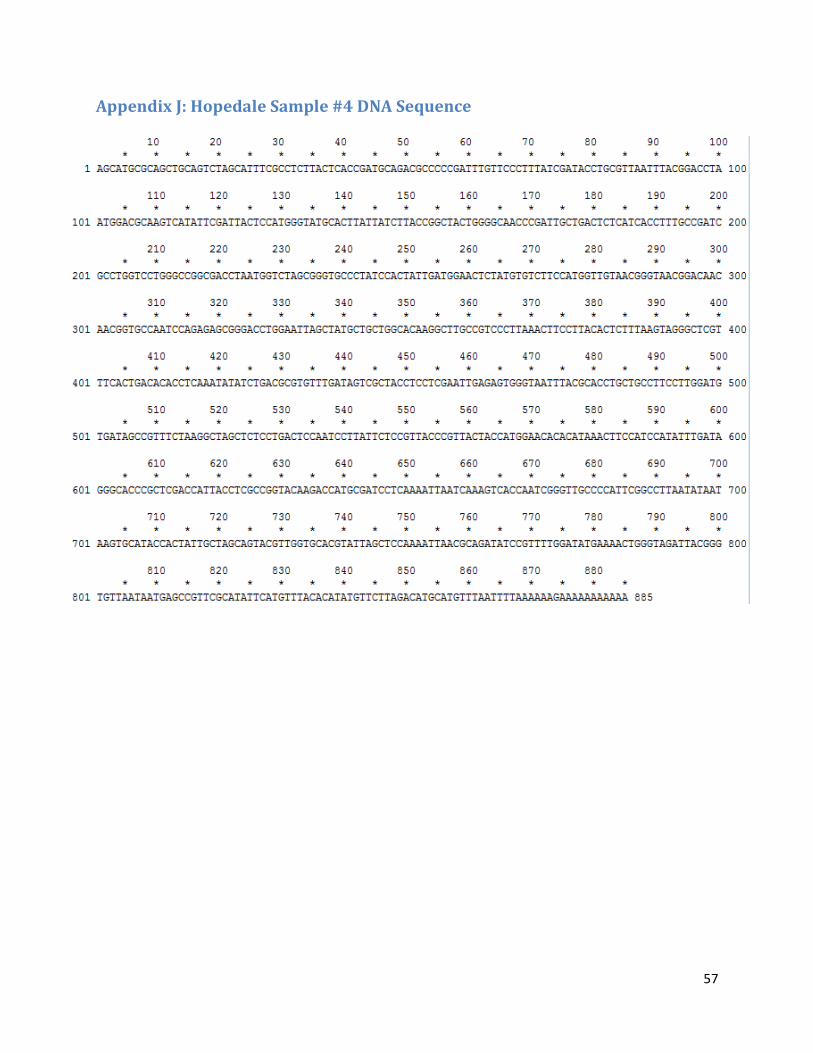
57
Appendix J: Hopedale Sample #4 DNA Sequence
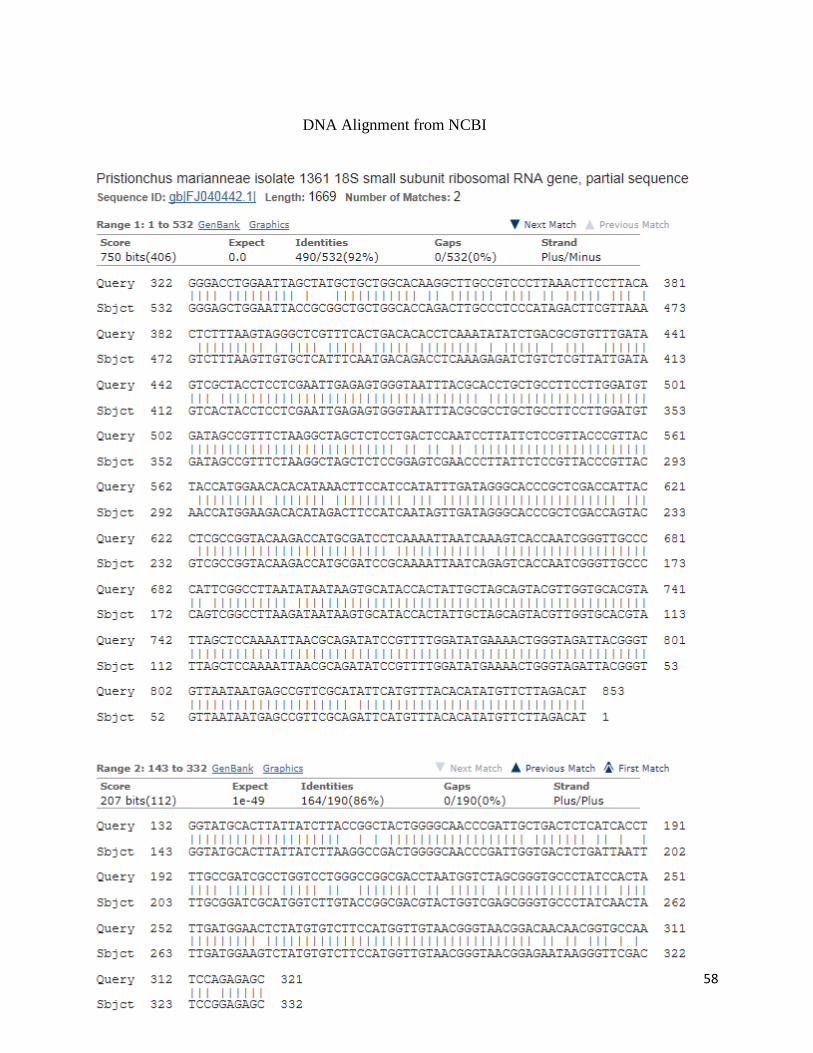
58
DNA Alignment from NCBI

59
Appendix K: Hopedale Sample #5 DNA Sequence
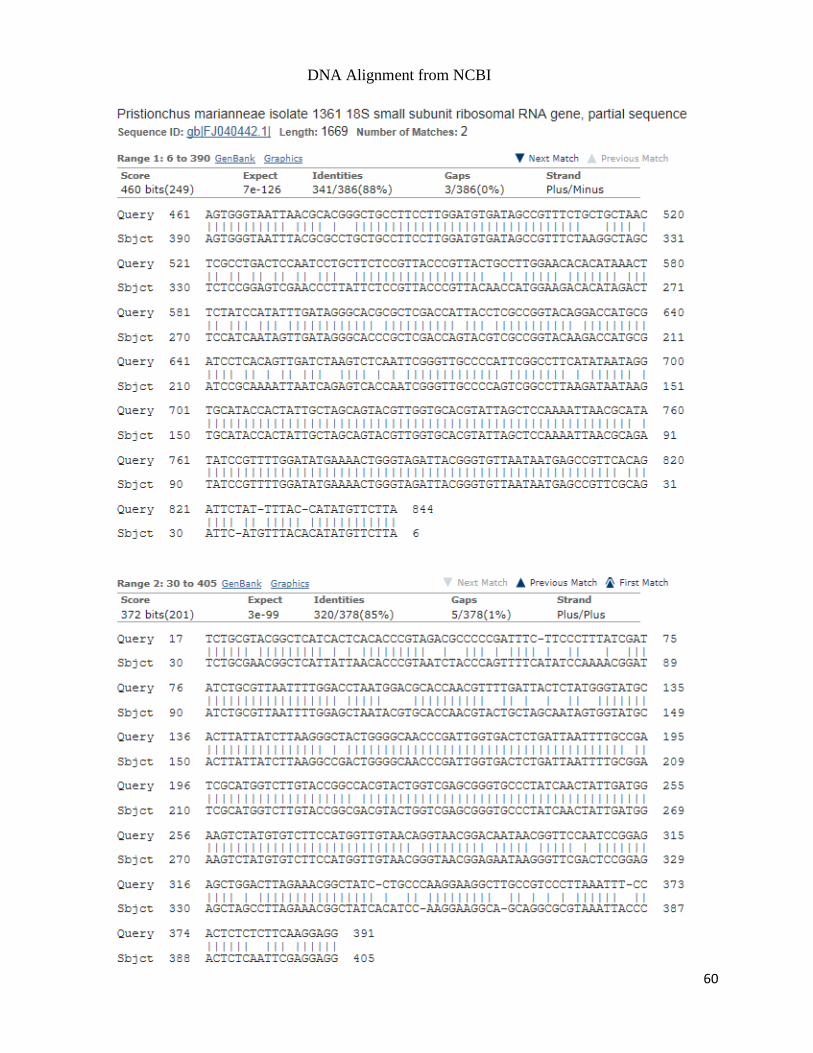
60
DNA Alignment from NCBI
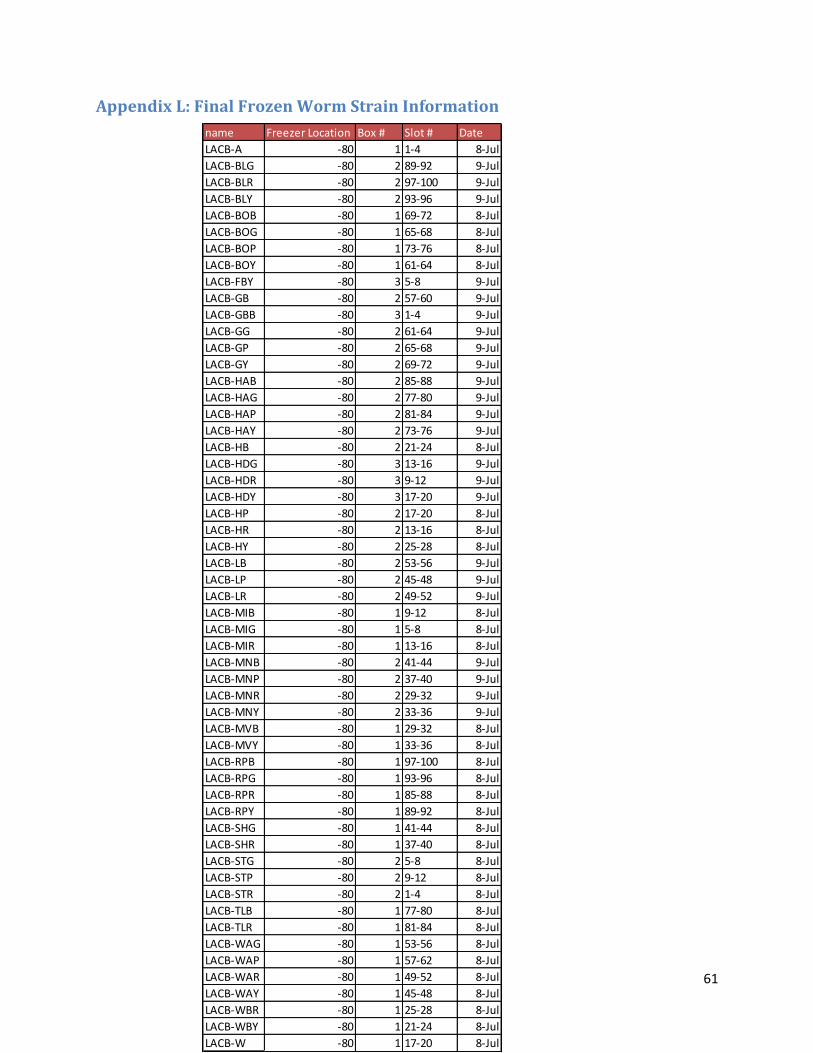
61
Appendix L: Final Frozen Worm Strain Information
name Freezer Location Box # Slot # Date
LACB-A -80 1 1-4 8-Jul
LACB-BLG -80 2 89-92 9-Jul
LACB-BLR -80 2 97-100 9-Jul
LACB-BLY -80 2 93-96 9-Jul
LACB-BOB -80 1 69-72 8-Jul
LACB-BOG -80 1 65-68 8-Jul
LACB-BOP -80 1 73-76 8-Jul
LACB-BOY -80 1 61-64 8-Jul
LACB-FBY -80 3 5-8 9-Jul
LACB-GB -80 2 57-60 9-Jul
LACB-GBB -80 3 1-4 9-Jul
LACB-GG -80 2 61-64 9-Jul
LACB-GP -80 2 65-68 9-Jul
LACB-GY -80 2 69-72 9-Jul
LACB-HAB -80 2 85-88 9-Jul
LACB-HAG -80 2 77-80 9-Jul
LACB-HAP -80 2 81-84 9-Jul
LACB-HAY -80 2 73-76 9-Jul
LACB-HB -80 2 21-24 8-Jul
LACB-HDG -80 3 13-16 9-Jul
LACB-HDR -80 3 9-12 9-Jul
LACB-HDY -80 3 17-20 9-Jul
LACB-HP -80 2 17-20 8-Jul
LACB-HR -80 2 13-16 8-Jul
LACB-HY -80 2 25-28 8-Jul
LACB-LB -80 2 53-56 9-Jul
LACB-LP -80 2 45-48 9-Jul
LACB-LR -80 2 49-52 9-Jul
LACB-MIB -80 1 9-12 8-Jul
LACB-MIG -80 1 5-8 8-Jul
LACB-MIR -80 1 13-16 8-Jul
LACB-MNB -80 2 41-44 9-Jul
LACB-MNP -80 2 37-40 9-Jul
LACB-MNR -80 2 29-32 9-Jul
LACB-MNY -80 2 33-36 9-Jul
LACB-MVB -80 1 29-32 8-Jul
LACB-MVY -80 1 33-36 8-Jul
LACB-RPB -80 1 97-100 8-Jul
LACB-RPG -80 1 93-96 8-Jul
LACB-RPR -80 1 85-88 8-Jul
LACB-RPY -80 1 89-92 8-Jul
LACB-SHG -80 1 41-44 8-Jul
LACB-SHR -80 1 37-40 8-Jul
LACB-STG -80 2 5-8 8-Jul
LACB-STP -80 2 9-12 8-Jul
LACB-STR -80 2 1-4 8-Jul
LACB-TLB -80 1 77-80 8-Jul
LACB-TLR -80 1 81-84 8-Jul
LACB-WAG -80 1 53-56 8-Jul
LACB-WAP -80 1 57-62 8-Jul
LACB-WAR -80 1 49-52 8-Jul
LACB-WAY -80 1 45-48 8-Jul
LACB-WBR -80 1 25-28 8-Jul
LACB-WBY -80 1 21-24 8-Jul
LACB-W -80 1 17-20 8-Jul

62
Acknowledgements I would like to express my great appreciation to Professor Jagan Srinivasan and Professor
Mike Buckholt, my MQP advisors, for their advice, guidance, and assistance during this research
process. I would also like to thank Professor Jill Rulfs, the head of the department, for her
support and encouragement of this particular project. Assistance provided by Charu Jain for her
help with the molecular aspects of this project was greatly appreciated. My thanks are also given
to Carli Barns for her soil sample submission.

63
References Ajemian, A., & Gamble, K. (2013). Main. Retrieved 2013, from Worcester Love:
http://www.worcesterlove.com/images/worc_county_big.png
Boag, B., & Yeates, G. (1998). Soil nematode biodiversity in terrestrial ecosystems. Biodiversity
and Conservation, 617-630.
Commonwealth of Massachusetts. (2013). Central Regional Office. Retrieved July 2013, from
The Official Website of the Executive Office of Energy and Environmental Affairs:
http://www.mass.gov/eea/agencies/massdep/about/contacts/central-
region.html#RegionalProfile
Commonwealth of Massachusetts. (2013). Massachusetts Towns and Regions. Retrieved July
2013, from The Official Website of the Executive Office of Energy and Environmental
Affairs: http://www.mass.gov/eea/grants-and-tech-assistance/grants-and-loans/mass-
enviro-trust/massachusetts-towns-and-regions.html
Flyod, R. M., Rodgers, A. D., Lambshead, J. D., & Smith, C. R. (2005). Nematode-specific PCR
primers for the 18s small subunit rRNA gene. Molecular Ecology Notes, 611-612.
Harrison, I., Laverty, M., & Sterling, E. (2004, July 29). Alpha, Beta and Gamma Diversity.
Retrieved July 2013, from Connexions: http://cnx.org/content/m12147/1.2/
Hodgkin, J. (2013). C. elegans as a model organism. Retrieved July 2013, from Department of
Biochemistry, University of Oxford:
http://www.stats.ox.ac.uk/__data/assets/pdf_file/0005/4478/Hodgkin29Oct.pdf
Hotez, P. J., Brindley, P. J., Bethony, J. M., King, C. H., Pearce, E. J., & Jacobson, J. (2008).
Helminth infections: the great neglected tropical diseases. The Journal of Clinical
Investigation, 1311-1321.
Ingham, E. R. (2013). National Resources of Conservation Service. Retrieved July 29, 2013,
from Chapter 6: Nematodes:
http://soils.usda.gov/sqi/concepts/soil_biology/nematodes.html
Klinkenberg, B. (2013). Overview of GIS for Health Organizations. Retrieved July 2013, from
GIScience in Research:
http://www.geog.ubc.ca/courses/geob479/notes/health/Overview_GIS_Health.htm
Laboratory for Optical and Computational Instrumentation. (2013). A Short History of C. elegans
Research. Retrieved July 2013, from WormClassroom: http://wormclassroom.org/short-
history-c-elegans-research

64
Max Planck Institute of Developmental Biology. (2013). Pristionchus- Biology, Taxonomy, and
Phylogeny. Retrieved July 2013, from Max Planck Institute of Developmental Biology:
http://www.eb.tuebingen.mpg.de/?id=804
Simon Fraser University. (2008, January 12). What is C. elegans? Retrieved July 2013, from
SFU Developmental Neuorbiology Laboratory:
http://www.sfu.ca/biology/faculty/hutter/hutterlab/research/Celegans.html
Sohlenius, B. (1980). Abundance, Biomass and Contribution to Energy Flow by Soil Nematodes
in Terrestrial Ecosystems. Nordic Society Oikos, 186-194.
Sommer, R. J. (2013, July 22). Pristionchus Nematode Isolation. (J. Srinivasan, Interviewer)
Srinivasan, J. (2013, June). Nematode Isolation. (L. Aurilio, Interviewer)
Stiernagle, T. (2006). Maintenance of C. elegans. Wormbook, 1-11.
Univeristy of California. (2013, January 14). What are Nematodes. Retrieved July 29, 2013,
from University of California, Riverside, Department of Nematology:
http://nematology.ucr.edu/nematodes.html
Washington State University. (2013). ED-STEEP: Education Solutions to Environmental and
Economic Problems . Retrieved June 2013, from Constructing a Baermann Funnel for
Collecting Soil Nematodes: http://pnwsteep.wsu.edu/edsteep/materials.html
Yeates, G. W. (2003). Nematodes as soil indicators: funtional and biodiversity aspects. Biology
and Fertility of Soils, 199-210.