Embed Size (px)
Citation preview
2455-0272 / JACS Directory©2015. All Rights Reserved
Cite this Article as: S. Swati, S. Umesh, Nemerow’s pollution index: for ground water quality assessment, J. Env. Sci. Pollut. Res. 1(1) (2015) 23–31.
Journal of Environmental Science and Pollution Research 1(1) (2015) 23–31
Contents List available at JACS Directory
Journal of Environmental Science and Pollution Research
journal homepage: http://www.jacsdirectory.com/jespr
Nemerow’s Pollution Index: For Ground Water Quality Assessment
S. Swati1, S. Umesh2,* 1Department of Chemistry, Suresh Gyan Vihar University, Jaipur – 302025, Rajasthan, India. 2Department of Chemistry and Environmental Sciences, Chanakya Technical Campus, Jaipur – 303006, Rajasthan, India.
A R T I C L E D E T A I L S
A B S T R A C T
Article history: Received 16 November 2015 Accepted 25 November 2015 Available online 11 December 2015
The present study was intended to assess the ground water quality for drinking purpose and to determine principal pollutants of ground water through Nemerow’s Pollution Index (NPI) in Bassi Tehsil of district Jaipur, Rajasthan, India. For this ground water samples from 71 sampling sites of 50 villages of study area were collected from tube wells and hand pumps of varying depths in pre and post monsoon seasons and analyzed for ten physico-chemical parameters namely pH, total alkalinity, total hardness, calcium, magnesium, chloride, nitrate, fluoride, total dissolved solid and electrical conductivity. Analysis of results showed that almost all parameters were exceeding the permissible limits prescribed by BIS, ICMR and WHO. According to NPI values the observed principal pollutants (pollution causing parameters) in the present study are total alkalinity, chloride, fluoride, nitrate, total dissolved solids and electrical conductivity in both pre and post monsoon seasons.
Keywords: Groundwater Quality Physico-Chemical Parameters Nemerow’s Pollution Index (NPI) Bassi Tehsil and Rajasthan
1. Introduction
“Water is life's matter and matrix, mother and medium. There is no life without water”. Potable safe water is absolutely essential and is the basic need of all human beings on the earth. Due to rapid industrialization and subsequent contamination of surface and ground water sources, water conservation and water quality management has now a day’s assumed a very complex shape. Attention on contamination and its management has become a need of the hour, because of its far reaching impact on human health.
In Rajasthan water is not only saline but it also contain many dissolved substances, due to which water is not suitable for drinking. These substances have either the toxic effects on the consumer or have long terms indirect effects [1-3]. Other than salinity, presence of many metal ions, chloride, sulphate, nitrate and fluoride are the major factors of the water quality, which influence badly the human health [4].
All the 33 districts of Rajasthan have been declared as fluorososis prone areas. The worst are- Nagaur, Jaipur, Sikar, Jodhpur, Barmer, Ajmer, Sirohi, Jhunjhunu, Churu, Bikaner, Ganganagar etc. [5, 6]. Nitrate is also one of the most common groundwater contaminants in Rajasthan. Ajmer, Alwar, Banaswara, Baran, Barmer, Bundi, Bharatpur, Bhilwara, Bikaner, Chittaurgarh, Churu, Dausa, Dhaulpur, Dungarpur, Ganganagar, Hanumangarh, Jaipur, Jaisalmer, Jalor, Jhalawar, Jhunjhunun, Jodhpur, Karauli, Kota, Nagaur, Pali, Partapgarh, Rajsamand, Sirohi, Sikar, Sawai Madhopur, Tonk, Udaipur districts have been reported nitrate concentration more than 45 mg/L [7].
In Amer, Bassi, Chomu, Jamwa Ramgarh, Kotputali, Shahpura and Virat Nagar tehsils of Jaipur district there is the problem of high fluoride and nitrate concentrations in groundwater [8].
For the assessment of water quality several indices have been developed and are in usage from time to time. In the present study Nemerow’s Pollution Index has been adopted to assess the status of existing water quality and to identify the physico-chemical parameters causing pollution. Nemerow’s pollution index (NPI) is a simplified pollution index introduced by Neme [9] which is also known as Raw’s pollution index. NPI provides information about extent of pollution for a particular water quality parameter with reference to its standard value. By calculating and analyzing the NPI values of water quality parameters for a region, principal pollutants of that region can be identified; which is a vital
information regarding deteriorating water quality of the area and also for the improvement of water quality in the area.. 2. Experimental Methods
2.1 Study Area
Rajasthan is known as “the land of king” and it is the largest state of the republic of India in terms of geographical spread. It is situated in the North- Western part of India having total area is around 3, 42, 239 sq.km. which represents 10.41% of total area of the country and population of 6.86 crores spread over in 44,672 villages, which is 5.67% of nations population but being just available 1% of the total water resources of the country. The state has extreme climatic and geographical condition and it suffers both the problems of quantity and quality of water [10, 11].
Jaipur, the capital of Rajasthan, has a total area of 11,117 sq. Km covering the 3.23% of the total area of the state, administered by 13 tehsils or sub-divisions. Our focused area of study is Bassi tehsil, out of the 13 tehsils of Jaipur district. The area of tehsil is 654.69 sq.km, located at 26096’ N latitude and 75062’E longitude. In Bassi Tehsil there are 210 villages (famous for their leather footwear and Embroidery beading). In the study area there are no major surface water sources however; main sources of drinking water are open wells, hand pumps and bore wells [12-14].
In Bassi Tehsil 84 villages are reported having fluoride concentration more than 1.5 ppm, 78 villages are exhibiting nitrate concentration more than 45 ppm and 30 villages are having Electrical conductivity more than 3000 micromhos/cm [13, 15].
Review of literature reveals that very few studies have been made to
scientifically investigate the ground water contamination of the study area. The
present study aims to calculate the Nemerow’s Pollution Index (NPI) in most rural habitations of Bassi Tehsil of Jaipur, Rajasthan, India in order to assess the suitability of ground water for human uses and to identify the principal pollutants of ground water in the study area; it also deals with the necessity of
restoring the water quality. 2.2 Sample Collection
Ground water samples from a total of 71 sampling sites of 50 villages of Bassi Tehsil were collected in pre-cleaned and rinsed polyethene bottles of two litre capacity with necessary precautions [16]. The total water collection in the year of 2013 is divided in to two seasons, one is pre monsoon and another one is post monsoon. The sampling is carried out, during April 2013 for pre monsoon season and in September-October 2013 for post monsoon season from manually operated tube wells and hand pumps of varying depth.
*Corresponding Author Email Address: [email protected] (Umesh Saxena)
ISSN: 2455-0272
24
S. Swati and S. Umesh / Journal of Environmental Science and Pollution Research 1(1) (2015) 23–31
Cite this Article as: S. Swati, S. Umesh, Nemerow’s pollution index: for ground water quality assessment, J. Env. Sci. Pollut. Res. 1(1) (2015) 23–31.
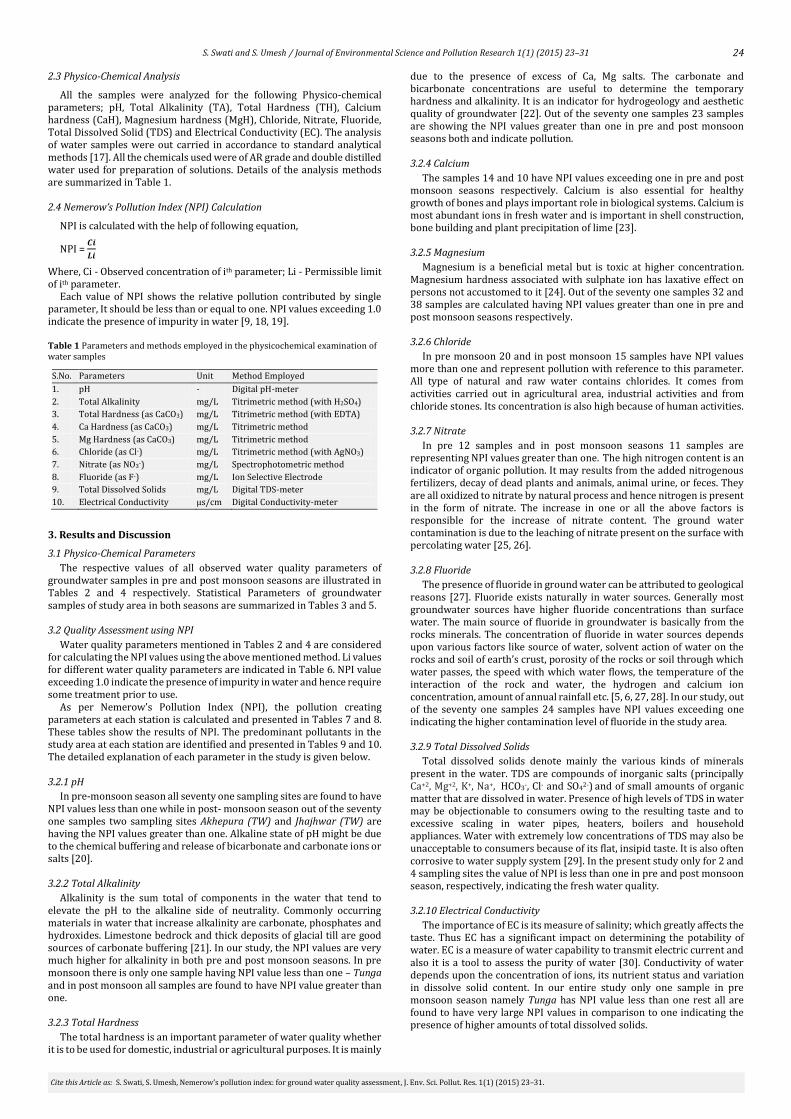
2.3 Physico-Chemical Analysis
All the samples were analyzed for the following Physico-chemical parameters; pH, Total Alkalinity (TA), Total Hardness (TH), Calcium hardness (CaH), Magnesium hardness (MgH), Chloride, Nitrate, Fluoride, Total Dissolved Solid (TDS) and Electrical Conductivity (EC). The analysis of water samples were out carried in accordance to standard analytical methods [17]. All the chemicals used were of AR grade and double distilled water used for preparation of solutions. Details of the analysis methods are summarized in Table 1. 2.4 Nemerow’s Pollution Index (NPI) Calculation
NPI is calculated with the help of following equation,
NPI = 𝑪𝒊
𝑳𝒊
Where, Ci - Observed concentration of ith parameter; Li - Permissible limit of ith parameter.
Each value of NPI shows the relative pollution contributed by single parameter, It should be less than or equal to one. NPI values exceeding 1.0 indicate the presence of impurity in water [9, 18, 19]. Table 1 Parameters and methods employed in the physicochemical examination of water samples
S.No. Parameters Unit Method Employed
1. pH - Digital pH-meter
2. Total Alkalinity mg/L Titrimetric method (with H2SO4)
3. Total Hardness (as CaCO3) mg/L Titrimetric method (with EDTA)
4. Ca Hardness (as CaCO3) mg/L Titrimetric method
5. Mg Hardness (as CaCO3) mg/L Titrimetric method
6. Chloride (as Cl-) mg/L Titrimetric method (with AgNO3)
7. Nitrate (as NO3-) mg/L Spectrophotometric method
8. Fluoride (as F-) mg/L Ion Selective Electrode
9. Total Dissolved Solids mg/L Digital TDS-meter
10. Electrical Conductivity µs/cm Digital Conductivity-meter
3. Results and Discussion
3.1 Physico-Chemical Parameters
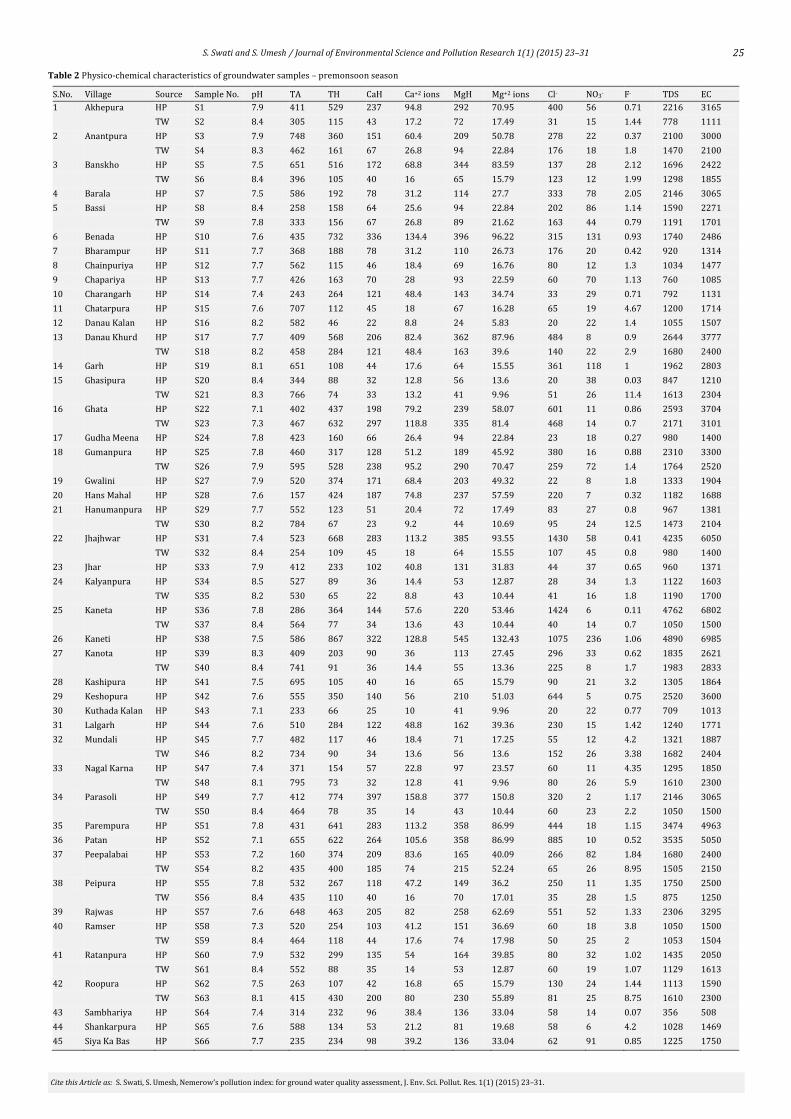
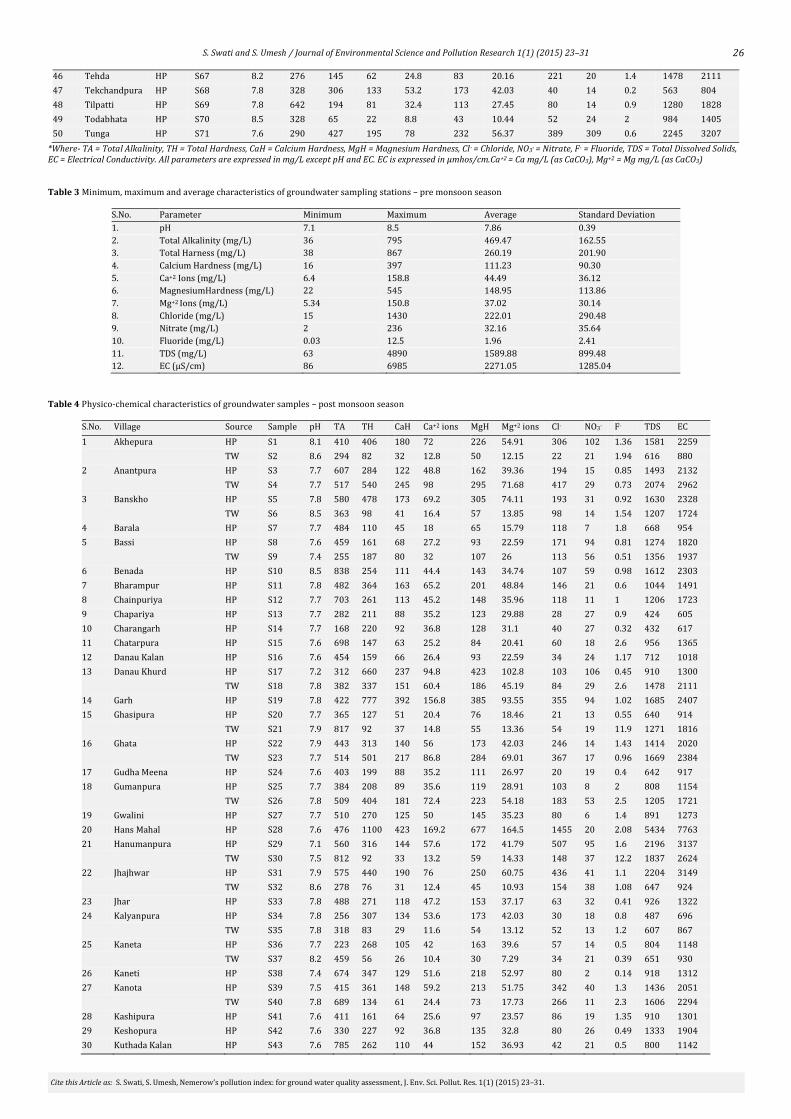
The respective values of all observed water quality parameters of groundwater samples in pre and post monsoon seasons are illustrated in Tables 2 and 4 respectively. Statistical Parameters of groundwater samples of study area in both seasons are summarized in Tables 3 and 5. 3.2 Quality Assessment using NPI
Water quality parameters mentioned in Tables 2 and 4 are considered for calculating the NPI values using the above mentioned method. Li values for different water quality parameters are indicated in Table 6. NPI value exceeding 1.0 indicate the presence of impurity in water and hence require some treatment prior to use.
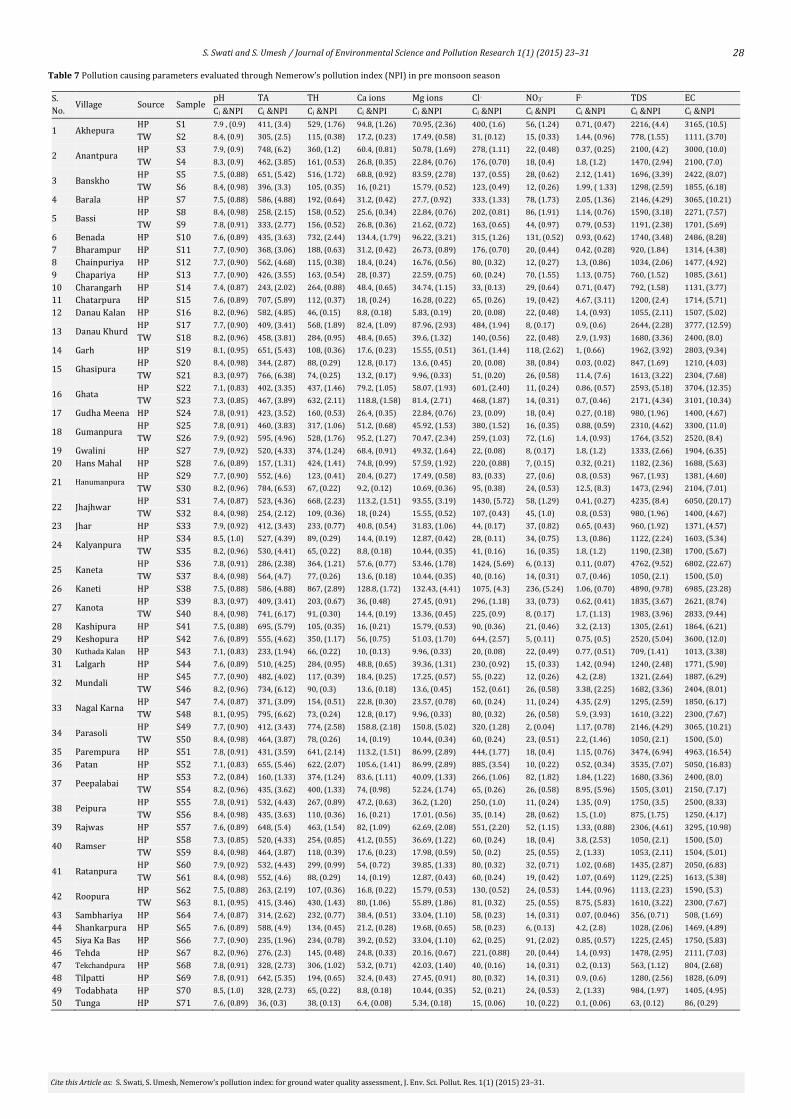
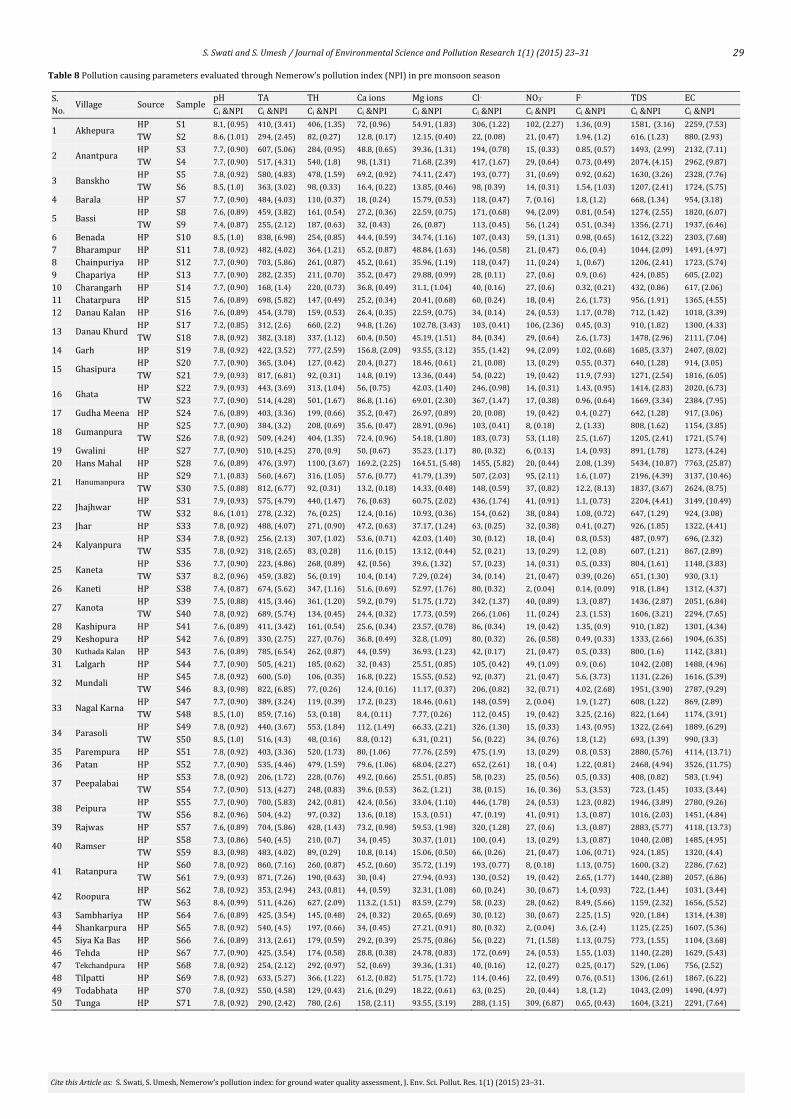
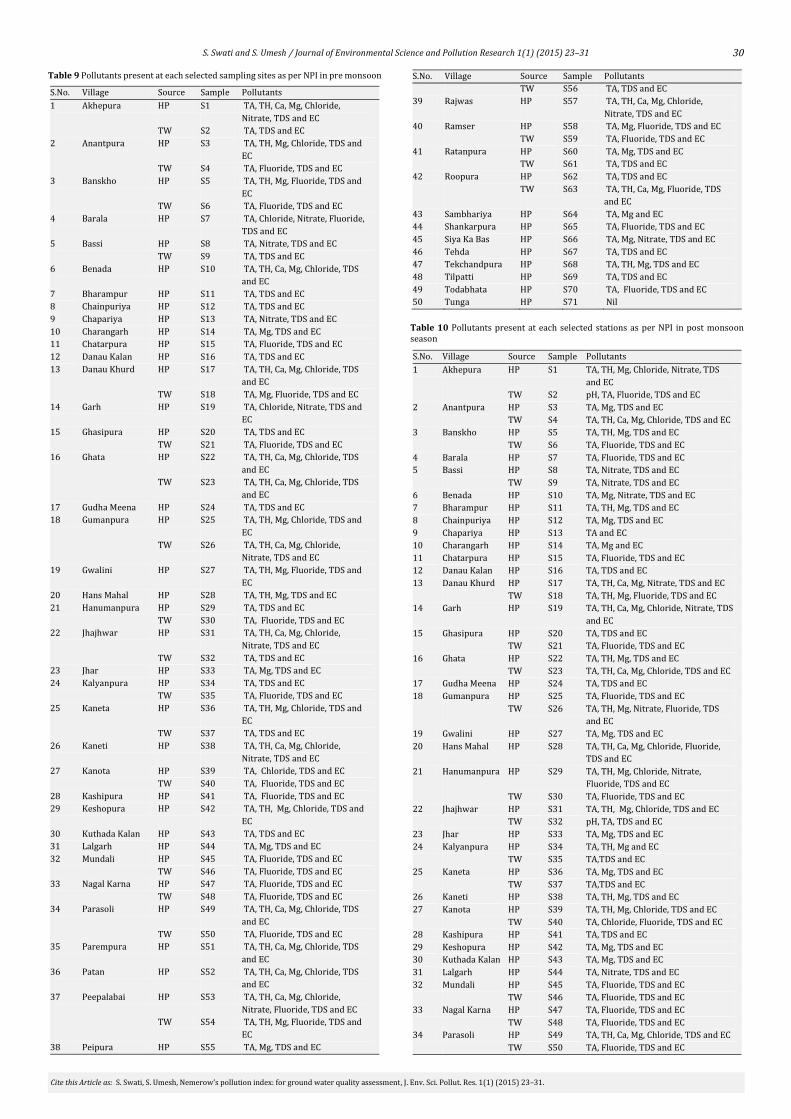
As per Nemerow’s Pollution Index (NPI), the pollution creating parameters at each station is calculated and presented in Tables 7 and 8. These tables show the results of NPI. The predominant pollutants in the study area at each station are identified and presented in Tables 9 and 10. The detailed explanation of each parameter in the study is given below. 3.2.1 pH
In pre-monsoon season all seventy one sampling sites are found to have NPI values less than one while in post- monsoon season out of the seventy one samples two sampling sites Akhepura (TW) and Jhajhwar (TW) are having the NPI values greater than one. Alkaline state of pH might be due to the chemical buffering and release of bicarbonate and carbonate ions or salts [20]. 3.2.2 Total Alkalinity
Alkalinity is the sum total of components in the water that tend to elevate the pH to the alkaline side of neutrality. Commonly occurring materials in water that increase alkalinity are carbonate, phosphates and hydroxides. Limestone bedrock and thick deposits of glacial till are good sources of carbonate buffering [21]. In our study, the NPI values are very much higher for alkalinity in both pre and post monsoon seasons. In pre monsoon there is only one sample having NPI value less than one – Tunga and in post monsoon all samples are found to have NPI value greater than one. 3.2.3 Total Hardness
The total hardness is an important parameter of water quality whether it is to be used for domestic, industrial or agricultural purposes. It is mainly
due to the presence of excess of Ca, Mg salts. The carbonate and bicarbonate concentrations are useful to determine the temporary hardness and alkalinity. It is an indicator for hydrogeology and aesthetic quality of groundwater [22]. Out of the seventy one samples 23 samples are showing the NPI values greater than one in pre and post monsoon seasons both and indicate pollution. 3.2.4 Calcium
The samples 14 and 10 have NPI values exceeding one in pre and post monsoon seasons respectively. Calcium is also essential for healthy growth of bones and plays important role in biological systems. Calcium is most abundant ions in fresh water and is important in shell construction, bone building and plant precipitation of lime [23]. 3.2.5 Magnesium
Magnesium is a beneficial metal but is toxic at higher concentration. Magnesium hardness associated with sulphate ion has laxative effect on persons not accustomed to it [24]. Out of the seventy one samples 32 and 38 samples are calculated having NPI values greater than one in pre and post monsoon seasons respectively. 3.2.6 Chloride
In pre monsoon 20 and in post monsoon 15 samples have NPI values more than one and represent pollution with reference to this parameter. All type of natural and raw water contains chlorides. It comes from activities carried out in agricultural area, industrial activities and from chloride stones. Its concentration is also high because of human activities. 3.2.7 Nitrate
In pre 12 samples and in post monsoon seasons 11 samples are representing NPI values greater than one. The high nitrogen content is an indicator of organic pollution. It may results from the added nitrogenous fertilizers, decay of dead plants and animals, animal urine, or feces. They are all oxidized to nitrate by natural process and hence nitrogen is present in the form of nitrate. The increase in one or all the above factors is responsible for the increase of nitrate content. The ground water contamination is due to the leaching of nitrate present on the surface with percolating water [25, 26]. 3.2.8 Fluoride
The presence of fluoride in ground water can be attributed to geological reasons [27]. Fluoride exists naturally in water sources. Generally most groundwater sources have higher fluoride concentrations than surface water. The main source of fluoride in groundwater is basically from the rocks minerals. The concentration of fluoride in water sources depends upon various factors like source of water, solvent action of water on the rocks and soil of earth’s crust, porosity of the rocks or soil through which water passes, the speed with which water flows, the temperature of the interaction of the rock and water, the hydrogen and calcium ion concentration, amount of annual rainfall etc. [5, 6, 27, 28]. In our study, out of the seventy one samples 24 samples have NPI values exceeding one indicating the higher contamination level of fluoride in the study area. 3.2.9 Total Dissolved Solids
Total dissolved solids denote mainly the various kinds of minerals present in the water. TDS are compounds of inorganic salts (principally Ca+2, Mg+2, K+, Na+, HCO3-, Cl- and SO42-) and of small amounts of organic matter that are dissolved in water. Presence of high levels of TDS in water may be objectionable to consumers owing to the resulting taste and to excessive scaling in water pipes, heaters, boilers and household appliances. Water with extremely low concentrations of TDS may also be unacceptable to consumers because of its flat, insipid taste. It is also often corrosive to water supply system [29]. In the present study only for 2 and 4 sampling sites the value of NPI is less than one in pre and post monsoon season, respectively, indicating the fresh water quality.
3.2.10 Electrical Conductivity
The importance of EC is its measure of salinity; which greatly affects the taste. Thus EC has a significant impact on determining the potability of water. EC is a measure of water capability to transmit electric current and also it is a tool to assess the purity of water [30]. Conductivity of water depends upon the concentration of ions, its nutrient status and variation in dissolve solid content. In our entire study only one sample in pre monsoon season namely Tunga has NPI value less than one rest all are found to have very large NPI values in comparison to one indicating the presence of higher amounts of total dissolved solids.
25
S. Swati and S. Umesh / Journal of Environmental Science and Pollution Research 1(1) (2015) 23–31
Cite this Article as: S. Swati, S. Umesh, Nemerow’s pollution index: for ground water quality assessment, J. Env. Sci. Pollut. Res. 1(1) (2015) 23–31.
Table 2 Physico-chemical characteristics of groundwater samples – premonsoon season
S.No. Village Source Sample No. pH TA TH CaH Ca+2 ions MgH Mg+2 ions Cl- NO3- F- TDS EC
1 Akhepura HP S1 7.9 411 529 237 94.8 292 70.95 400 56 0.71 2216 3165
TW S2 8.4 305 115 43 17.2 72 17.49 31 15 1.44 778 1111
2 Anantpura HP S3 7.9 748 360 151 60.4 209 50.78 278 22 0.37 2100 3000
TW S4 8.3 462 161 67 26.8 94 22.84 176 18 1.8 1470 2100
3 Banskho HP S5 7.5 651 516 172 68.8 344 83.59 137 28 2.12 1696 2422
TW S6 8.4 396 105 40 16 65 15.79 123 12 1.99 1298 1855
4 Barala HP S7 7.5 586 192 78 31.2 114 27.7 333 78 2.05 2146 3065
5 Bassi HP S8 8.4 258 158 64 25.6 94 22.84 202 86 1.14 1590 2271
TW S9 7.8 333 156 67 26.8 89 21.62 163 44 0.79 1191 1701
6 Benada HP S10 7.6 435 732 336 134.4 396 96.22 315 131 0.93 1740 2486
7 Bharampur HP S11 7.7 368 188 78 31.2 110 26.73 176 20 0.42 920 1314
8 Chainpuriya HP S12 7.7 562 115 46 18.4 69 16.76 80 12 1.3 1034 1477
9 Chapariya HP S13 7.7 426 163 70 28 93 22.59 60 70 1.13 760 1085
10 Charangarh HP S14 7.4 243 264 121 48.4 143 34.74 33 29 0.71 792 1131
11 Chatarpura HP S15 7.6 707 112 45 18 67 16.28 65 19 4.67 1200 1714
12 Danau Kalan HP S16 8.2 582 46 22 8.8 24 5.83 20 22 1.4 1055 1507
13 Danau Khurd HP S17 7.7 409 568 206 82.4 362 87.96 484 8 0.9 2644 3777
TW S18 8.2 458 284 121 48.4 163 39.6 140 22 2.9 1680 2400
14 Garh HP S19 8.1 651 108 44 17.6 64 15.55 361 118 1 1962 2803
15 Ghasipura HP S20 8.4 344 88 32 12.8 56 13.6 20 38 0.03 847 1210
TW S21 8.3 766 74 33 13.2 41 9.96 51 26 11.4 1613 2304
16 Ghata HP S22 7.1 402 437 198 79.2 239 58.07 601 11 0.86 2593 3704
TW S23 7.3 467 632 297 118.8 335 81.4 468 14 0.7 2171 3101
17 Gudha Meena HP S24 7.8 423 160 66 26.4 94 22.84 23 18 0.27 980 1400
18 Gumanpura HP S25 7.8 460 317 128 51.2 189 45.92 380 16 0.88 2310 3300
TW S26 7.9 595 528 238 95.2 290 70.47 259 72 1.4 1764 2520
19 Gwalini HP S27 7.9 520 374 171 68.4 203 49.32 22 8 1.8 1333 1904
20 Hans Mahal HP S28 7.6 157 424 187 74.8 237 57.59 220 7 0.32 1182 1688
21 Hanumanpura HP S29 7.7 552 123 51 20.4 72 17.49 83 27 0.8 967 1381
TW S30 8.2 784 67 23 9.2 44 10.69 95 24 12.5 1473 2104
22 Jhajhwar HP S31 7.4 523 668 283 113.2 385 93.55 1430 58 0.41 4235 6050
TW S32 8.4 254 109 45 18 64 15.55 107 45 0.8 980 1400
23 Jhar HP S33 7.9 412 233 102 40.8 131 31.83 44 37 0.65 960 1371
24 Kalyanpura HP S34 8.5 527 89 36 14.4 53 12.87 28 34 1.3 1122 1603
TW S35 8.2 530 65 22 8.8 43 10.44 41 16 1.8 1190 1700
25 Kaneta HP S36 7.8 286 364 144 57.6 220 53.46 1424 6 0.11 4762 6802
TW S37 8.4 564 77 34 13.6 43 10.44 40 14 0.7 1050 1500
26 Kaneti HP S38 7.5 586 867 322 128.8 545 132.43 1075 236 1.06 4890 6985
27 Kanota HP S39 8.3 409 203 90 36 113 27.45 296 33 0.62 1835 2621
TW S40 8.4 741 91 36 14.4 55 13.36 225 8 1.7 1983 2833
28 Kashipura HP S41 7.5 695 105 40 16 65 15.79 90 21 3.2 1305 1864
29 Keshopura HP S42 7.6 555 350 140 56 210 51.03 644 5 0.75 2520 3600
30 Kuthada Kalan HP S43 7.1 233 66 25 10 41 9.96 20 22 0.77 709 1013
31 Lalgarh HP S44 7.6 510 284 122 48.8 162 39.36 230 15 1.42 1240 1771
32 Mundali HP S45 7.7 482 117 46 18.4 71 17.25 55 12 4.2 1321 1887
TW S46 8.2 734 90 34 13.6 56 13.6 152 26 3.38 1682 2404
33 Nagal Karna HP S47 7.4 371 154 57 22.8 97 23.57 60 11 4.35 1295 1850
TW S48 8.1 795 73 32 12.8 41 9.96 80 26 5.9 1610 2300
34 Parasoli HP S49 7.7 412 774 397 158.8 377 150.8 320 2 1.17 2146 3065
TW S50 8.4 464 78 35 14 43 10.44 60 23 2.2 1050 1500
35 Parempura HP S51 7.8 431 641 283 113.2 358 86.99 444 18 1.15 3474 4963
36 Patan HP S52 7.1 655 622 264 105.6 358 86.99 885 10 0.52 3535 5050
37 Peepalabai HP S53 7.2 160 374 209 83.6 165 40.09 266 82 1.84 1680 2400
TW S54 8.2 435 400 185 74 215 52.24 65 26 8.95 1505 2150
38 Peipura HP S55 7.8 532 267 118 47.2 149 36.2 250 11 1.35 1750 2500
TW S56 8.4 435 110 40 16 70 17.01 35 28 1.5 875 1250
39 Rajwas HP S57 7.6 648 463 205 82 258 62.69 551 52 1.33 2306 3295
40 Ramser HP S58 7.3 520 254 103 41.2 151 36.69 60 18 3.8 1050 1500
TW S59 8.4 464 118 44 17.6 74 17.98 50 25 2 1053 1504
41 Ratanpura HP S60 7.9 532 299 135 54 164 39.85 80 32 1.02 1435 2050
TW S61 8.4 552 88 35 14 53 12.87 60 19 1.07 1129 1613
42 Roopura HP S62 7.5 263 107 42 16.8 65 15.79 130 24 1.44 1113 1590
TW S63 8.1 415 430 200 80 230 55.89 81 25 8.75 1610 2300
43 Sambhariya HP S64 7.4 314 232 96 38.4 136 33.04 58 14 0.07 356 508
44 Shankarpura HP S65 7.6 588 134 53 21.2 81 19.68 58 6 4.2 1028 1469
45 Siya Ka Bas HP S66 7.7 235 234 98 39.2 136 33.04 62 91 0.85 1225 1750
26
S. Swati and S. Umesh / Journal of Environmental Science and Pollution Research 1(1) (2015) 23–31
Cite this Article as: S. Swati, S. Umesh, Nemerow’s pollution index: for ground water quality assessment, J. Env. Sci. Pollut. Res. 1(1) (2015) 23–31.
46 Tehda HP S67 8.2 276 145 62 24.8 83 20.16 221 20 1.4 1478 2111
47 Tekchandpura HP S68 7.8 328 306 133 53.2 173 42.03 40 14 0.2 563 804
48 Tilpatti HP S69 7.8 642 194 81 32.4 113 27.45 80 14 0.9 1280 1828
49 Todabhata HP S70 8.5 328 65 22 8.8 43 10.44 52 24 2 984 1405
50 Tunga HP S71 7.6 290 427 195 78 232 56.37 389 309 0.6 2245 3207
*Where- TA = Total Alkalinity, TH = Total Hardness, CaH = Calcium Hardness, MgH = Magnesium Hardness, Cl- = Chloride, NO3- = Nitrate, F- = Fluoride, TDS = Total Dissolved Solids, EC = Electrical Conductivity. All parameters are expressed in mg/L except pH and EC. EC is expressed in µmhos/cm.Ca+2 = Ca mg/L (as CaCO3), Mg+2 = Mg mg/L (as CaCO3)
Table 3 Minimum, maximum and average characteristics of groundwater sampling stations – pre monsoon season
S.No. Parameter Minimum Maximum Average Standard Deviation
1. pH 7.1 8.5 7.86 0.39
2. Total Alkalinity (mg/L) 36 795 469.47 162.55
3. Total Harness (mg/L) 38 867 260.19 201.90
4. Calcium Hardness (mg/L) 16 397 111.23 90.30
5. Ca+2 Ions (mg/L) 6.4 158.8 44.49 36.12
6. MagnesiumHardness (mg/L) 22 545 148.95 113.86
7. Mg+2 Ions (mg/L) 5.34 150.8 37.02 30.14
8. Chloride (mg/L) 15 1430 222.01 290.48
9. Nitrate (mg/L) 2 236 32.16 35.64
10. Fluoride (mg/L) 0.03 12.5 1.96 2.41
11. TDS (mg/L) 63 4890 1589.88 899.48
12. EC (µS/cm) 86 6985 2271.05 1285.04
Table 4 Physico-chemical characteristics of groundwater samples – post monsoon season
S.No. Village Source Sample pH TA TH CaH Ca+2 ions MgH Mg+2 ions Cl- NO3- F- TDS EC
1 Akhepura HP S1 8.1 410 406 180 72 226 54.91 306 102 1.36 1581 2259
TW S2 8.6 294 82 32 12.8 50 12.15 22 21 1.94 616 880
2 Anantpura HP S3 7.7 607 284 122 48.8 162 39.36 194 15 0.85 1493 2132
TW S4 7.7 517 540 245 98 295 71.68 417 29 0.73 2074 2962
3 Banskho HP S5 7.8 580 478 173 69.2 305 74.11 193 31 0.92 1630 2328
TW S6 8.5 363 98 41 16.4 57 13.85 98 14 1.54 1207 1724
4 Barala HP S7 7.7 484 110 45 18 65 15.79 118 7 1.8 668 954
5 Bassi HP S8 7.6 459 161 68 27.2 93 22.59 171 94 0.81 1274 1820
TW S9 7.4 255 187 80 32 107 26 113 56 0.51 1356 1937
6 Benada HP S10 8.5 838 254 111 44.4 143 34.74 107 59 0.98 1612 2303
7 Bharampur HP S11 7.8 482 364 163 65.2 201 48.84 146 21 0.6 1044 1491
8 Chainpuriya HP S12 7.7 703 261 113 45.2 148 35.96 118 11 1 1206 1723
9 Chapariya HP S13 7.7 282 211 88 35.2 123 29.88 28 27 0.9 424 605
10 Charangarh HP S14 7.7 168 220 92 36.8 128 31.1 40 27 0.32 432 617
11 Chatarpura HP S15 7.6 698 147 63 25.2 84 20.41 60 18 2.6 956 1365
12 Danau Kalan HP S16 7.6 454 159 66 26.4 93 22.59 34 24 1.17 712 1018
13 Danau Khurd HP S17 7.2 312 660 237 94.8 423 102.8 103 106 0.45 910 1300
TW S18 7.8 382 337 151 60.4 186 45.19 84 29 2.6 1478 2111
14 Garh HP S19 7.8 422 777 392 156.8 385 93.55 355 94 1.02 1685 2407
15 Ghasipura HP S20 7.7 365 127 51 20.4 76 18.46 21 13 0.55 640 914
TW S21 7.9 817 92 37 14.8 55 13.36 54 19 11.9 1271 1816
16 Ghata HP S22 7.9 443 313 140 56 173 42.03 246 14 1.43 1414 2020
TW S23 7.7 514 501 217 86.8 284 69.01 367 17 0.96 1669 2384
17 Gudha Meena HP S24 7.6 403 199 88 35.2 111 26.97 20 19 0.4 642 917
18 Gumanpura HP S25 7.7 384 208 89 35.6 119 28.91 103 8 2 808 1154
TW S26 7.8 509 404 181 72.4 223 54.18 183 53 2.5 1205 1721
19 Gwalini HP S27 7.7 510 270 125 50 145 35.23 80 6 1.4 891 1273
20 Hans Mahal HP S28 7.6 476 1100 423 169.2 677 164.5 1455 20 2.08 5434 7763
21 Hanumanpura HP S29 7.1 560 316 144 57.6 172 41.79 507 95 1.6 2196 3137
TW S30 7.5 812 92 33 13.2 59 14.33 148 37 12.2 1837 2624
22 Jhajhwar HP S31 7.9 575 440 190 76 250 60.75 436 41 1.1 2204 3149
TW S32 8.6 278 76 31 12.4 45 10.93 154 38 1.08 647 924
23 Jhar HP S33 7.8 488 271 118 47.2 153 37.17 63 32 0.41 926 1322
24 Kalyanpura HP S34 7.8 256 307 134 53.6 173 42.03 30 18 0.8 487 696
TW S35 7.8 318 83 29 11.6 54 13.12 52 13 1.2 607 867
25 Kaneta HP S36 7.7 223 268 105 42 163 39.6 57 14 0.5 804 1148
TW S37 8.2 459 56 26 10.4 30 7.29 34 21 0.39 651 930
26 Kaneti HP S38 7.4 674 347 129 51.6 218 52.97 80 2 0.14 918 1312
27 Kanota HP S39 7.5 415 361 148 59.2 213 51.75 342 40 1.3 1436 2051
TW S40 7.8 689 134 61 24.4 73 17.73 266 11 2.3 1606 2294
28 Kashipura HP S41 7.6 411 161 64 25.6 97 23.57 86 19 1.35 910 1301
29 Keshopura HP S42 7.6 330 227 92 36.8 135 32.8 80 26 0.49 1333 1904
30 Kuthada Kalan HP S43 7.6 785 262 110 44 152 36.93 42 21 0.5 800 1142
27
S. Swati and S. Umesh / Journal of Environmental Science and Pollution Research 1(1) (2015) 23–31
Cite this Article as: S. Swati, S. Umesh, Nemerow’s pollution index: for ground water quality assessment, J. Env. Sci. Pollut. Res. 1(1) (2015) 23–31.
31 Lalgarh HP S44 7.7 505 185 80 32 105 25.51 105 49 0.9 1042 1488
32 Mundali HP S45 7.8 600 106 42 16.8 64 15.55 92 21 5.6 1131 1616
TW S46 8.3 822 77 31 12.4 46 11.17 206 32 4.02 1951 2787
33 Nagal Karna HP S47 7.7 389 119 43 17.2 76 18.46 148 2 1.9 608 869
TW S48 8.5 859 53 21 8.4 32 7.77 112 19 3.25 822 1174
34 Parasoli HP S49 7.8 440 553 280 112 273 66.33 326 15 1.43 1322 1889
TW S50 8.5 516 48 22 8.8 26 6.31 56 34 1.8 693 990
35 Parempura HP S51 7.8 403 520 200 80 320 77.76 475 13 0.8 2880 4114
36 Patan HP S52 7.7 535 479 199 79.6 280 68.04 652 18 1.22 2468 3526
37 Peepalabai HP S53 7.8 206 228 123 49.2 105 25.51 58 25 0.5 408 583
TW S54 7.7 513 248 99 39.6 149 36.2 38 16 5.3 723 1033
38 Peipura HP S55 7.7 700 242 106 42.4 136 33.04 446 24 1.23 1946 2780
TW S56 8.2 504 97 34 13.6 63 15.3 47 41 1.3 1016 1451
39 Rajwas HP S57 7.6 704 428 183 73.2 245 59.53 320 27 1.3 2883 4118
40 Ramser HP S58 7.3 540 210 85 34 125 30.37 100 13 1.3 1040 1485
TW S59 8.3 483 89 27 10.8 62 15.06 66 21 1.06 924 1320
41 Ratanpura HP S60 7.8 860 260 113 45.2 147 35.72 193 8 1.13 1600 2286
TW S61 7.9 871 190 75 30 115 27.94 130 19 2.65 1440 2057
42 Roopura HP S62 7.8 353 243 110 44 133 32.31 60 30 1.4 722 1031
TW S63 8.4 511 627 283 113.2 344 83.59 58 28 8.49 1159 1656
43 Sambhariya HP S64 7.6 425 145 60 24 85 20.65 30 30 2.25 920 1314
44 Shankarpura HP S65 7.8 540 197 85 34 112 27.21 80 2 3.6 1125 1607
45 Siya Ka Bas HP S66 7.6 313 179 73 29.2 106 25.75 56 71 1.13 773 1104
46 Tehda HP S67 7.7 425 174 72 28.8 102 24.78 172 24 1.55 1140 1629
47 Tekchandpura HP S68 7.8 254 292 130 52 162 39.36 40 12 0.25 529 756
48 Tilpatti HP S69 7.8 633 366 153 61.2 213 51.75 114 22 0.76 1306 1867
49 Todabhata HP S70 7.8 550 129 54 21.6 75 18.22 63 20 1.8 1043 1490
50 Tunga HP S71 7.8 290 780 395 158 385 93.55 288 309 0.65 1604 2291
Table 5 Minimum, maximum and average characteristics of groundwater sampling stations – post monsoon season
S.No. Parameter Minimum Maximum Average Standard Deviation
1. pH 7.1 8.6 7.80 0.31
2. Total Alkalinity (mg/L) 168 871 495.04 174.15
3. Total Harness (mg/L) 48 1100 276.26 195.79
4. Calcium Hardness (mg/L) 21 423 118.38 87.05
5. Ca+2 Ions (mg/L) 8.4 169.2 47.35 34.82
6. MagnesiumHardness (mg/L) 26 677 157.88 111.31
7. Mg+2 Ions (mg/L) 6.31 164.51 38.36 27.05
8. Chloride (mg/L) 20 1455 171.04 206.72
9. Nitrate (mg/L) 2 309 32.77 40.60
10. Fluoride (mg/L) 0.14 12.2 1.82 2.20
11. TDS (mg/L) 408 5434 1252.28 746.36
12. EC (µS/cm) 583 7763 1788.87 1066.23
Table 6 List of permissible value (Li) for water quality parameters in NPI
S. No. Parameter Permissible Value Recommending Agency
1. pH 8.5 BIS/ICMR/WHO
2. Total Alkalinity 120 (mg/L) ICMR/WHO
3. Total Hardness 300 (mg/L) BIS/ICMR
4. Ca+2 Ions 75 (mg/L) BIS/ICMR/WHO
5. Mg+2 Ions 30 (mg/L) BIS/ICMR/WHO
6. Chloride 250 (mg/L) BIS/ICMR
7. Nitrate 45 (mg/L) BIS/ICMR/WHO
8. Fluoride 1.5 (mg/L) BIS/ICMR/WHO
9. Total Dissolved Solids 500 (mg/L) BIS/ICMR/WHO
10. Electrical Conductivity 300 (µS/cm) ICMR/WHO
28
S. Swati and S. Umesh / Journal of Environmental Science and Pollution Research 1(1) (2015) 23–31
Cite this Article as: S. Swati, S. Umesh, Nemerow’s pollution index: for ground water quality assessment, J. Env. Sci. Pollut. Res. 1(1) (2015) 23–31.
Table 7 Pollution causing parameters evaluated through Nemerow’s pollution index (NPI) in pre monsoon season
S.
No. Village Source Sample
pH TA TH Ca ions Mg ions Cl- NO3- F- TDS EC
Ci &NPI Ci &NPI Ci &NPI Ci &NPI Ci &NPI Ci &NPI Ci &NPI Ci &NPI Ci &NPI Ci &NPI
1 Akhepura HP S1 7.9 , (0.9) 411, (3.4) 529, (1.76) 94.8, (1.26) 70.95, (2.36) 400, (1.6) 56, (1.24) 0.71, (0.47) 2216, (4.4) 3165, (10.5)
TW S2 8.4, (0.9) 305, (2.5) 115, (0.38) 17.2, (0.23) 17.49, (0.58) 31, (0.12) 15, (0.33) 1.44, (0.96) 778, (1.55) 1111, (3.70)
2 Anantpura HP S3 7.9, (0.9) 748, (6.2) 360, (1.2) 60.4, (0.81) 50.78, (1.69) 278, (1.11) 22, (0.48) 0.37, (0.25) 2100, (4.2) 3000, (10.0)
TW S4 8.3, (0.9) 462, (3.85) 161, (0.53) 26.8, (0.35) 22.84, (0.76) 176, (0.70) 18, (0.4) 1.8, (1.2) 1470, (2.94) 2100, (7.0)
3 Banskho HP S5 7.5, (0.88) 651, (5.42) 516, (1.72) 68.8, (0.92) 83.59, (2.78) 137, (0.55) 28, (0.62) 2.12, (1.41) 1696, (3.39) 2422, (8.07)
TW S6 8.4, (0.98) 396, (3.3) 105, (0.35) 16, (0.21) 15.79, (0.52) 123, (0.49) 12, (0.26) 1.99, ( 1.33) 1298, (2.59) 1855, (6.18)
4 Barala HP S7 7.5, (0.88) 586, (4.88) 192, (0.64) 31.2, (0.42) 27.7, (0.92) 333, (1.33) 78, (1.73) 2.05, (1.36) 2146, (4.29) 3065, (10.21)
5 Bassi HP S8 8.4, (0.98) 258, (2.15) 158, (0.52) 25.6, (0.34) 22.84, (0.76) 202, (0.81) 86, (1.91) 1.14, (0.76) 1590, (3.18) 2271, (7.57)
TW S9 7.8, (0.91) 333, (2.77) 156, (0.52) 26.8, (0.36) 21.62, (0.72) 163, (0.65) 44, (0.97) 0.79, (0.53) 1191, (2.38) 1701, (5.69)
6 Benada HP S10 7.6, (0.89) 435, (3.63) 732, (2.44) 134.4, (1.79) 96.22, (3.21) 315, (1.26) 131, (0.52) 0.93, (0.62) 1740, (3.48) 2486, (8.28)
7 Bharampur HP S11 7.7, (0.90) 368, (3.06) 188, (0.63) 31.2, (0.42) 26.73, (0.89) 176, (0.70) 20, (0.44) 0.42, (0.28) 920, (1.84) 1314, (4.38)
8 Chainpuriya HP S12 7.7, (0.90) 562, (4.68) 115, (0.38) 18.4, (0.24) 16.76, (0.56) 80, (0.32) 12, (0.27) 1.3, (0.86) 1034, (2.06) 1477, (4.92)
9 Chapariya HP S13 7.7, (0.90) 426, (3.55) 163, (0.54) 28, (0.37) 22.59, (0.75) 60, (0.24) 70, (1.55) 1.13, (0.75) 760, (1.52) 1085, (3.61)
10 Charangarh HP S14 7.4, (0.87) 243, (2.02) 264, (0.88) 48.4, (0.65) 34.74, (1.15) 33, (0.13) 29, (0.64) 0.71, (0.47) 792, (1.58) 1131, (3.77)
11 Chatarpura HP S15 7.6, (0.89) 707, (5.89) 112, (0.37) 18, (0.24) 16.28, (0.22) 65, (0.26) 19, (0.42) 4.67, (3.11) 1200, (2.4) 1714, (5.71)
12 Danau Kalan HP S16 8.2, (0.96) 582, (4.85) 46, (0.15) 8.8, (0.18) 5.83, (0.19) 20, (0.08) 22, (0.48) 1.4, (0.93) 1055, (2.11) 1507, (5.02)
13 Danau Khurd HP S17 7.7, (0.90) 409, (3.41) 568, (1.89) 82.4, (1.09) 87.96, (2.93) 484, (1.94) 8, (0.17) 0.9, (0.6) 2644, (2.28) 3777, (12.59)
TW S18 8.2, (0.96) 458, (3.81) 284, (0.95) 48.4, (0.65) 39.6, (1.32) 140, (0.56) 22, (0.48) 2.9, (1.93) 1680, (3.36) 2400, (8.0)
14 Garh HP S19 8.1, (0.95) 651, (5.43) 108, (0.36) 17.6, (0.23) 15.55, (0.51) 361, (1.44) 118, (2.62) 1, (0.66) 1962, (3.92) 2803, (9.34)
15 Ghasipura HP S20 8.4, (0.98) 344, (2.87) 88, (0.29) 12.8, (0.17) 13.6, (0.45) 20, (0.08) 38, (0.84) 0.03, (0.02) 847, (1.69) 1210, (4.03)
TW S21 8.3, (0.97) 766, (6.38) 74, (0.25) 13.2, (0.17) 9.96, (0.33) 51, (0.20) 26, (0.58) 11.4, (7.6) 1613, (3.22) 2304, (7.68)
16 Ghata HP S22 7.1, (0.83) 402, (3.35) 437, (1.46) 79.2, (1.05) 58.07, (1.93) 601, (2.40) 11, (0.24) 0.86, (0.57) 2593, (5.18) 3704, (12.35)
TW S23 7.3, (0.85) 467, (3.89) 632, (2.11) 118.8, (1.58) 81.4, (2.71) 468, (1.87) 14, (0.31) 0.7, (0.46) 2171, (4.34) 3101, (10.34)
17 Gudha Meena HP S24 7.8, (0.91) 423, (3.52) 160, (0.53) 26.4, (0.35) 22.84, (0.76) 23, (0.09) 18, (0.4) 0.27, (0.18) 980, (1.96) 1400, (4.67)
18 Gumanpura HP S25 7.8, (0.91) 460, (3.83) 317, (1.06) 51.2, (0.68) 45.92, (1.53) 380, (1.52) 16, (0.35) 0.88, (0.59) 2310, (4.62) 3300, (11.0)
TW S26 7.9, (0.92) 595, (4.96) 528, (1.76) 95.2, (1.27) 70.47, (2.34) 259, (1.03) 72, (1.6) 1.4, (0.93) 1764, (3.52) 2520, (8.4)
19 Gwalini HP S27 7.9, (0.92) 520, (4.33) 374, (1.24) 68.4, (0.91) 49.32, (1.64) 22, (0.08) 8, (0.17) 1.8, (1.2) 1333, (2.66) 1904, (6.35)
20 Hans Mahal HP S28 7.6, (0.89) 157, (1.31) 424, (1.41) 74.8, (0.99) 57.59, (1.92) 220, (0.88) 7, (0.15) 0.32, (0.21) 1182, (2.36) 1688, (5.63)
21 Hanumanpura HP S29 7.7, (0.90) 552, (4.6) 123, (0.41) 20.4, (0.27) 17.49, (0.58) 83, (0.33) 27, (0.6) 0.8, (0.53) 967, (1.93) 1381, (4.60)
TW S30 8.2, (0.96) 784, (6.53) 67, (0.22) 9.2, (0.12) 10.69, (0.36) 95, (0.38) 24, (0.53) 12.5, (8.3) 1473, (2.94) 2104, (7.01)
22 Jhajhwar HP S31 7.4, (0.87) 523, (4.36) 668, (2.23) 113.2, (1.51) 93.55, (3.19) 1430, (5.72) 58, (1.29) 0.41, (0.27) 4235, (8.4) 6050, (20.17)
TW S32 8.4, (0.98) 254, (2.12) 109, (0.36) 18, (0.24) 15.55, (0.52) 107, (0.43) 45, (1.0) 0.8, (0.53) 980, (1.96) 1400, (4.67)
23 Jhar HP S33 7.9, (0.92) 412, (3.43) 233, (0.77) 40.8, (0.54) 31.83, (1.06) 44, (0.17) 37, (0.82) 0.65, (0.43) 960, (1.92) 1371, (4.57)
24 Kalyanpura HP S34 8.5, (1.0) 527, (4.39) 89, (0.29) 14.4, (0.19) 12.87, (0.42) 28, (0.11) 34, (0.75) 1.3, (0.86) 1122, (2.24) 1603, (5.34)
TW S35 8.2, (0.96) 530, (4.41) 65, (0.22) 8.8, (0.18) 10.44, (0.35) 41, (0.16) 16, (0.35) 1.8, (1.2) 1190, (2.38) 1700, (5.67)
25 Kaneta HP S36 7.8, (0.91) 286, (2.38) 364, (1.21) 57.6, (0.77) 53.46, (1.78) 1424, (5.69) 6, (0.13) 0.11, (0.07) 4762, (9.52) 6802, (22.67)
TW S37 8.4, (0.98) 564, (4.7) 77, (0.26) 13.6, (0.18) 10.44, (0.35) 40, (0.16) 14, (0.31) 0.7, (0.46) 1050, (2.1) 1500, (5.0)
26 Kaneti HP S38 7.5, (0.88) 586, (4.88) 867, (2.89) 128.8, (1.72) 132.43, (4.41) 1075, (4.3) 236, (5.24) 1.06, (0.70) 4890, (9.78) 6985, (23.28)
27 Kanota HP S39 8.3, (0.97) 409, (3.41) 203, (0.67) 36, (0.48) 27.45, (0.91) 296, (1.18) 33, (0.73) 0.62, (0.41) 1835, (3.67) 2621, (8.74)
TW S40 8.4, (0.98) 741, (6.17) 91, (0.30) 14.4, (0.19) 13.36, (0.45) 225, (0.9) 8, (0.17) 1.7, (1.13) 1983, (3.96) 2833, (9.44)
28 Kashipura HP S41 7.5, (0.88) 695, (5.79) 105, (0.35) 16, (0.21) 15.79, (0.53) 90, (0.36) 21, (0.46) 3.2, (2.13) 1305, (2.61) 1864, (6.21)
29 Keshopura HP S42 7.6, (0.89) 555, (4.62) 350, (1.17) 56, (0.75) 51.03, (1.70) 644, (2.57) 5, (0.11) 0.75, (0.5) 2520, (5.04) 3600, (12.0)
30 Kuthada Kalan HP S43 7.1, (0.83) 233, (1.94) 66, (0.22) 10, (0.13) 9.96, (0.33) 20, (0.08) 22, (0.49) 0.77, (0.51) 709, (1.41) 1013, (3.38)
31 Lalgarh HP S44 7.6, (0.89) 510, (4.25) 284, (0.95) 48.8, (0.65) 39.36, (1.31) 230, (0.92) 15, (0.33) 1.42, (0.94) 1240, (2.48) 1771, (5.90)
32 Mundali HP S45 7.7, (0.90) 482, (4.02) 117, (0.39) 18.4, (0.25) 17.25, (0.57) 55, (0.22) 12, (0.26) 4.2, (2.8) 1321, (2.64) 1887, (6.29)
TW S46 8.2, (0.96) 734, (6.12) 90, (0.3) 13.6, (0.18) 13.6, (0.45) 152, (0.61) 26, (0.58) 3.38, (2.25) 1682, (3.36) 2404, (8.01)
33 Nagal Karna HP S47 7.4, (0.87) 371, (3.09) 154, (0.51) 22.8, (0.30) 23.57, (0.78) 60, (0.24) 11, (0.24) 4.35, (2.9) 1295, (2.59) 1850, (6.17)
TW S48 8.1, (0.95) 795, (6.62) 73, (0.24) 12.8, (0.17) 9.96, (0.33) 80, (0.32) 26, (0.58) 5.9, (3.93) 1610, (3.22) 2300, (7.67)
34 Parasoli HP S49 7.7, (0.90) 412, (3.43) 774, (2.58) 158.8, (2.18) 150.8, (5.02) 320, (1.28) 2, (0.04) 1.17, (0.78) 2146, (4.29) 3065, (10.21)
TW S50 8.4, (0.98) 464, (3.87) 78, (0.26) 14, (0.19) 10.44, (0.34) 60, (0.24) 23, (0.51) 2.2, (1.46) 1050, (2.1) 1500, (5.0)
35 Parempura HP S51 7.8, (0.91) 431, (3.59) 641, (2.14) 113.2, (1.51) 86.99, (2.89) 444, (1.77) 18, (0.4) 1.15, (0.76) 3474, (6.94) 4963, (16.54)
36 Patan HP S52 7.1, (0.83) 655, (5.46) 622, (2.07) 105.6, (1.41) 86.99, (2.89) 885, (3.54) 10, (0.22) 0.52, (0.34) 3535, (7.07) 5050, (16.83)
37 Peepalabai HP S53 7.2, (0.84) 160, (1.33) 374, (1.24) 83.6, (1.11) 40.09, (1.33) 266, (1.06) 82, (1.82) 1.84, (1.22) 1680, (3.36) 2400, (8.0)
TW S54 8.2, (0.96) 435, (3.62) 400, (1.33) 74, (0.98) 52.24, (1.74) 65, (0.26) 26, (0.58) 8.95, (5.96) 1505, (3.01) 2150, (7.17)
38 Peipura HP S55 7.8, (0.91) 532, (4.43) 267, (0.89) 47.2, (0.63) 36.2, (1.20) 250, (1.0) 11, (0.24) 1.35, (0.9) 1750, (3.5) 2500, (8.33)
TW S56 8.4, (0.98) 435, (3.63) 110, (0.36) 16, (0.21) 17.01, (0.56) 35, (0.14) 28, (0.62) 1.5, (1.0) 875, (1.75) 1250, (4.17)
39 Rajwas HP S57 7.6, (0.89) 648, (5.4) 463, (1.54) 82, (1.09) 62.69, (2.08) 551, (2.20) 52, (1.15) 1.33, (0.88) 2306, (4.61) 3295, (10.98)
40 Ramser HP S58 7.3, (0.85) 520, (4.33) 254, (0.85) 41.2, (0.55) 36.69, (1.22) 60, (0.24) 18, (0.4) 3.8, (2.53) 1050, (2.1) 1500, (5.0)
TW S59 8.4, (0.98) 464, (3.87) 118, (0.39) 17.6, (0.23) 17.98, (0.59) 50, (0.2) 25, (0.55) 2, (1.33) 1053, (2.11) 1504, (5.01)
41 Ratanpura HP S60 7.9, (0.92) 532, (4.43) 299, (0.99) 54, (0.72) 39.85, (1.33) 80, (0.32) 32, (0.71) 1.02, (0.68) 1435, (2.87) 2050, (6.83)
TW S61 8.4, (0.98) 552, (4.6) 88, (0.29) 14, (0.19) 12.87, (0.43) 60, (0.24) 19, (0.42) 1.07, (0.69) 1129, (2.25) 1613, (5.38)
42 Roopura HP S62 7.5, (0.88) 263, (2.19) 107, (0.36) 16.8, (0.22) 15.79, (0.53) 130, (0.52) 24, (0.53) 1.44, (0.96) 1113, (2.23) 1590, (5.3)
TW S63 8.1, (0.95) 415, (3.46) 430, (1.43) 80, (1.06) 55.89, (1.86) 81, (0.32) 25, (0.55) 8.75, (5.83) 1610, (3.22) 2300, (7.67)
43 Sambhariya HP S64 7.4, (0.87) 314, (2.62) 232, (0.77) 38.4, (0.51) 33.04, (1.10) 58, (0.23) 14, (0.31) 0.07, (0.046) 356, (0.71) 508, (1.69)
44 Shankarpura HP S65 7.6, (0.89) 588, (4.9) 134, (0.45) 21.2, (0.28) 19.68, (0.65) 58, (0.23) 6, (0.13) 4.2, (2.8) 1028, (2.06) 1469, (4.89)
45 Siya Ka Bas HP S66 7.7, (0.90) 235, (1.96) 234, (0.78) 39.2, (0.52) 33.04, (1.10) 62, (0.25) 91, (2.02) 0.85, (0.57) 1225, (2.45) 1750, (5.83)
46 Tehda HP S67 8.2, (0.96) 276, (2.3) 145, (0.48) 24.8, (0.33) 20.16, (0.67) 221, (0.88) 20, (0.44) 1.4, (0.93) 1478, (2.95) 2111, (7.03)
47 Tekchandpura HP S68 7.8, (0.91) 328, (2.73) 306, (1.02) 53.2, (0.71) 42.03, (1.40) 40, (0.16) 14, (0.31) 0.2, (0.13) 563, (1.12) 804, (2.68)
48 Tilpatti HP S69 7.8, (0.91) 642, (5.35) 194, (0.65) 32.4, (0.43) 27.45, (0.91) 80, (0.32) 14, (0.31) 0.9, (0.6) 1280, (2.56) 1828, (6.09)
49 Todabhata HP S70 8.5, (1.0) 328, (2.73) 65, (0.22) 8.8, (0.18) 10.44, (0.35) 52, (0.21) 24, (0.53) 2, (1.33) 984, (1.97) 1405, (4.95)
50 Tunga HP S71 7.6, (0.89) 36, (0.3) 38, (0.13) 6.4, (0.08) 5.34, (0.18) 15, (0.06) 10, (0.22) 0.1, (0.06) 63, (0.12) 86, (0.29)
29
S. Swati and S. Umesh / Journal of Environmental Science and Pollution Research 1(1) (2015) 23–31
Cite this Article as: S. Swati, S. Umesh, Nemerow’s pollution index: for ground water quality assessment, J. Env. Sci. Pollut. Res. 1(1) (2015) 23–31.
Table 8 Pollution causing parameters evaluated through Nemerow’s pollution index (NPI) in pre monsoon season
S.
No. Village Source Sample
pH TA TH Ca ions Mg ions Cl- NO3- F- TDS EC
Ci &NPI Ci &NPI Ci &NPI Ci &NPI Ci &NPI Ci &NPI Ci &NPI Ci &NPI Ci &NPI Ci &NPI
1 Akhepura HP S1 8.1, (0.95) 410, (3.41) 406, (1.35) 72, (0.96) 54.91, (1.83) 306, (1.22) 102, (2.27) 1.36, (0.9) 1581, (3.16) 2259, (7.53)
TW S2 8.6, (1.01) 294, (2.45) 82, (0.27) 12.8, (0.17) 12.15, (0.40) 22, (0.08) 21, (0.47) 1.94, (1.2) 616, (1.23) 880, (2.93)
2 Anantpura HP S3 7.7, (0.90) 607, (5.06) 284, (0.95) 48.8, (0.65) 39.36, (1.31) 194, (0.78) 15, (0.33) 0.85, (0.57) 1493, (2.99) 2132, (7.11)
TW S4 7.7, (0.90) 517, (4.31) 540, (1.8) 98, (1.31) 71.68, (2.39) 417, (1.67) 29, (0.64) 0.73, (0.49) 2074, (4.15) 2962, (9.87)
3 Banskho HP S5 7.8, (0.92) 580, (4.83) 478, (1.59) 69.2, (0.92) 74.11, (2.47) 193, (0.77) 31, (0.69) 0.92, (0.62) 1630, (3.26) 2328, (7.76)
TW S6 8.5, (1.0) 363, (3.02) 98, (0.33) 16.4, (0.22) 13.85, (0.46) 98, (0.39) 14, (0.31) 1.54, (1.03) 1207, (2.41) 1724, (5.75)
4 Barala HP S7 7.7, (0.90) 484, (4.03) 110, (0.37) 18, (0.24) 15.79, (0.53) 118, (0.47) 7, (0.16) 1.8, (1.2) 668, (1.34) 954, (3.18)
5 Bassi HP S8 7.6, (0.89) 459, (3.82) 161, (0.54) 27.2, (0.36) 22.59, (0.75) 171, (0.68) 94, (2.09) 0.81, (0.54) 1274, (2.55) 1820, (6.07)
TW S9 7.4, (0.87) 255, (2.12) 187, (0.63) 32, (0.43) 26, (0.87) 113, (0.45) 56, (1.24) 0.51, (0.34) 1356, (2.71) 1937, (6.46)
6 Benada HP S10 8.5, (1.0) 838, (6.98) 254, (0.85) 44.4, (0.59) 34.74, (1.16) 107, (0.43) 59, (1.31) 0.98, (0.65) 1612, (3.22) 2303, (7.68)
7 Bharampur HP S11 7.8, (0.92) 482, (4.02) 364, (1.21) 65.2, (0.87) 48.84, (1.63) 146, (0.58) 21, (0.47) 0.6, (0.4) 1044, (2.09) 1491, (4.97)
8 Chainpuriya HP S12 7.7, (0.90) 703, (5.86) 261, (0.87) 45.2, (0.61) 35.96, (1.19) 118, (0.47) 11, (0.24) 1, (0.67) 1206, (2.41) 1723, (5.74)
9 Chapariya HP S13 7.7, (0.90) 282, (2.35) 211, (0.70) 35.2, (0.47) 29.88, (0.99) 28, (0.11) 27, (0.6) 0.9, (0.6) 424, (0.85) 605, (2.02)
10 Charangarh HP S14 7.7, (0.90) 168, (1.4) 220, (0.73) 36.8, (0.49) 31.1, (1.04) 40, (0.16) 27, (0.6) 0.32, (0.21) 432, (0.86) 617, (2.06)
11 Chatarpura HP S15 7.6, (0.89) 698, (5.82) 147, (0.49) 25.2, (0.34) 20.41, (0.68) 60, (0.24) 18, (0.4) 2.6, (1.73) 956, (1.91) 1365, (4.55)
12 Danau Kalan HP S16 7.6, (0.89) 454, (3.78) 159, (0.53) 26.4, (0.35) 22.59, (0.75) 34, (0.14) 24, (0.53) 1.17, (0.78) 712, (1.42) 1018, (3.39)
13 Danau Khurd HP S17 7.2, (0.85) 312, (2.6) 660, (2.2) 94.8, (1.26) 102.78, (3.43) 103, (0.41) 106, (2.36) 0.45, (0.3) 910, (1.82) 1300, (4.33)
TW S18 7.8, (0.92) 382, (3.18) 337, (1.12) 60.4, (0.50) 45.19, (1.51) 84, (0.34) 29, (0.64) 2.6, (1.73) 1478, (2.96) 2111, (7.04)
14 Garh HP S19 7.8, (0.92) 422, (3.52) 777, (2.59) 156.8, (2.09) 93.55, (3.12) 355, (1.42) 94, (2.09) 1.02, (0.68) 1685, (3.37) 2407, (8.02)
15 Ghasipura HP S20 7.7, (0.90) 365, (3.04) 127, (0.42) 20.4, (0.27) 18.46, (0.61) 21, (0.08) 13, (0.29) 0.55, (0.37) 640, (1.28) 914, (3.05)
TW S21 7.9, (0.93) 817, (6.81) 92, (0.31) 14.8, (0.19) 13.36, (0.44) 54, (0.22) 19, (0.42) 11.9, (7.93) 1271, (2.54) 1816, (6.05)
16 Ghata HP S22 7.9, (0.93) 443, (3.69) 313, (1.04) 56, (0.75) 42.03, (1.40) 246, (0.98) 14, (0.31) 1.43, (0.95) 1414, (2.83) 2020, (6.73)
TW S23 7.7, (0.90) 514, (4.28) 501, (1.67) 86.8, (1.16) 69.01, (2.30) 367, (1.47) 17, (0.38) 0.96, (0.64) 1669, (3.34) 2384, (7.95)
17 Gudha Meena HP S24 7.6, (0.89) 403, (3.36) 199, (0.66) 35.2, (0.47) 26.97, (0.89) 20, (0.08) 19, (0.42) 0.4, (0.27) 642, (1.28) 917, (3.06)
18 Gumanpura HP S25 7.7, (0.90) 384, (3.2) 208, (0.69) 35.6, (0.47) 28.91, (0.96) 103, (0.41) 8, (0.18) 2, (1.33) 808, (1.62) 1154, (3.85)
TW S26 7.8, (0.92) 509, (4.24) 404, (1.35) 72.4, (0.96) 54.18, (1.80) 183, (0.73) 53, (1.18) 2.5, (1.67) 1205, (2.41) 1721, (5.74)
19 Gwalini HP S27 7.7, (0.90) 510, (4.25) 270, (0.9) 50, (0.67) 35.23, (1.17) 80, (0.32) 6, (0.13) 1.4, (0.93) 891, (1.78) 1273, (4.24)
20 Hans Mahal HP S28 7.6, (0.89) 476, (3.97) 1100, (3.67) 169.2, (2.25) 164.51, (5.48) 1455, (5.82) 20, (0.44) 2.08, (1.39) 5434, (10.87) 7763, (25.87)
21 Hanumanpura HP S29 7.1, (0.83) 560, (4.67) 316, (1.05) 57.6, (0.77) 41.79, (1.39) 507, (2.03) 95, (2.11) 1.6, (1.07) 2196, (4.39) 3137, (10.46)
TW S30 7.5, (0.88) 812, (6.77) 92, (0.31) 13.2, (0.18) 14.33, (0.48) 148, (0.59) 37, (0.82) 12.2, (8.13) 1837, (3.67) 2624, (8.75)
22 Jhajhwar HP S31 7.9, (0.93) 575, (4.79) 440, (1.47) 76, (0.63) 60.75, (2.02) 436, (1.74) 41, (0.91) 1.1, (0.73) 2204, (4.41) 3149, (10.49)
TW S32 8.6, (1.01) 278, (2.32) 76, (0.25) 12.4, (0.16) 10.93, (0.36) 154, (0.62) 38, (0.84) 1.08, (0.72) 647, (1.29) 924, (3.08)
23 Jhar HP S33 7.8, (0.92) 488, (4.07) 271, (0.90) 47.2, (0.63) 37.17, (1.24) 63, (0.25) 32, (0.38) 0.41, (0.27) 926, (1.85) 1322, (4.41)
24 Kalyanpura HP S34 7.8, (0.92) 256, (2.13) 307, (1.02) 53.6, (0.71) 42.03, (1.40) 30, (0.12) 18, (0.4) 0.8, (0.53) 487, (0.97) 696, (2.32)
TW S35 7.8, (0.92) 318, (2.65) 83, (0.28) 11.6, (0.15) 13.12, (0.44) 52, (0.21) 13, (0.29) 1.2, (0.8) 607, (1.21) 867, (2.89)
25 Kaneta HP S36 7.7, (0.90) 223, (4.86) 268, (0.89) 42, (0.56) 39.6, (1.32) 57, (0.23) 14, (0.31) 0.5, (0.33) 804, (1.61) 1148, (3.83)
TW S37 8.2, (0.96) 459, (3.82) 56, (0.19) 10.4, (0.14) 7.29, (0.24) 34, (0.14) 21, (0.47) 0.39, (0.26) 651, (1.30) 930, (3.1)
26 Kaneti HP S38 7.4, (0.87) 674, (5.62) 347, (1.16) 51.6, (0.69) 52.97, (1.76) 80, (0.32) 2, (0.04) 0.14, (0.09) 918, (1.84) 1312, (4.37)
27 Kanota HP S39 7.5, (0.88) 415, (3.46) 361, (1.20) 59.2, (0.79) 51.75, (1.72) 342, (1.37) 40, (0.89) 1.3, (0.87) 1436, (2.87) 2051, (6.84)
TW S40 7.8, (0.92) 689, (5.74) 134, (0.45) 24.4, (0.32) 17.73, (0.59) 266, (1.06) 11, (0.24) 2.3, (1.53) 1606, (3.21) 2294, (7.65)
28 Kashipura HP S41 7.6, (0.89) 411, (3.42) 161, (0.54) 25.6, (0.34) 23.57, (0.78) 86, (0.34) 19, (0.42) 1.35, (0.9) 910, (1.82) 1301, (4.34)
29 Keshopura HP S42 7.6, (0.89) 330, (2.75) 227, (0.76) 36.8, (0.49) 32.8, (1.09) 80, (0.32) 26, (0.58) 0.49, (0.33) 1333, (2.66) 1904, (6.35)
30 Kuthada Kalan HP S43 7.6, (0.89) 785, (6.54) 262, (0.87) 44, (0.59) 36.93, (1.23) 42, (0.17) 21, (0.47) 0.5, (0.33) 800, (1.6) 1142, (3.81)
31 Lalgarh HP S44 7.7, (0.90) 505, (4.21) 185, (0.62) 32, (0.43) 25.51, (0.85) 105, (0.42) 49, (1.09) 0.9, (0.6) 1042, (2.08) 1488, (4.96)
32 Mundali HP S45 7.8, (0.92) 600, (5.0) 106, (0.35) 16.8, (0.22) 15.55, (0.52) 92, (0.37) 21, (0.47) 5.6, (3.73) 1131, (2.26) 1616, (5.39)
TW S46 8.3, (0.98) 822, (6.85) 77, (0.26) 12.4, (0.16) 11.17, (0.37) 206, (0.82) 32, (0.71) 4.02, (2.68) 1951, (3.90) 2787, (9.29)
33 Nagal Karna HP S47 7.7, (0.90) 389, (3.24) 119, (0.39) 17.2, (0.23) 18.46, (0.61) 148, (0.59) 2, (0.04) 1.9, (1.27) 608, (1.22) 869, (2.89)
TW S48 8.5, (1.0) 859, (7.16) 53, (0.18) 8.4, (0.11) 7.77, (0.26) 112, (0.45) 19, (0.42) 3.25, (2.16) 822, (1.64) 1174, (3.91)
34 Parasoli HP S49 7.8, (0.92) 440, (3.67) 553, (1.84) 112, (1.49) 66.33, (2.21) 326, (1.30) 15, (0.33) 1.43, (0.95) 1322, (2.64) 1889, (6.29)
TW S50 8.5, (1.0) 516, (4.3) 48, (0.16) 8.8, (0.12) 6.31, (0.21) 56, (0.22) 34, (0.76) 1.8, (1.2) 693, (1.39) 990, (3.3)
35 Parempura HP S51 7.8, (0.92) 403, (3.36) 520, (1.73) 80, (1.06) 77.76, (2.59) 475, (1.9) 13, (0.29) 0.8, (0.53) 2880, (5.76) 4114, (13.71)
36 Patan HP S52 7.7, (0.90) 535, (4.46) 479, (1.59) 79.6, (1.06) 68.04, (2.27) 652, (2.61) 18, ( 0.4) 1.22, (0.81) 2468, (4.94) 3526, (11.75)
37 Peepalabai HP S53 7.8, (0.92) 206, (1.72) 228, (0.76) 49.2, (0.66) 25.51, (0.85) 58, (0.23) 25, (0.56) 0.5, (0.33) 408, (0.82) 583, (1.94)
TW S54 7.7, (0.90) 513, (4.27) 248, (0.83) 39.6, (0.53) 36.2, (1.21) 38, (0.15) 16, (0. 36) 5.3, (3.53) 723, (1.45) 1033, (3.44)
38 Peipura HP S55 7.7, (0.90) 700, (5.83) 242, (0.81) 42.4, (0.56) 33.04, (1.10) 446, (1.78) 24, (0.53) 1.23, (0.82) 1946, (3.89) 2780, (9.26)
TW S56 8.2, (0.96) 504, (4.2) 97, (0.32) 13.6, (0.18) 15.3, (0.51) 47, (0.19) 41, (0.91) 1.3, (0.87) 1016, (2.03) 1451, (4.84)
39 Rajwas HP S57 7.6, (0.89) 704, (5.86) 428, (1.43) 73.2, (0.98) 59.53, (1.98) 320, (1.28) 27, (0.6) 1.3, (0.87) 2883, (5.77) 4118, (13.73)
40 Ramser HP S58 7.3, (0.86) 540, (4.5) 210, (0.7) 34, (0.45) 30.37, (1.01) 100, (0.4) 13, (0.29) 1.3, (0.87) 1040, (2.08) 1485, (4.95)
TW S59 8.3, (0.98) 483, (4.02) 89, (0.29) 10.8, (0.14) 15.06, (0.50) 66, (0.26) 21, (0.47) 1.06, (0.71) 924, (1.85) 1320, (4.4)
41 Ratanpura HP S60 7.8, (0.92) 860, (7.16) 260, (0.87) 45.2, (0.60) 35.72, (1.19) 193, (0.77) 8, (0.18) 1.13, (0.75) 1600, (3.2) 2286, (7.62)
TW S61 7.9, (0.93) 871, (7.26) 190, (0.63) 30, (0.4) 27.94, (0.93) 130, (0.52) 19, (0.42) 2.65, (1.77) 1440, (2.88) 2057, (6.86)
42 Roopura HP S62 7.8, (0.92) 353, (2.94) 243, (0.81) 44, (0.59) 32.31, (1.08) 60, (0.24) 30, (0.67) 1.4, (0.93) 722, (1.44) 1031, (3.44)
TW S63 8.4, (0.99) 511, (4.26) 627, (2.09) 113.2, (1.51) 83.59, (2.79) 58, (0.23) 28, (0.62) 8.49, (5.66) 1159, (2.32) 1656, (5.52)
43 Sambhariya HP S64 7.6, (0.89) 425, (3.54) 145, (0.48) 24, (0.32) 20.65, (0.69) 30, (0.12) 30, (0.67) 2.25, (1.5) 920, (1.84) 1314, (4.38)
44 Shankarpura HP S65 7.8, (0.92) 540, (4.5) 197, (0.66) 34, (0.45) 27.21, (0.91) 80, (0.32) 2, (0.04) 3.6, (2.4) 1125, (2.25) 1607, (5.36)
45 Siya Ka Bas HP S66 7.6, (0.89) 313, (2.61) 179, (0.59) 29.2, (0.39) 25.75, (0.86) 56, (0.22) 71, (1.58) 1.13, (0.75) 773, (1.55) 1104, (3.68)
46 Tehda HP S67 7.7, (0.90) 425, (3.54) 174, (0.58) 28.8, (0.38) 24.78, (0.83) 172, (0.69) 24, (0.53) 1.55, (1.03) 1140, (2.28) 1629, (5.43)
47 Tekchandpura HP S68 7.8, (0.92) 254, (2.12) 292, (0.97) 52, (0.69) 39.36, (1.31) 40, (0.16) 12, (0.27) 0.25, (0.17) 529, (1.06) 756, (2.52)
48 Tilpatti HP S69 7.8, (0.92) 633, (5.27) 366, (1.22) 61.2, (0.82) 51.75, (1.72) 114, (0.46) 22, (0.49) 0.76, (0.51) 1306, (2.61) 1867, (6.22)
49 Todabhata HP S70 7.8, (0.92) 550, (4.58) 129, (0.43) 21.6, (0.29) 18.22, (0.61) 63, (0.25) 20, (0.44) 1.8, (1.2) 1043, (2.09) 1490, (4.97)
50 Tunga HP S71 7.8, (0.92) 290, (2.42) 780, (2.6) 158, (2.11) 93.55, (3.19) 288, (1.15) 309, (6.87) 0.65, (0.43) 1604, (3.21) 2291, (7.64)
30
Cite this Article as: S. Swati, S. Umesh, Nemerow’s pollution index: for ground water quality assessment, J. Env. Sci. Pollut. Res. 1(1) (2015) 23–31.
S. Swati and S. Umesh / Journal of Environmental Science and Pollution Research 1(1) (2015) 23–31
Table 9 Pollutants present at each selected sampling sites as per NPI in pre monsoon
S.No. Village Source Sample Pollutants
1 Akhepura HP S1 TA, TH, Ca, Mg, Chloride,
Nitrate, TDS and EC
TW S2 TA, TDS and EC
2 Anantpura HP S3 TA, TH, Mg, Chloride, TDS and
EC
TW S4 TA, Fluoride, TDS and EC
3 Banskho HP S5 TA, TH, Mg, Fluoride, TDS and
EC
TW S6 TA, Fluoride, TDS and EC
4 Barala HP S7 TA, Chloride, Nitrate, Fluoride,
TDS and EC
5 Bassi HP S8 TA, Nitrate, TDS and EC
TW S9 TA, TDS and EC
6 Benada HP S10 TA, TH, Ca, Mg, Chloride, TDS
and EC
7 Bharampur HP S11 TA, TDS and EC
8 Chainpuriya HP S12 TA, TDS and EC
9 Chapariya HP S13 TA, Nitrate, TDS and EC
10 Charangarh HP S14 TA, Mg, TDS and EC
11 Chatarpura HP S15 TA, Fluoride, TDS and EC
12 Danau Kalan HP S16 TA, TDS and EC
13 Danau Khurd HP S17 TA, TH, Ca, Mg, Chloride, TDS
and EC
TW S18 TA, Mg, Fluoride, TDS and EC
14 Garh HP S19 TA, Chloride, Nitrate, TDS and
EC
15 Ghasipura HP S20 TA, TDS and EC
TW S21 TA, Fluoride, TDS and EC
16 Ghata HP S22 TA, TH, Ca, Mg, Chloride, TDS
and EC
TW S23 TA, TH, Ca, Mg, Chloride, TDS
and EC
17 Gudha Meena HP S24 TA, TDS and EC
18 Gumanpura HP S25 TA, TH, Mg, Chloride, TDS and
EC
TW S26 TA, TH, Ca, Mg, Chloride,
Nitrate, TDS and EC
19 Gwalini HP S27 TA, TH, Mg, Fluoride, TDS and
EC
20 Hans Mahal HP S28 TA, TH, Mg, TDS and EC
21 Hanumanpura HP S29 TA, TDS and EC
TW S30 TA, Fluoride, TDS and EC
22 Jhajhwar HP S31 TA, TH, Ca, Mg, Chloride,
Nitrate, TDS and EC
TW S32 TA, TDS and EC
23 Jhar HP S33 TA, Mg, TDS and EC
24 Kalyanpura HP S34 TA, TDS and EC
TW S35 TA, Fluoride, TDS and EC
25 Kaneta HP S36 TA, TH, Mg, Chloride, TDS and
EC
TW S37 TA, TDS and EC
26 Kaneti HP S38 TA, TH, Ca, Mg, Chloride,
Nitrate, TDS and EC
27 Kanota HP S39 TA, Chloride, TDS and EC
TW S40 TA, Fluoride, TDS and EC
28 Kashipura HP S41 TA, Fluoride, TDS and EC
29 Keshopura HP S42 TA, TH, Mg, Chloride, TDS and
EC
30 Kuthada Kalan HP S43 TA, TDS and EC
31 Lalgarh HP S44 TA, Mg, TDS and EC
32 Mundali HP S45 TA, Fluoride, TDS and EC
TW S46 TA, Fluoride, TDS and EC
33 Nagal Karna HP S47 TA, Fluoride, TDS and EC
TW S48 TA, Fluoride, TDS and EC
34 Parasoli HP S49 TA, TH, Ca, Mg, Chloride, TDS
and EC
TW S50 TA, Fluoride, TDS and EC
35 Parempura HP S51 TA, TH, Ca, Mg, Chloride, TDS
and EC
36 Patan HP S52 TA, TH, Ca, Mg, Chloride, TDS
and EC
37 Peepalabai HP S53 TA, TH, Ca, Mg, Chloride,
Nitrate, Fluoride, TDS and EC
TW S54 TA, TH, Mg, Fluoride, TDS and
EC
38 Peipura HP S55 TA, Mg, TDS and EC
S.No. Village Source Sample Pollutants
TW S56 TA, TDS and EC
39 Rajwas HP S57 TA, TH, Ca, Mg, Chloride,
Nitrate, TDS and EC
40 Ramser HP S58 TA, Mg, Fluoride, TDS and EC
TW S59 TA, Fluoride, TDS and EC
41 Ratanpura HP S60 TA, Mg, TDS and EC
TW S61 TA, TDS and EC
42 Roopura HP S62 TA, TDS and EC
TW S63 TA, TH, Ca, Mg, Fluoride, TDS
and EC
43 Sambhariya HP S64 TA, Mg and EC
44 Shankarpura HP S65 TA, Fluoride, TDS and EC
45 Siya Ka Bas HP S66 TA, Mg, Nitrate, TDS and EC
46 Tehda HP S67 TA, TDS and EC
47 Tekchandpura HP S68 TA, TH, Mg, TDS and EC
48 Tilpatti HP S69 TA, TDS and EC
49 Todabhata HP S70 TA, Fluoride, TDS and EC
50 Tunga HP S71 Nil
Table 10 Pollutants present at each selected stations as per NPI in post monsoon season
S.No. Village Source Sample Pollutants
1 Akhepura HP S1 TA, TH, Mg, Chloride, Nitrate, TDS
and EC
TW S2 pH, TA, Fluoride, TDS and EC
2 Anantpura HP S3 TA, Mg, TDS and EC
TW S4 TA, TH, Ca, Mg, Chloride, TDS and EC
3 Banskho HP S5 TA, TH, Mg, TDS and EC
TW S6 TA, Fluoride, TDS and EC
4 Barala HP S7 TA, Fluoride, TDS and EC
5 Bassi HP S8 TA, Nitrate, TDS and EC
TW S9 TA, Nitrate, TDS and EC
6 Benada HP S10 TA, Mg, Nitrate, TDS and EC
7 Bharampur HP S11 TA, TH, Mg, TDS and EC
8 Chainpuriya HP S12 TA, Mg, TDS and EC
9 Chapariya HP S13 TA and EC
10 Charangarh HP S14 TA, Mg and EC
11 Chatarpura HP S15 TA, Fluoride, TDS and EC
12 Danau Kalan HP S16 TA, TDS and EC
13 Danau Khurd HP S17 TA, TH, Ca, Mg, Nitrate, TDS and EC
TW S18 TA, TH, Mg, Fluoride, TDS and EC
14 Garh HP S19 TA, TH, Ca, Mg, Chloride, Nitrate, TDS
and EC
15 Ghasipura HP S20 TA, TDS and EC
TW S21 TA, Fluoride, TDS and EC
16 Ghata HP S22 TA, TH, Mg, TDS and EC
TW S23 TA, TH, Ca, Mg, Chloride, TDS and EC
17 Gudha Meena HP S24 TA, TDS and EC
18 Gumanpura HP S25 TA, Fluoride, TDS and EC
TW S26 TA, TH, Mg, Nitrate, Fluoride, TDS
and EC
19 Gwalini HP S27 TA, Mg, TDS and EC
20 Hans Mahal HP S28 TA, TH, Ca, Mg, Chloride, Fluoride,
TDS and EC
21 Hanumanpura HP S29 TA, TH, Mg, Chloride, Nitrate,
Fluoride, TDS and EC
TW S30 TA, Fluoride, TDS and EC
22 Jhajhwar HP S31 TA, TH, Mg, Chloride, TDS and EC
TW S32 pH, TA, TDS and EC
23 Jhar HP S33 TA, Mg, TDS and EC
24 Kalyanpura HP S34 TA, TH, Mg and EC
TW S35 TA,TDS and EC
25 Kaneta HP S36 TA, Mg, TDS and EC
TW S37 TA,TDS and EC
26 Kaneti HP S38 TA, TH, Mg, TDS and EC
27 Kanota HP S39 TA, TH, Mg, Chloride, TDS and EC
TW S40 TA, Chloride, Fluoride, TDS and EC
28 Kashipura HP S41 TA, TDS and EC
29 Keshopura HP S42 TA, Mg, TDS and EC
30 Kuthada Kalan HP S43 TA, Mg, TDS and EC
31 Lalgarh HP S44 TA, Nitrate, TDS and EC
32 Mundali HP S45 TA, Fluoride, TDS and EC
TW S46 TA, Fluoride, TDS and EC
33 Nagal Karna HP S47 TA, Fluoride, TDS and EC
TW S48 TA, Fluoride, TDS and EC
34 Parasoli HP S49 TA, TH, Ca, Mg, Chloride, TDS and EC
TW S50 TA, Fluoride, TDS and EC
31
Cite this Article as: S. Swati, S. Umesh, Nemerow’s pollution index: for ground water quality assessment, J. Env. Sci. Pollut. Res. 1(1) (2015) 23–31.
S. Swati and S. Umesh / Journal of Environmental Science and Pollution Research 1(1) (2015) 23–31
S.No. Village Source Sample Pollutants
35 Parempura HP S51 TA, TH, Ca, Mg, Chloride, TDS and EC
36 Patan HP S52 TA, TH, Ca, Mg, Chloride, TDS and EC
37 Peepalabai HP S53 TA and EC
TW S54 TA, Mg, Fluoride, TDS and EC
38 Peipura HP S55 TA, Mg, Chloride, TDS and EC
TW S56 TA,TDS and EC
39 Rajwas HP S57 TA, TH, Mg, Chloride, TDS and EC
40 Ramser HP S58 TA, Mg, TDS and EC
TW S59 TA, TDS and EC
41 Ratanpura HP S60 TA, Mg, TDS and EC
TW S61 TA, Fluoride, TDS and EC
42 Roopura HP S62 TA, Mg, TDS and EC
TW S63 TA, TH, Ca, Mg, Fluoride, TDS and EC
43 Sambhariya HP S64 TA, Fluoride, TDS and EC
44 Shankarpura HP S65 TA, Fluoride, TDS and EC
45 Siya Ka Bas HP S66 TA, Nitrate, TDS and EC
46 Tehda HP S67 TA, Fluoride, TDS and EC
47 Tekchandpura HP S68 TA, Mg, TDS and EC
48 Tilpatti HP S69 TA, TH, Mg, TDS and EC
49 Todabhata HP S70 TA, Fluoride, TDS and EC
50 Tunga HP S71 TA, TH, Ca, Mg, Chloride, Nitrate, TDS
and EC
4. Conclusion
The principal pollutants (pollution causing parameters) observed in the present study are total alkalinity, chloride, fluoride, nitrate, total dissolved solids and electrical conductivity in both pre and post monsoon seasons. Though, some sampling sites also exhibits total hardness, calcium and magnesium as principal pollutants with other parameters whilst by analyzing the NPI values in both seasons it can also be concluded that in some samples all parameters except pH behaves like pollution causing parameters. In pre monsoon season all groundwater samples have pH value under the permissible limit whereas in post monsoon season two samples have higher pH value.
The results of current study revealed that ground water, used by the people residing in villages of Bassi Tehsil, is not suitable for drinking purpose. So, there is a need of continuous monitoring of water quality and proper environment management plan must be adopted to control drinking water pollution immediately. Based on these results and analysis of water samples, it is also recommended to use water only after boiling and filtering or by Reverse osmosis treatment for drinking purpose by the individuals to prevent adverse health effects. References
[1] S.S. Dhindsa, Ground water quality status of Rajasthan-2001, Validated up to 31-03-2003, Technical Paper, National workshop on control and mitigation of excess fluoride in drinking water, Govt. of Rajasthan and UNICEF, Jaipur, Rajasthan, India, 2004.
[2] A. Darbi, T. Viraraghavan, R. Butler, D. Corkal, Column studies on nitrate removal from potable water, Water Air Soil Pollut. (2003) 235-254.
[3] Y. Musturia, Fluorosis prone areas of Tonk District, Rajasthan, Technical Paper, National Work Shop on Control and Mitigition of Excess Fluoride in Drinking Water, Govt. of Rajasthan and UNICEF, Jaipur, Rajasthan, India, 2004.
[4] I. Hussain, J. Hussain, K.C. Sharma, K.G. Ojha, Fluoride in ground water and health hazards: some observation of fluoride distribution in Rajasthan, Envir. Scena. 21st Cent. 18 (2003) 355-374.
[5] P. Singh, B. Rani, U. Singh, R. Maheshwari, Fluoride contamination in ground water of Rajasthan and its mitigation strategies, J. Pharm. Bio-med. Sci. 6(6) (2011) 1-12.
[6] A. M. Hussain, I. Hussain, J. Sharma, S. Kumar, Potential fluoride contamination in the drinking water of Nagaur Tehsil of Nagaur district, Rajasthan, India, Bull. Envir. Cont. Toxic. 88(6) (2012) 870-875.
[7] H.W. Khandare, Scenario of nitrate contamination in ground water: Its causes and Prevention, Int. J. Chem. Tech. Res. 5(4) (2013) 1921-1926.
[8] U. Saxena, S. Saxena, The statistical assessment of fluoride and nitrate contamination status of ground water in various tehsils of district Jaipur, Rajasthan, India, Int. J. Res. Stu. Biosci. 3(3) (2015) 106-130.
[9] S.D. Rathod, M. Mohsin, M. Farooqui, Water quality index in & around Waluj –Shendra industrial area, Aurangabad. (M.S.), Asian J. Biochem. Pharm. Res. 2(1) (2011) 368-372.
[10] L.R. Bhalla, K. Bhalla, Contemporary Rajasthan, 8th Ed., Kuldeep Publication, India, 2013.
[11] A.K. Yadav, P. Khan, S.K. Sharma, Water quality index assessment of ground water in Todarai Singh Tehsil of Rajasthan state, India –A greener approach, E-Jour. Chem. 7 (2010) S428-S432.
[12] O.P. Singh, S.S. Singh, S. Kumar, Rainfall profile of Jaipur- report of Meteorological Centre, Jaipur, India Meteorological Department, Ministry of Earth Sciences, Government of India, New Delhi, 2012.
[13] Central Ground Water Board, Ministry of Water Resources, Government of India, Ground Water Scenario, Jaipur District, Rajasthan, CGWB, Jaipur, 2007.
[14] Jaipur Development Authority, Master Development Plan-2025, Jaipur Region (Vol. 1), JDA, Jaipur, 2012.
[15] L.N. Mathur, Ground Water Scenario of Jaipur, in: S. Chaturvedi (Eds.), Water Challenges and Solutions, Manan Design and Publication, India, 2007, pp.98-101.
[16] E. Brown, M.W. Skougstad, M. J. Fishman, Method for collection and analysis of water sample for dissolved minerals for dissolved minerals and gases, Book No. 5, Washington, DC, 1974.
[17] APHA, Standard methods for the examination of water and waste water, 21st Ed., Washington, DC, 2005.
[18] U.T. Madhuri, T. Srinivas, K. Sirisha, A study on groundwater quality in commercial areas of Visakhapatnam, J. Poll. Res. 23(3) (2004) 565-568.
[19] U.T. Madhuri, B. Subhashini, A study of groundwater quality in residential colonies of Visakhapatnam, in: Water Pollution, APH Publishing Corporation, New Delhi, 2004.
[20] P. Verma, D. Chandawat, U. Gupta, H. Solanki, Water quality analysis of an organically polluted lake by investigating different physical and chemical parameters, Int. J. Res. Chem. Environ. 2(1) (2012) 105-111.
[21] D. Dohare, S. Deshpande, A. Kotiya, Analysis of ground water quality parameters: A Review, Res. J. Eng. Sci. 3(5) (2014) 26-31.
[22] S. Tikle, M.J. Saboori, R. Sankpal, Spatial distribution of ground water quality in some selected parts of Pune city, Maharashtra, India using GIS, Curr. Wor. Environ. 7(2) (2012) 281-286.
[23] V.G. Jhingran, Fish and Fisheries of India, Hindustan Publishing Corporation, Delhi, India, 1975.
[24] B. Prasad, Evaluation of water quality in Tadepalli Mandal of Guntur District, A.P., Environ. Poll. Tech. 2(3) (2003) 273-276.
[25] S. Malik, S. Banerji, Nitrate pollution of ground water as a result of agriculture development in Indo-Gango Plain, India, In: Proceedings of International symposium on quality of groundwater the Nether lands, 1981.
[26] A.P. Hamilton, J.R. Shedlock, Are fertilizers and pesticides in the groundwater?: A case study of the Delmarve Peninsula, Delaware, Maryland, Virginia, VSGS circ. 1080 (1992) 1-16.
[27] A.K. Yadav, P. Khan, U. Saxena, Geo-chemical observation of fluoride in ground water of Tonk (Rajasthan), Ras. J. Chem. 2(4) (2009) 994-1000.
[28] V. Veeraputhiran, G. Alagumuthu, A report on fluoride distribution in drinking water, Int. Jour. Environ. Sci. 1(4) (2010) 558-566.
[29] A.K. Singh, J.K. Tripathi, G.C. Chowdary, Hydrochemistry and quality assessment of groundwater in Naini Industrial area, Allahabad district, Uttar Pradesh, J. Geo. Sci. Ind. 55 (2000) 77-89.
[30] A. Murugesan, A. Ramu, N. Kannan, Water quality assessment from Uthamapalayam municipality in Theni District, Tamil Nadu, India, Poll. Res. 25(1) (2006) 163–166.


![Pollution Index for Industrial Custers[1]](https://img.pdfslide.net/doc/110x75/577d39461a28ab3a6b997200/pollution-index-for-industrial-custers1.jpg)