Embed Size (px)
DESCRIPTION
document
Citation preview

NetScout® Systems, Inc.Westford, MA 01886Telephone: 978.614.4000Fax: 978.614.4004
Web: http://www.netscout.com
NetScout nGenius Real-Time Monitor™ 1.4 Getting Started Guide293-1020 Rev. A
Contents

ii
Use of this product is subject to the Terms and Conditions of the NetScout Systems, Inc. Software License Agreement, which accompanies the product at the time of shipment.
Notice of Restricted Rights:
Use, duplication, or disclosure by the Government is subject to restrictions as set forth in subparagraph (c) of the Commercial Computer Software - Restricted Rights clause at FAR §52.227-19 and subparagraph (c)(1)(ii) of the Rights in Technical Data and Computer Software clause at DFARS §252.227-7013. The information in this manual is subject to change without notice.
NetScout� is a registered trademark and the NetScout logo, “Because the Network is the Business”, NetScout Manager Plus, WebCast, and the nGenius family of products are trademarks of NetScout Systems, Inc.
UNIX� is a registered trademark in the United States and other countries licensed exclusively by X/Open Company Limited. Microsoft�, Microsoft� Windows NT� Server, Microsoft� Windows�95, Microsoft� SQL Server, and Microsoft� Internet Explorer are registered trademarks and trademarks of Microsoft� Corporation. Sun is a trademark of Sun Microsystems, Inc. SPARCstation is a trademark of SPARC International, Inc. Solaris� is a registered trademark of Sun Microsystems, Inc. Netscape� is a registered trademark of Netscape Communications Corporation. Intel�, is a registered trademark of Intel Corporation. HP, HP-UX�, HP Openview�, are trademarks and registered trademarks of Hewlett Packard Company. IBM NetView� is a registered trademark of International Business Machines Corporation. Fast EtherChannel� is a registered trademark of Cisco Systems, Inc. in the U.S. and certain other countries. All other brand names, company identifiers, trademarks, service trademarks, registered trademarks and registered service marks mentioned in this document or NetScout’s license agreement are properties of their respective owners, and protected as such against unlawful use or distribution.
NetScout nGenius Real-Time Monitor™ Getting Started Guide293-1020 Rev. ACopyright 2002 NetScout Systems, Inc. Printed in the USA.All rights reserved.
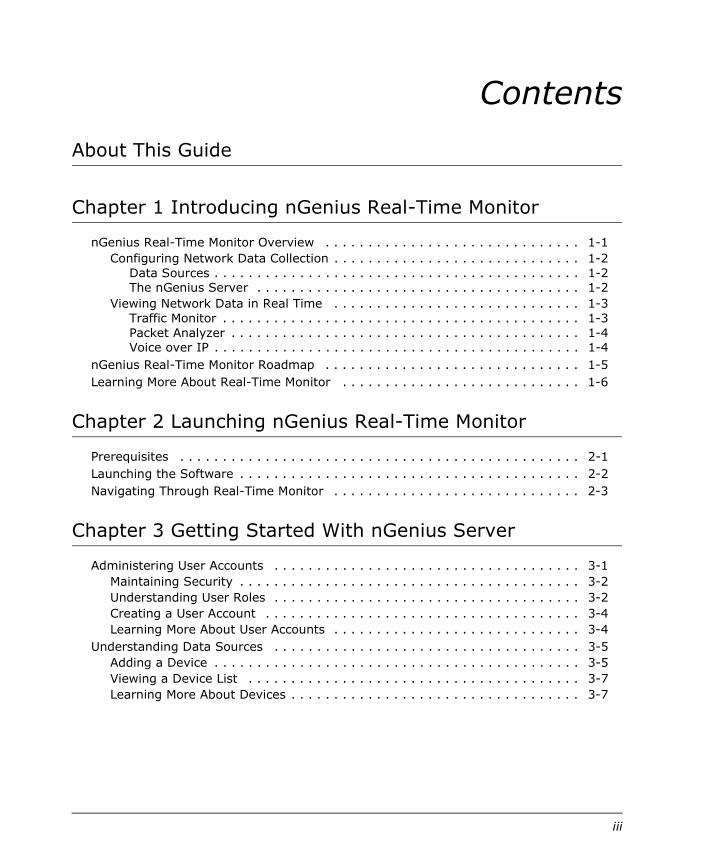
Contents
About This Guide
Chapter 1 Introducing nGenius Real-Time Monitor
nGenius Real-Time Monitor Overview . . . . . . . . . . . . . . . . . . . . . . . . . . . . . . 1-1Configuring Network Data Collection . . . . . . . . . . . . . . . . . . . . . . . . . . . . . 1-2
Data Sources . . . . . . . . . . . . . . . . . . . . . . . . . . . . . . . . . . . . . . . . . . . 1-2The nGenius Server . . . . . . . . . . . . . . . . . . . . . . . . . . . . . . . . . . . . . . 1-2
Viewing Network Data in Real Time . . . . . . . . . . . . . . . . . . . . . . . . . . . . . 1-3Traffic Monitor . . . . . . . . . . . . . . . . . . . . . . . . . . . . . . . . . . . . . . . . . . 1-3Packet Analyzer . . . . . . . . . . . . . . . . . . . . . . . . . . . . . . . . . . . . . . . . . 1-4Voice over IP . . . . . . . . . . . . . . . . . . . . . . . . . . . . . . . . . . . . . . . . . . . 1-4
nGenius Real-Time Monitor Roadmap . . . . . . . . . . . . . . . . . . . . . . . . . . . . . . 1-5Learning More About Real-Time Monitor . . . . . . . . . . . . . . . . . . . . . . . . . . . . 1-6
Chapter 2 Launching nGenius Real-Time Monitor
Prerequisites . . . . . . . . . . . . . . . . . . . . . . . . . . . . . . . . . . . . . . . . . . . . . . . 2-1Launching the Software . . . . . . . . . . . . . . . . . . . . . . . . . . . . . . . . . . . . . . . . 2-2Navigating Through Real-Time Monitor . . . . . . . . . . . . . . . . . . . . . . . . . . . . . 2-3
Chapter 3 Getting Started With nGenius Server
Administering User Accounts . . . . . . . . . . . . . . . . . . . . . . . . . . . . . . . . . . . . 3-1Maintaining Security . . . . . . . . . . . . . . . . . . . . . . . . . . . . . . . . . . . . . . . . 3-2Understanding User Roles . . . . . . . . . . . . . . . . . . . . . . . . . . . . . . . . . . . . 3-2Creating a User Account . . . . . . . . . . . . . . . . . . . . . . . . . . . . . . . . . . . . . 3-4Learning More About User Accounts . . . . . . . . . . . . . . . . . . . . . . . . . . . . . 3-4
Understanding Data Sources . . . . . . . . . . . . . . . . . . . . . . . . . . . . . . . . . . . . 3-5Adding a Device . . . . . . . . . . . . . . . . . . . . . . . . . . . . . . . . . . . . . . . . . . . 3-5Viewing a Device List . . . . . . . . . . . . . . . . . . . . . . . . . . . . . . . . . . . . . . . 3-7Learning More About Devices . . . . . . . . . . . . . . . . . . . . . . . . . . . . . . . . . . 3-7
iii

Configuring Data Analysis . . . . . . . . . . . . . . . . . . . . . . . . . . . . . . . . . . . . . . . 3-8Understanding Global Settings . . . . . . . . . . . . . . . . . . . . . . . . . . . . . . . . . 3-8
Configuring Monitoring and Logging . . . . . . . . . . . . . . . . . . . . . . . . . . . 3-9Activating a Protocol . . . . . . . . . . . . . . . . . . . . . . . . . . . . . . . . . . . . . 3-10Deactivating a Protocol . . . . . . . . . . . . . . . . . . . . . . . . . . . . . . . . . . . 3-10
Understanding Templates . . . . . . . . . . . . . . . . . . . . . . . . . . . . . . . . . . . 3-11Learning More About Configuring Data Analysis . . . . . . . . . . . . . . . . . . . . 3-11
Chapter 4 Getting Started With Traffic Monitor
Accessing Traffic Monitor Views . . . . . . . . . . . . . . . . . . . . . . . . . . . . . . . . . . . 4-2Functional Views . . . . . . . . . . . . . . . . . . . . . . . . . . . . . . . . . . . . . . . . . . . 4-2Default Views . . . . . . . . . . . . . . . . . . . . . . . . . . . . . . . . . . . . . . . . . . . . . 4-3Top-Level Views . . . . . . . . . . . . . . . . . . . . . . . . . . . . . . . . . . . . . . . . . . . 4-4Drill-Down Views . . . . . . . . . . . . . . . . . . . . . . . . . . . . . . . . . . . . . . . . . . . 4-5Vital Signs in a Data Link Layer View . . . . . . . . . . . . . . . . . . . . . . . . . . . . . 4-6
Launching Data Capture . . . . . . . . . . . . . . . . . . . . . . . . . . . . . . . . . . . . . . . . 4-7Recognizing and Viewing Alarms . . . . . . . . . . . . . . . . . . . . . . . . . . . . . . . . . . 4-7
Configuring Alarms . . . . . . . . . . . . . . . . . . . . . . . . . . . . . . . . . . . . . . . . . 4-7Applying a Template to an Interface . . . . . . . . . . . . . . . . . . . . . . . . . . . . . 4-8Viewing Alarms . . . . . . . . . . . . . . . . . . . . . . . . . . . . . . . . . . . . . . . . . . . . 4-8
Learning More About Traffic Monitor . . . . . . . . . . . . . . . . . . . . . . . . . . . . . . . 4-9
Chapter 5 Getting Started With Packet Analyzer
Launching a Data Capture . . . . . . . . . . . . . . . . . . . . . . . . . . . . . . . . . . . . . . 5-1Clearing the Buffer and Resuming Data Capture . . . . . . . . . . . . . . . . . . . . . . . 5-2Understanding Protocol Decode . . . . . . . . . . . . . . . . . . . . . . . . . . . . . . . . . . . 5-3
Launching Protocol Decode . . . . . . . . . . . . . . . . . . . . . . . . . . . . . . . . . . . . 5-3Protocol Decode Views . . . . . . . . . . . . . . . . . . . . . . . . . . . . . . . . . . . . . . . 5-4
Learning More About Packet Analyzer . . . . . . . . . . . . . . . . . . . . . . . . . . . . . . 5-5
Chapter 6 Getting Started With Voice over IP
Before You Begin . . . . . . . . . . . . . . . . . . . . . . . . . . . . . . . . . . . . . . . . . . . . . 6-1Enabling VoIP on the Probe . . . . . . . . . . . . . . . . . . . . . . . . . . . . . . . . . . . . . . 6-2Understanding VoIP Levels and Views . . . . . . . . . . . . . . . . . . . . . . . . . . . . . . 6-3
Element Info View . . . . . . . . . . . . . . . . . . . . . . . . . . . . . . . . . . . . . . . . . . 6-4Enterprise View . . . . . . . . . . . . . . . . . . . . . . . . . . . . . . . . . . . . . . . . . . . 6-5Phone Users View . . . . . . . . . . . . . . . . . . . . . . . . . . . . . . . . . . . . . . . . . . 6-5
Conversation Totals . . . . . . . . . . . . . . . . . . . . . . . . . . . . . . . . . . . . . . 6-6Most Recent Conversations . . . . . . . . . . . . . . . . . . . . . . . . . . . . . . . . . 6-6
Protocol Usage View . . . . . . . . . . . . . . . . . . . . . . . . . . . . . . . . . . . . . . . . 6-7
iv

Launching a View in VoIP . . . . . . . . . . . . . . . . . . . . . . . . . . . . . . . . . . . . . . . 6-7Launching Data Capture From a VoIP View . . . . . . . . . . . . . . . . . . . . . . . . . . 6-8Learning More About VoIP . . . . . . . . . . . . . . . . . . . . . . . . . . . . . . . . . . . . . . 6-9
Appendix A Troubleshooting
Appendix B Accessing the nGenius Server From Outside a Firewall
Forcing HTTP Tunnelling . . . . . . . . . . . . . . . . . . . . . . . . . . . . . . . . . . . B-1Special Considerations When Using NAT . . . . . . . . . . . . . . . . . . . . . . . . B-1
Appendix C Using the Command-line Utility
Commands . . . . . . . . . . . . . . . . . . . . . . . . . . . . . . . . . . . . . . . . . . . . . . . . . C-1Syntax . . . . . . . . . . . . . . . . . . . . . . . . . . . . . . . . . . . . . . . . . . . . . . . . . . . C-2Learning More About the dvTools . . . . . . . . . . . . . . . . . . . . . . . . . . . . . . . . . C-3
Glossary
Index
v

vi
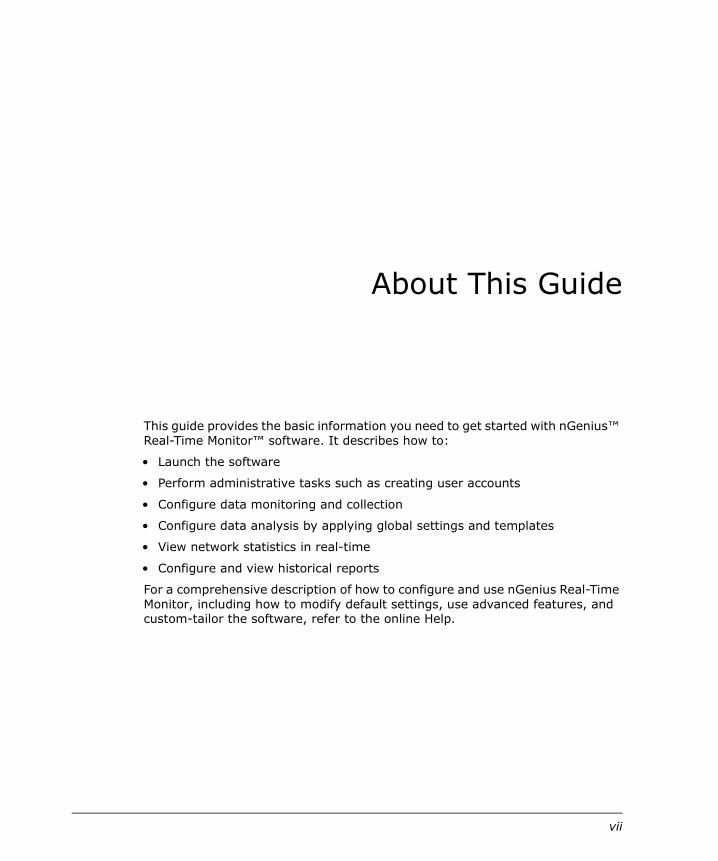
About This Guide
This guide provides the basic information you need to get started with nGenius™ Real-Time Monitor™ software. It describes how to:
• Launch the software
• Perform administrative tasks such as creating user accounts
• Configure data monitoring and collection
• Configure data analysis by applying global settings and templates
• View network statistics in real-time
• Configure and view historical reports
For a comprehensive description of how to configure and use nGenius Real-Time Monitor, including how to modify default settings, use advanced features, and custom-tailor the software, refer to the online Help.
vii

Audience
The nGenius Real-Time Monitor Getting Started Guide is intended for system and network administrators responsible for configuring and running Real-Time Monitor software on an enterprise network. To successfully understand and use nGenius Real-Time Monitor, you should be familiar with the following concepts and products:
• Basic networking principles
• TCP/IP and SNMP
• RMON
• Voice over Internet Protocol (VoIP), if applicable to your network
• Web servers and browsers
• The supported UNIX or Windows operating system applicable to your network
Related Documentation and PDF Files
The following documentation is provided to support nGenius Real-Time Monitor software and related hardware.
Refer to the proper manual or the online Help for detailed information on specific features and functions.
Document Description
nGenius Real-Time Monitor v1.4 Release Notes
Information on new features in this release, last-minute changes, and known issues
nGenius Real-Time Monitor Installation Guide
Instructions on installing nGenius Real-Time Monitor
Online Help Comprehensive instructions on configuring and using nGenius Real-Time Monitor software
viii

Chapter 1Introducing nGenius Real-Time
Monitor
The nGenius Real-Time Monitor software provides you with tools to monitor and display information about your network both historically and in real time.
This chapter discusses the following topics:
• nGenius Real-Time Monitor overview
• Learning more about nGenius Real-Time Monitor
nGenius Real-Time Monitor OverviewThe nGenius Real-Time Monitor software allows you to understand your current network usage and to plan for future needs. It also allows you to proactively troubleshoot problem areas in your network.
Real-Time Monitor includes:
nGenius Server™ — Configure data collection and presentation
Traffic Monitor — View aggregated traffic and drill down to network and application problems
Packet Analyzer — Troubleshoot network faults using packet capture and decode
Voice over IP — Monitor Voice over IP traffic
1-1

Configuring Network Data CollectionThis section provides an overview of the data collection and configuration functions of the nGenius Server, and of the data sources.
Data Sources
The nGenius Real-Time Monitor software collects, monitors, and displays data from the following monitored elements:
• Catalyst 5000, 6000, and 6500 Network Analysis Modules (NAMs)
• Cisco switches with mini-RMON capability
• Legacy SwitchProbe devices
• Switches
These data sources are collectively referred to as devices or monitored devices. This document uses the terms device and monitored device interchangeably. (For a complete listing of supported probes and switches, refer to the online Help.)
In addition, Traffic Monitor collects and displays data from monitored elements. For example, a single probe can have many interfaces, each of which is an individual monitored element.
The nGenius Server
The nGenius Server automatically configures devices by applying the default global settings and templates to each device. When data collection begins, the server makes the collected data available to the other Real-Time Monitor applications for display.
The nGenius Server allows you to perform the following tasks:
• Provide security and control access to your network data by configuring user accounts and roles.
• Add the devices that provide network data.
• Configure the data you collect by applying global settings and templates to each device from which the server collects data. Together, global settings and templates tell devices what data to collect, when to collect it, and which data to log to the database.
Note: The term nGenius Server, as used in this guide, refers to the dedicatedserver machine on which you install nGenius Real-Time Monitor software.
1-2 nGenius Real-Time Monitor Overview

• Provide collected data to the Traffic Monitor and Packet Analyzer applications for viewing in real time.
• Log collected data to the database. History Mode in Traffic Monitor utilizes raw data that is stored in the database for up to 31 days.
• Save all table views throughout the application in CSV (comma separated), TSV (tab separated), pipe (|), and HTML formats.
Viewing Network Data in Real TimeYou can view network data in real time using Traffic Monitor, Packet Analyzer, and Voice over IP (VoIP).
Traffic Monitor
Traffic Monitor is a Web-based application that allows you to monitor all seven layers of network traffic. In addition to using Traffic Monitor, to view network data in real time, you can view logged raw data for a period of up to 31 days.
Traffic Monitor allows you to view data for circuits, segments, and interfaces of applications, protocols, or hosts.
You can use Traffic Monitor to:
• View enterprise-wide network traffic at the data link, network, transport, and application layers
• Use the Enterprise View to see a snapshot of RMON1 statistics for all physical interfaces
• View DSMON data (DSMON-enabled interfaces only)
• Search for a host, conversation, or protocol across the enterprise
• Toggle between Real-Time and History views
• Review alarm details and possible causes by launching the Alarm Viewer
• Identify which network segments, applications, or protocols are utilizing bandwidth
• Identify which network users or hosts are using certain applications or protocols
Introducing nGenius Real-Time Monitor 1-3

Packet Analyzer
Packet Analyzer is a protocol and network analysis tool that helps you troubleshoot network and application issues using packet capturing, filtering, and decoding functions.
Packet Analyzer allows you to perform a data capture when you detect a network problem, or configure data capture to launch automatically based on alarms or predefined times.
You can use Packet Analyzer to capture, filter, and decode packets to identify and troubleshoot network and application issues.
Voice over IP
Voice over IP (VoIP) allows you to monitor voice traffic over supported IP multimedia protocols. The IP protocols supported include H.323, MGCP, and SCCP version 3.1.
VoIP is supported on legacy Cisco SwitchProbes only. You must upgrade these devices to NSP 5.2.
You can use Voice over IP to:
• View a list of active calls, successful calls, and incomplete calls for each probe interface
• Drill down from a specific interface to Phone Users, Protocol Users, Element Info, and Data Capture Views
• View details of conversations, including information about senders, receivers, number of calls, talk time, and total Real Time Transport Protocol (RTP) and RTP Control Protocol (RTCP) data sent
• View voice-related utilization values on the interface
• Launch a data capture
Note: Voice over IP supports physical interfaces only.
1-4 nGenius Real-Time Monitor Overview

nGenius Real-Time Monitor RoadmapFigure 1-1 provides a graphical overview of how you can use nGenius Real-Time Monitor to monitor and report on your network.
Figure 1-1 Real-Time Monitor Roadmap
Configure Data Collection and Analysis
• Apply Templates and Global Settings to select protocols, monitoring intervals, table sizes, statistics
• Configure templates and alarms
• Create Monitored Element groups
1
2
3
Add Devices
• Probes
• Switches
• NAMs
Monitor Your Network
Traffic Monitor — View raw network data in Real-Time or History Mode in top level or drill-down views
Packet Analyzer — Capture and decode packet data to troubleshoot network problems
Voice over IP — Monitor voice traffic over supported IP multimedia protocols
Introducing nGenius Real-Time Monitor 1-5

Learning More About Real-Time MonitorTo learn more about nGenius Real-Time Monitor, you can:
• View PDF versions of the hardcopy documentation at:
http://www.cisco.com/univercd/cc/td/doc/product/rtrmgmt/cw2000/fam_prod/netscout/
• Search the integrated online Help in the product
The nGenius Real-Time Monitor provides a browser-based online Help system with in-depth information about procedures, product options, and troubleshooting hints.
You can access online Help in either of the following ways:
• In the menu bar of any nGenius Real-Time Monitor application, select Help.
– Select Contents for an overview of the online information.
– Select Index to locate a specific topic.
– Select Search to enter a keyword for the task you want to perform.
• In any nGenius Real-Time Monitor dialog box, click Help to display context-sensitive information for a specific feature.
1-6 Learning More About Real-Time Monitor

Chapter 2Launching nGenius Real-Time Monitor
Connecting to the nGenius Real-Time Monitor Server allows you to monitor your network and view real-time and historical reports.
This chapter discusses:
• Prerequisites for connecting to the server for the first time
• Real-Time Monitor launch procedure
• Real-Time Monitor tasks
PrerequisitesBefore you launch the nGenius Real-Time Monitor software, you must:
� Install nGenius Real-Time Monitor on your nGenius Server.
� Upgrade your existing database, if applicable.
� Install NetScout probes as appropriate throughout your network.
� Meet the client requirements as set forth in the nGenius Real-Time Monitor Installation Guide.
� Start the Real-Time Monitor software on your nGenius Server. Refer to the nGenius Real-Time Monitor Installation Guide for information on starting and configuring the nGenius Server.
Note: You must install nGenius Real-Time Monitor on a dedicatedmachine.
2-1

Launching the SoftwareTo launch the nGenius Real-Time Monitor software:
1 Open a Web browser and enter the IP address or hostname of the nGenius Real-Time Monitor Server followed by the Apache Web Server default port number, :8080. For example, enter:
http://sylvester:8080
2 In the nGenius Real-Time Monitor launch page, select one of the following applications:
– Traffic Monitor
– Server
– VoIP
– Packet Analyzer
3 In the Java Plug-in Security Warning dialog box, click Grant or Grant Always. Click Grant Always if you prefer not to view the Java Plug-in Security Warning each time you access the software.
4 In the Login dialog box, enter your username and password.
5 Click Login.
Note: Logging in to one nGenius application logs you in to all applications.
2-2 Launching the Software

Navigating Through Real-Time Monitor The launch page directs you into the nGenius Real-Time Monitor applications. You can easily switch to another application within Real-Time Monitor without returning to the launch page by clicking the appropriate icon in the status bar.
Table 2-1 lists each application and its associated icon.
Table 2-1 Real-Time Monitor Tasks
Application Description
Traffic Monitor • View Data Link, Network, and Application layer detailed views in real time
• View alarms
• Contact a device
nGenius Server • Define user accounts and roles
• Add, configure, and manage all devices
• View message log
• Create user-defined groups
• Modify global settings
• Create and apply templates
VoIP • Monitor and report on VoIP-based traffic
• View a list of active calls, successful calls, and incomplete calls for each probe interface
• View details of conversations, including information about senders, receivers, and number of calls
• Launch a data capture
Packet Analyzer • Capture packet data and view in real time
• Decode and filter captured data
Launching nGenius Real-Time Monitor 2-3

2-4 Navigating Through Real-Time Monitor

Chapter 3Getting Started With nGenius Server
To begin monitoring your network using nGenius Real-Time Monitor, you must select your data sources—the devices and protocols you want to monitor, and configure which data to collect, log, and report on.
You configure data sources in the nGenius Server.
This chapter discusses the following topics:
• Understanding data sources
• Configuring data analysis
Administering User AccountsUser accounts determine who can access nGenius Real-Time Monitor, and user roles determine who can view and modify certain information. To create user accounts and assign user roles to user accounts, you must be granted the System Administrator role.
During installation, a user account with System Administrator and Network Administrator roles is automatically created for you. You can use this account to add other users and configure the system. Users who are not assigned the System Administrator role can edit their own user accounts but cannot assign user roles to their accounts.
Note: At least one user account must be assigned the role of SystemAdministrator. You cannot delete the last user account that has SystemAdministrator privileges.
Getting Started With nGenius Server 3-1
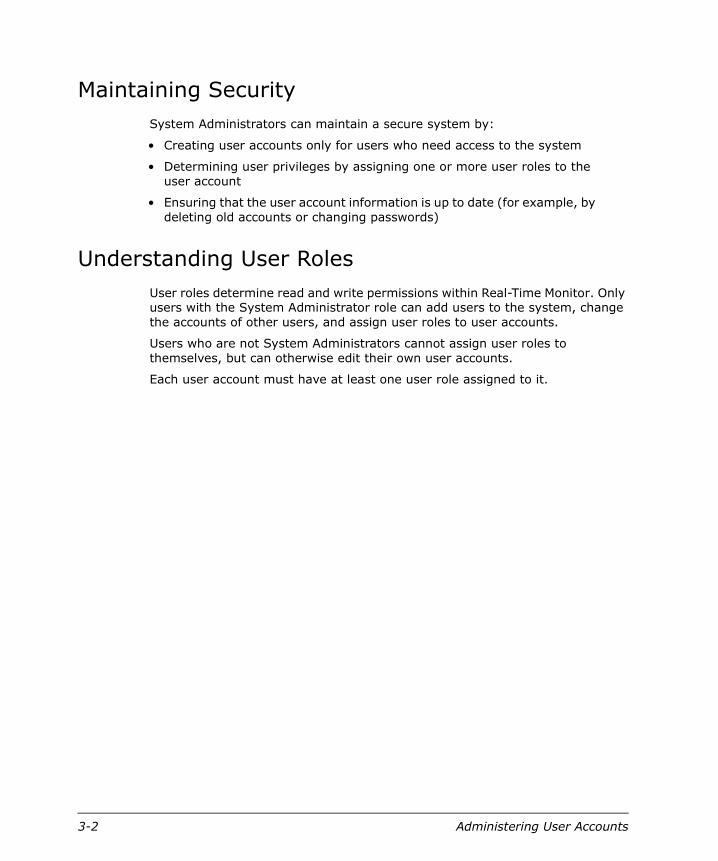
Maintaining SecuritySystem Administrators can maintain a secure system by:
• Creating user accounts only for users who need access to the system
• Determining user privileges by assigning one or more user roles to the user account
• Ensuring that the user account information is up to date (for example, by deleting old accounts or changing passwords)
Understanding User RolesUser roles determine read and write permissions within Real-Time Monitor. Only users with the System Administrator role can add users to the system, change the accounts of other users, and assign user roles to user accounts.
Users who are not System Administrators cannot assign user roles to themselves, but can otherwise edit their own user accounts.
Each user account must have at least one user role assigned to it.
3-2 Administering User Accounts

Refer to Table 3-1 for a summary of user roles.
Table 3-1 Real-Time Monitor User Roles and Privileges
Role Privileges
Network Administrator
Read access to all functions
Write access to:
• Device Configuration
• Global Settings, Templates, and Monitored Element Groups
• User-Defined Groups
• Spanning
• Message Log
• All Packet Analyzer tasks
• Traffic Monitor Alarm Viewer (to mark alarms inactive and delete alarms)
• Personal user account information (but not to assign user roles or have write access to the accounts of other users)
System Administrator
Read access to all functions
Write access to all user accounts and user role information in the nGenius Server
Approver Read access to all functions
Write access to:
• Spanning
• Monitored Element groups/User-Defined groups
• Traffic Monitor Alarm Viewer (to delete alarms)
• Templates
• Personal user account information in nGenius Server (but not to assign user roles or have write access to the accounts of other users)
Network Operator or Help Desk
Read access to all functions
Write access to change own user account information in nGenius Server (but not to assign user roles). No access to the accounts of other users.
Getting Started With nGenius Server 3-3

Creating a User AccountDuring installation, a user account with System Administrator and Network Administrator roles is automatically created for you. You can use the procedure in this section to create additional user accounts.
1 From the nGenius Real-Time Monitor launch page, select Server.
2 Select Administration > User Accounts.
3 In the User Account dialog box, click Add.
4 Enter the user information. Only the Login Name is required.
5 Enter your optional password in the New Password field (maximum of 15 characters). Non-printing characters such as spaces or tabs are not permitted. Reenter the password in the Confirm Password field.
6 In the Available Roles column, select the user role(s) you want to assign to this account, and click the right arrow. Refer to "Understanding User Roles" earlier in this section for an explanation of user roles.
To remove a user role, select the role from the Assigned Roles column and click the left arrow.
7 Click OK to save your changes.
8 Click Close.
Learning More About User AccountsRefer to the online Help for additional information about the following topics:
• Modifying User Account Information
• Deleting User Accounts
• Changing Your Password
• Clearing User Passwords
Note: You must assign at least one role to each user account.
3-4 Administering User Accounts

Understanding Data SourcesThe nGenius Server collects data from devices and monitored elements in your network.
Adding a DeviceYou must have Network Administrator privileges to add a device to the nGenius Server.
When you add a device, the server automatically learns all probe interfaces and configures the device by applying the settings defined in the global settings and default template. The asynchronous device configuration feature of nGenius Real-Time Monitor allows you to add devices without having to wait until each add-device operation is complete. Most operations are performed asynchronously and their progress independently monitored.
To add a device to the nGenius Server:
1 From the nGenius Real-Time Monitor launch page, select Server.
2 Select Device > Add Probe or Add Switch. You can add a maximum of 50 probe interfaces and 10,000 switch ports.
3 Refer to Table 3-2 to complete the Add <Device> dialog box.
Note: To add the ATM LS1010 switch, you must add the switch as a probe.That is, you must add it using the Add Probe dialog box.
Table 3-2 Adding a Device
Field Description
Name The device name. The name can contain spaces and alphanumeric characters.
IP Address The device IP address.
Read Community
The read community string. For the first device you add, the default is public. Once you define the setting, your setting becomes the default for subsequent devices you add.
Getting Started With nGenius Server 3-5

4 Click Apply to save your changes and add another device, or OK to save your changes and close the dialog box.
Write Community
The write community string. The setting must match the write community string defined in the device. For the first device you add, the default is public. Once you define the setting, your setting becomes the default for subsequent devices you add.
Notes Any additional information about the device such as the physical location.
Select Switch Type
Switches only — From the drop-down list, select the switch type, or select Automatic.
Retries The number of times you want the nGenius Server to attempt to reach the probe if there is no response. The value must be an integer between 1 and 1000 (default is 1).
Timeout The time in seconds you want the nGenius Server to wait before retrying an SNMP request. The value must be an integer between 1 and 1000 (default is 6).
Enable learn only (switches)
Prevents Real-Time Monitor from configuring the switch when it is added or relearned.
Note: If you are currently using TrafficDirector, you can import the devicesdefined in your TrafficDirector system into the nGenius Server. The Importutility automates the process of converting all device configuration files thatexist in another network management system and adds them to the nGeniusReal-Time Monitor database.
For detailed information on importing a device, and for information on how togroup devices that you access frequently, refer to the online Help.
Table 3-2 Adding a Device (Continued)
Field Description
3-6 Understanding Data Sources

Viewing a Device ListTo view the list of devices attached to the nGenius Server:
1 From the nGenius Real-Time Monitor launch page, select Server. The Device Configuration dialog box displays by default.
2 Select either the Probe or Switch tab, as applicable, to display the devices.
Learning More About DevicesRefer to the online Help for information about the following topics:
• Importing a Device
• Adding Multiple Devices
• Deleting a Device
• Deactivating or Reactivating Devices and Interfaces
• Contacting Devices
• Spanning a Switch
• Logging in to a Probe Remotely
• Viewing Interfaces on a Device
• Viewing and Modifying Device Information
Note: To view device details, in the Probe or Switch tab, click Details. Clickthe appropriate tab to view the details.
Getting Started With nGenius Server 3-7

Configuring Data AnalysisWhen you add a device to the nGenius Server, it automatically applies Global Settings and Templates. Global Settings and Templates allow you to configure the way you collect data from multiple devices. Together, global settings and templates tell devices what data to collect, when to collect it, and which data to log to the database.
As part of Global Settings, the nGenius Server monitors certain RMON2 protocols for host and conversation traffic and logs statistical data by default. In addition to the defaults, nGenius Real-Time Monitor allows you to monitor traffic and collect data from a list of approximately 200 protocols, which are displayed in the Global Settings dialog box.
Understanding Global Settings Global settings allow you to apply settings to every probe and NAM device that exists on the nGenius Server. A probe or NAM device acquires global settings when you add the probe to the nGenius Server and when you save any changes made in the Global Settings dialog box.
The nGenius Server provides default settings, but you can customize settings before or after you add devices. Refer to the online Help for detailed instructions on how to view and change the default settings, and for specifics on the default settings for each option. To modify global settings, you must be assigned the Network Administrator role.
Table 3-3 lists Global Settings options.
Table 3-3 Global Settings Options
Option Defines
Monitoring and Logging Options
The network and application protocols in the probe protocol directory that a probe monitors for host and conversation traffic, and the protocols for which the nGenius Server logs statistics data to the database. You can view protocols by device type (Probes, CAT 5000 NAM set, CAT 6000 NAM set).
Intervals The frequency with which the nGenius Server:
• Polls the probe for data (Sampling Interval). Defaults differ for Short Term and Long Term History.
• Logs data to the database (Logging Interval).
3-8 Configuring Data Analysis
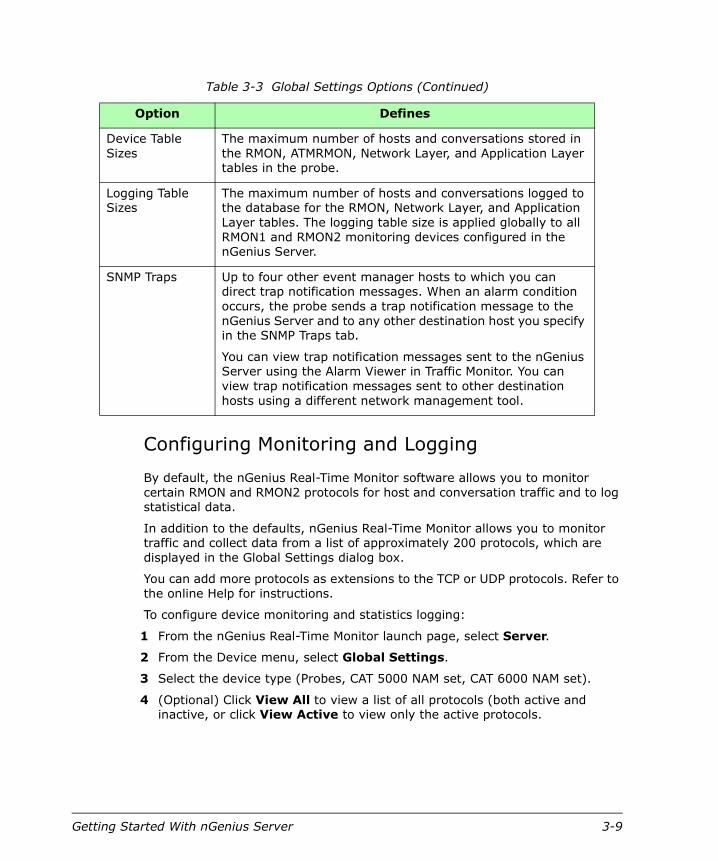
Configuring Monitoring and Logging
By default, the nGenius Real-Time Monitor software allows you to monitor certain RMON and RMON2 protocols for host and conversation traffic and to log statistical data.
In addition to the defaults, nGenius Real-Time Monitor allows you to monitor traffic and collect data from a list of approximately 200 protocols, which are displayed in the Global Settings dialog box.
You can add more protocols as extensions to the TCP or UDP protocols. Refer to the online Help for instructions.
To configure device monitoring and statistics logging:
1 From the nGenius Real-Time Monitor launch page, select Server.
2 From the Device menu, select Global Settings.
3 Select the device type (Probes, CAT 5000 NAM set, CAT 6000 NAM set).
4 (Optional) Click View All to view a list of all protocols (both active and inactive, or click View Active to view only the active protocols.
Device Table Sizes
The maximum number of hosts and conversations stored in the RMON, ATMRMON, Network Layer, and Application Layer tables in the probe.
Logging Table Sizes
The maximum number of hosts and conversations logged to the database for the RMON, Network Layer, and Application Layer tables. The logging table size is applied globally to all RMON1 and RMON2 monitoring devices configured in the nGenius Server.
SNMP Traps Up to four other event manager hosts to which you can direct trap notification messages. When an alarm condition occurs, the probe sends a trap notification message to the nGenius Server and to any other destination host you specify in the SNMP Traps tab.
You can view trap notification messages sent to the nGenius Server using the Alarm Viewer in Traffic Monitor. You can view trap notification messages sent to other destination hosts using a different network management tool.
Table 3-3 Global Settings Options (Continued)
Option Defines
Getting Started With nGenius Server 3-9

Activating a Protocol
If the protocol you want to monitor is not active by default, or if you want to reactivate a deactivated protocol, you can do so using the following procedure:
1 From the nGenius Real-Time Monitor launch page, select Server.
2 From the Device menu, select Global Settings.
3 Select the deactivated protocol and click Activate.
Monitoring and logging for the protocol begins at the next polling interval.
Deactivating a Protocol
The Network Administrator can use the following procedure to deactivate a protocol to temporarily stop collecting and logging data for a specific protocol:
1 From the nGenius Real-Time Monitor launch page, select Server.
2 From the Device menu, select Global Settings.
3 In the Monitoring and Logging Options tab, select the protocol and click Deactivate.
Note: If the protocol is not displayed, click View All to display a complete listof activated and deactivated protocols. Click View Active to view only activeprotocols. Network layer protocols cannot be deactivated.
3-10 Configuring Data Analysis

Understanding TemplatesTemplates allow you to define settings in one place and apply them across multiple interfaces.
Real-Time Monitor provides you with default probe and switch templates. The nGenius Server applies a default template to all device interfaces when you add the device.
You can modify the default templates, but you cannot change the template name. If the default templates do not meet your needs, you can create a new template and assign it to one or more probe interfaces or switch ports.
Probe Templates — Allow you to log host and conversation traffic to the database for RMON, RMON2, and ATMRMON devices. Probe templates also allow you to set up to two alarms on a rising threshold, falling threshold, or both.
Switch Templates — Allow you to set a sampling interval for short- and long-term history and the number of samplings that are retained per switch port interface. Switch templates also allow you to define up to two utilization alarms based on a rising threshold, falling threshold, or both.
Learning More About Configuring Data AnalysisRefer to the online Help for information about the following topics:
• Customizing Global Settings
• Enabling Automatic Discovery of Application Layer Protocols
• Creating a Template
• Assigning a Template to an Interface
• Understanding Alarms
• Viewing the Message Log
• Creating, Modifying, and Deleting Application Groups
• Creating, Modifying, and Deleting Monitored Element Groups
Getting Started With nGenius Server 3-11

3-12 Configuring Data Analysis

Chapter 4Getting Started With Traffic Monitor
Traffic Monitor is a Web-based application that allows you to view data from monitored elements—switches, switch ports, probes, probe interfaces, VLANs, PVCs, DLCIs, and Catalyst5000, 6000, and 6500 NAMs. You can view network data in Real-Time Mode (default), or use the History mode to view logged raw data for a period of up to 31 days.
Traffic Monitor allows you to view data using structured browsing paths. Each path starts from a top-level view from which you can drill down to view details.
Top-Level views — Display overall information about a specific OSI layer, and serve as a starting point from which you can drill down through structured browsing paths for more detailed information. Top-level views are also available to display DSMON, SMON, ATM, and Segment Detail Statistics, provided the selected interface supports these technologies.
Drill-Down views — Display information about host, conversation, or application traffic for a specific segment, switch port, or trunk link.
Traffic Monitor also offers several functional views that allow you to view information about the monitored elements on your network, view alarm details, or search for a host, conversation, or protocol.
You can use Traffic Monitor to:
• View enterprise-wide network traffic at the data link, network, transport, and application layers
• Use the Enterprise View to see a snapshot of RMON statistics for all physical interfaces
• View DSMON data (DSMON-enabled interfaces only)
• Toggle between Real-Time and History views
• Search for a host, conversation, or protocol across the enterprise
• Identify which network segments, applications, or protocols are utilizing bandwidth
• Identify which network users or hosts are using certain applications or protocols
Getting Started With Traffic Monitor 4-1

Accessing Traffic Monitor ViewsUse the procedures in this section for information on how to access the following Traffic Monitor views:
• Functional views
• Default views
• Top-level views
• Drill-down views
• Vital Signs
Functional ViewsFunctional views allow you to perform such functions as searching for a host, conversation, or protocol across the enterprise, viewing details about monitored elements, and viewing alarms.
To access a functional view:
1 From the nGenius Real-Time Monitor launch page, select Traffic Monitor.
2 From the navigation tree, select an interface.
3 From the Views menu, select from among the views listed in Table 4-1.
Table 4-1 Traffic Monitor Functional Views
View Description
Element Info Displays details about the selected monitored element, including network address, media type and speed, and supported software options. Includes a Contact Device button that allows you to contact the monitored device to ensure that it is operating, or verify the type of software options that the device supports.
Alarm Viewer Displays alarm details.
Search Allows you to search for a host, conversation, or protocol across the enterprise. Drill down to Traffic usage, hosts, and conversations.
4-2 Accessing Traffic Monitor Views

Default ViewsYou can launch default views in a tiled format. You can display the following kinds of default views:
Switch-related monitored element — Data Link Layer and Network Layer
Probe-related monitored element — Data Link Layer, Network Layer, and Application Layer
To display default views:
1 From the nGenius Real-Time Monitor launch page, select Traffic Monitor.
2 From the navigation tree, select a monitored element.
3 Select Views > Launch Default Views.
Enterprise Provides a consolidated snapshot view of RMON1 data for all physical interfaces within the enterprise. Use the Show menu to display one or more of the following:
• Utilization
• Packet Rate
• Byte Rate
• Error Rate
Drill down to Data Link, Network, Application Layers, ATM Monitor, SMON Monitor, DSMON Statistics, Segment Details.
Table 4-1 Traffic Monitor Functional Views
View Description
Getting Started With Traffic Monitor 4-3

Top-Level ViewsWhen you launch top-level views, the menu bar displays the Show menu option. The Show menu allows you to select which parameters you want to display. For most views, Traffic Monitor selects Utilization by default.
To access a top-level view:
1 From the nGenius Real-Time Monitor launch page, select Traffic Monitor.
2 From the navigation tree, select a monitored element.
3 Right-click, and select a top-level view from the drop-down menu. Traffic Monitor displays the top-level views listed in Table 4-2.
Table 4-2 Traffic Monitor Views Summary
Top-Level Views Drill Down
Data Link Layer Link Usage, Short-Term and Long-Term Usage, TopN RMON Hosts and Conversations, All RMON Hosts and Conversations, All Traffic, Protocol Discovery, ATM Monitor, SMON Monitor, Network Layer, Application Layer
Network Layer Protocol Usage, TopN Network Hosts and Conversations, TopN Protocols, All Network Layer Hosts and Conversations, All Protocols, All Traffic, Protocol Discovery, Data Link Layer, Application Layer, Launch Data Capture
Application Layer Application Usage, TopN Application Layer Hosts and Conversations, All Application Layer Hosts and Conversations, All Applications, All Traffic, Protocol Discovery, Data Link Layer, Network Layer, Launch Data Capture
DSMON Statistics DSCP Usage (code points statistics), DSCP Hosts and Protocols, Data Link Layer, Application Layer, Network Layer. (DSMON-enabled probes only)
SMON Monitor No drill down — Statistics for SMON-supported (VLAN-supported) monitored elements, including Average Speed and Bandwidth per VLAN Segment or Priority
Top N Links Link Usage, Short Term and Long Term Usage, Top N RMON Hosts and Conversations, All RMON Hosts and Conversations, All Traffic, Protocol Discovery, Segment Details
Segment Details No drill down — Cumulative Statistics on the probe interface, including Utilization, Packets, Bytes, Broadcasts, and Multicasts
4-4 Accessing Traffic Monitor Views
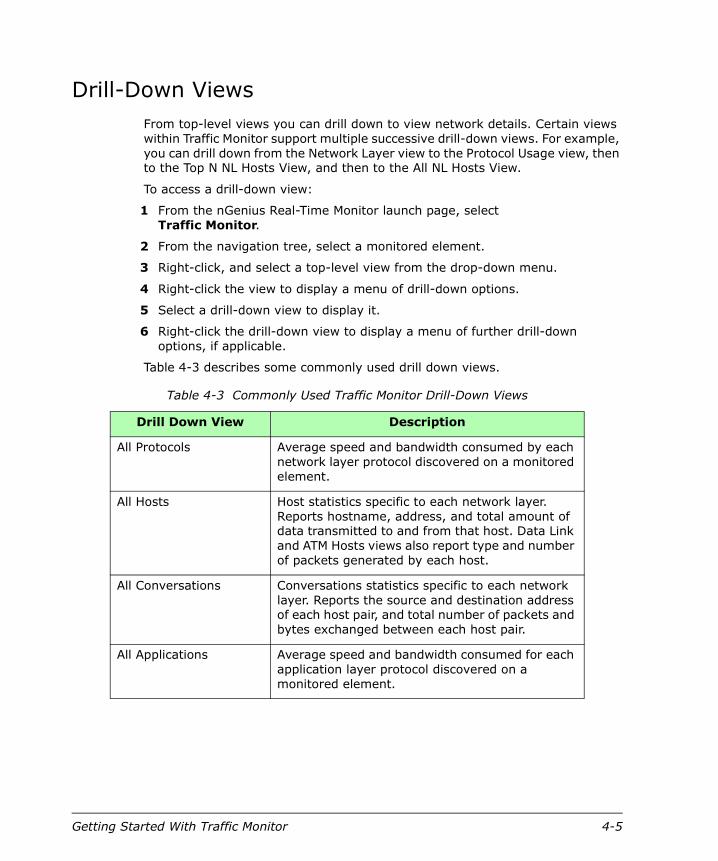
Drill-Down ViewsFrom top-level views you can drill down to view network details. Certain views within Traffic Monitor support multiple successive drill-down views. For example, you can drill down from the Network Layer view to the Protocol Usage view, then to the Top N NL Hosts View, and then to the All NL Hosts View.
To access a drill-down view:
1 From the nGenius Real-Time Monitor launch page, select Traffic Monitor.
2 From the navigation tree, select a monitored element.
3 Right-click, and select a top-level view from the drop-down menu.
4 Right-click the view to display a menu of drill-down options.
5 Select a drill-down view to display it.
6 Right-click the drill-down view to display a menu of further drill-down options, if applicable.
Table 4-3 describes some commonly used drill down views.
Table 4-3 Commonly Used Traffic Monitor Drill-Down Views
Drill Down View Description
All Protocols Average speed and bandwidth consumed by each network layer protocol discovered on a monitored element.
All Hosts Host statistics specific to each network layer. Reports hostname, address, and total amount of data transmitted to and from that host. Data Link and ATM Hosts views also report type and number of packets generated by each host.
All Conversations Conversations statistics specific to each network layer. Reports the source and destination address of each host pair, and total number of packets and bytes exchanged between each host pair.
All Applications Average speed and bandwidth consumed for each application layer protocol discovered on a monitored element.
Getting Started With Traffic Monitor 4-5

Vital Signs in a Data Link Layer ViewThe Vital Signs view illustrates how critical elements impact utilization. Vital Signs help you identify the cause of slow performance or a potential problem on a network link. You can drill down to Vital Signs from the Data Link Layer view, the Short-term Usage view, or the Long-term Usage view.
Table 4-4 displays vital signs data available for each topology. Each component represents a percentage of total utilization.
To view vital signs:
1 From the nGenius Real-Time Monitor launch page, select Traffic Monitor.
2 From the navigation tree, select a monitored element.
3 Right-click, and select Data Link Layer.
4 Select Show > Vital Signs.
All Traffic Traffic statistics specific to each network layer.
TopN TopN statistics specific to each network layer. Top number of conversations, hosts, applications, and protocols on a monitored element.
Table 4-4 Vital Signs in the Data Link Layer
Topology Vital Signs
Ethernet, WAN, and FDDI
Total utilization, broadcast packets, multicast packets, collisions, and errors
ATM Total utilization, broadcast packets, multicast packets, errors, calls, and call attempts
Token Ring Total utilization, broadcast packets, multicast packets, mac packets, and errors
Table 4-3 Commonly Used Traffic Monitor Drill-Down Views
Drill Down View Description
4-6 Accessing Traffic Monitor Views

Launching Data CaptureYou can launch data capture and decode from within many Traffic Monitor views.
• Right-click an interface, and select Launch Data Capture.
• Right-click Network or Application top-level views to display the drill-down menu, and select Launch Data Capture.
For instructions on proceeding with data capture and decode, refer to "Launching a Data Capture" in Chapter 5.
Recognizing and Viewing AlarmsAn alarm is a predefined condition that can tell you when utilization on a network segment rises above or falls below the threshold values set by an administrator.
When a threshold is met or exceeded, the device sends a Simple Network Management Protocol (SNMP) trap (notification message) to the nGenius Server.
You configure alarms in the nGenius Server, and view them in Traffic Monitor.
Configuring AlarmsTo configure an alarm:
1 From the nGenius Real-Time Monitor launch page, select Server.
2 Select Device > Templates.
3 Select a template, and click New Alarm.
4 Enter your parameters, and click OK.
5 Apply the template to an interface.
Getting Started With Traffic Monitor 4-7

Applying a Template to an InterfaceWhen you configure an alarm as part of a template and then apply the template to an interface, the alarm is triggered when the variable (for example, utilization) exceeds the thresholds you specify.
To apply the template to an interface:
1 From the nGenius Real-Time Monitor launch page, select Server.
2 Select Device > Device Configuration.
3 Select the appropriate interface, and click Configure.
4 In the Select New Template drop-down list, select the appropriate template.
5 Click Set. The alarm displays in the Alarms pane.
6 Click Apply to apply another template, or OK to save your changes and exit the dialog box.
Viewing AlarmsTo view alarms:
1 From the nGenius Real-Time Monitor launch page, selectTraffic Monitor.
2 Expand the navigation tree, and select an interface.
3 From the Views menu, select Alarm Viewer.
Note: Network administrators and Approvers can delete alarms by selectingthe alarm and clicking Delete.
4-8 Recognizing and Viewing Alarms

Learning More About Traffic MonitorRefer to the online Help for information about the following topics:
• Understanding View Mode (Real-time or Historical)
• Host, conversation, and protocol search
• Accessing Element Info
• Modifying Default Views
• Contacting a Device
• Exporting Tabular Views
• Modifying Preferences
• Saving Network Scenes
Getting Started With Traffic Monitor 4-9

4-10 Learning More About Traffic Monitor
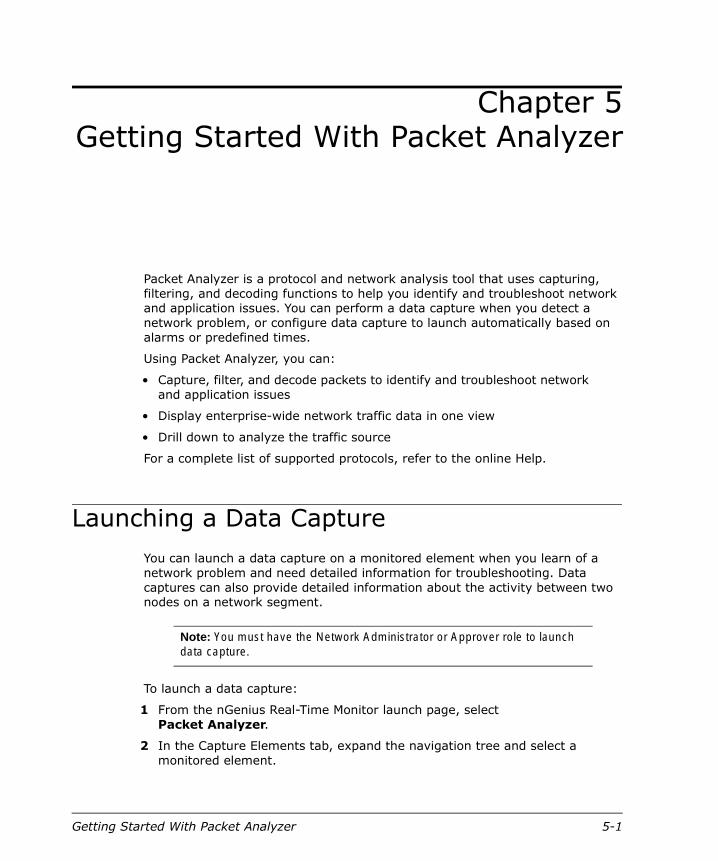
Chapter 5Getting Started With Packet Analyzer
Packet Analyzer is a protocol and network analysis tool that uses capturing, filtering, and decoding functions to help you identify and troubleshoot network and application issues. You can perform a data capture when you detect a network problem, or configure data capture to launch automatically based on alarms or predefined times.
Using Packet Analyzer, you can:
• Capture, filter, and decode packets to identify and troubleshoot network and application issues
• Display enterprise-wide network traffic data in one view
• Drill down to analyze the traffic source
For a complete list of supported protocols, refer to the online Help.
Launching a Data CaptureYou can launch a data capture on a monitored element when you learn of a network problem and need detailed information for troubleshooting. Data captures can also provide detailed information about the activity between two nodes on a network segment.
To launch a data capture:
1 From the nGenius Real-Time Monitor launch page, select Packet Analyzer.
2 In the Capture Elements tab, expand the navigation tree and select a monitored element.
Note: You must have the Network Administrator or Approver role to launchdata capture.
Getting Started With Packet Analyzer 5-1

3 Select Capture > Launch.
4 In the Data Capture dialog box, enter a filename for your data capture. For a detailed explanation of the default parameters, and instructions on how to modify them, refer to the online Help.
5 Select Capture > Start. As the data capture proceeds, the status bar displays the message "Data capture in process", as well as the buffer status, and the number of captured frames.
6 When data capture is complete, select Capture > Upload to upload the captured data to the server. The status bar displays the number of packets being uploaded.
7 Click Capture > Clear to clear the buffer.
Clearing the Buffer and Resuming Data Capture
You can pause a data capture to clear the buffer if it becomes full before the capture is complete. If you specified Lock when full (default) when you configured your data capture, the data capture automatically stops when you reach the established buffer size. After you clear the buffer, you can resume data capture.
To clear the buffer and resume data capture:
1 Select Capture > Pause to pause data capture.
2 Upload the captured data, if desired.
3 Select Capture > Clear to clear the buffer.
4 Select Capture > Resume to continue capture data.
Note: The data capture file is not saved on the nGenius Server until you clickUpload Data Capture. If you exit a session while a data capture is in pausemode, the data capture is lost.
Note: You can view the status of your data capture by selectingViews > Status.
5-2 Clearing the Buffer and Resuming Data Capture

Understanding Protocol DecodeProtocol decode provides you with a detailed view of packet contents. You can launch Decode immediately after you run Data Capture or whenever you want to view the contents of a saved data capture file.
Launching Protocol DecodeTo launch protocol decode:
1 From the nGenius Real-Time Monitor launch page, select Packet Analyzer.
2 Click the Files tab.
3 Select the file you want to decode.
4 Click Decode > Launch.
Getting Started With Packet Analyzer 5-3

Protocol Decode ViewsThe Decode dialog box displays packet details in the three formats shown in Table 5-1.
Table 5-1 Protocol Decode Views
View Description Comments
Summary Displays a table of captured frames. Frames are numbered from 1 to N, where N is the total number of frames in the capture buffer.
Select Decode > Display Options to configure the parameters you want to display. Choose from the following:
• Frame
• Absolute Time
• Delta Time
• Relative Time
• Length
• Cumulative Bytes
• Source
• Destination
• Protocols
• Status
• Interpretation
Detail Displays detailed layer-by-layer information in tree form for the selected frame.
Expand the navigation tree and select a detail to highlight its associated hex and ASCII code in the Hex pane
Hex Decodes the selected frame in Hex format.
Column 1 — Displays the offset in hex format
Column 2 — Displays the frame data in hex format
Column 3 — Displays the data in ASCII format by default (if you want to display the data in EBCDIC format, right-click and select EBCDIC)
5-4 Understanding Protocol Decode

Learning More About Packet AnalyzerRefer to the online Help for information about the following topics:
• Triggering Auto Data Capture
• Modifying Data Capture Parameters
• Creating and Applying Pre- and Post-capture Filters
• Renaming a Data Capture File
• Saving Data Capture Files Locally
• Setting Decode Display Parameters
• Exporting Data Capture Files in CSV (comma separated), TSV (tab separated), HTML, and pipe (|) formats.
For a list of supported protocols, refer to the online Help.
Getting Started With Packet Analyzer 5-5

5-6 Learning More About Packet Analyzer

Chapter 6Getting Started With Voice over IP
The Voice over IP (VoIP) component of nGenius Real-Time Monitor allows you to monitor voice and video traffic traveling on your network. Using VoIP, you can determine how VoIP-based traffic is impacting your network by seeing how much VoIP traffic is being generated in relation to IP traffic.
To use VoIP, you must have NSP 5.2 firmware installed on a probe that has a minimum of 32 MB of memory. Only those devices that support VoIP are displayed in the VoIP navigation tree.
Using VoIP, you can:
• View a list of active calls, successful calls, and incomplete calls for each probe interface
• Drill down from a specific interface to Phone Users, Protocol Users, Element Info, and Data Capture Views
• View details of conversations, including information about senders, receivers, number of calls, talk time, and total Real Time Transport Protocol (RTP) and RTP Control Protocol (RTCP) data sent
• View voice-related utilization values on the interface
• Launch a data capture
Before You BeginIn order to use Voice over IP, you must have:
• Installed NetScout Probe (NSP) version 5.2
• Ensured that your probe contains a minimum of 32 MB of memory
• Enabled the Voice over IP MIB on the probe
• Allowed the interfaces to be relearned prior to viewing data in the Real-Time Monitor interface
Getting Started With Voice over IP 6-1
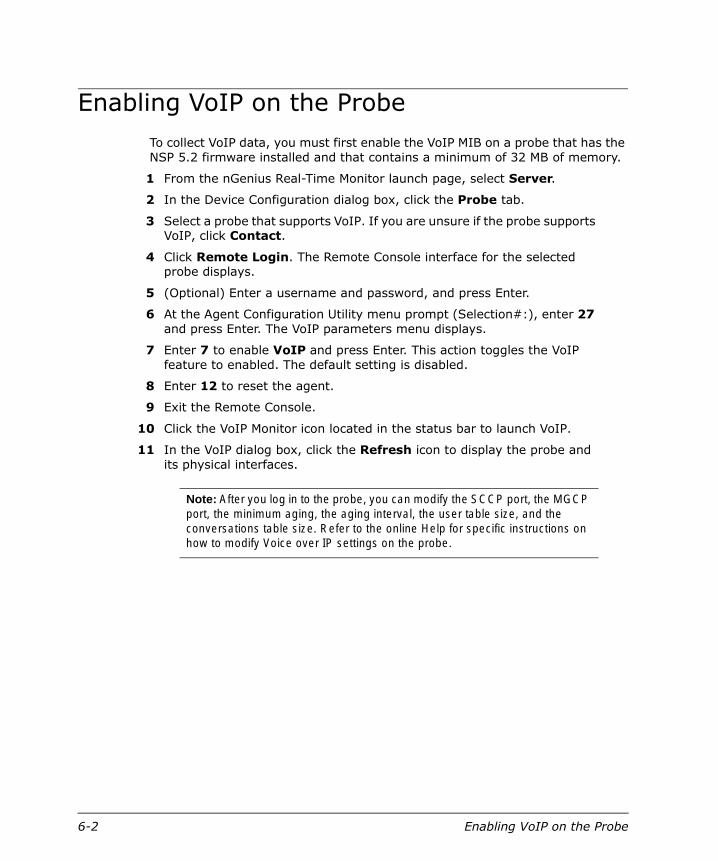
Enabling VoIP on the ProbeTo collect VoIP data, you must first enable the VoIP MIB on a probe that has the NSP 5.2 firmware installed and that contains a minimum of 32 MB of memory.
1 From the nGenius Real-Time Monitor launch page, select Server.
2 In the Device Configuration dialog box, click the Probe tab.
3 Select a probe that supports VoIP. If you are unsure if the probe supports VoIP, click Contact.
4 Click Remote Login. The Remote Console interface for the selected probe displays.
5 (Optional) Enter a username and password, and press Enter.
6 At the Agent Configuration Utility menu prompt (Selection#:), enter 27 and press Enter. The VoIP parameters menu displays.
7 Enter 7 to enable VoIP and press Enter. This action toggles the VoIP feature to enabled. The default setting is disabled.
8 Enter 12 to reset the agent.
9 Exit the Remote Console.
10 Click the VoIP Monitor icon located in the status bar to launch VoIP.
11 In the VoIP dialog box, click the Refresh icon to display the probe and its physical interfaces.
Note: After you log in to the probe, you can modify the SCCP port, the MGCPport, the minimum aging, the aging interval, the user table size, and theconversations table size. Refer to the online Help for specific instructions onhow to modify Voice over IP settings on the probe.
6-2 Enabling VoIP on the Probe

Understanding VoIP Levels and Views
The VoIP component of nGenius Real-Time Monitor provides you with three navigation levels and several top-level and drill-down views from which to access VoIP traffic on physical interfaces. (Virtual interfaces are not supported.)
Table 6-1 lists the views you can access from each navigation level.
VoIP views allow you to determine:
• Utilization
• Identity of senders and receivers
• Traffic patterns
• Specific applications using VoIP
• Round-trip delays
• End-to-end information about the quality of the session of each participant
• Volume of in-bound and out-bound packets and octets
• Thresholds for jitter, packet loss, and setup time
All views have dynamic polling, and you can update the default poll rate. Because it takes longer to obtain data for the Enterprise View than for other views, a different default poll rate is provided.
Only one type of view per monitored element can be displayed at a time. For example, if the Phone Users view is displayed for a specific interface, selecting a different interface and launching the Phone users view will cause the first instance of that view to be replaced by the last one requested.
Table 6-1 VoIP Navigation Levels and Views
Level Views
Enterprise Enterprise
Element Info
Device Type (for example, Ethernet)
Element Info
Interface Phone Users
Protocol Usage
Element Info
Data Capture
Getting Started With Voice over IP 6-3

Element Info ViewThe Element Info dialog box displays information about monitored elements, such as the network address of the device that contains the element, the media type and speed, and the software options it supports. Monitored element information is divided into three categories, which you can access by clicking the following tabs:
Device — Element Name, IP Address, Description, Firmware Version, Location
Interface — Element Name, Interface Number, Description, Type, Speed
Options — Element Name, SNMP V2 Support, Protocol Monitoring, Application Monitoring, High-Capacity Monitoring, SMON Monitoring, Application Response Time, Resource Monitoring
The Element Info dialog box also includes a Contact Device button. You can click Contact Device to ensure that a probe or switch is operating, or to verify the type of software the device supports.To view Element Info:
1 From the nGenius Real-Time Monitor launch page, select VoIP.
2 From the navigation tree, select from one of the following navigation levels:
• Enterprise
• Device Type
• Interface
3 Select Action > Element Info.
4 To view specific information about the monitored element, click the Device, Interface, or Options tab.
5 To contact the monitored element device directly, click Contact Device.
Note: All information displayed in the Element Info dialog box is derived fromthe database and is updated each time a device is contacted.
6-4 Understanding VoIP Levels and Views
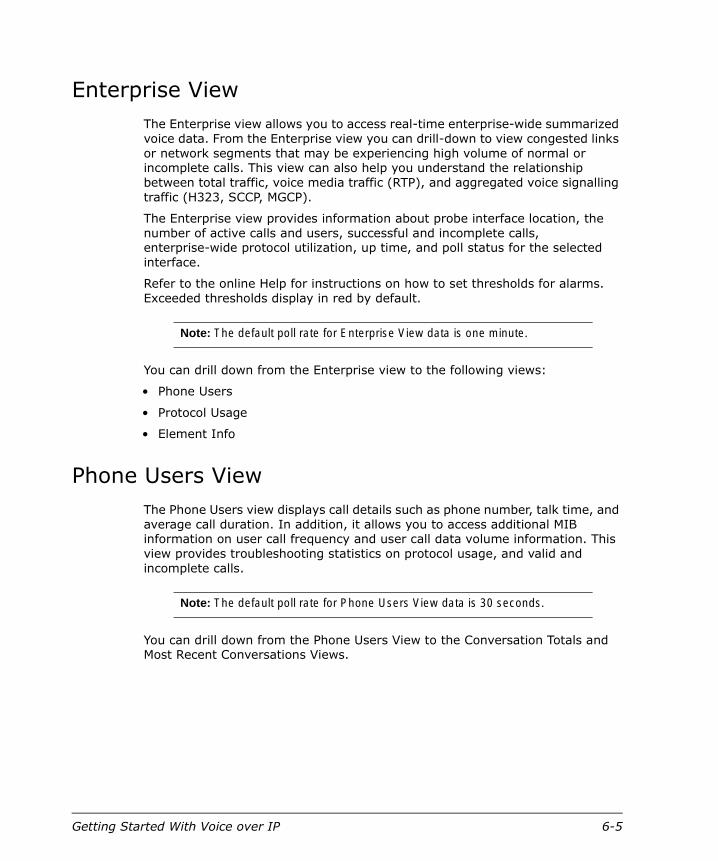
Enterprise ViewThe Enterprise view allows you to access real-time enterprise-wide summarized voice data. From the Enterprise view you can drill-down to view congested links or network segments that may be experiencing high volume of normal or incomplete calls. This view can also help you understand the relationship between total traffic, voice media traffic (RTP), and aggregated voice signalling traffic (H323, SCCP, MGCP).
The Enterprise view provides information about probe interface location, the number of active calls and users, successful and incomplete calls, enterprise-wide protocol utilization, up time, and poll status for the selected interface.
Refer to the online Help for instructions on how to set thresholds for alarms. Exceeded thresholds display in red by default.
You can drill down from the Enterprise view to the following views:
• Phone Users
• Protocol Usage
• Element Info
Phone Users ViewThe Phone Users view displays call details such as phone number, talk time, and average call duration. In addition, it allows you to access additional MIB information on user call frequency and user call data volume information. This view provides troubleshooting statistics on protocol usage, and valid and incomplete calls.
You can drill down from the Phone Users View to the Conversation Totals and Most Recent Conversations Views.
Note: The default poll rate for Enterprise View data is one minute.
Note: The default poll rate for Phone Users View data is 30 seconds.
Getting Started With Voice over IP 6-5
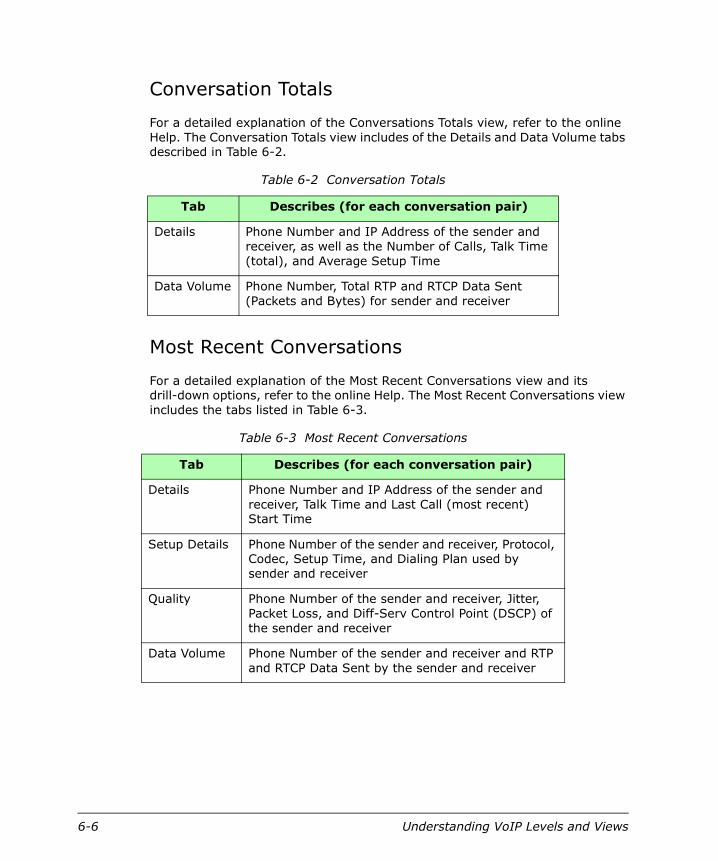
Conversation Totals
For a detailed explanation of the Conversations Totals view, refer to the online Help. The Conversation Totals view includes of the Details and Data Volume tabs described in Table 6-2.
Most Recent Conversations
For a detailed explanation of the Most Recent Conversations view and its drill-down options, refer to the online Help. The Most Recent Conversations view includes the tabs listed in Table 6-3.
Table 6-2 Conversation Totals
Tab Describes (for each conversation pair)
Details Phone Number and IP Address of the sender and receiver, as well as the Number of Calls, Talk Time (total), and Average Setup Time
Data Volume Phone Number, Total RTP and RTCP Data Sent (Packets and Bytes) for sender and receiver
Table 6-3 Most Recent Conversations
Tab Describes (for each conversation pair)
Details Phone Number and IP Address of the sender and receiver, Talk Time and Last Call (most recent) Start Time
Setup Details Phone Number of the sender and receiver, Protocol, Codec, Setup Time, and Dialing Plan used by sender and receiver
Quality Phone Number of the sender and receiver, Jitter, Packet Loss, and Diff-Serv Control Point (DSCP) of the sender and receiver
Data Volume Phone Number of the sender and receiver and RTP and RTCP Data Sent by the sender and receiver
6-6 Understanding VoIP Levels and Views

Protocol Usage ViewThe Protocol Usage view allows you to monitor voice protocol distribution across individual segments. It consists of a chart that plots, over time, voice-related utilization values on the selected interface.
The view supports the following protocols:
• RTP
• RTCP
• MGCP
• SCCP Version 3.1
• H.245
• Q.931
To change your Protocol Usage view option, select from the available options in the bottom of the window.
To zoom in on the details of a specific duration, click and drag to select the area you want to zoom in on. You can right-click on the Protocol Usage view to zoom out again.
Launching a View in VoIPThe VoIP Navigation tree displays only those probes that have VoIP enabled. You can launch a view to see VoIP traffic data for a specific monitored element.
To launch a VoIP view:
1 From the nGenius Real-Time Monitor launch page, select VoIP.
2 Click the Desktop tab in which you want to display the view.
Note: The default poll rate for the Protocol Usage View is 30 seconds.
Note: You can access multiple VoIP views by using Desktops. Desktops areseparate tabbed windows in which you can view VoIP information. For detailson how to use Desktop views, refer to the online Help.
Getting Started With Voice over IP 6-7

3 In the Navigation tree, select Enterprise, or a physical probe interface. If the probe you want to select does not display in the Navigation tree, do one of the following:
• If you just enabled the VoIP option on a probe, click the Refresh toolbar icon.
• If you just added a probe that has VoIP enabled:
a Click the nGenius Server icon located next to the status bar to access the nGenius Server.
b From the Device Configuration dialog box, click the Probe tab.
c Select the probe you want to display.
d Click Details.
e Click Relearn.
f In the VoIP dialog box, click Refresh.
4 From the Action menu, select the view you want to display.
Launching Data Capture From a VoIP ViewThe VoIP component of nGenius Real-Time Monitor supports the ability to launch a data capture. You can invoke data capture at the Interface level of the tree, from a selected user in the Phone Users View, or from a specific conversation in either the Conversation Totals view or the Most Recent Conversations view.
When you invoke data capture from the Phone Users View, the Source field displays the user IP Address by default. When you invoke data capture from a specific conversation, the Source and Destination fields display by default the source and destination addresses for the conversation.
Refer to Chapter 5, "Getting Started With Packet Analyzer" and to the online Help for more information about performing a data capture.
6-8 Launching Data Capture From a VoIP View

Learning More About VoIPRefer to the online Help for information about the following topics:
• Configuring Voice Over IP Preferences
• Configuring Enterprise Thresholds
• Configuring Alarms
• Modifying Voice over IP Settings on the Probe
• Phone Users Parameters
• Most Recent Conversations Drill-Down Views
• Using Desktops in Voice over IP
• Viewing Element Info
Getting Started With Voice over IP 6-9

6-10 Learning More About VoIP

Appendix ATroubleshooting
This appendix contains suggested solutions to some Real-Time Monitor issues.
Issue Possible Cause Suggested Solution
Device fails to configure
• Real-Time Monitor cannot contact the device or interface
• Invalid IP address
• Read and write community strings are incorrect
• Verify that the device is active
• Verify that you entered the IP address of the device correctly
• Check the read and write community strings defined in the nGenius Server and verify that they match those defined in the device
Slow performance on Server
• System requirements not met
• Running other memory-intensive applications
• Ensure you meet system requirements
• Close other applications
Slow browser performance
• System requirements not met
• Virus scan software installed
• Screen saver running
• Incorrect JVM memory allocation
• Incorrect paging file size
Refer to the nGenius Real-Time Monitor Installation Guide for information on meeting system requirements for the browser, and for instructions on how to improve browser performance.
Troubleshooting A-1

A-2

Appendix BAccessing the nGenius Server From
Outside a Firewall
To access the nGenius Real-Time Monitor Server from outside a firewall, you can use the well-known port HTTP 80. The Web server must be running on port 80, and the firewall should be configured to allow incoming connections on port 80. All Real-Time Monitor client requests to the server are tunneled into an HTTP request over port 80. No additional configuration is needed.
Forcing HTTP Tunnelling
If a client cannot log in to the nGenius Server with this configuration, you can force the client to use HTTP tunneling by setting the following property in the <Real-Time Monitor>/rtm/html/client.properties file:
applicationx.applicationmanager.forceHttpTunneling=true
Special Considerations When Using NAT
When Network Address Translation (NAT) is being used in a monitored network environment, Real-Time Monitor clients that reside outside a firewall cannot connect to an nGenius Server that is installed and running inside the firewall.
To allow clients on either side of a firewall to properly connect to the nGenius Server, you must modify the client.properties and serverprivate.properties files as instructed in this section.
Note: The default setting is false. Changing this property to true will affect theway all clients log in to the server.
Accessing the nGenius Server From Outside a Firewall B-1

In the following example, 10.24.1.2 is the IP address of the system where nGenius Real-Time Monitor is installed inside the firewall. The host name of this system is MyHostName. The translated IP address of the nGenius Server, viewed from outside the firewall, is 38.24.1.2.
To access the nGenius Server across a firewall:
1 On the nGenius Server, modify files as follows:
• In the client.properties file, change the serveraddress to the host name instead of the internal IP address.
For example, change serveraddress=10.24.1.2 to serveraddress=MyHostName.
• In the serverprivate.properties file, change the serveraddress to the host name.
For example, change serveraddress=10.24.1.2 to serveraddress=MyHostName.
• In the serverprivate.properties file, change the java.rmi.server.hostname so that it uses the host name instead of the internal IP Address.
For example, change java.rmi.server.hostname=10.24.1.2 to java.rmi.server.hostname=MyHostName.
2 For all client systems, modify the host table to associate the translated server IP address, viewed from outside the firewall, with the server host name.
For example:
Windows platforms — Add 38.24.1.2 MyHostName to the Winnt\System32\Drivers\etc\hosts file.
UNIX platforms — Add 38.24.1.2 MyHostName to the /etc/hosts file.
B-2

Appendix CUsing the Command-line Utility
The command-line utility provides you with the dvTools. The dvTools allow you administer database tables and event logs, and perform several advanced functions that are not supported in the Real-Time Monitor user interface.
CommandsTo use the command line utility, go to the following directory on the nGenius Server system: <Real-Time Monitor install directory>/rtm/tools.
Table C-1 lists the available commands.
Table C-1 Command Line Utility
Command Description
dvadmin Adds or deletes hosts to receive SNMP traps from the specified probe, port, or DLCI
dvatmdump Provides ASCII text dump of control entries related to ATMRMON MIB tables found in ATM probes or switches
dvatmsnap Provides a snapshot of a segment, host, or conversation statistic groups of ATMRMON MIB for short periods for specified Port Select Group of the specified ATM agent or ATM switch port
dvclean Deletes MIB tables from a probe
dvdump Provides an ASCII text dump of control entries
dvevlog Retrieves event logs associated with a protocol, switch port, or Frame Relay DLCI
Using the Command-line Utility C-1
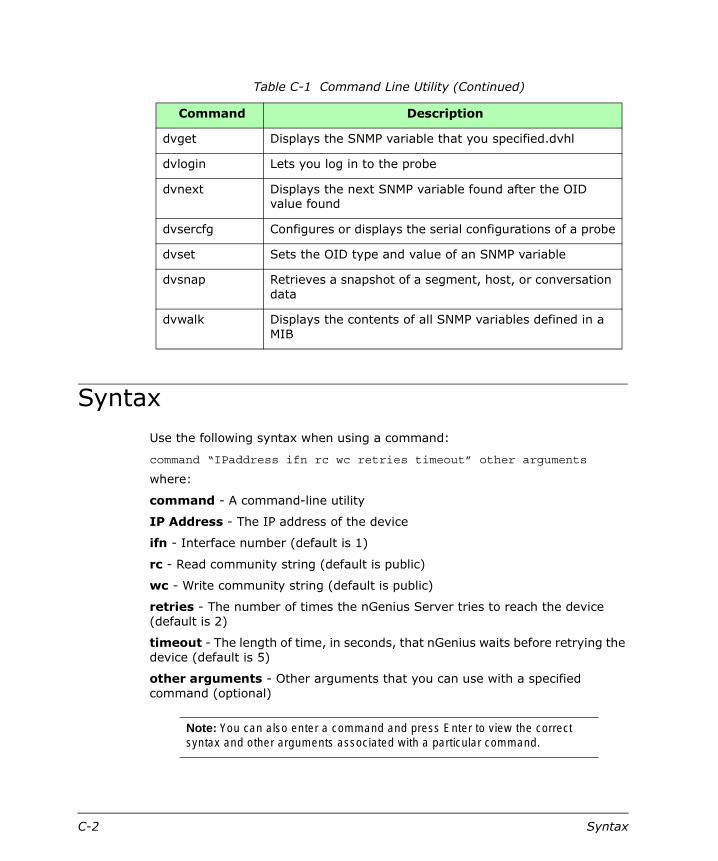
SyntaxUse the following syntax when using a command:
command “IPaddress ifn rc wc retries timeout” other arguments
where:
command - A command-line utility
IP Address - The IP address of the device
ifn - Interface number (default is 1)
rc - Read community string (default is public)
wc - Write community string (default is public)
retries - The number of times the nGenius Server tries to reach the device (default is 2)
timeout - The length of time, in seconds, that nGenius waits before retrying the device (default is 5)
other arguments - Other arguments that you can use with a specified command (optional)
dvget Displays the SNMP variable that you specified.dvhl
dvlogin Lets you log in to the probe
dvnext Displays the next SNMP variable found after the OID value found
dvsercfg Configures or displays the serial configurations of a probe
dvset Sets the OID type and value of an SNMP variable
dvsnap Retrieves a snapshot of a segment, host, or conversation data
dvwalk Displays the contents of all SNMP variables defined in a MIB
Note: You can also enter a command and press Enter to view the correctsyntax and other arguments associated with a particular command.
Table C-1 Command Line Utility (Continued)
Command Description
C-2 Syntax

For example:
dvadmin "123.45.678.90 3 public public 3 60"
You can also use a hyphen to use the default settings for the interface number, read community string, write community string, retries, and timeout, as in:
command "IPaddress -"
For example:
dvadmin "123.45.678.90 -"
To use the default value for one setting, such as the write community string:
dvadmin "123.45.67.890 3 public - 3 4"
Learning More About the dvToolsTo view syntax, arguments, and examples for each command, refer to "Using the Command-line Utility" in the online Help.
Using the Command-line Utility C-3

C-4 Learning More About the dvTools

Glossary
This section lists some basic terms that you should know before using nGenius Real-Time Monitor. For a comprehensive glossary of terms, refer to the online Help.
agent SNMP software that resides in a device, such as a probe or PC.
alarm Rising and falling thresholds that, when met or exceeded, trigger a trap message.
buffer Amount of space (in bytes) to be allocated per packet capture.
composite monitored element (composite ME)
Any monitored element that consists of sub-elements. For example, a group of all Ethernet interfaces, or one Frame Relay interface, that consists of multiple DLCIs.
Critical group Devices that have more than one discovered network interface.
Data Link Connection Identifier (DLCI)
A channel number that is attached to data frames to tell the network how to route the data. Frame relay allows you to segment physical ports into multiple logical interfaces. Each of these interfaces is identified by its DLCI.
device A probe, switch, or NAM.
filter template Screening mechanism to isolate and retrieve specific data in Packet Analyzer.
Glossary-1

interface Software, or programming, interfaces are the languages, codes, and messages programs use to communicate with each other and with the hardware.
mask Pattern (of bits or bytes) that is used to control the elimination or retention of another pattern.
mini-RMON Four of the ten RMON groups: Statistics, History, Events, and Alarms. Switch ports support mini-RMON.
monitored device Any probe, switch, or NAM that the device monitors.
monitored element
Any element that a device can monitor. Examples include: switches, switch ports, probes, probe interfaces, NAMs, DLCIs.
packet A single unit of data transmitted over a network. A key feature of a packet is that it contains source and destination addresses in addition to data.
Packet Analyzer A component of nGenius Real-Time Monitor. Packet Analyzer provides detailed packet capture and decode analysis.
probe A hardware device attached to a specific network segment that gathers statistical information for the link and provides the data to the nGenius Server database for further analysis.
slice Number of bytes of each packet that are saved in a capture.
spanning Sometimes called roving. With spanning, the nGenius Server can direct full RMON1 and RMON2 analysis, including RMON extensions, of any switch ports you select. Spanning involves connecting a probe to an analyzer port on the switch, then mirroring traffic from one or more selected switch ports to the specified analyzer port. The probe then examines the traffic as if it were receiving the traffic directly.
Glossary-2
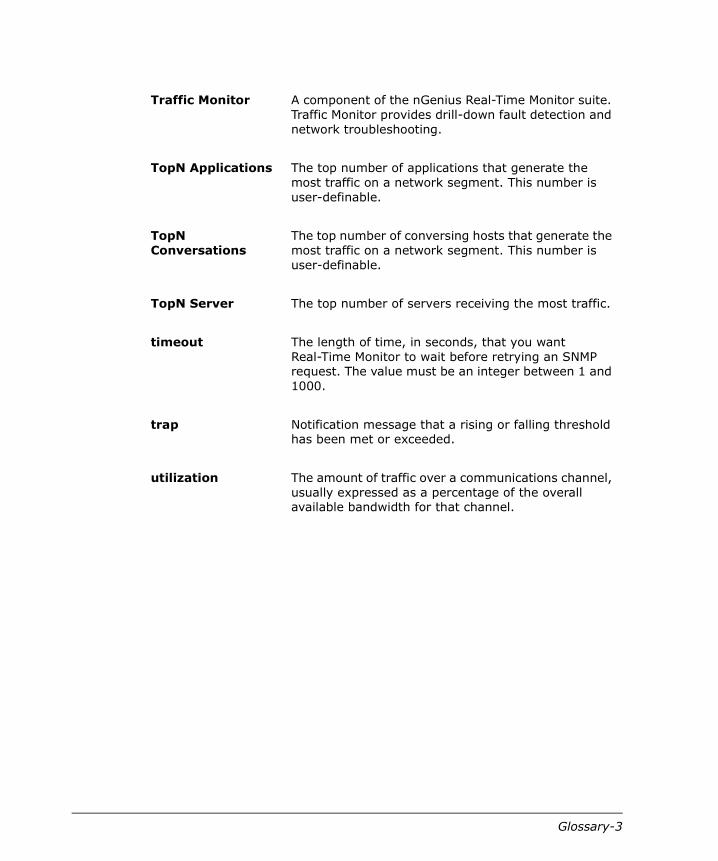
Traffic Monitor A component of the nGenius Real-Time Monitor suite. Traffic Monitor provides drill-down fault detection and network troubleshooting.
TopN Applications The top number of applications that generate the most traffic on a network segment. This number is user-definable.
TopN Conversations
The top number of conversing hosts that generate the most traffic on a network segment. This number is user-definable.
TopN Server The top number of servers receiving the most traffic.
timeout The length of time, in seconds, that you want Real-Time Monitor to wait before retrying an SNMP request. The value must be an integer between 1 and 1000.
trap Notification message that a rising or falling threshold has been met or exceeded.
utilization The amount of traffic over a communications channel, usually expressed as a percentage of the overall available bandwidth for that channel.
Glossary-3

Glossary-4

Index
Aaccessing VoIP views, 6-7accounts, user, 3-1activating a protocol, 3-10adding
ATM LS1010 switch, 3-5devices, 3-5
alarmsconfiguring, 4-7deleting, 4-8viewing, 4-7, 4-8
All Applications view, 4-5All Conversations view, 4-5All Hosts view, 4-5All Protocol views, 4-5All Traffic view, 4-6Application Layer views, 4-4applications, Real-Time Monitor, 1-1, 2-3Approver, 3-3ATM LS1010 switch, adding, 3-5
Bbuffer, clearing, 5-2
Cclearing the buffer, 5-2Comma Separated Values (CSV), saving
table views, 1-3components, software, 2-3configuring
alarms, 4-7data analysis, 3-8data sources, 1-2
Conversations Totals view, VoIP, 6-6creating user accounts, 3-1CSV. See Comma Separated Values
Ddata analysis
configuring, 3-8learning more about, 3-11
data capturelaunching, 5-1
from Traffic Monitor, 4-7from VoIP, 6-8
pausing, 5-2resuming, 5-2saving file, 5-2user roles, 5-1viewing status of, 5-2
Data Link Layerdrill-down options, 4-4vital signs, 4-6
data sourcesconfiguring, 1-2devices, 1-2monitored devices, 1-2monitored elements, 1-2
deactivating a protocol, 3-10definitions, D-1deleting alarms, 4-8device list, viewing, 3-7devices, 3-7
adding, 3-5data sources, 1-2importing, 3-6
drill-down optionsaccessing, 4-5Application Layer, 4-4Data Link Layer, 4-4DSMON statistics, 4-4Network Layer, 4-4SMON Monitor, 4-4top-level views, 4-4Traffic Monitor, 4-1
DSMON statistics, 4-4dvTools, using, C-1
Index-1

EElement Info view, VoIP, 6-4Enterprise view
Traffic Monitor, 4-3VoIP, 6-5
data provided, 6-5default poll rate, 6-5
Fformats, saving table views, 1-3
Ggetting started
Packet Analyzer, 5-1global settings, 1-2, 3-8glossary, D-1
HHelp Desk, user roles, 3-3Help, using online, 1-6HTML, saving table views, 1-3
Iimporting devices, 3-6
Llaunching, 2-2
default views in Traffic Monitor, 4-3prerequisites, 2-1protocol decode, 5-3user accounts, 3-1
learning moredata analysis, 3-11devices, 3-7nGeniusCLI, C-3Packet Analyzer, 5-5Traffic Monitor, 4-9user accounts, 3-4Voice over IP, 6-9
Mmaintaining security, 3-2monitored devices, 1-2monitored elements, 1-2Most Recent Conversations view,
VoIP, 6-6
Nnavigation levels, VoIP, 6-3Network Administrator role, 3-3Network Layer drill-down options, 4-4Network Operator role, 3-3nGenius Server, 1-1, 1-2, 2-3
Oonline Help, 1-6options, global settings, 3-8
PPacket Analyzer, 1-1, 1-4, 2-3
clearing the buffer, 5-2launching data capture, 5-1learning more about, 5-5pausing and resuming data
capture, 5-2protocol decode, 5-3, 5-4
parameters, global settings, 3-8pausing data capture, 5-2Phone Users view, VoIP
default poll rate, 6-5drill-down options, 6-5
pipe format, saving table views, 1-3poll rate, Enterprise view, 6-5prerequisites
launching software, 2-1VoIP, 6-1
probeenabling VoIP, 6-2modifying VoIP settings, 6-2templates, 3-11
product suite, Real-Time Monitor, 1-1
Index-2

protocol decodelaunching, 5-3overview, 5-3views, 5-4
Protocol Usage view, VoIP, 6-7protocols
activating, 3-10deactivating, 3-10
Rreal time, viewing data, 1-3Real-Time Monitor
applications, 2-3overview, 1-1product suite, 1-1tasks, 2-3troubleshooting, A-1
resuming data capture, 5-2roles, user, 3-1, 3-2
Ssaving table views, formats, 1-3security, user accounts, 3-2server, nGenius, 1-2, 2-3SMON Monitor, 4-4software components, 2-3switch
adding ATM LS1010, 3-5templates, 3-11
System Administrator roles, 3-3
TTab Separated Values (TSV), saving table
views, 1-3tasks, Real-Time Monitor, 2-3templates, 1-2, 3-11terminology, D-1top-level views
drill-down options, 4-4Traffic Monitor, 4-1, 4-4
TopN View, 4-6Traffic Monitor, 1-1, 1-3, 2-3
default views, 4-3drill-down views, 4-1launching data capture from, 4-7
learning more about, 4-9top-level views, 4-1, 4-4
troubleshooting, A-1TSV. See Tab Separated Values
Uuser accounts, 3-1
creating, 3-1learning more about, 3-4security, 3-2
user roles, 3-3Approver, 3-3Help Desk, 3-3Network Administrator, 3-3Network Operator, 3-3security, 3-2System Administrator, 3-3understanding, 3-1, 3-2
Vviewing
alarms, 4-7, 4-8device list, 3-7real time, 1-3vital signs, 4-6
viewsAll Applications, 4-5All Conversations, 4-5All Hosts, 4-5All Protocols, 4-5All Traffic, 4-5launching default in Traffic
Monitor, 4-3TopN, 4-5VoIP, 6-3
accessing, 6-7Conversation Totals, 6-6Element Info, 6-4Enterprise, 6-5Most Recent Conversations, 6-6Phone Users, 6-5Protocol Usage, 6-7
vital signs databy topology, 4-6viewing, 4-6
Vital Signs views, 4-6
Index-3

Voice over IP, 2-3enabling on probe, 6-2launching data capture from, 6-8learning more about, 6-9modifying probe settings, 6-2navigation levels, 6-3overview, 6-1views
accessing, 6-7Conversation Totals, 6-6Enterprise, 6-5Most Recent Conversations, 6-6overview, 6-3Phone Users, 6-5Protocol Usage, 6-7
VoIPprerequisites, 6-1views
Element Info, 6-4VoIP. See Voice over IP
Index-4


