Embed Size (px)
DESCRIPTION
Network Asset Discovery & Tracking. Vern Paxson University of California Berkeley, California USA [email protected] August 23, 2010. Overview. Grounding asset discovery in reality: empirical enterprise data Acquired extensive data from operational environments - PowerPoint PPT Presentation
Citation preview
Network AssetDiscovery & Tracking
Vern Paxson
University of California
Berkeley, California USA
August 23, 2010
Overview
Grounding asset discovery in reality: empirical enterprise data Acquired extensive data from operational environments
Supporting asset discovery and tracking with capture/archive technology VAST = Visibility Across Time and Space Enhancing “time machine” technology towards
operational use
Exploration of asset discovery algorithms Mining for unique signatures & clusters
Access To Empirical Enterprise Data
Leveraging ties with operational cybersecurity at Lawrence Berkeley National Lab (LBL), we obtained access to extensive raw internal logs ~4,000 users, ~12,000 internal hosts, Gbps/10Gbps Archive resides beyond OTP portal Exportable to team members we work with using
negotiated anonymization Can also mediate access via running analyses via portal
Ground truth (or at least partial) available Topology, historical DNS also available
Scope of the Data
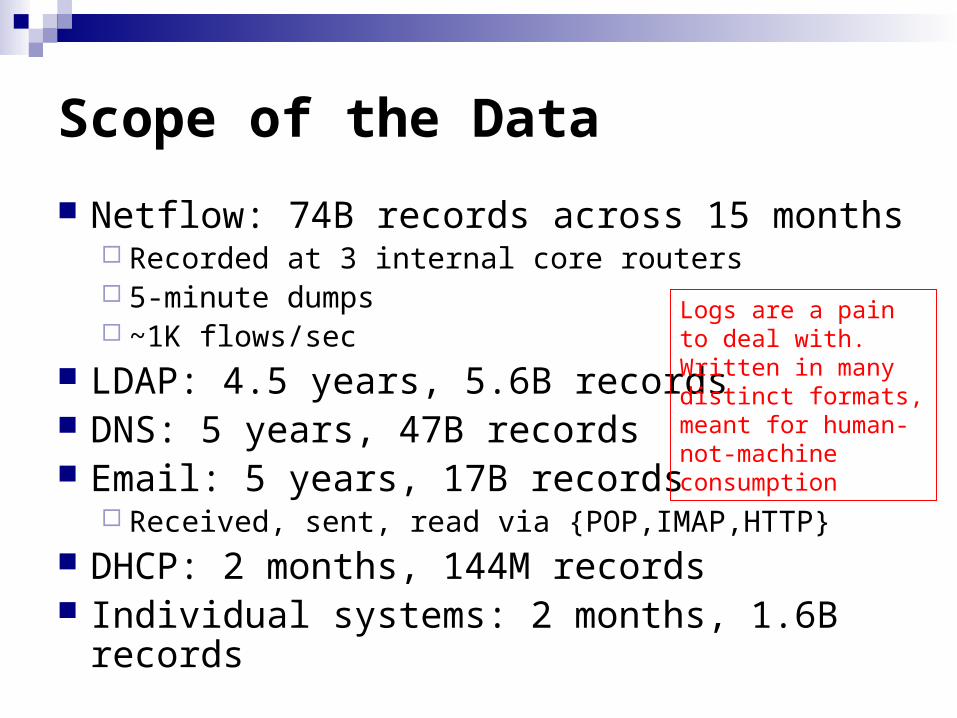
Netflow: 74B records across 15 months Recorded at 3 internal core routers 5-minute dumps ~1K flows/sec
LDAP: 4.5 years, 5.6B records DNS: 5 years, 47B records Email: 5 years, 17B records
Received, sent, read via {POP,IMAP,HTTP} DHCP: 2 months, 144M records Individual systems: 2 months, 1.6B records
Logs are a pain to deal with. Written in many distinct formats, meant for human-not-machine consumption
VAST: Motivating Premise
• Modern serious attacks often manifest– Over a range of time scales– Involving numerous system components
• Serious =– E.g. stolen credentials– E.g. insiders, spear-phishers
• Detecting these requires broad visibility– Across time (into the past; looking to the future)– Across space (different forms of sensing; inter-site)
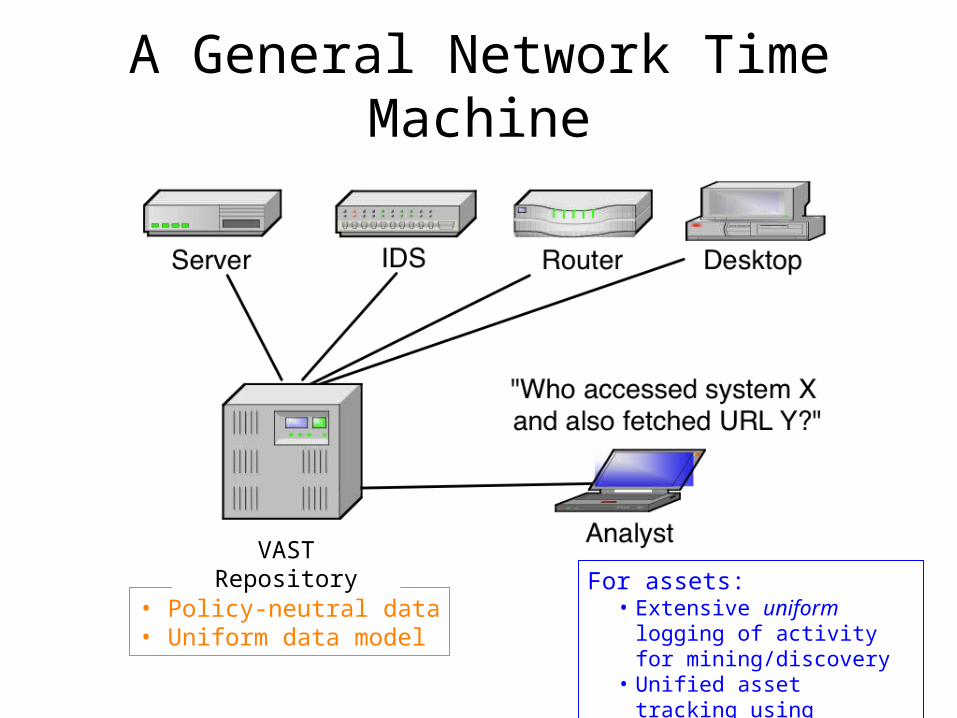
A General Network Time Machine
• Policy-neutral data• Uniform data model
VAST Repository For assets:
• Extensive uniform logging of activity for mining/discovery
• Unified asset tracking using general data model
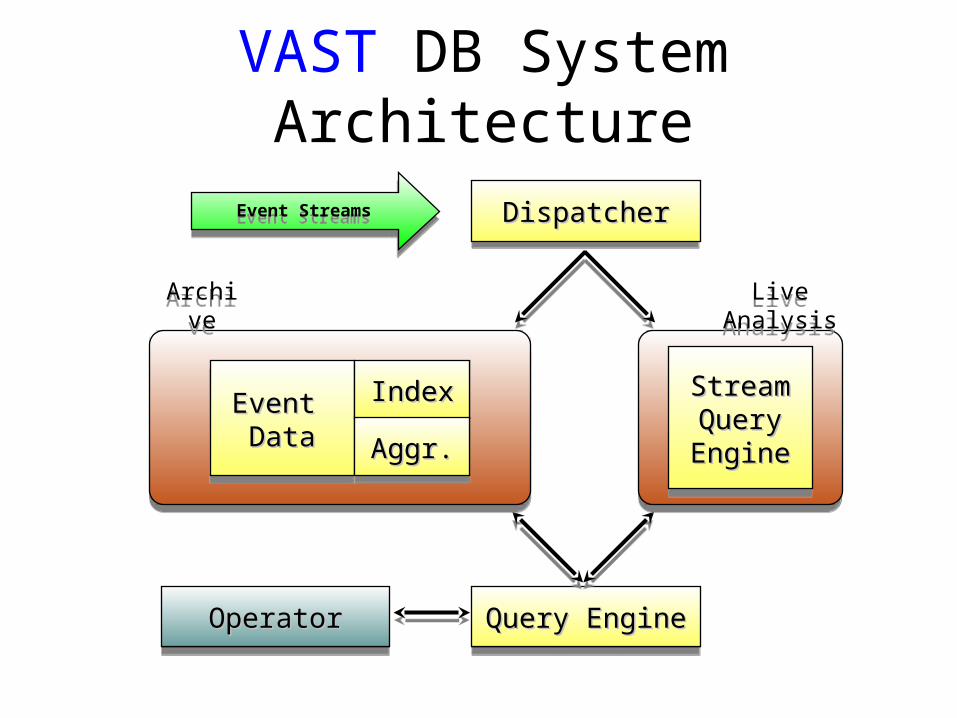
VAST DB System Architecture
Event StreamsEvent Streams DispatcherDispatcherDispatcherDispatcher
Query EngineQuery EngineQuery EngineQuery EngineOperatorOperatorOperatorOperator
Event Event DataDataEvent Event DataData
IndexIndexIndexIndex
Aggr.Aggr.Aggr.Aggr.
Archive
Archive
Stream Stream Query Query EngineEngine
Stream Stream Query Query EngineEngine
Live Analysis
Live Analysis
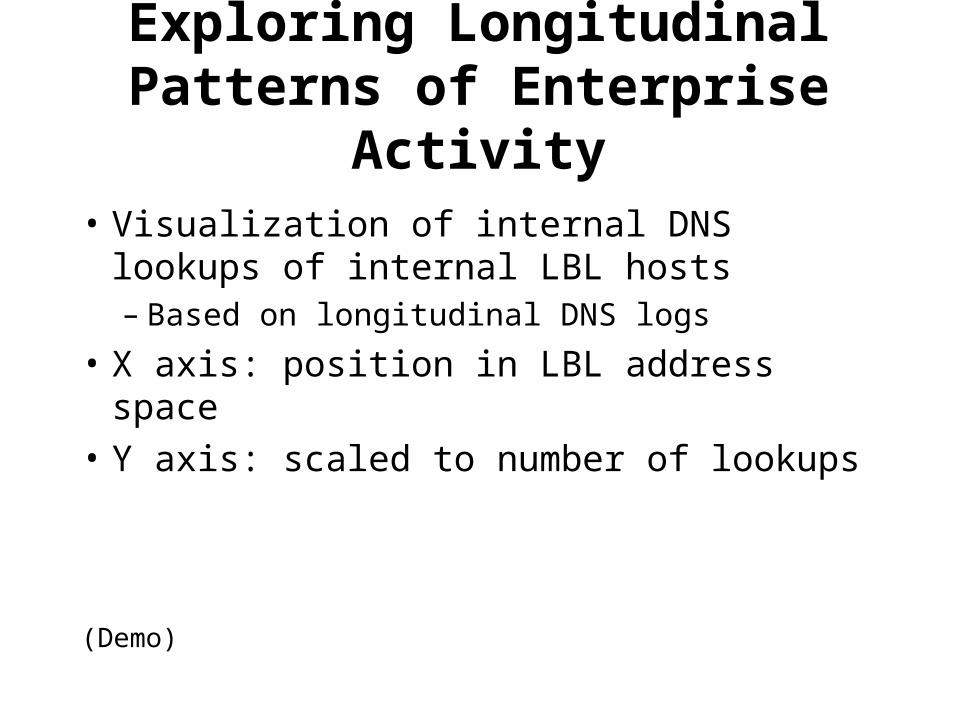
Exploring Longitudinal Patterns of Enterprise Activity
• Visualization of internal DNS lookups of internal LBL hosts– Based on longitudinal DNS logs
• X axis: position in LBL address space
• Y axis: scaled to number of lookups
(Demo)
Preliminary Exploration ofNetflow Data
• Single day from LBL– 9,702 source hosts, 11,362 destinations
• Removed internal scanners• Very simple clustering: Jaccard index on each
host’s destinations– Note: doesn’t mean host was client
• Initial crunch took ~24 CPU hours– Coded in Scala, 15 minutes on 17-node cluster
• For exact matches, 91% of hosts unique• Remainder exhibit ~ power-law structure

QuickTime™ and a decompressor
are needed to see this picture.

QuickTime™ and a decompressor
are needed to see this picture.

QuickTime™ and a decompressor
are needed to see this picture.

QuickTime™ and a decompressor
are needed to see this picture.
Preliminary Exploration ofConnection Patterns
• To what degree does a host’s past activity suffice to distinguish its future activity?– Use #1: find hosts that significantly alter their behavior
• E.g., due to failure/failover
– Use #2: track assets / disambiguate NAT/DHCP aliasing– Use #3: understand what makes a host unique (~ “role
discovery”) / find similar hosts
• Outbound traffic data set: 402 non-NATed source hosts– 1,528,619 distinct <address, port> destinations– 168 days
• Outbound HTTP data set: 160 non-NATed source hosts– 62,031 distinct HTTP host header destinations– 137 days
Fingerprinting End Systems, con’t
• So far, two assessments:– A: train first 10 days, evaluate on next 10 days– B: train first 30 days, evaluate on next 30 days
• Classification approach #1: Naïve Bayes– Use destinations as symbols for bag-of-words– P[Correct system in scenario A]: 53%– P[Correct system in scenario B]: 53%
• However: in failure instances, often the correct system is near the top …

QuickTime™ and a decompressor
are needed to see this picture.

QuickTime™ and a decompressor
are needed to see this picture.
Fingerprinting End Systems, con’t
• Classification approach #2: Jaccard index– Destinations weighted by their relative rarity– P[Correct for A]: 77%– P[Correct for B]: 70%
Benefit in considering constellations of destinations rather than just individual destinations in isolation

QuickTime™ and a decompressor
are needed to see this picture.

QuickTime™ and a decompressor
are needed to see this picture.

QuickTime™ and a decompressor
are needed to see this picture.
Next Steps
• Begin navigating huge LBL logs to determine– Extent of information available– Efficient & sound ways to sample/slice data– Low-hanging fruit for asset identification
• Work towards operational VAST deployment to gather future such data in a unified/coherent fashion
• Refine clustering techniques towards identifying sets of servers, including backups
• Develop/refine fingerprinting techniques for asset tracking
