Embed Size (px)
Citation preview
Network biology
Wang Jie
Shanghai Institutes of Biological Sciences
• Introduction• Conception on network • Network models• Network motifs• Biological networks• Network reconstruction and visualization• Network analysis• Relative database and software• Conclusion
Contents
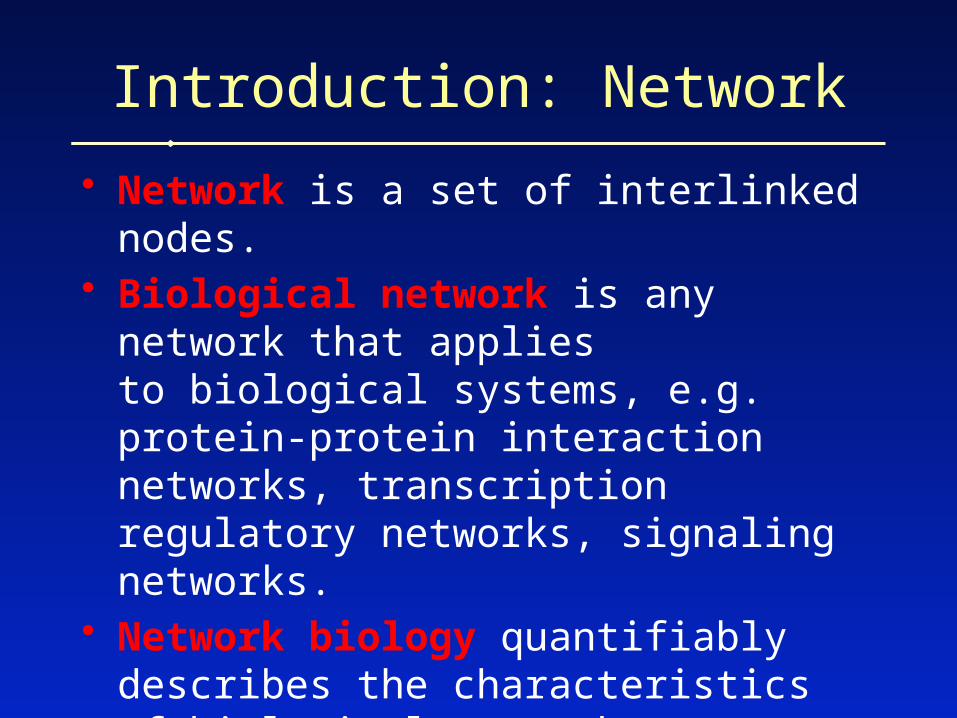
• Network is a set of interlinked nodes.• Biological network is any network that
applies to biological systems, e.g. protein-protein interaction networks, transcription regulatory networks, signaling networks.
• Network biology quantifiably describes the characteristics of biological networks.
• Network modeling qualitatively or quantitatively formulates the rules of networks.
Introduction: Network
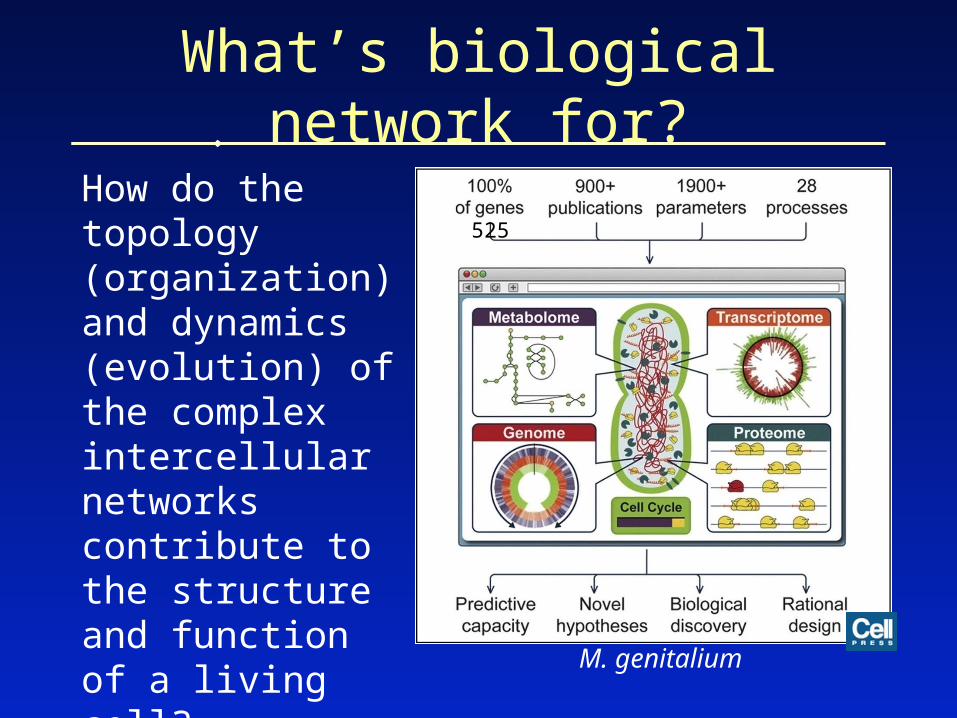
What’s biological network for?
How do the topology (organization) and dynamics (evolution) of the complex intercellular networks contribute to the structure and function of a living cell?
M. genitalium
525
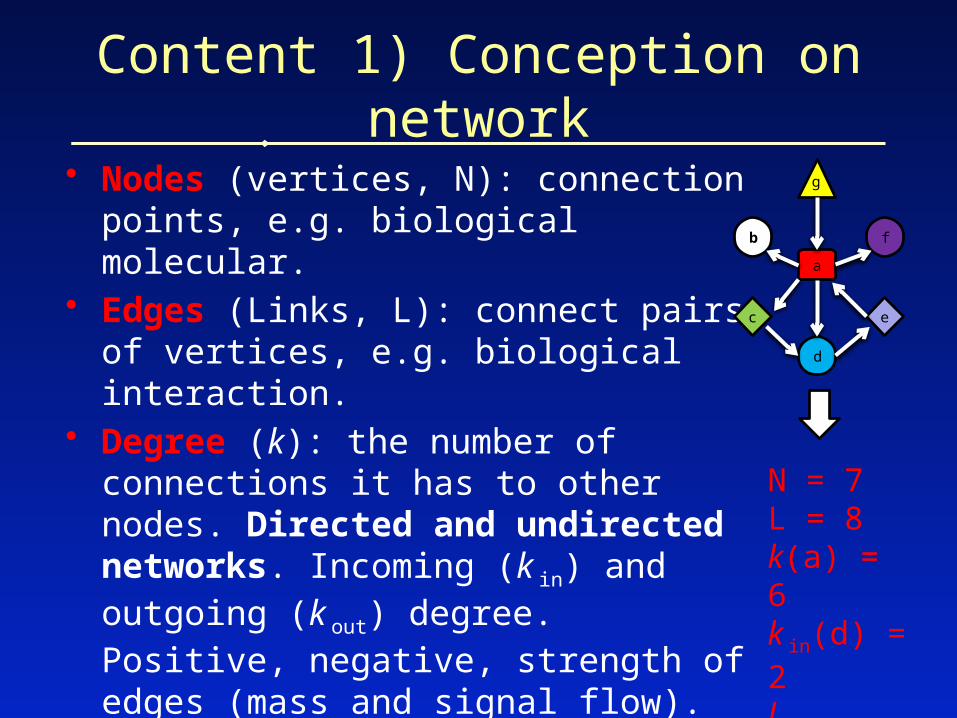
• Nodes (vertices, N): connection points, e.g. biological molecular.
• Edges (Links, L): connect pairs of vertices, e.g. biological interaction.
• Degree (k): the number of connections it has to other nodes. Directed and undirected networks. Incoming (k in) and outgoing (k out) degree. Positive, negative, strength of edges (mass and signal flow).
• Shortest path (l, mean path length): path with the smallest number of links between the selected nodes.
Content 1) Conception on network
d
a
fb
N = 7L = 8k(a) = 6k in(d) = 2l (ad)=1
c e
g
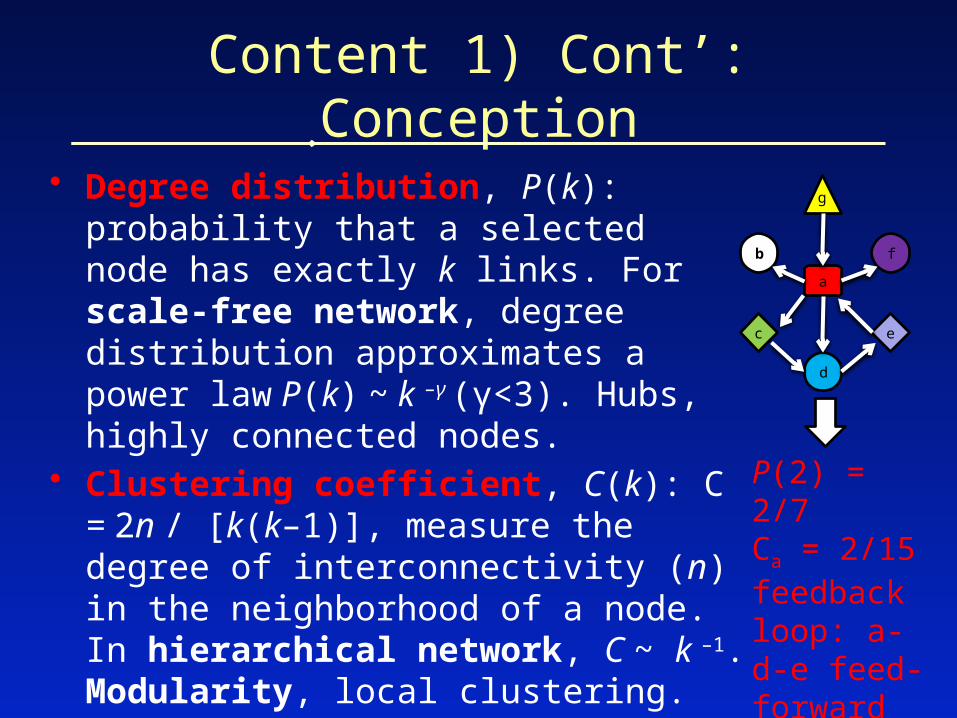
• Degree distribution, P(k): probability that a selected node has exactly k links. For scale-free network, degree distribution approximates a power law P(k) ~ k –γ (γ<3). Hubs, highly connected nodes.
• Clustering coefficient, C(k): C = 2n / [k(k–1)], measure the degree of interconnectivity (n) in the neighborhood of a node. In hierarchical network, C ~ k –1. Modularity, local clustering.
• Network motif: overrepresented circuits, e.g. feedback and feed-forward loops.
Content 1) Cont’: Conception
P(2) = 2/7Ca = 2/15feedback loop: a-d-e feed-forward loop: a-c-d
d
a
fb
c e
g
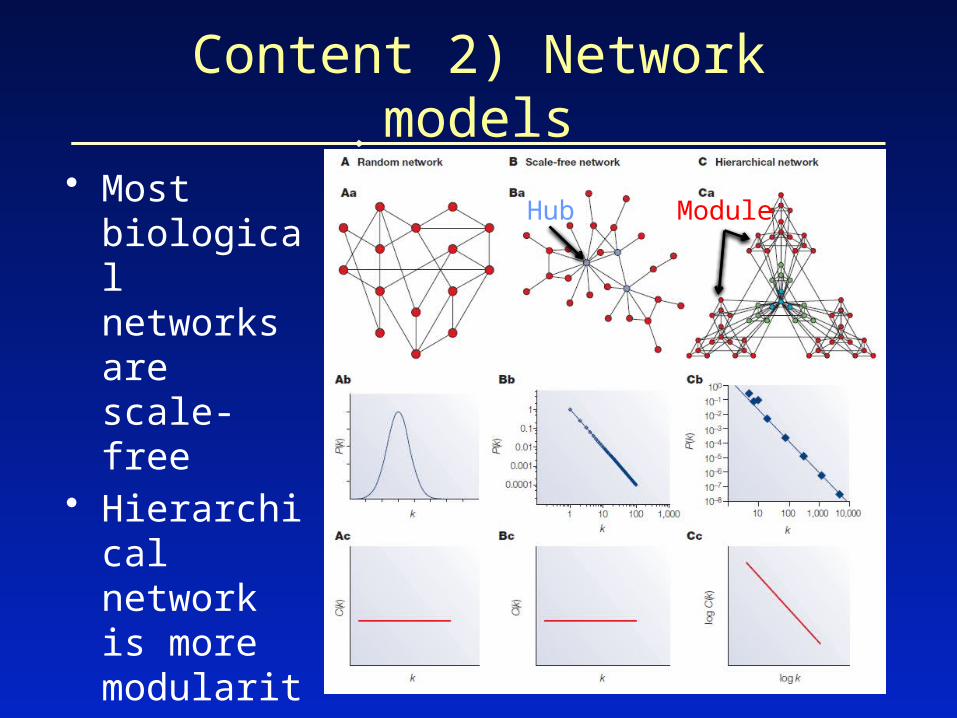
• Most biological networks are scale-free
• Hierarchical network is more modularity, robustness, adaptation.
Content 2) Network models
Hub Module
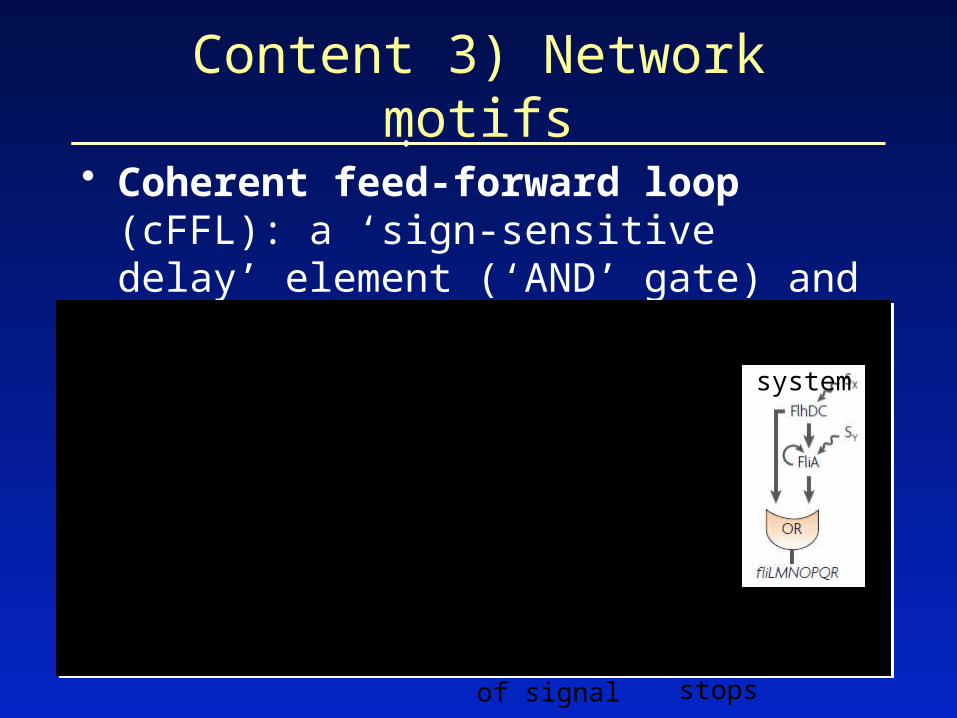
• Coherent feed-forward loop (cFFL): a ‘sign-sensitive delay’ element (‘AND’ gate) and persistence detector (‘OR’ gate).
Content 3) Network motifs
cFFLfilter out brief spurious
pulses of signal
E. coli arabinose system
a delay when stimulation stops
E. coli flagella system
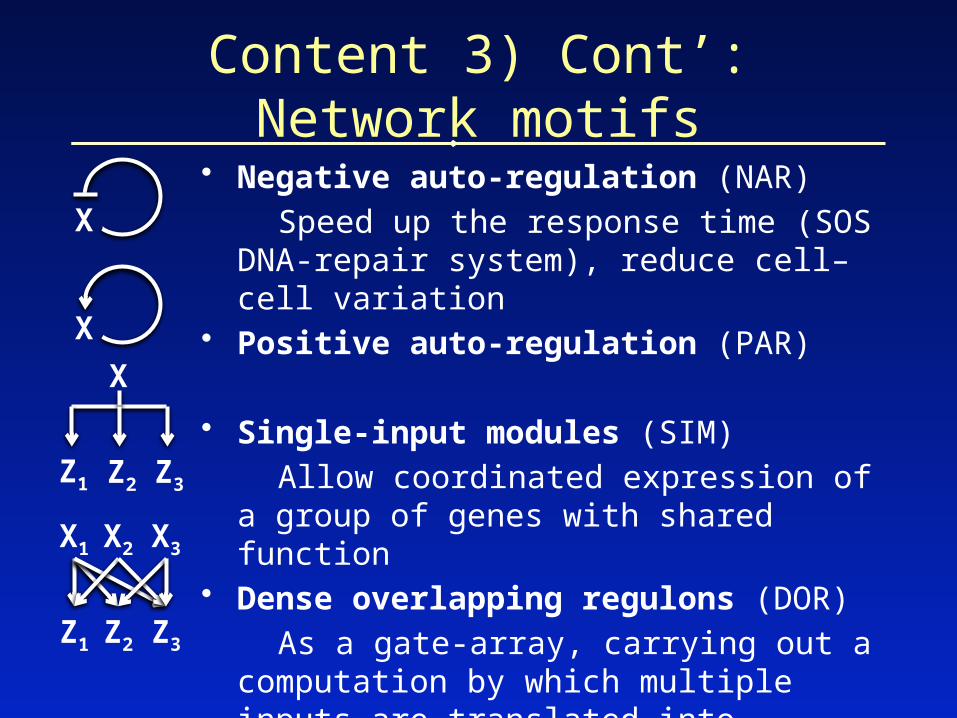
• Negative auto-regulation (NAR)
Speed up the response time (SOS DNA-repair system), reduce cell–cell variation
• Positive auto-regulation (PAR)
• Single-input modules (SIM)
Allow coordinated expression of a group of genes with shared function
• Dense overlapping regulons (DOR)
As a gate-array, carrying out a computation by which multiple inputs are translated into multiple outputs
Content 3) Cont’: Network motifs
X
X
X
Z1 Z2 Z3
X1 X2 X3
Z1 Z2 Z3
Content 4) Biological networks
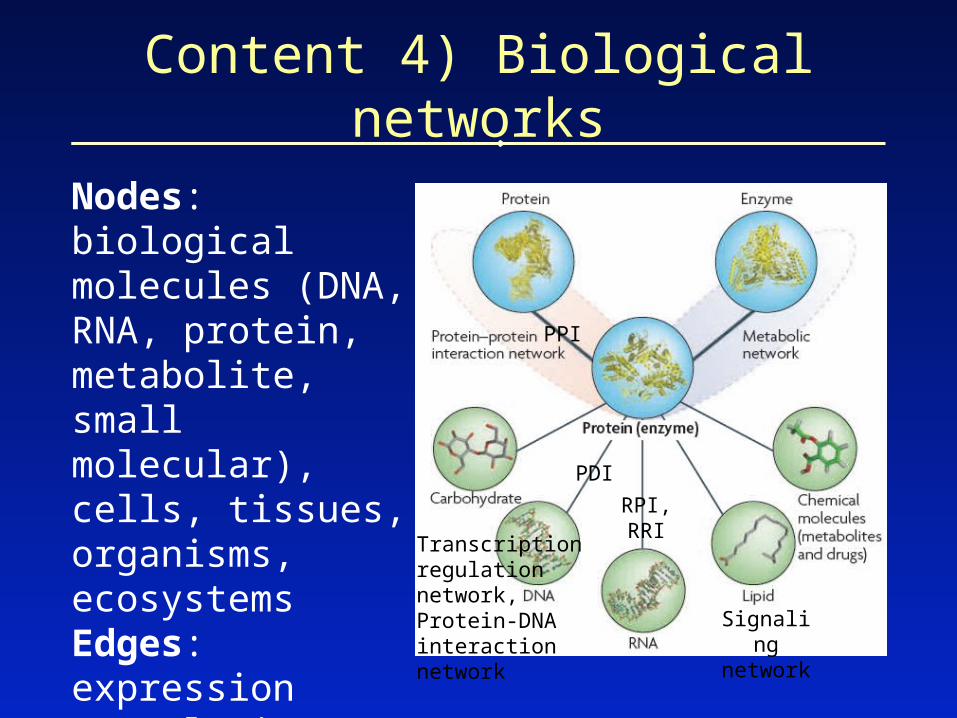
Nodes: biological molecules (DNA, RNA, protein, metabolite, small molecular), cells, tissues, organisms, ecosystemsEdges: expression correlation,biological (physical, genetic) interaction
Transcription regulation network, Protein-DNA interaction network
Signaling network
PPI
PDI
RPI, RRI
Content 4) Cont’: Biological networks
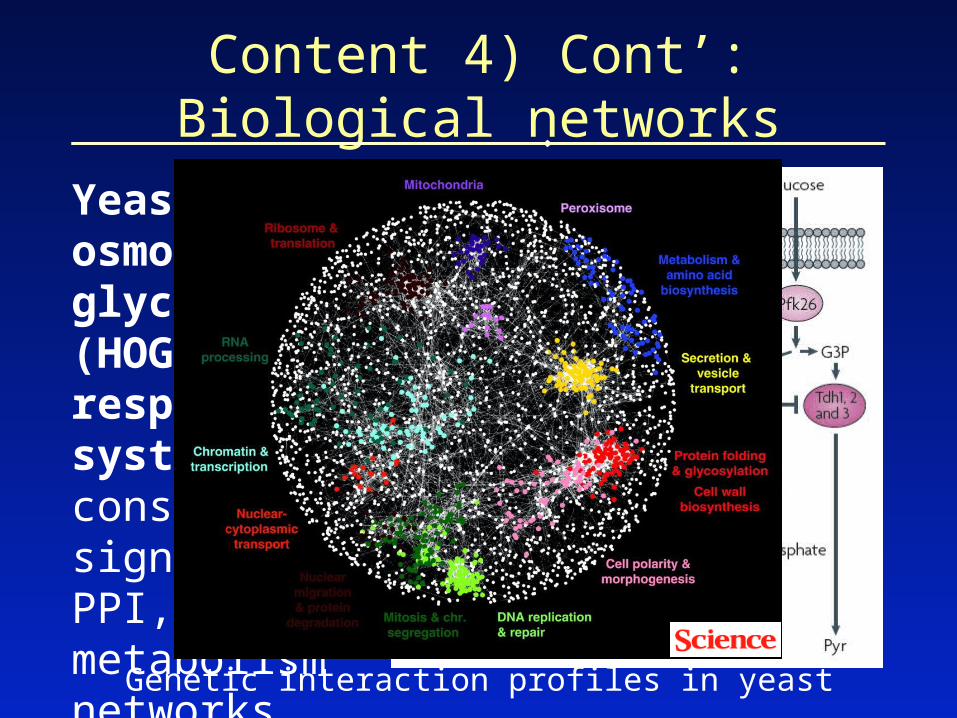
Yeast high-osmolarity glycerol (HOG) response system, consist of signaling, PPI, PDI and metabolism networks
Genetic interaction profiles in yeast
Content 5) Network reconstruction and visualization
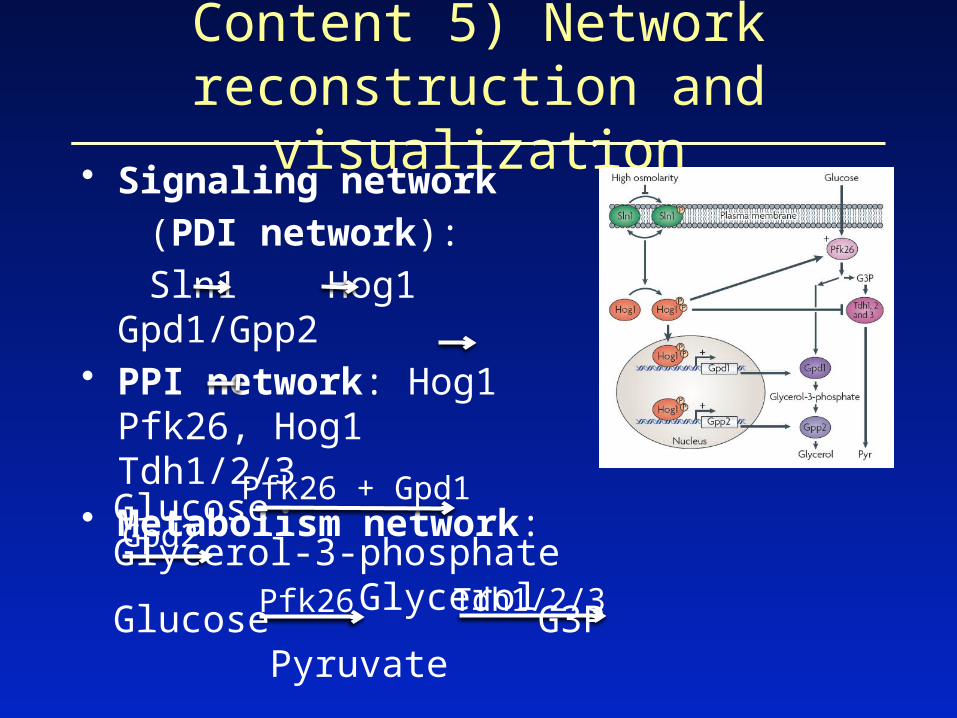
• Signaling network
(PDI network):
Sln1 Hog1 Gpd1/Gpp2• PPI network: Hog1 Pfk26,
Hog1 Tdh1/2/3• Metabolism network:
Pfk26 + Gpd1
Gpd2
Pfk26 Tdh1/2/3
Glucose Glycerol-3-phosphate GlycerolGlucose G3P Pyruvate
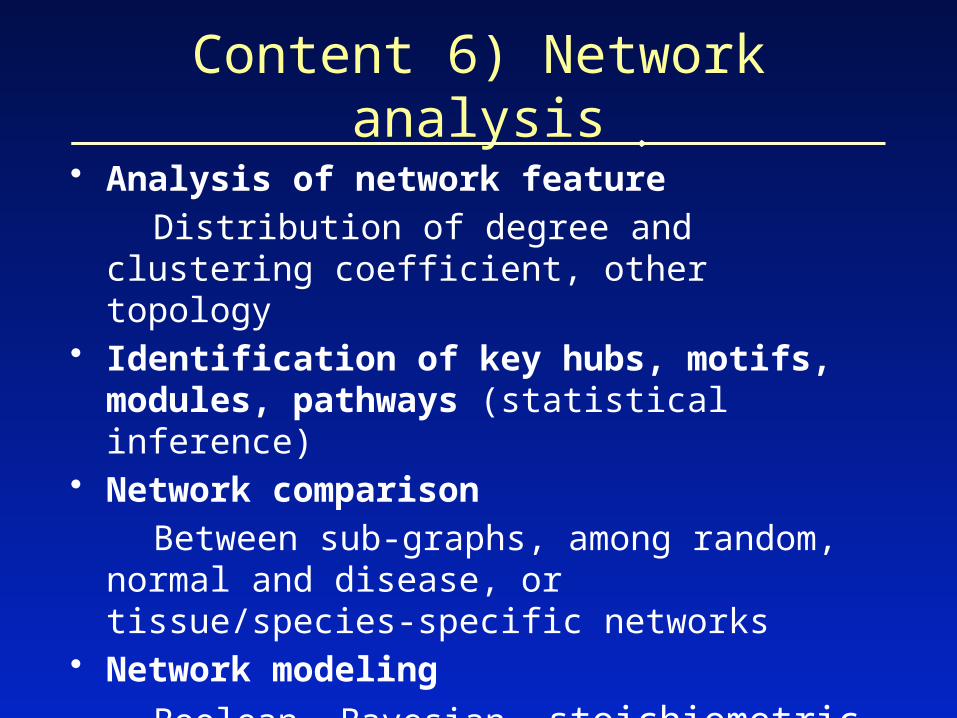
Content 6) Network analysis
• Analysis of network feature
Distribution of degree and clustering coefficient, other topology
• Identification of key hubs, motifs, modules, pathways (statistical inference)
• Network comparison
Between sub-graphs, among random, normal and disease, or tissue/species-specific networks
• Network modeling
Boolean, Bayesian, stoichiometric, stochastic and dynamic model
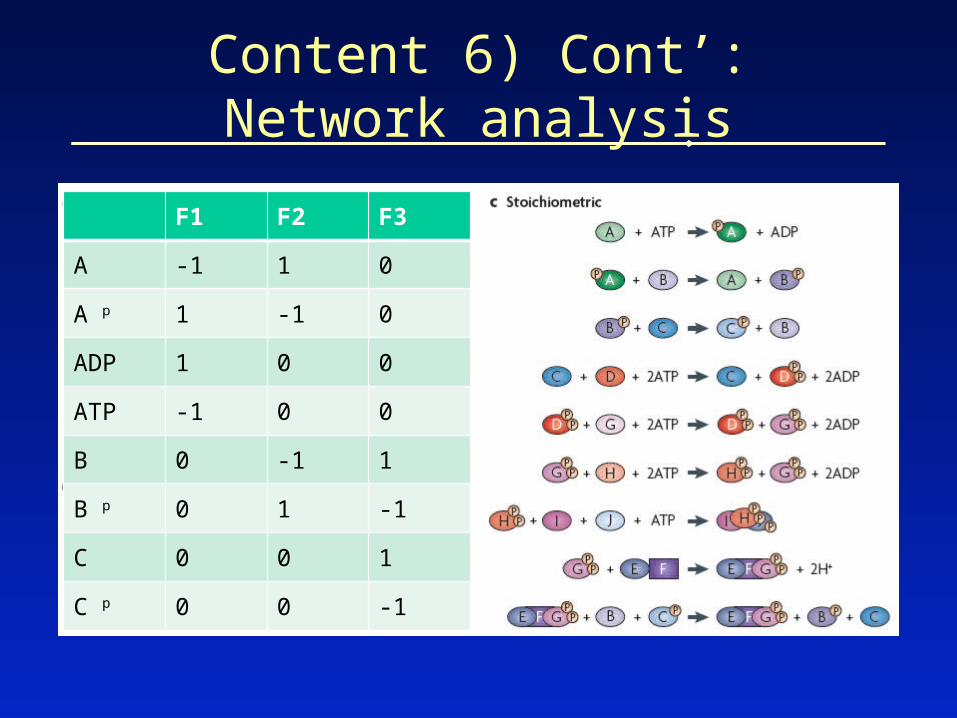
Content 6) Cont’: Network analysis
F1 F2 F3
A -1 1 0
A p 1 -1 0
ADP 1 0 0
ATP -1 0 0
B 0 -1 1
B p 0 1 -1
C 0 0 1
C p 0 0 -1
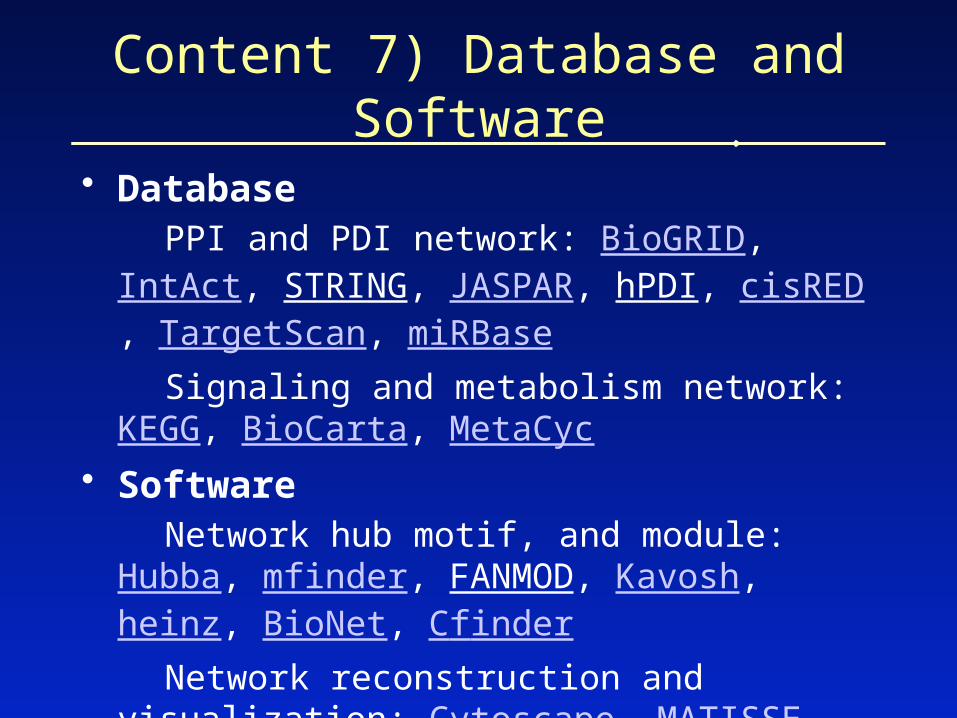
• Database PPI and PDI network: BioGRID, IntAct, STRING,
JASPAR, hPDI, cisRED, TargetScan, miRBase
Signaling and metabolism network: KEGG, BioCarta, MetaCyc
• Software Network hub motif, and module: Hubba, mfinder,
FANMOD, Kavosh, heinz, BioNet, Cfinder
Network reconstruction and visualization: Cytoscape, MATISSE, BioTapestry
Network analysis: NeAT, CellNetAnalyzer, SBML
Content 7) Database and Software
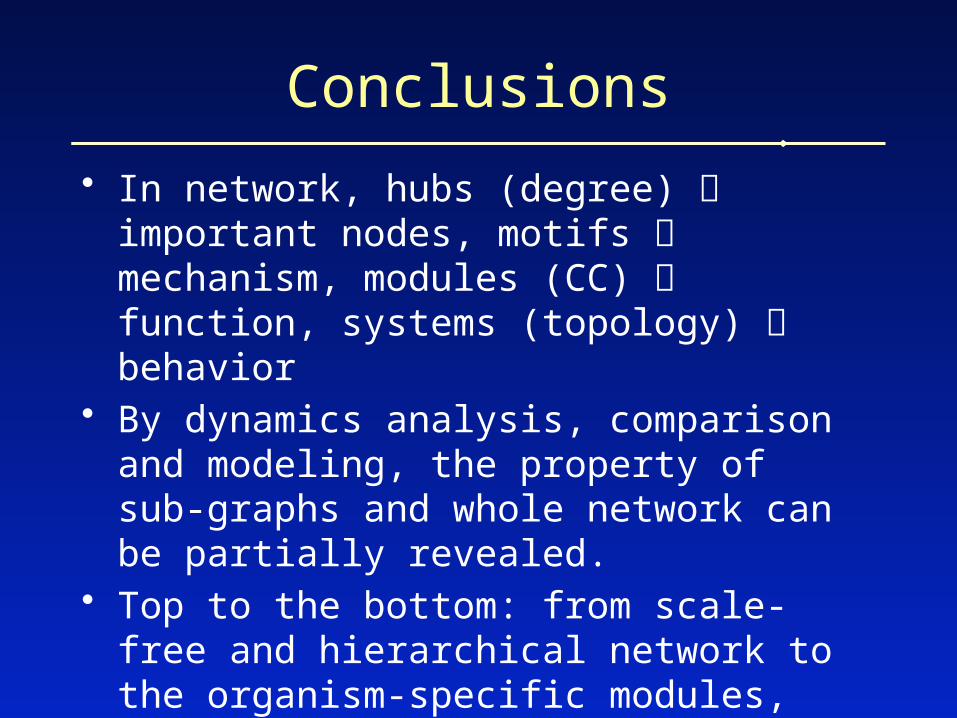
• In network, hubs (degree) important nodes, motifs mechanism, modules (CC) function, systems (topology) behavior
• By dynamics analysis, comparison and modeling, the property of sub-graphs and whole network can be partially revealed.
• Top to the bottom: from scale-free and hierarchical network to the organism-specific modules, motifs and molecules. (vs. bottom up).
Conclusions
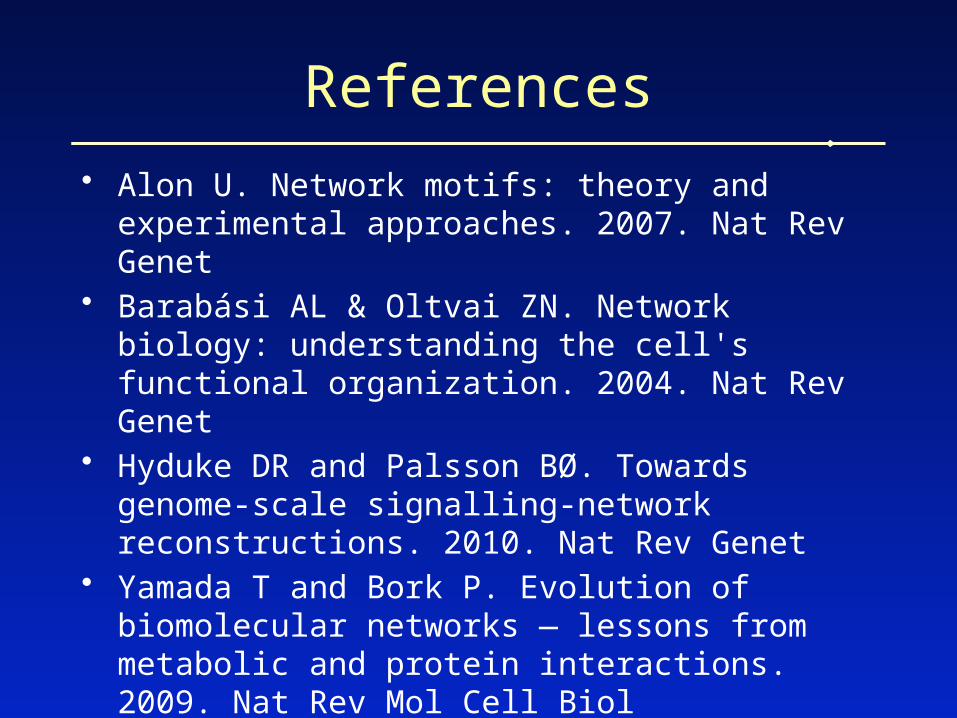
• Alon U. Network motifs: theory and experimental approaches. 2007. Nat Rev Genet
• Barabási AL & Oltvai ZN. Network biology: understanding the cell's functional organization. 2004. Nat Rev Genet
• Hyduke DR and Palsson BØ. Towards genome-scale signalling-network reconstructions. 2010. Nat Rev Genet
• Yamada T and Bork P. Evolution of biomolecular networks — lessons from metabolic and protein interactions. 2009. Nat Rev Mol Cell Biol
References

Thank you!


![jIE sIjv ]GQ](https://img.pdfslide.net/doc/110x75/60aaff4495c4fc343553ea02/jie-sijv-gq.jpg)