Embed Size (px)
Citation preview
Networked Life and Social Networks
Thanks to Michael Kearns, James Moody, Anna Nagurney, Colexn
What we have covered• What is IR• Evaluation• Tokenization and properties of text • Web crawling• Query models• Vector methods• Measures of similarity• Indexing• Inverted files• Spam and SEO• Google and Link Analysis• Today - new directions in search
– Social networks and networking - web 2.0– Relationships to other network models - pagerank
Social networks vs social networking
• Social networks are links of actors and their relationships usually represented as a graph or network
• Social networking is the actual implementation of social networks in the digital world or media– A social network service focuses on building and reflecting of social
networks or social relations among people, e.g., who share interests and/or activities. A social network service essentially consists of a representation of each user (often a profile), his/her social links, and a variety of additional services. Most social network services are web based and provide means for users to interact over the internet, such as e-mail and instant messaging.
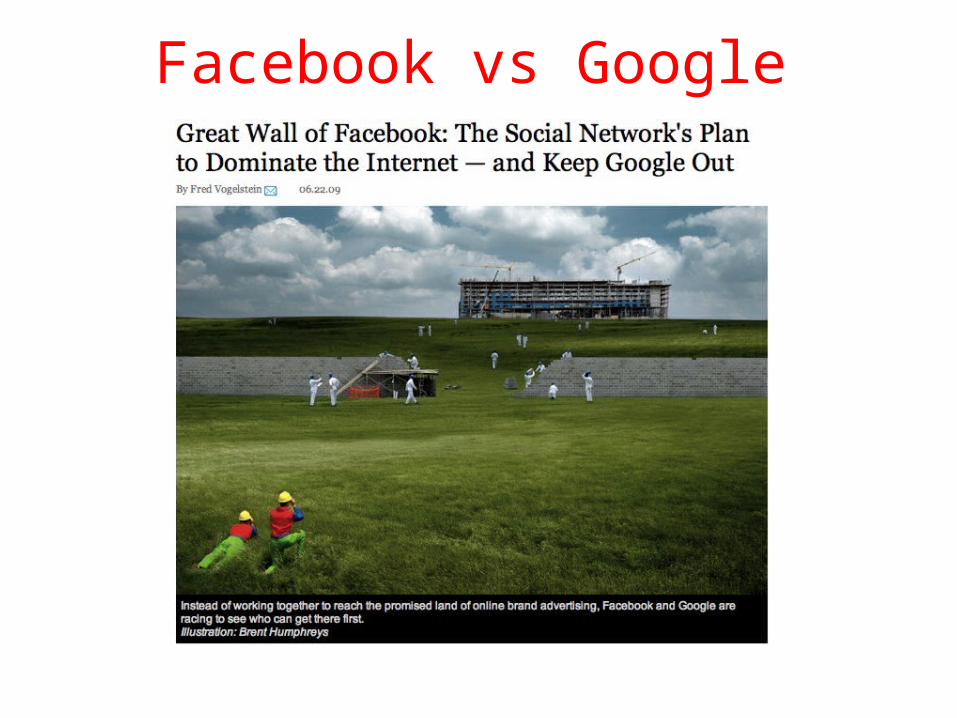
Facebook vs Google
Web 2.0
• A perceived second generation of web development and design, that aims to facilitate communication, secure information sharing, interoperability, and collaboration on the World Wide Web.
• Web 2.0 concepts have led to the development and evolution of web-based communities, hosted services, and applications such as social-networking sites, video-sharing sites, wikis, blogs, and folksonomies.
Social Media
• Information content created by people using highly accessible and scalable publishing technologies that is intended to facilitate communications, influence and interaction with peers and with public audiences, typically via the Internet and mobile communications networks.
• The term most often refers to activities that integrate technology, telecommunications and social interaction, and the construction of words, pictures, videos and audio.
• Businesses also refer to social media as user-generated content (UGC) or consumer-generated media (CGM).
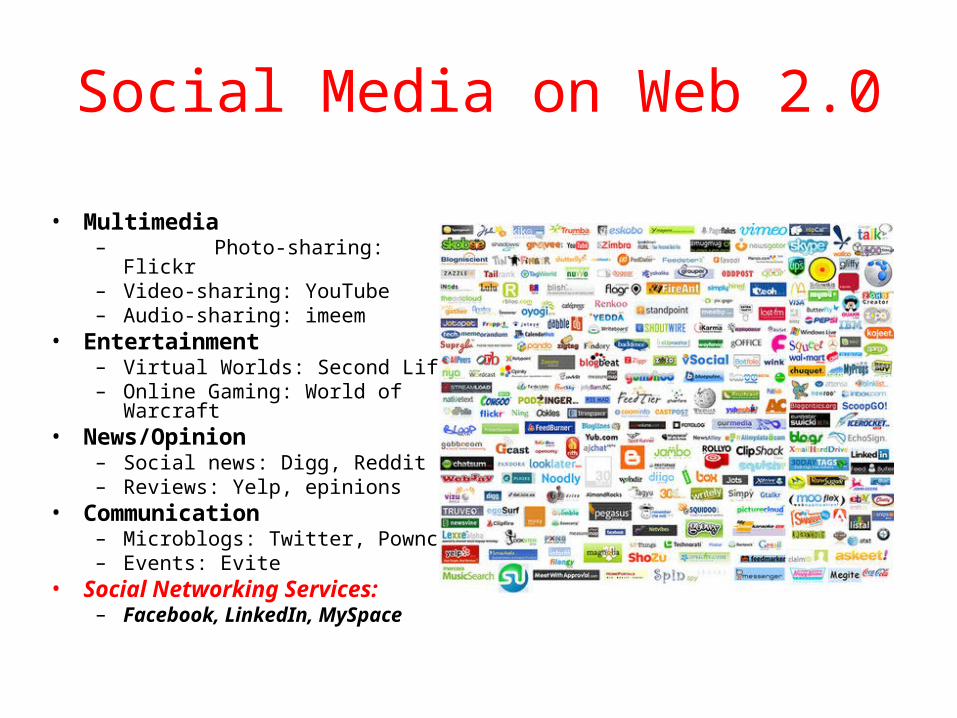
Social Media on Web 2.0
• Multimedia– Photo-sharing: Flickr– Video-sharing: YouTube– Audio-sharing: imeem
• Entertainment– Virtual Worlds: Second Life– Online Gaming: World of Warcraft
• News/Opinion– Social news: Digg, Reddit– Reviews: Yelp, epinions
• Communication– Microblogs: Twitter, Pownce– Events: Evite
• Social Networking Services:– Facebook, LinkedIn, MySpace
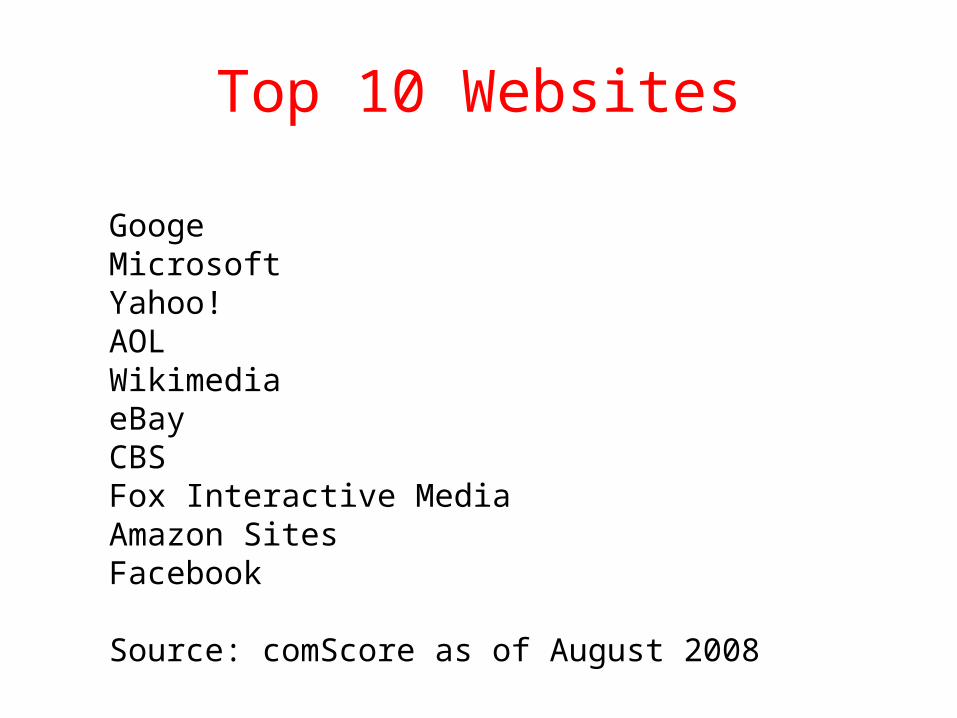
Top 10 Websites
GoogeMicrosoftYahoo!AOLWikimediaeBayCBSFox Interactive MediaAmazon SitesFacebook
Source: comScore as of August 2008
Social Network Service
• A social network service focuses on building online communities of people who share interests and/or activities, or who are interested in exploring the interests and activities of others.
• Most social network services are web based and provide a variety of ways for users to interact, such as e-mail and instant messaging services.
Popular Social Networking Sites by Location
• North America– MySpace and Facebook, Nexopia (mostly in Canada)
• South and Central America– Orkut, Facebook and Hi5
• Europe– Bebo,Facebook, Hi5, MySpace, Tagged, Xing and
Skyrock • Asia and Pacific
– Friendster, Orkut, Xiaonei and Cyworld

Usage of Social Network
Types of Social Networking Services
• Profile-based
• Content-based
• White-label
• Multi-user Virtual environments
• Mobile
• Micro-blogging
• Social Search
Profile-based
• primarily organized around members’ profile pages – pages that mainly consist of information about an individual member, including the person’s picture and details of interests, likes and dislikes.
• Bebo, Facebook and MySpace are all good examples of profile-based services.
Content-based
• In these services, the user’s profile remains an important way of organizing connections, but plays a secondary role to the posting of content.
• Examples of content-based communities:– YouTube.com for video sharing – Last.fm, in which the content is arranged by software
that monitors and represents the music that users listen to.
– Photo-sharing site like Flickr.com.
White-label
• Offer some group-building functionality, which allows users to form mini-communities within sites.
• Example sites:– PeopleAggregator– Ning– Colexn
Multi-user Virtual Environment
• allow users to interact with each other’s avatars • users have profile cards, their functional profiles
are the characters they customize or build and control. Friends lists are usually private and not publicly shared or displayed.
• Example Sites:– Second Life – World of Warcraft
Mobile Social Networking
• Many social networking sites, for example MySpace and Twitter, offer mobile phone versions of their services, allowing members to interact with their friends via their phones.
• mobile-led and mobile-only communities include profiles and media-sharing just as with web-based social networking services.
• MYUBO, for example, allows users to share and view video over mobile networks
Micro-blogging
• Allows you to publish short (140 characters, including spaces) messages publicly or within contact groups.
• These services are designed to work as mobile services, but are popularly used on the web as well.
• Example Services – Twitter – Jaiku
Social Search
• Social search engines are an important web development which utilise the popularity of social networking services.
• There are various kinds of social search engine, but sites like Wink and Spokeo generate results by searching across the public profiles of multiple social networking sites, allowing the creation of web-based dossiers on individuals.
• This type of people search cuts across the traditional boundaries of social networking site membership, although any data retrieved should already be in the public domain.
Things you can do in a Social Network
• Communicating with existing networks, making and developing friendships/contacts
• Represent themselves online, create and develop an online presence
• Viewing content/finding information• Creating and customizing profiles • Authoring and uploading content • Adding and sharing content • Posting messages – public & private • Collaborating with other people
The Networked Nature of Society
• Networks as a collection of pairwise relations• Examples of (un)familiar and important networks
– social networks– content networks– technological networks– biological networks– economic networks
• The distinction between structure and dynamics
A network-centric overview of modern society.
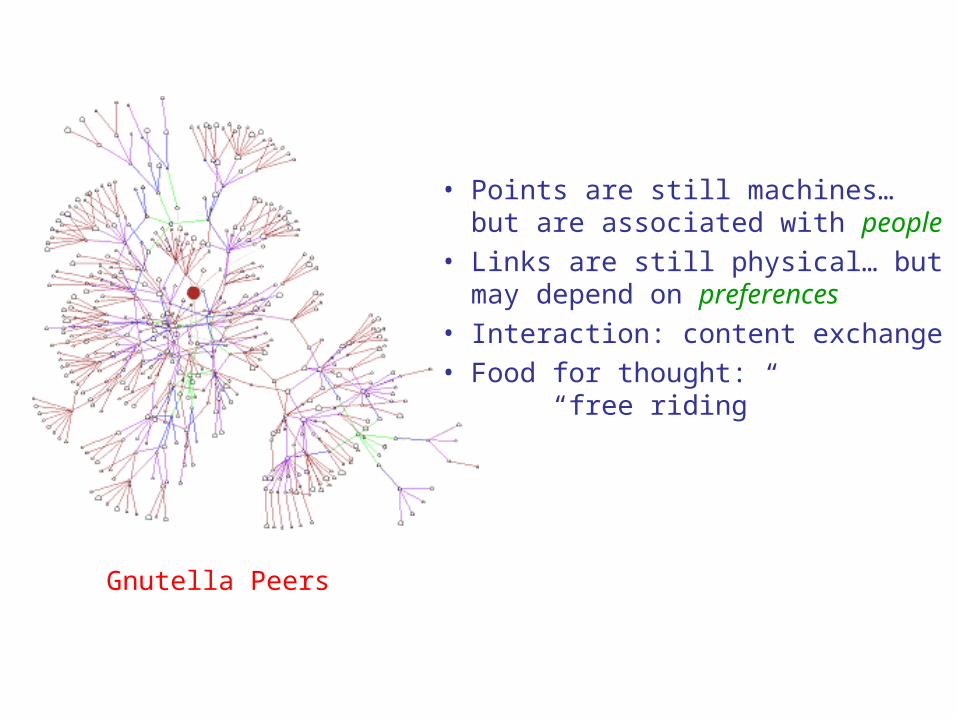
Gnutella Peers
• Points are still machines… but are associated with people
• Links are still physical… but may depend on preferences
• Interaction: content exchange• Food for thought:
“free riding”
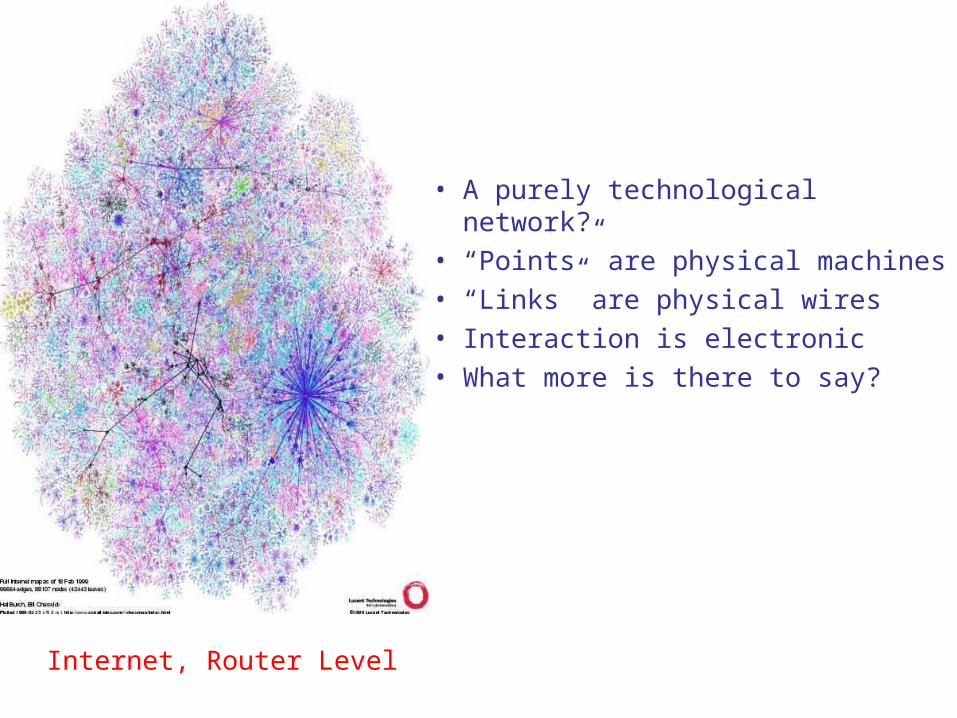
Internet, Router Level
• A purely technological network?• “Points” are physical machines• “Links” are physical wires• Interaction is electronic• What more is there to say?
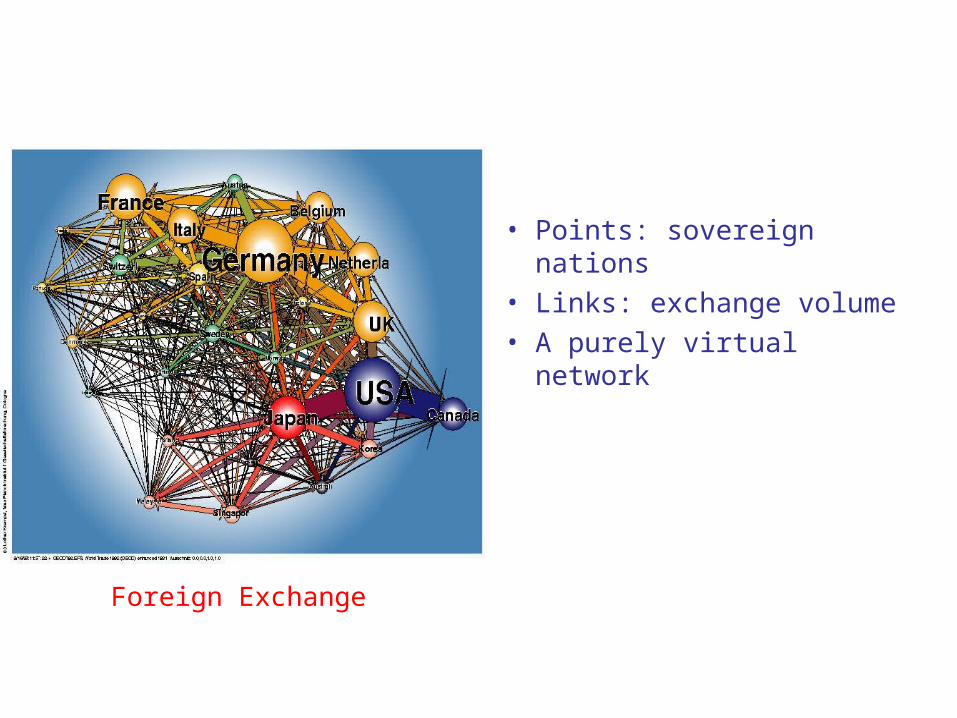
Foreign Exchange
• Points: sovereign nations• Links: exchange volume• A purely virtual network
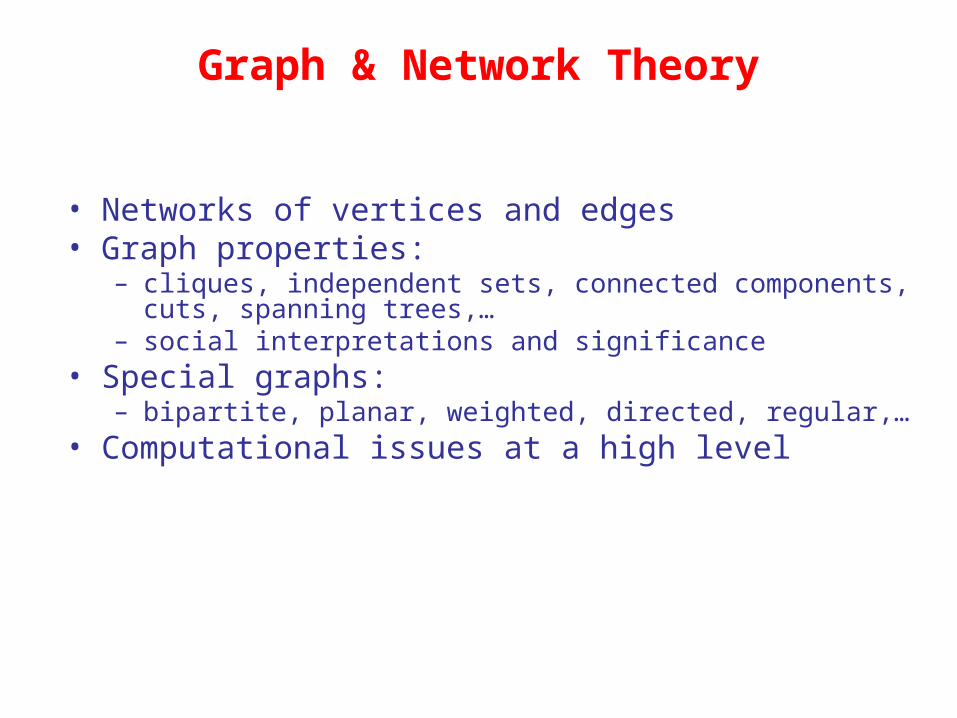
Graph & Network Theory
• Networks of vertices and edges• Graph properties:
– cliques, independent sets, connected components, cuts, spanning trees,…
– social interpretations and significance • Special graphs:
– bipartite, planar, weighted, directed, regular,…• Computational issues at a high level
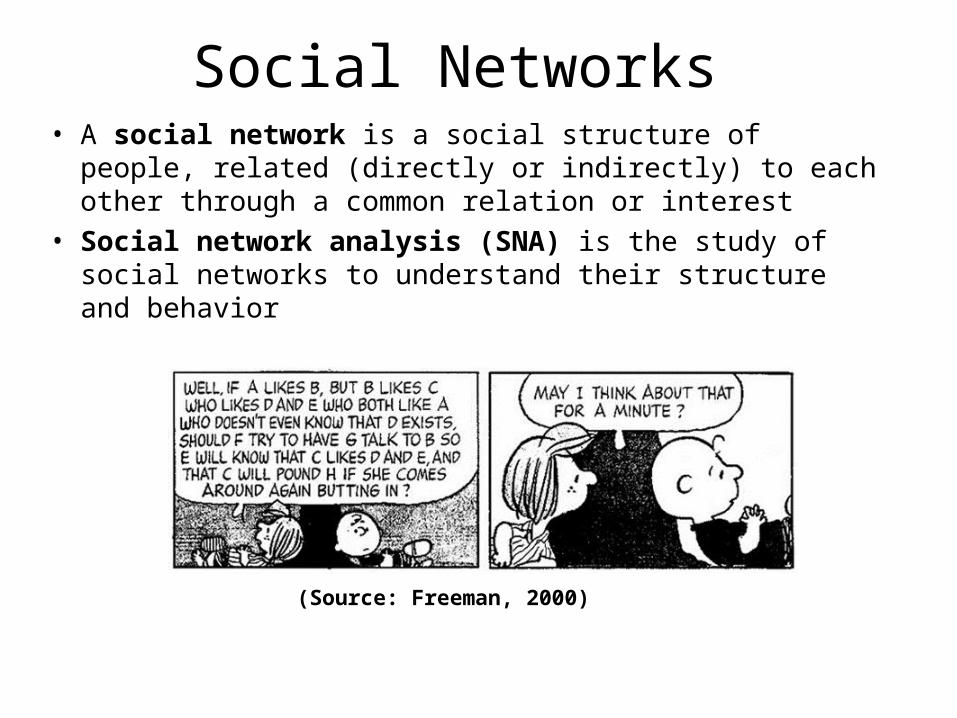
Social Networks• A social network is a social structure of people, related
(directly or indirectly) to each other through a common relation or interest
• Social network analysis (SNA) is the study of social networks to understand their structure and behavior
(Source: Freeman, 2000)
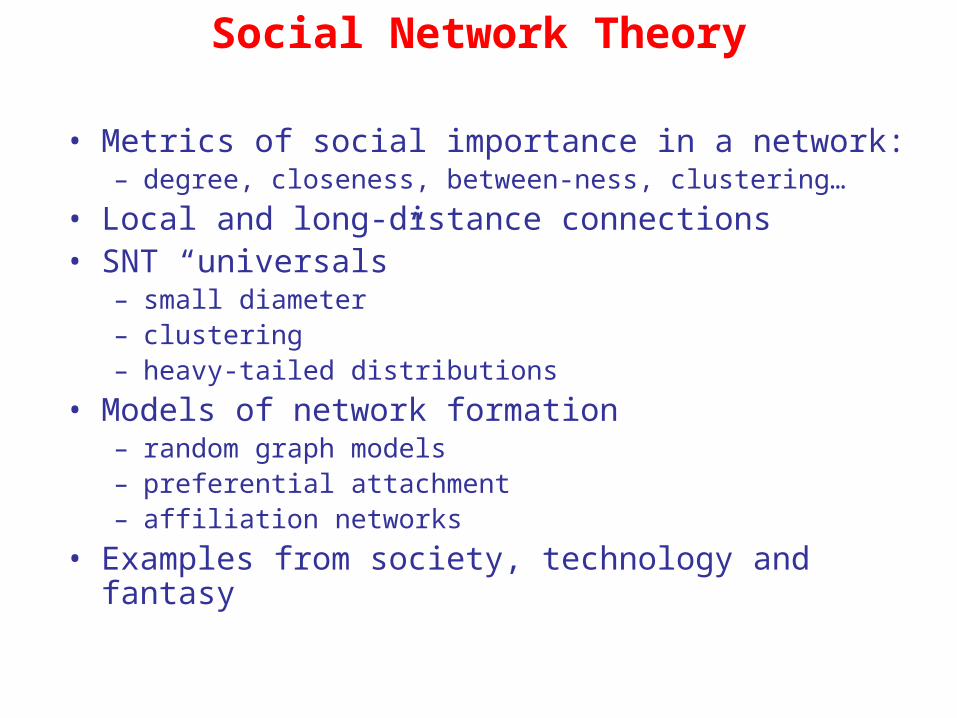
Social Network Theory
• Metrics of social importance in a network:– degree, closeness, between-ness, clustering…
• Local and long-distance connections• SNT “universals”
– small diameter– clustering– heavy-tailed distributions
• Models of network formation– random graph models– preferential attachment– affiliation networks
• Examples from society, technology and fantasy
Definition of Social Networks
• “A social network is a set of actors that may have relationships with one another. Networks can have few or many actors (nodes), and one or more kinds of relations (edges) between pairs of actors.” (Hannemann, 2001)
History (based on Freeman, 2000)
• 17th century: Spinoza developed first model
• 1937: J.L. Moreno introduced sociometry; he also invented the sociogram
• 1948: A. Bavelas founded the group networks laboratory at MIT; he also specified centrality
Social Networking
– Large number of sites available throughout the world
History (based on Freeman, 2000)
• 1949: A. Rapaport developed a probability based model of information flow
• 50s and 60s: Distinct research by individual researchers
• 70s: Field of social network analysis emerged.– New features in graph theory – more general
structural models– Better computer power – analysis of complex
relational data sets
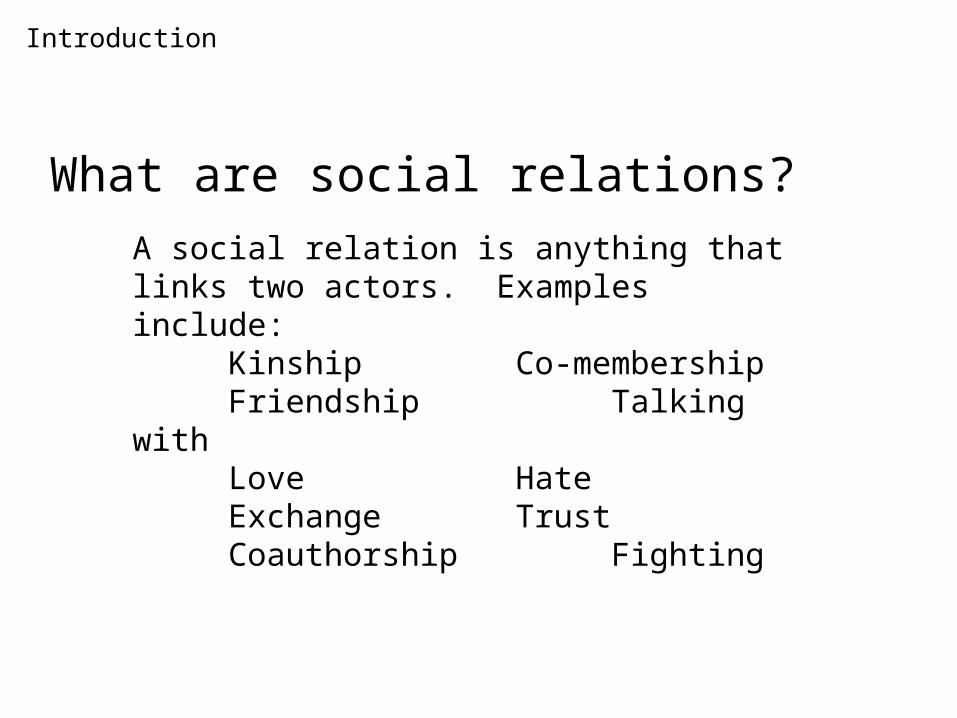
What are social relations?
A social relation is anything that links two actors. Examples include:
Kinship Co-membershipFriendship Talking withLove HateExchange TrustCoauthorship Fighting
Introduction
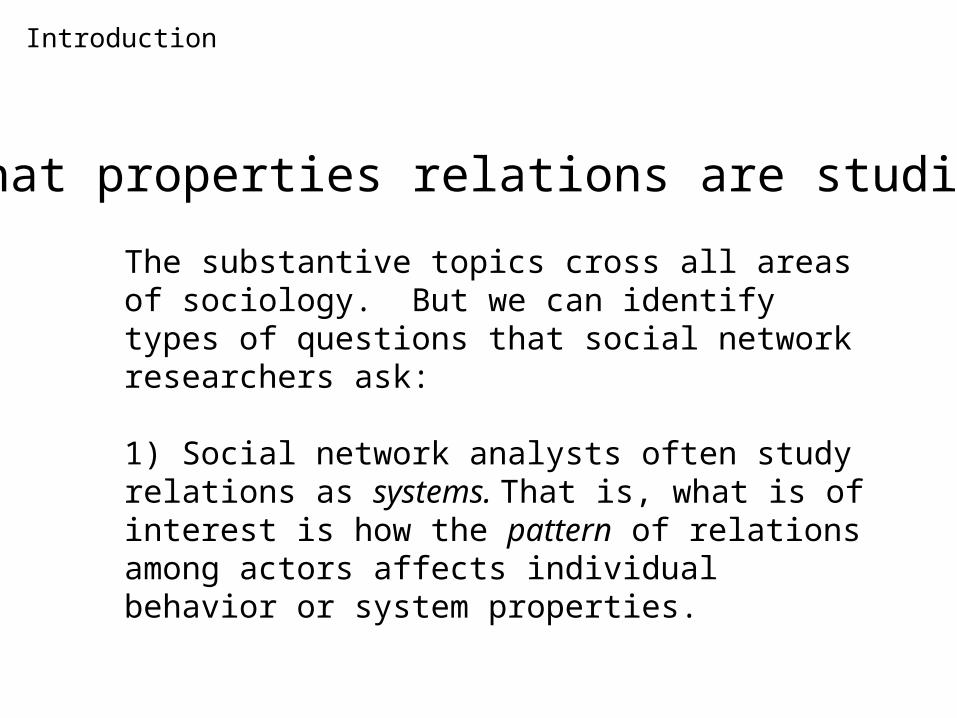
What properties relations are studied?
The substantive topics cross all areas of sociology. But we can identify types of questions that social network researchers ask:
1) Social network analysts often study relations as systems. That is, what is of interest is how the pattern of relations among actors affects individual behavior or system properties.
Introduction
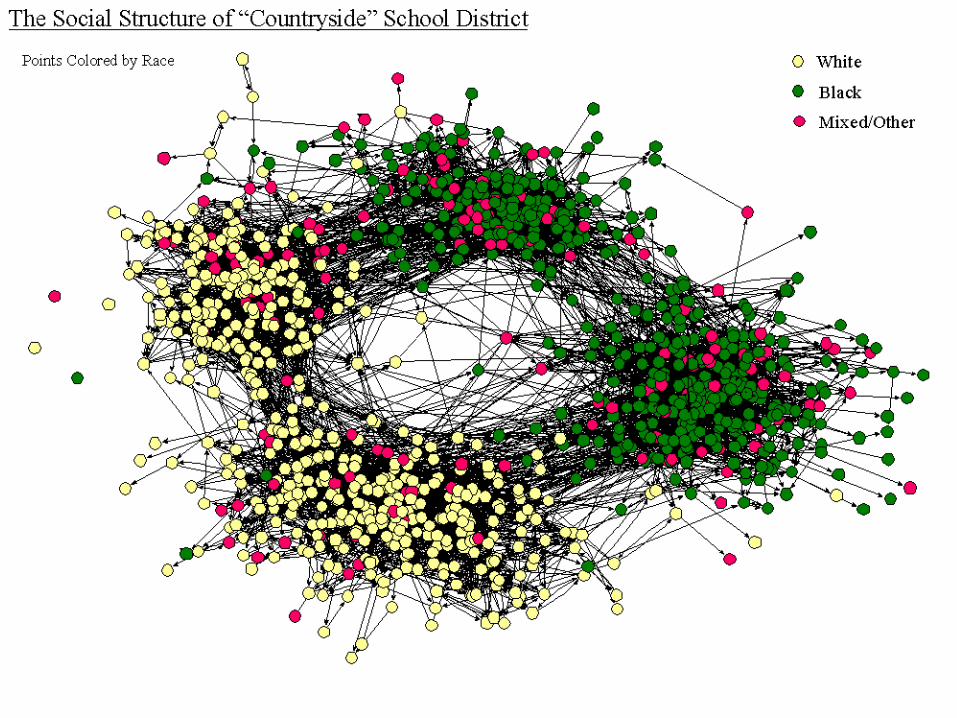
High Schools as Networks
Introduction
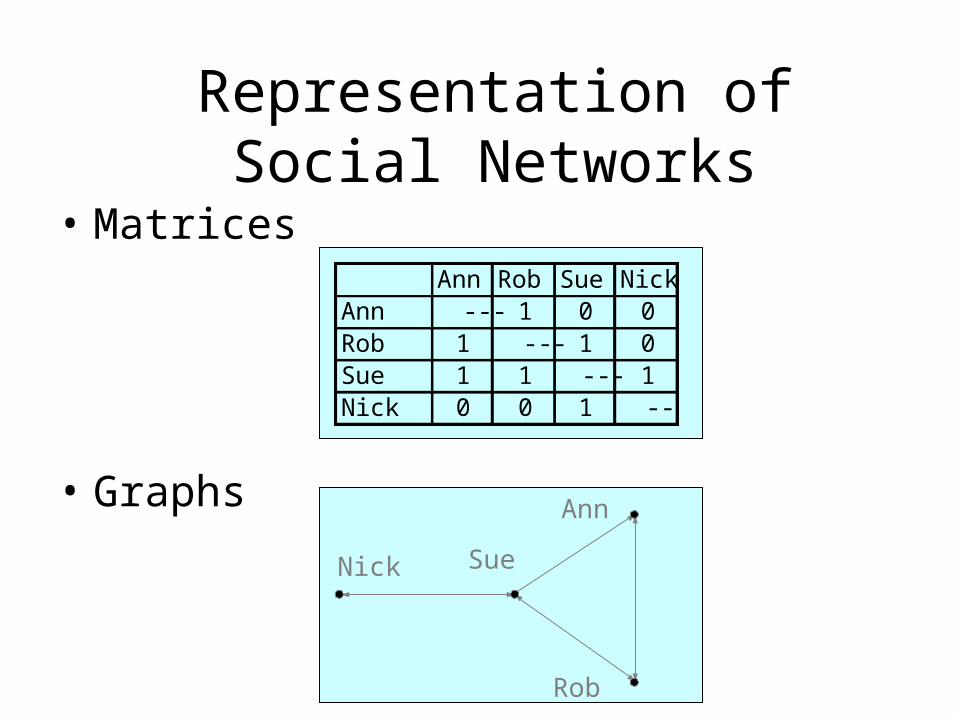
Representation of Social Networks
• Matrices
• Graphs
Nick
Ann
Rob
Sue
Ann Rob Sue NickAnn --- 1 0 0Rob 1 --- 1 0Sue 1 1 --- 1Nick 0 0 1 ---
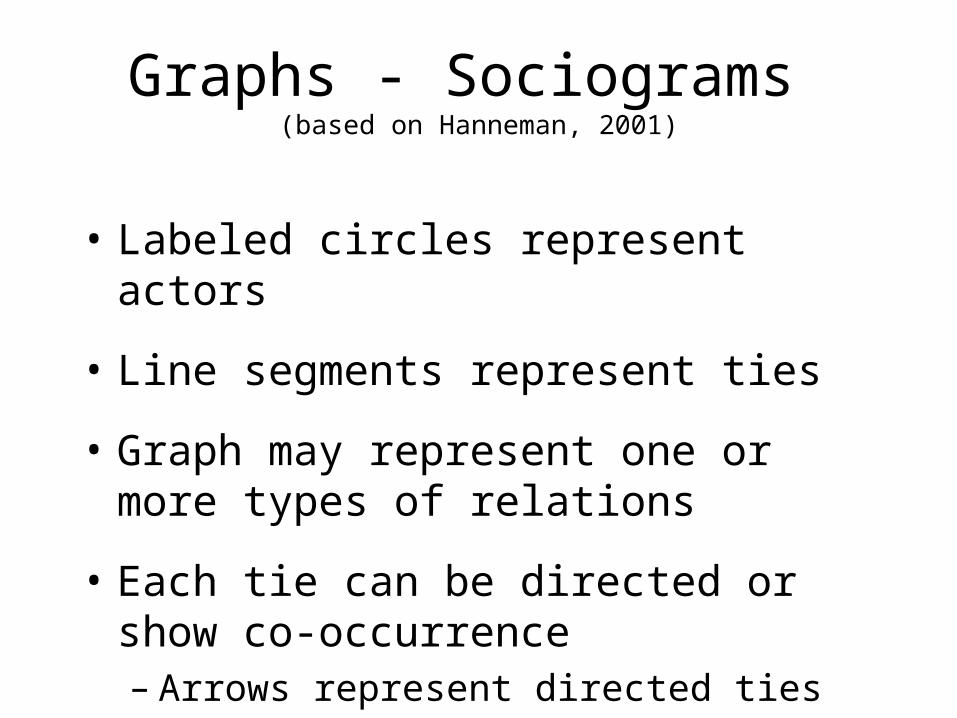
Graphs - Sociograms (based on Hanneman, 2001)
• Labeled circles represent actors
• Line segments represent ties
• Graph may represent one or more types of relations
• Each tie can be directed or show co-occurrence– Arrows represent directed ties
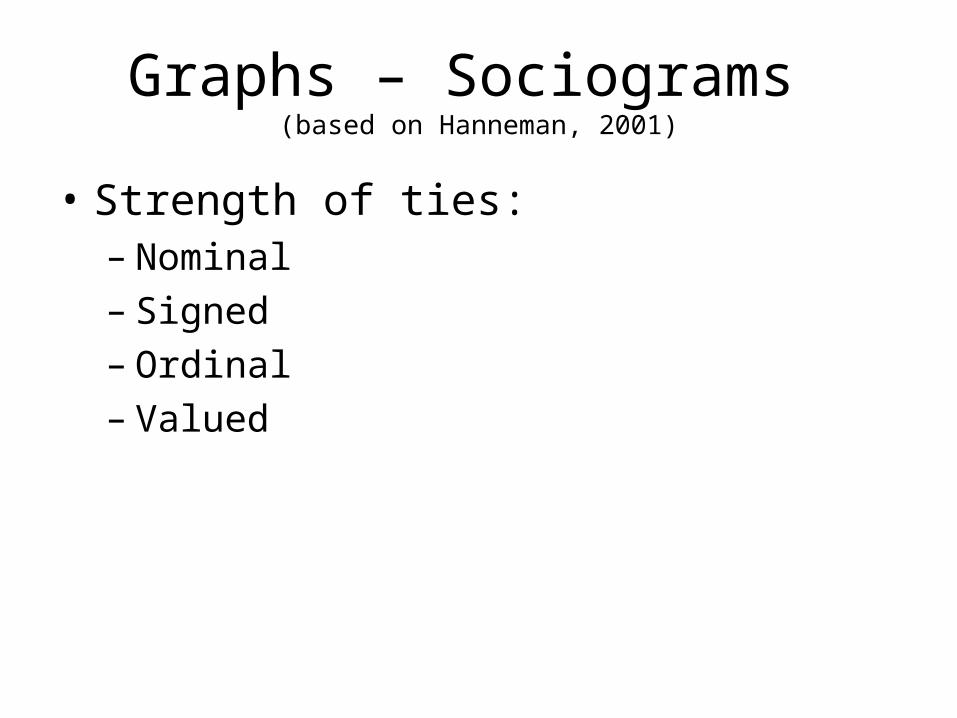
Graphs – Sociograms (based on Hanneman, 2001)
• Strength of ties:– Nominal– Signed – Ordinal – Valued
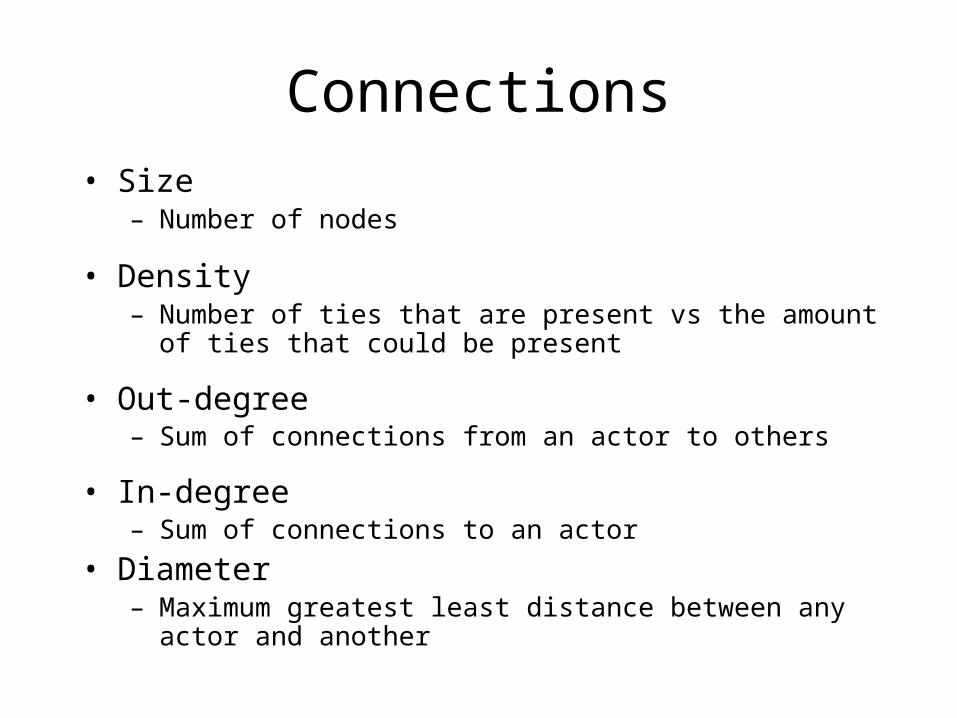
Connections• Size
– Number of nodes
• Density – Number of ties that are present vs the amount of ties that
could be present
• Out-degree – Sum of connections from an actor to others
• In-degree – Sum of connections to an actor
• Diameter– Maximum greatest least distance between any actor and
another
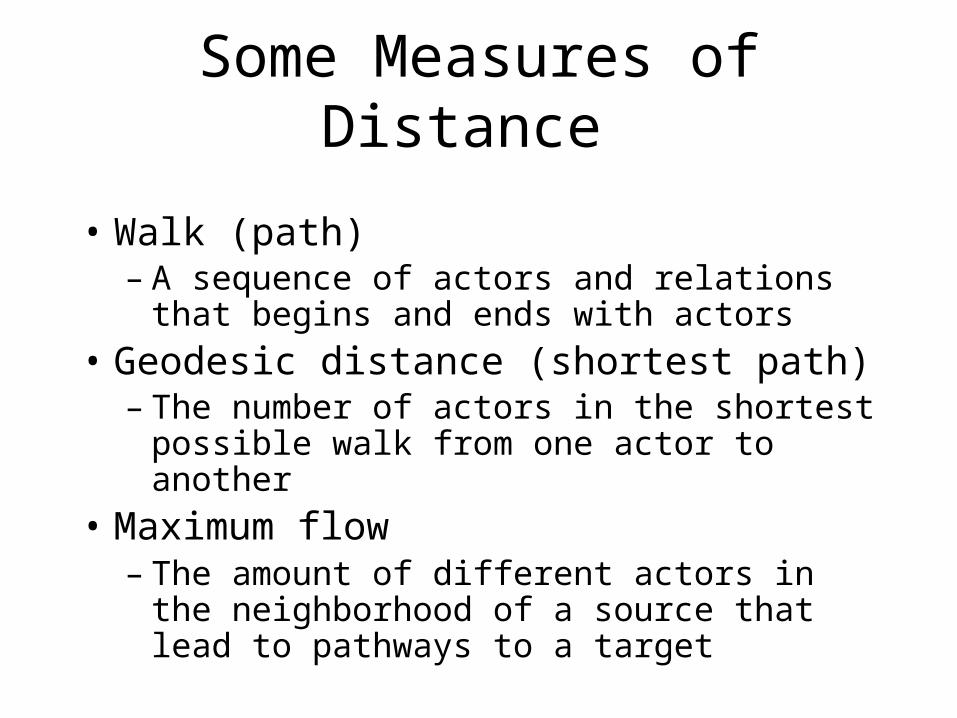
Some Measures of Distance
• Walk (path) – A sequence of actors and relations that
begins and ends with actors
• Geodesic distance (shortest path) – The number of actors in the shortest
possible walk from one actor to another
• Maximum flow – The amount of different actors in the
neighborhood of a source that lead to pathways to a target
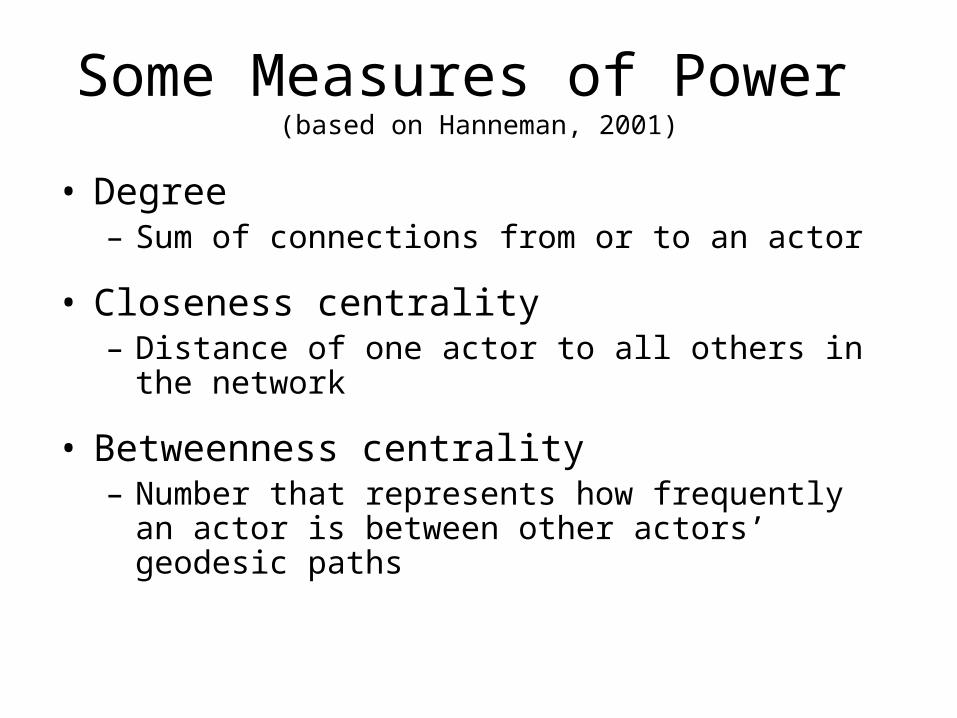
Some Measures of Power (based on Hanneman, 2001)
• Degree– Sum of connections from or to an actor
• Closeness centrality– Distance of one actor to all others in the network
• Betweenness centrality– Number that represents how frequently an actor is
between other actors’ geodesic paths
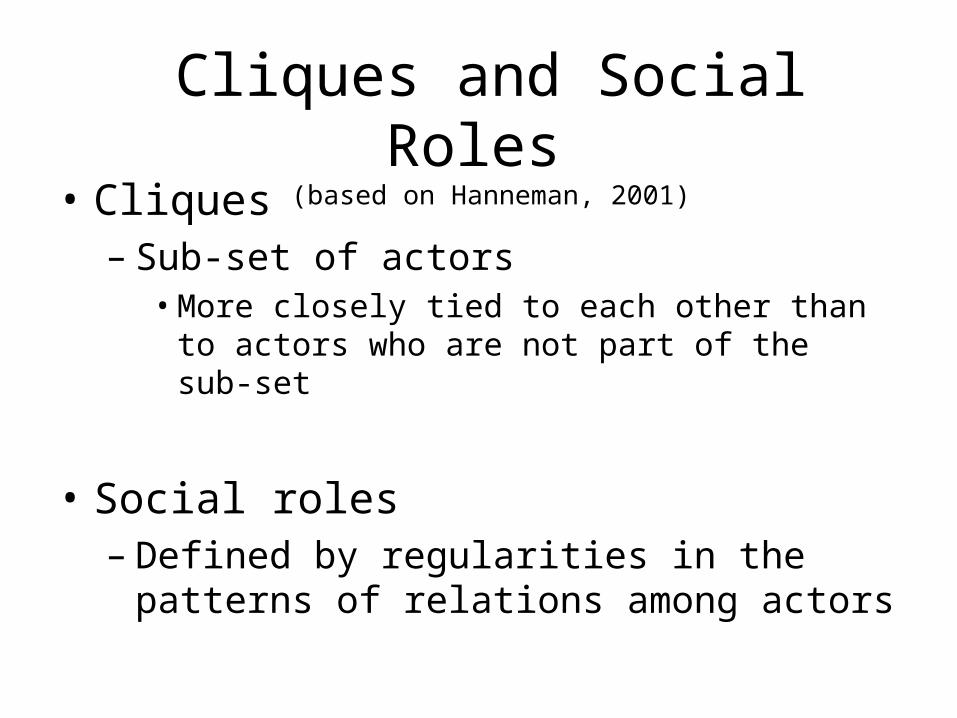
Cliques and Social Roles (based on Hanneman, 2001)
• Cliques – Sub-set of actors
• More closely tied to each other than to actors who are not part of the sub-set
• Social roles – Defined by regularities in the patterns of
relations among actors
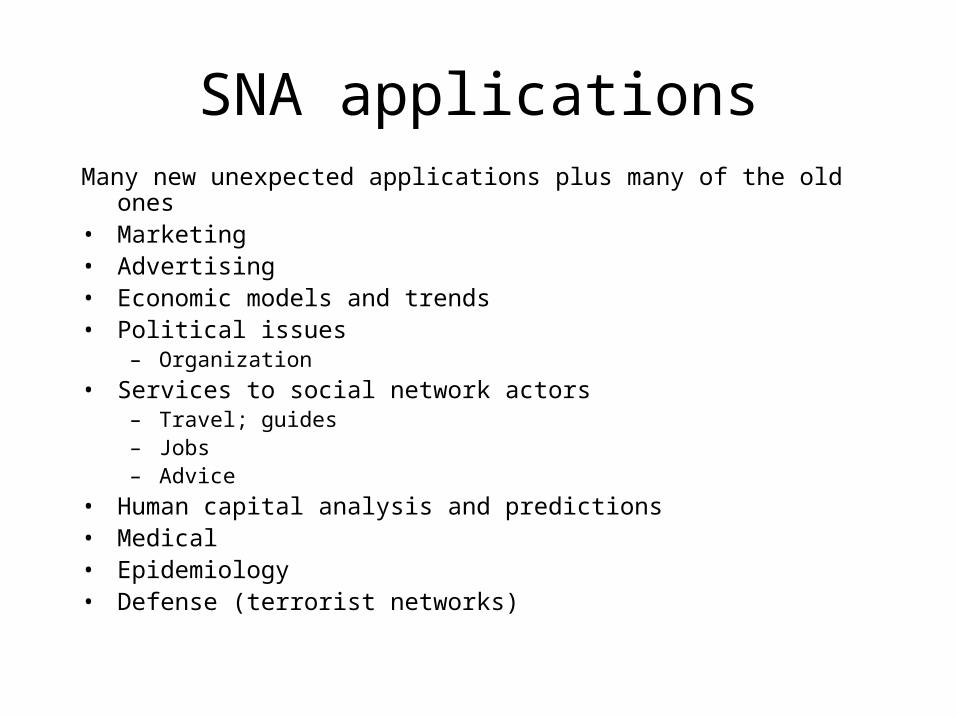
SNA applicationsMany new unexpected applications plus many of the old ones• Marketing• Advertising• Economic models and trends• Political issues
– Organization
• Services to social network actors– Travel; guides– Jobs– Advice
• Human capital analysis and predictions• Medical• Epidemiology• Defense (terrorist networks)
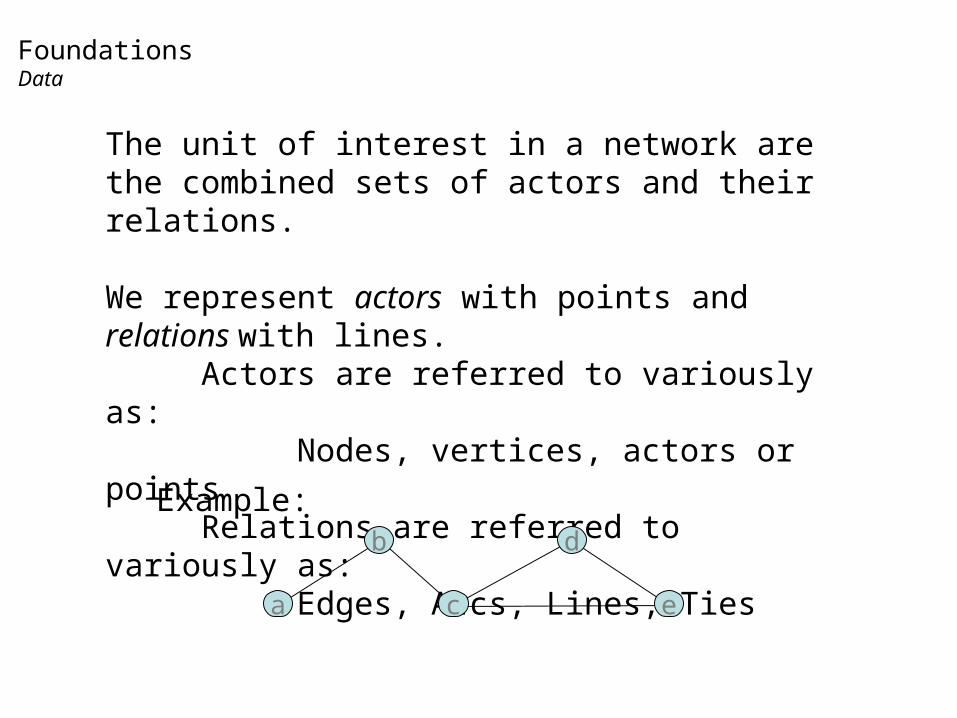
The unit of interest in a network are the combined sets of actors and their relations.
We represent actors with points and relations with lines. Actors are referred to variously as:
Nodes, vertices, actors or pointsRelations are referred to variously as:
Edges, Arcs, Lines, Ties
Example:
a
b
c e
d
FoundationsData
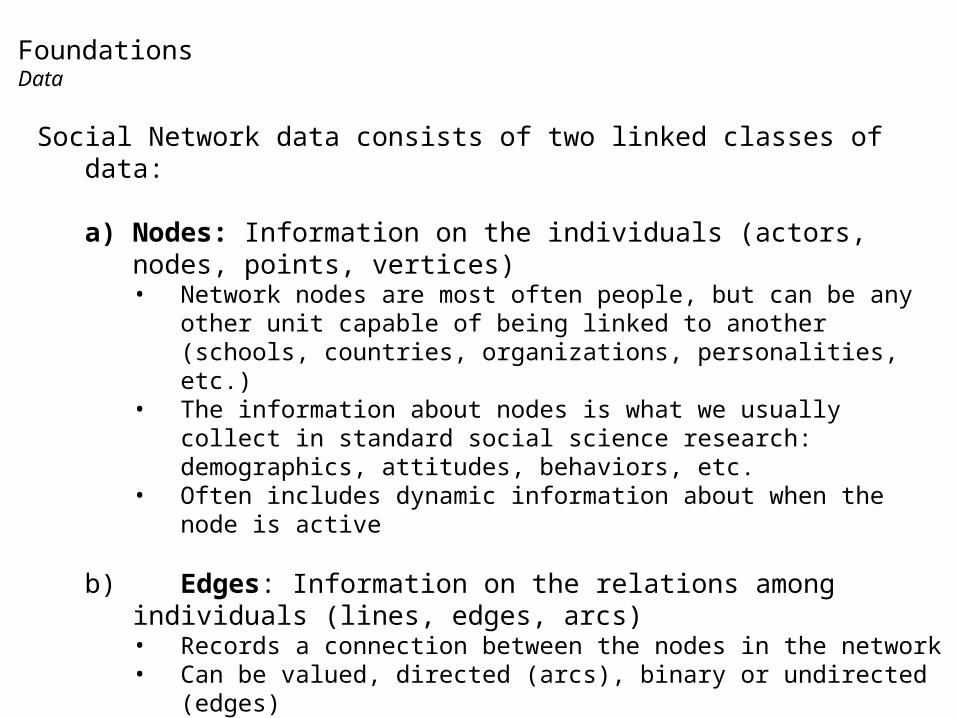
Social Network data consists of two linked classes of data:
a) Nodes: Information on the individuals (actors, nodes, points, vertices)• Network nodes are most often people, but can be any other unit capable of
being linked to another (schools, countries, organizations, personalities, etc.)• The information about nodes is what we usually collect in standard social
science research: demographics, attitudes, behaviors, etc.• Often includes dynamic information about when the node is active
b) Edges: Information on the relations among individuals (lines, edges, arcs)• Records a connection between the nodes in the network• Can be valued, directed (arcs), binary or undirected (edges)• One-mode (direct ties between actors) or two-mode (actors share membership
in an organization)• Includes the times when the relation is active
Graph theory notation: G(V,E)
FoundationsData
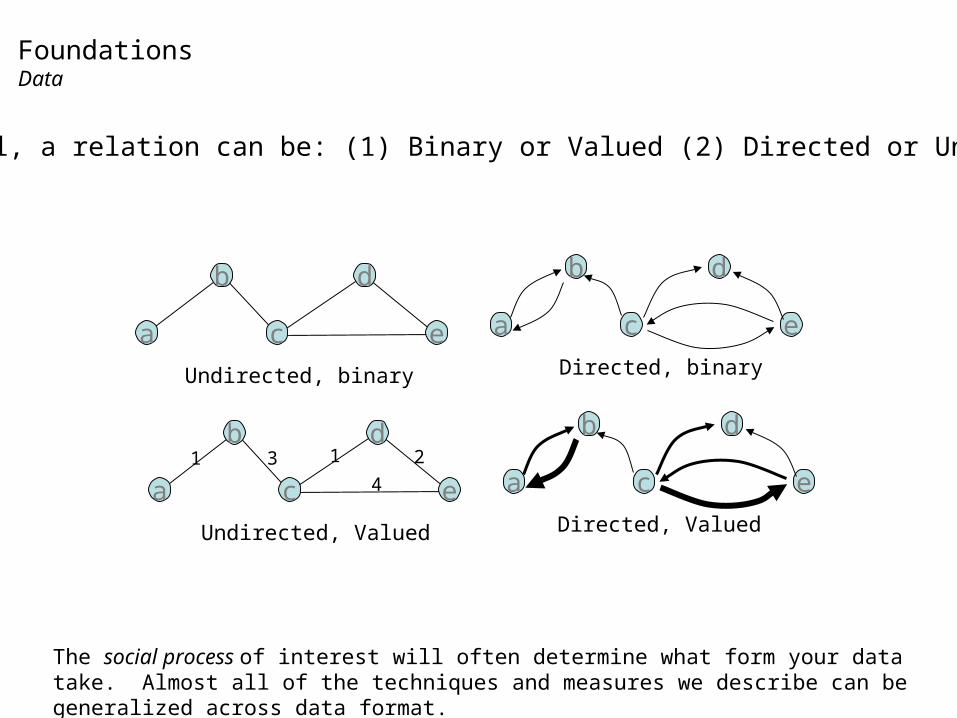
In general, a relation can be: (1) Binary or Valued (2) Directed or Undirected
a
b
c e
d
Undirected, binary Directed, binary
a
b
c e
d
a
b
c e
d
Undirected, Valued Directed, Valued
a
b
c e
d1 3
4
21
The social process of interest will often determine what form your data take. Almost all of the techniques and measures we describe can be generalized across data format.
FoundationsData
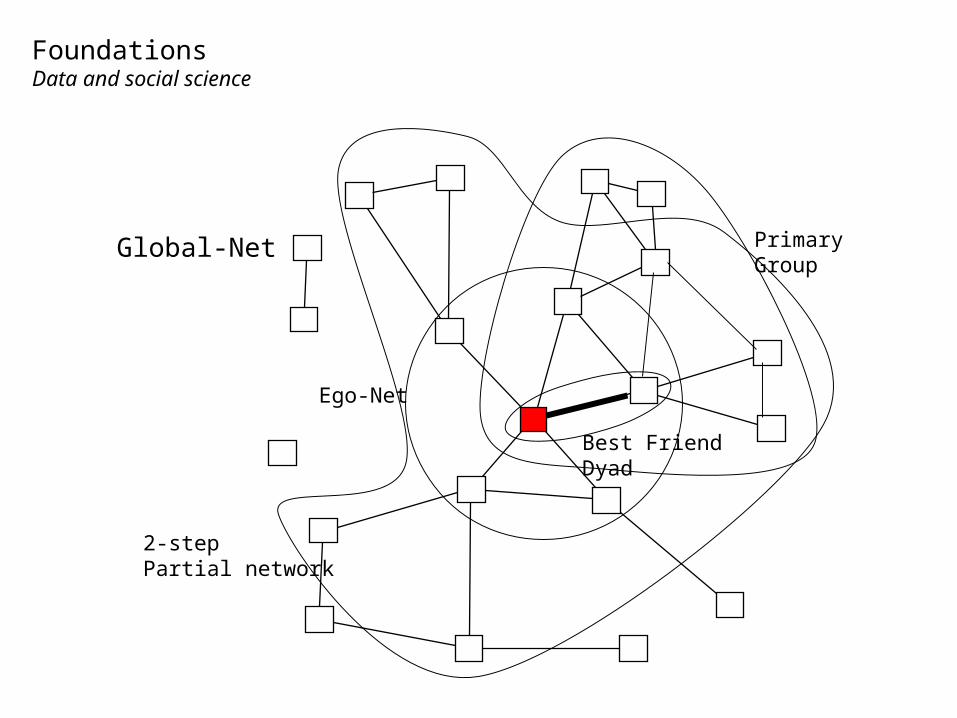
Ego-Net
Global-Net
Best FriendDyad
PrimaryGroup
2-stepPartial network
FoundationsData and social science
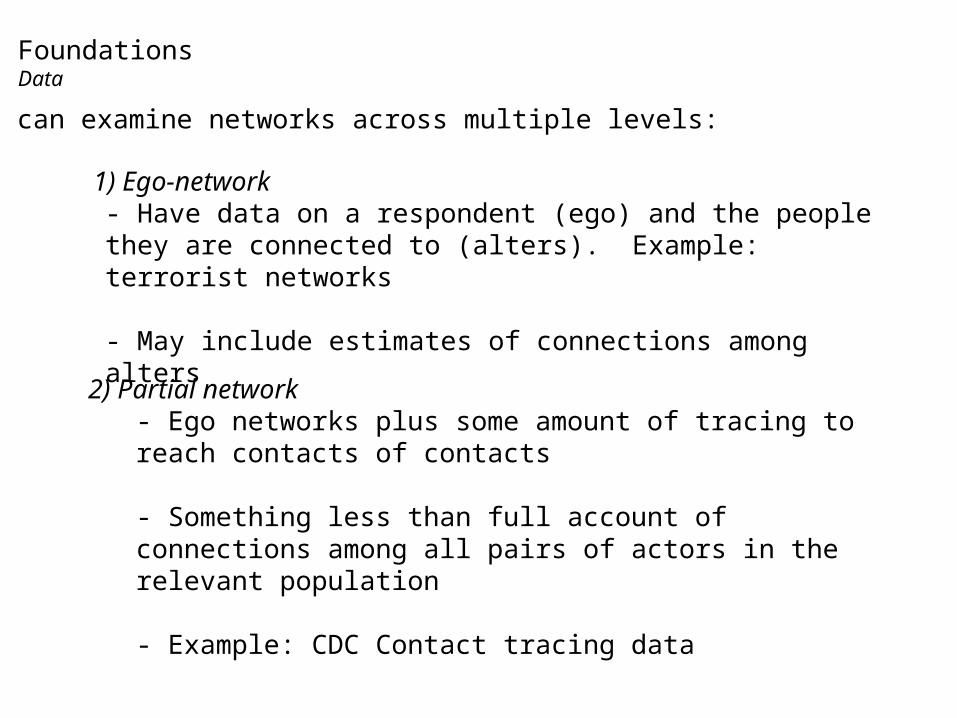
We can examine networks across multiple levels:
1) Ego-network - Have data on a respondent (ego) and the people they are connected to (alters). Example: terrorist networks
- May include estimates of connections among alters
2) Partial network- Ego networks plus some amount of tracing to reach contacts of contacts
- Something less than full account of connections among all pairs of actors in the relevant population
- Example: CDC Contact tracing data
FoundationsData
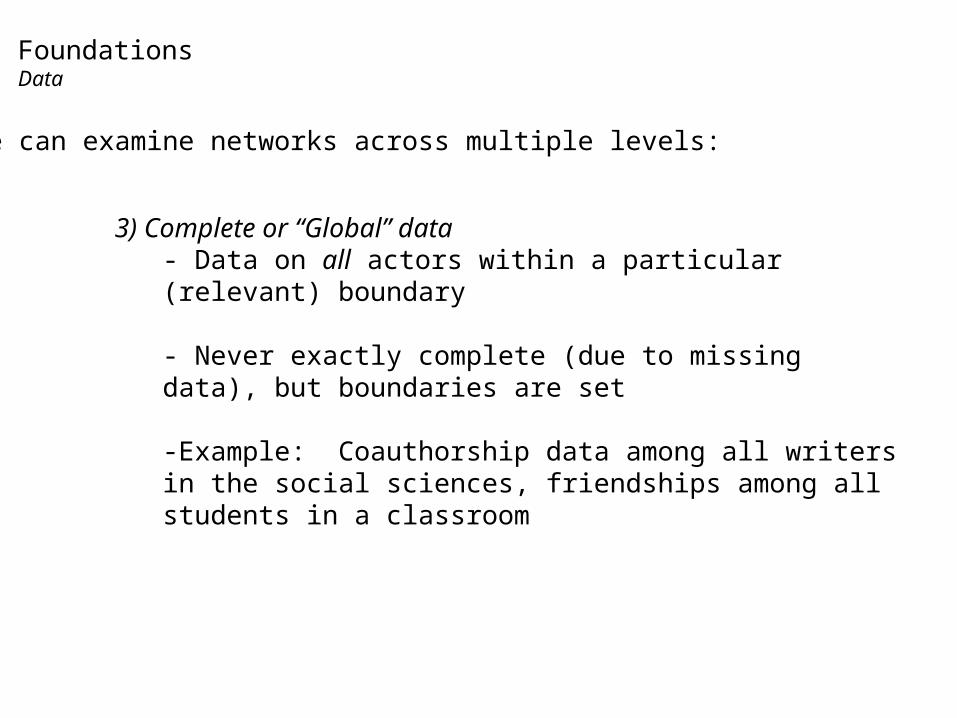
3) Complete or “Global” data- Data on all actors within a particular (relevant) boundary
- Never exactly complete (due to missing data), but boundaries are set
-Example: Coauthorship data among all writers in the social sciences, friendships among all students in a classroom
We can examine networks across multiple levels:
FoundationsData
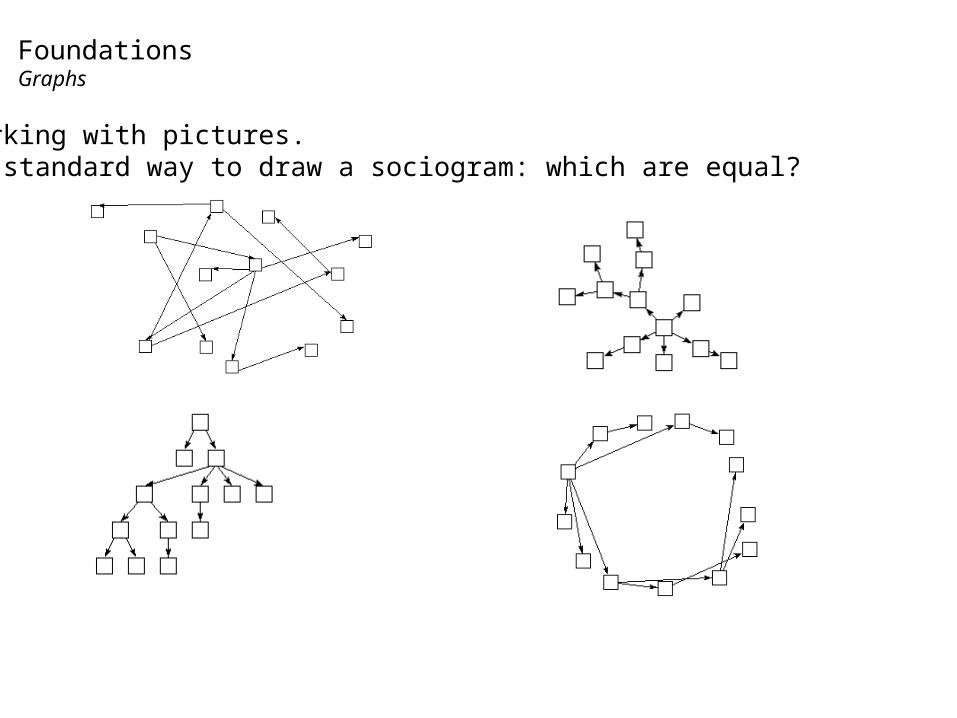
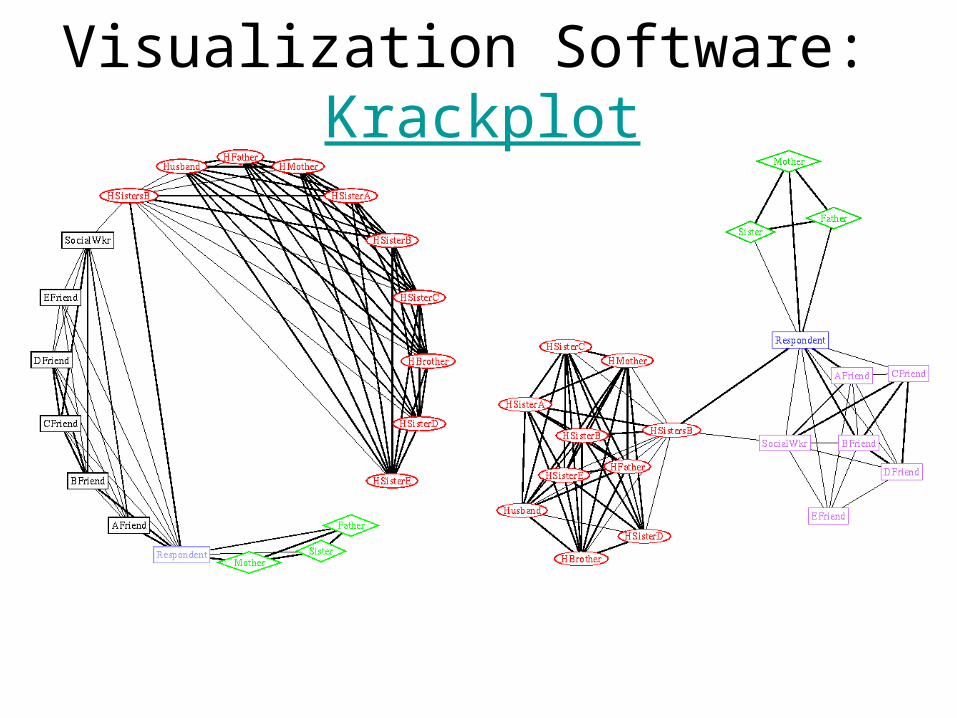
Working with pictures.No standard way to draw a sociogram: which are equal?
FoundationsGraphs
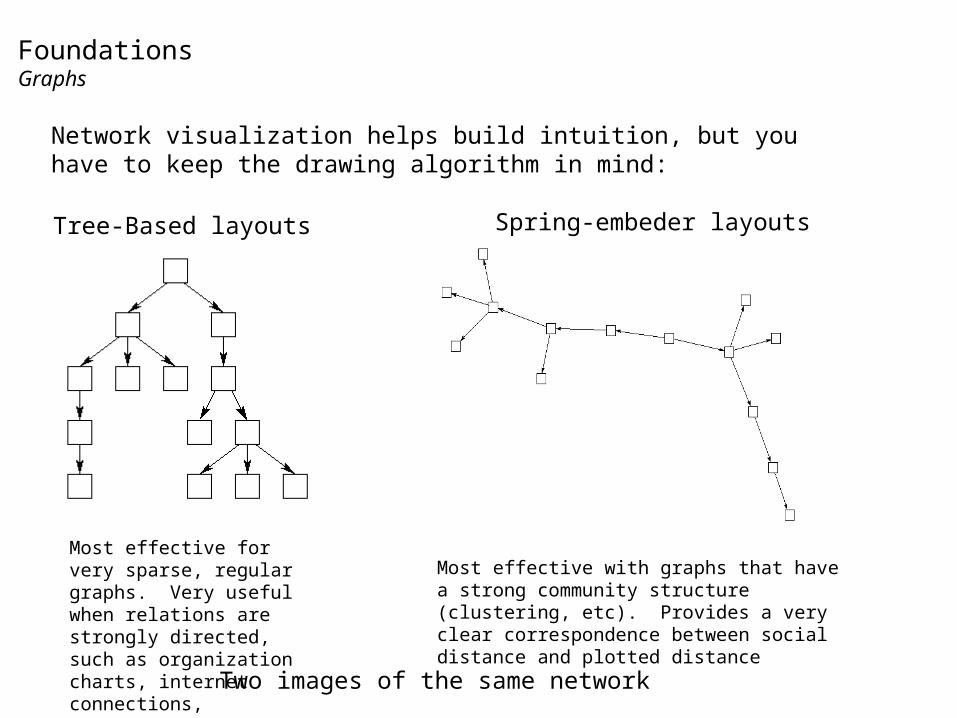
Network visualization helps build intuition, but you have to keep the drawing algorithm in mind:
Tree-Based layouts
Most effective for very sparse, regular graphs. Very useful when relations are strongly directed, such as organization charts, internet connections,
Spring-embeder layouts
Most effective with graphs that have a strong community structure (clustering, etc). Provides a very clear correspondence between social distance and plotted distance
Two images of the same network
FoundationsGraphs
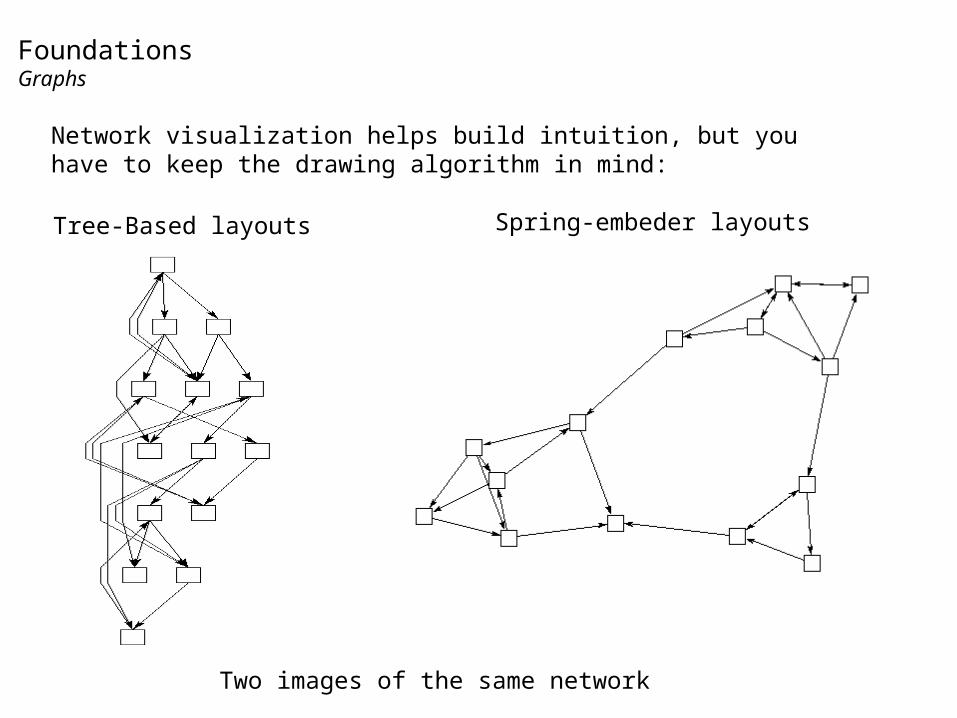
Network visualization helps build intuition, but you have to keep the drawing algorithm in mind:
Tree-Based layouts Spring-embeder layouts
Two images of the same network
FoundationsGraphs
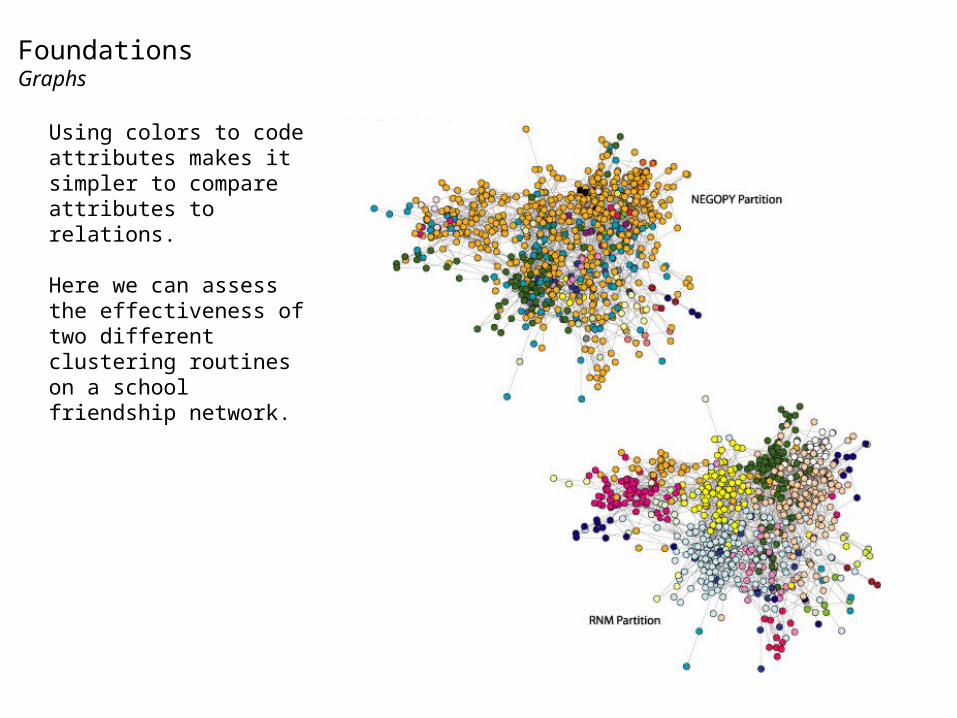
Using colors to code attributes makes it simpler to compare attributes to relations.
Here we can assess the effectiveness of two different clustering routines on a school friendship network.
FoundationsGraphs
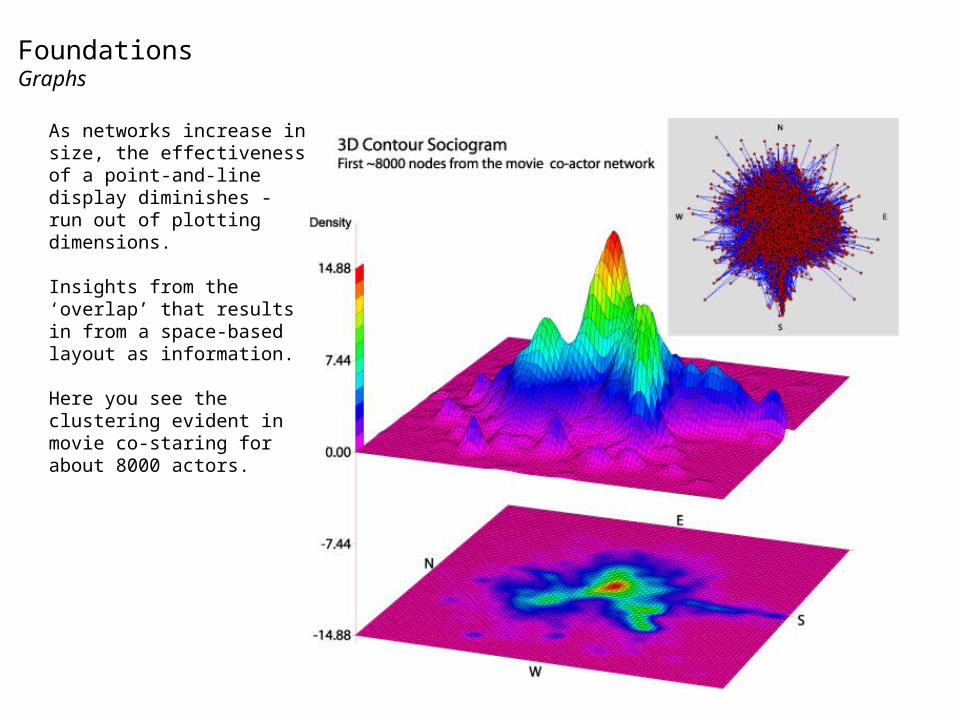
As networks increase in size, the effectiveness of a point-and-line display diminishes - run out of plotting dimensions.
Insights from the ‘overlap’ that results in from a space-based layout as information.
Here you see the clustering evident in movie co-staring for about 8000 actors.
FoundationsGraphs

This figure contains over 29,000 social science authors. The two dense regions reflect different topics.
FoundationsGraphs
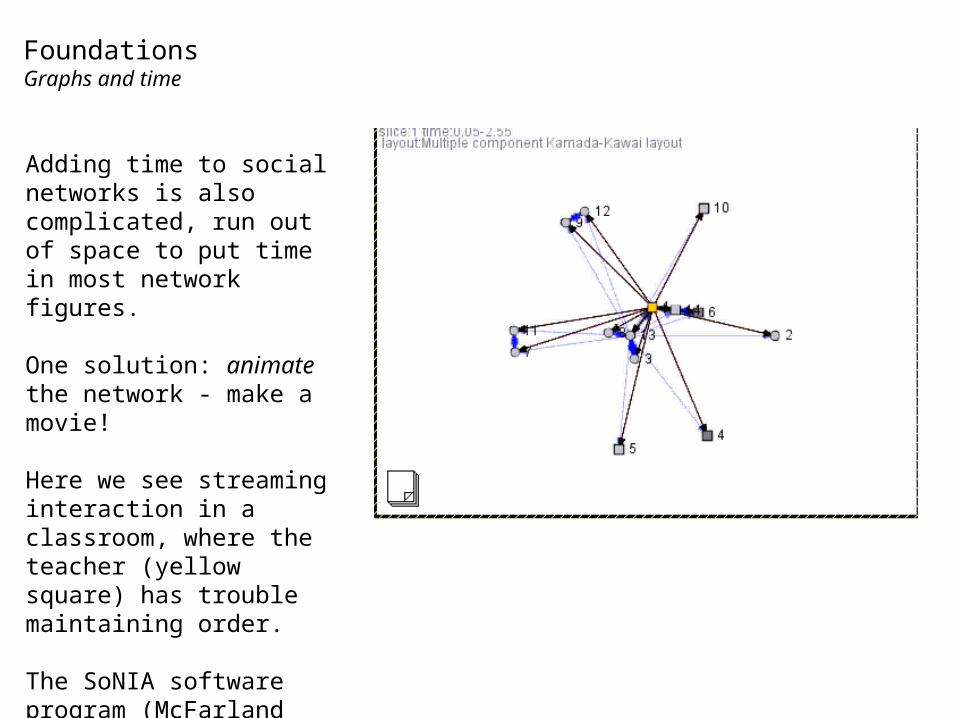
Adding time to social networks is also complicated, run out of space to put time in most network figures.
One solution: animate the network - make a movie!
Here we see streaming interaction in a classroom, where the teacher (yellow square) has trouble maintaining order.
The SoNIA software program (McFarland and Bender-deMoll)
FoundationsGraphs and time
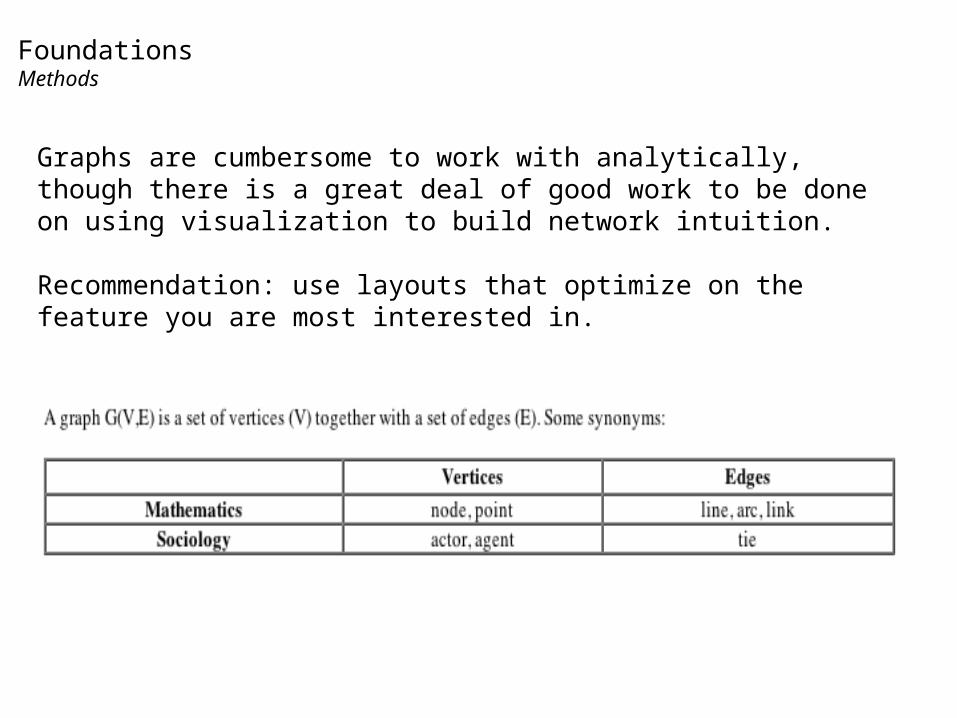
Graphs are cumbersome to work with analytically, though there is a great deal of good work to be done on using visualization to build network intuition.
Recommendation: use layouts that optimize on the feature you are most interested in.
FoundationsMethods
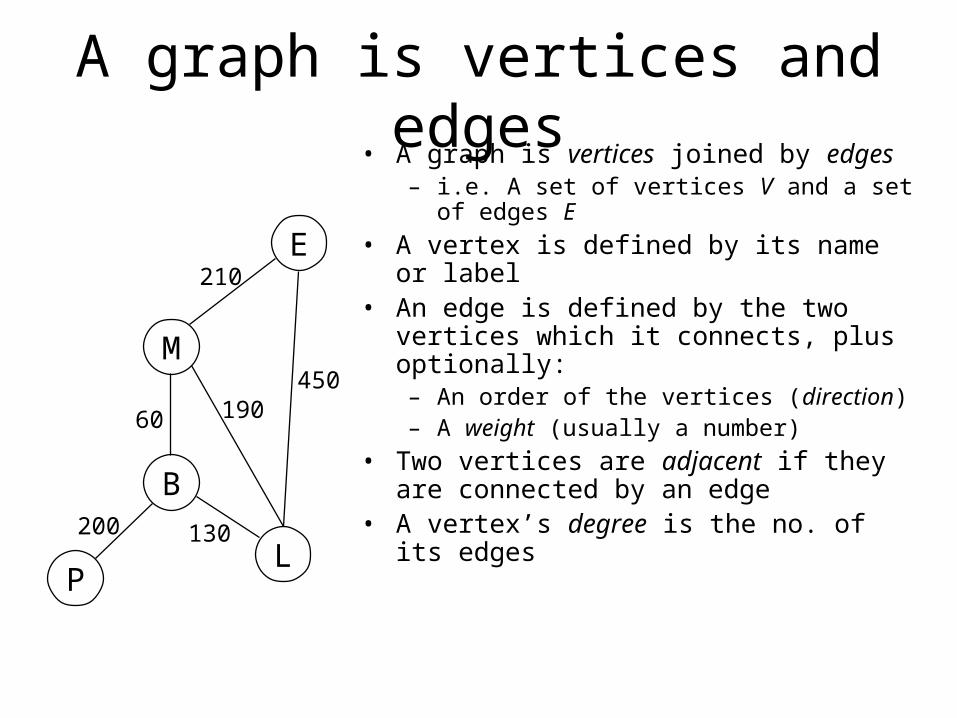
A graph is vertices and edges• A graph is vertices joined by edges
– i.e. A set of vertices V and a set of edges E
• A vertex is defined by its name or label• An edge is defined by the two vertices which
it connects, plus optionally:– An order of the vertices (direction)– A weight (usually a number)
• Two vertices are adjacent if they are connected by an edge
• A vertex’s degree is the no. of its edges
E
L
B
M
P
200
60
130
190450
210
Directed graph (digraph)
E
L
B
M
P
200
60
130
190450
210
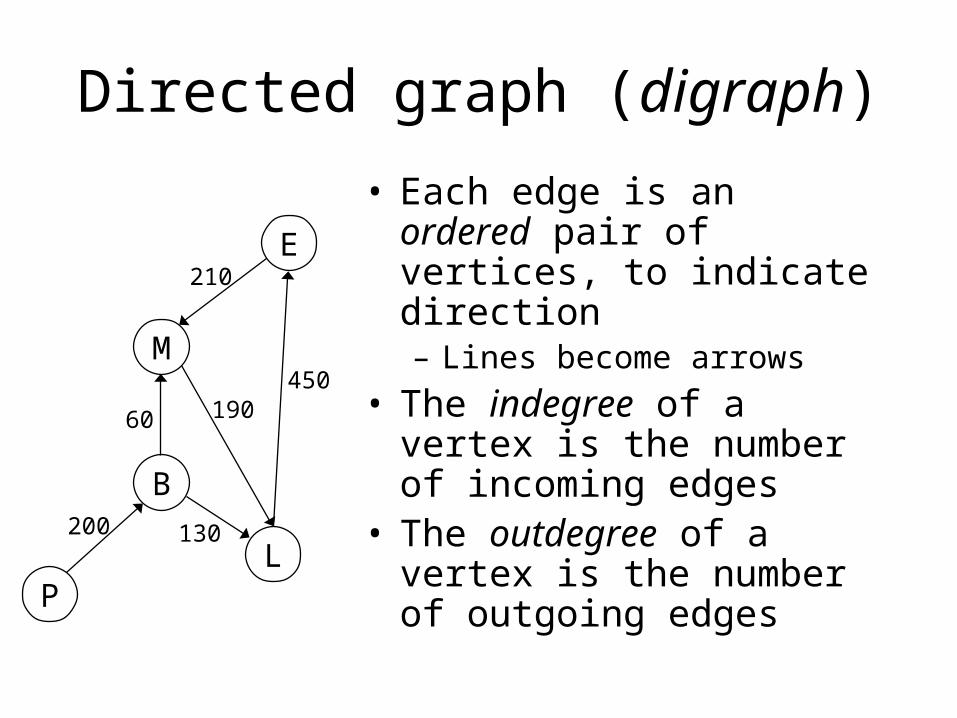
• Each edge is an ordered pair of vertices, to indicate direction– Lines become arrows
• The indegree of a vertex is the number of incoming edges
• The outdegree of a vertex is the number of outgoing edges
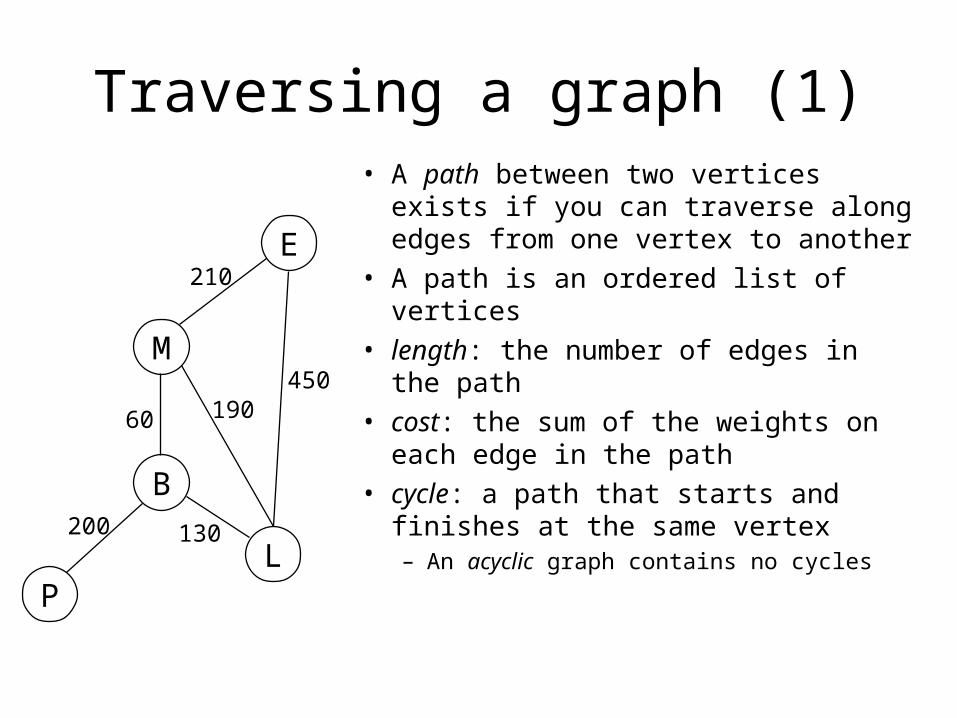
Traversing a graph (1)• A path between two vertices exists if
you can traverse along edges from one vertex to another
• A path is an ordered list of vertices
• length: the number of edges in the path
• cost: the sum of the weights on each edge in the path
• cycle: a path that starts and finishes at the same vertex– An acyclic graph contains no cycles
E
L
B
M
P
200
60
130
190450
210
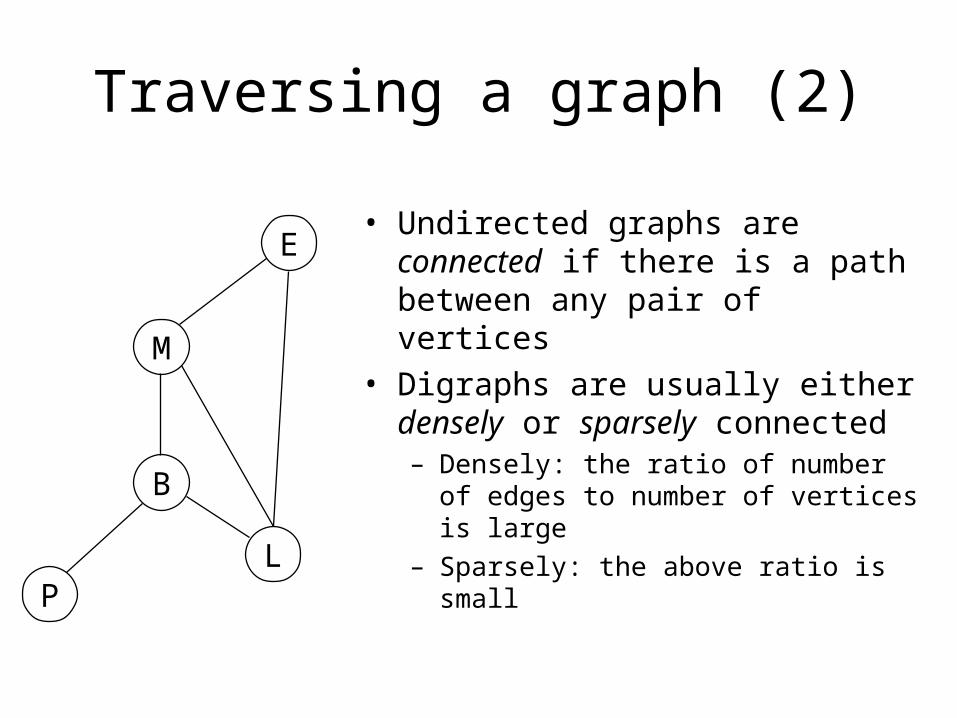
Traversing a graph (2)
• Undirected graphs are connected if there is a path between any pair of vertices
• Digraphs are usually either densely or sparsely connected– Densely: the ratio of number of edges to
number of vertices is large– Sparsely: the above ratio is small
E
L
B
M
P
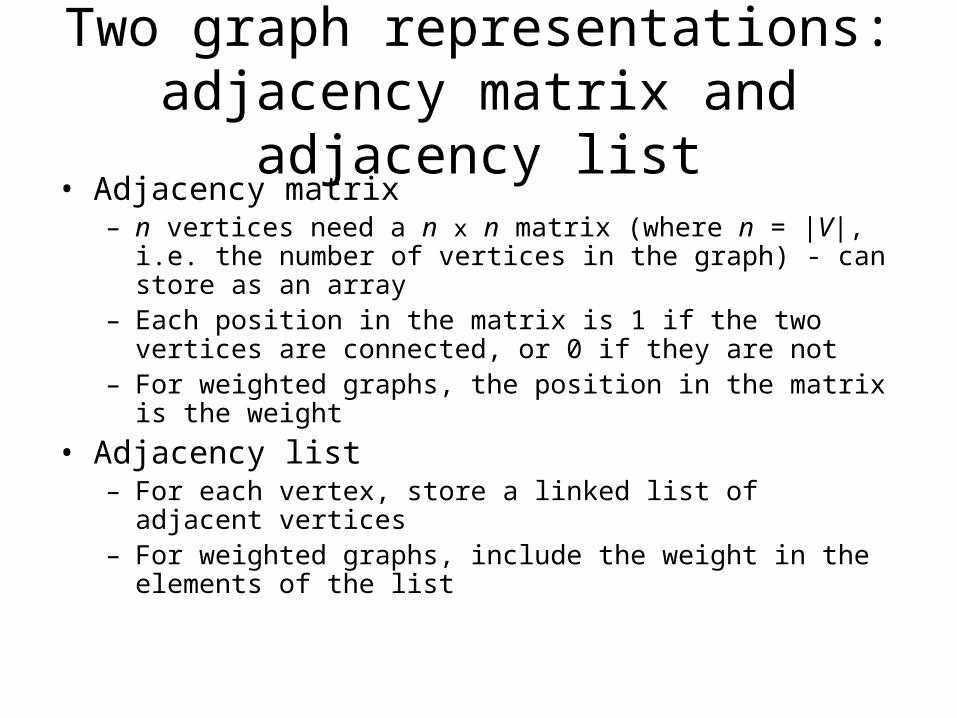
Two graph representations:adjacency matrix and adjacency list• Adjacency matrix
– n vertices need a n x n matrix (where n = |V|, i.e. the number of vertices in the graph) - can store as an array
– Each position in the matrix is 1 if the two vertices are connected, or 0 if they are not
– For weighted graphs, the position in the matrix is the weight
• Adjacency list– For each vertex, store a linked list of adjacent vertices– For weighted graphs, include the weight in the elements of the
list
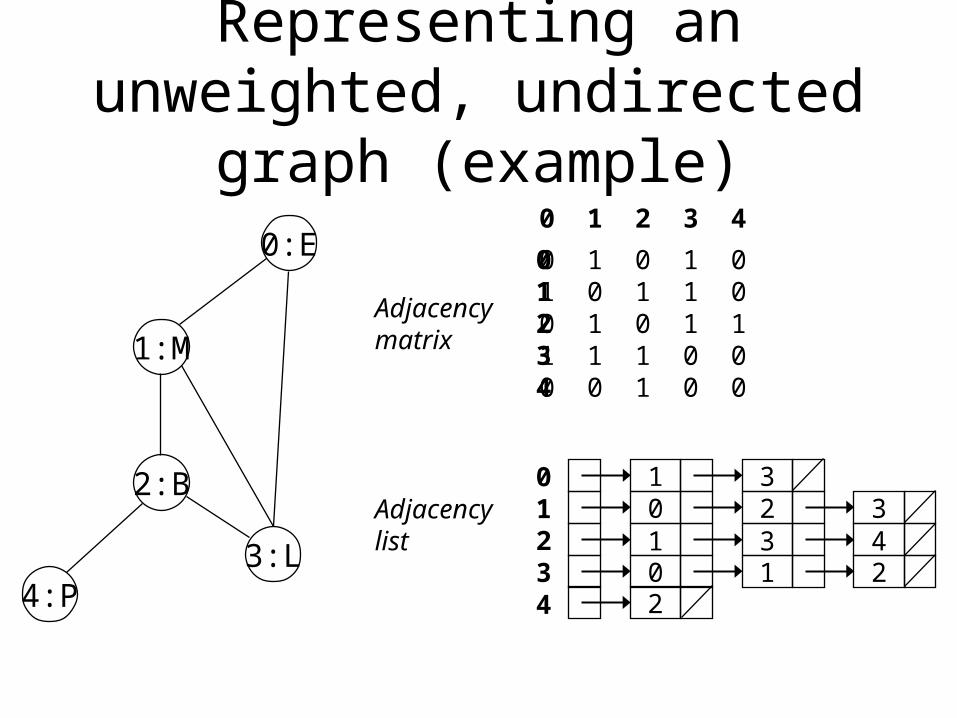
Representing an unweighted, undirected graph (example)
0 1 2 3 4
01234
0 1 0 1 01 0 1 1 00 1 0 1 11 1 1 0 00 0 1 0 0
Adjacencymatrix
1 30 2 31 3 40 1 22
01234
Adjacencylist
0:E
3:L
2:B
1:M
4:P
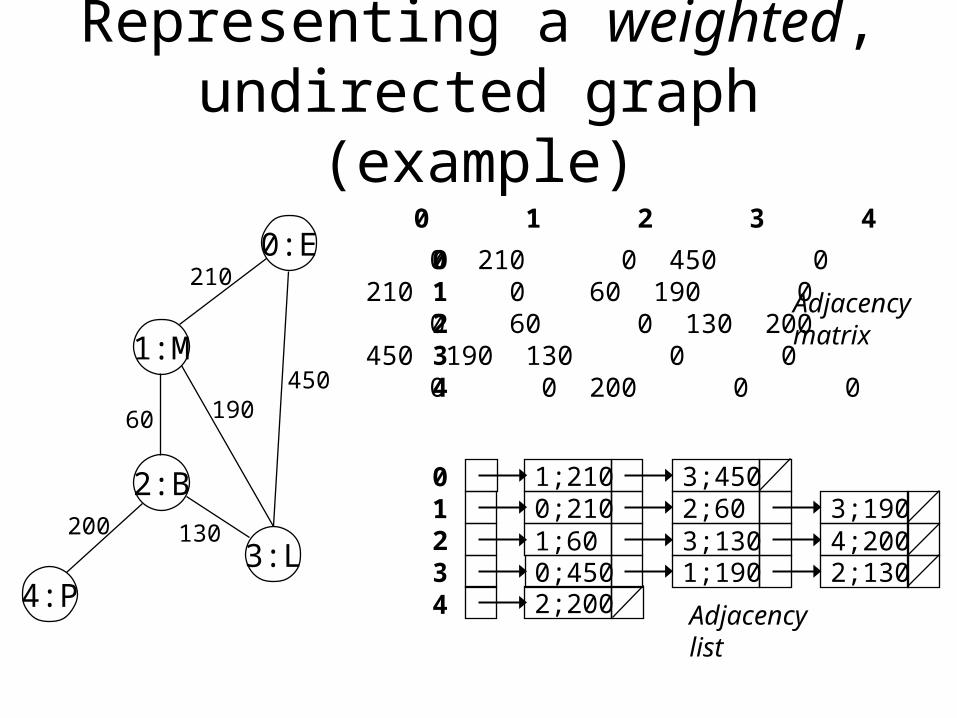
Representing a weighted, undirected graph (example)
0:E
3:L
2:B
1:M
4:P
200
60
130
190450
210
0 1 2 3 4
01234
0 210 0 450 0210 0 60 190 0 0 60 0 130 200450 190 130 0 0 0 0 200 0 0
Adjacencymatrix
3;4502;60 3;1903;130 4;2001;190 2;130
1;2100;2101;600;4502;200
01234 Adjacency
list
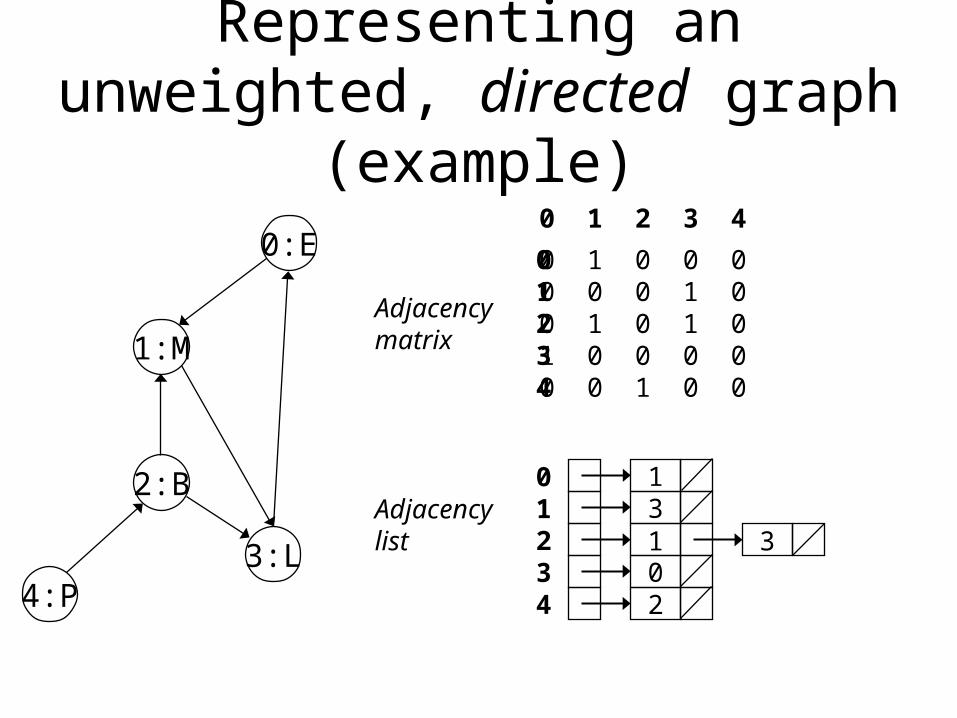
Representing an unweighted, directed graph (example)
0 1 2 3 4
01234
0 1 0 0 00 0 0 1 00 1 0 1 01 0 0 0 00 0 1 0 0
Adjacencymatrix
131 302
01234
Adjacencylist
0:E
3:L
2:B
1:M
4:P
Comparing the two representations
• Space complexity– Adjacency matrix is O(|V|2)– Adjacency list is O(|V| + |E|)
• |E| is the number of edges in the graph
• Static versus dynamic representation– An adjacency matrix is a static representation: the graph is built
‘in one go’, and is difficult to alter once built– An adjacency list is a dynamic representation: the graph is built
incrementally, thus is more easily altered during run-time
Algorithms involving graphs
• Graph traversal• Shortest path algorithms
– In an unweighted graph: shortest length between two vertices
– In a weighted graph: smallest cost between two vertices
• Minimum Spanning Trees– Using a tree to connect all the vertices at
lowest total cost
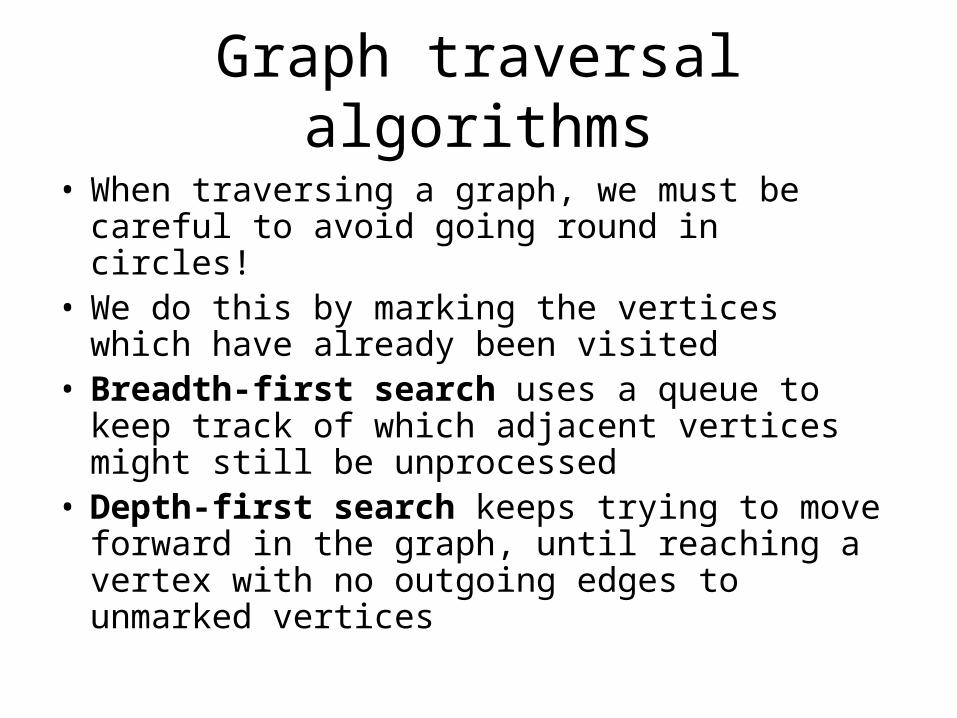
Graph traversal algorithms
• When traversing a graph, we must be careful to avoid going round in circles!
• We do this by marking the vertices which have already been visited
• Breadth-first search uses a queue to keep track of which adjacent vertices might still be unprocessed
• Depth-first search keeps trying to move forward in the graph, until reaching a vertex with no outgoing edges to unmarked vertices
Shortest path (unweighted)
• The problem: Find the shortest path from a vertex v to every other vertex in a graph
• The unweighted path measures the number of edges, ignoring the edge’s weights (if any)
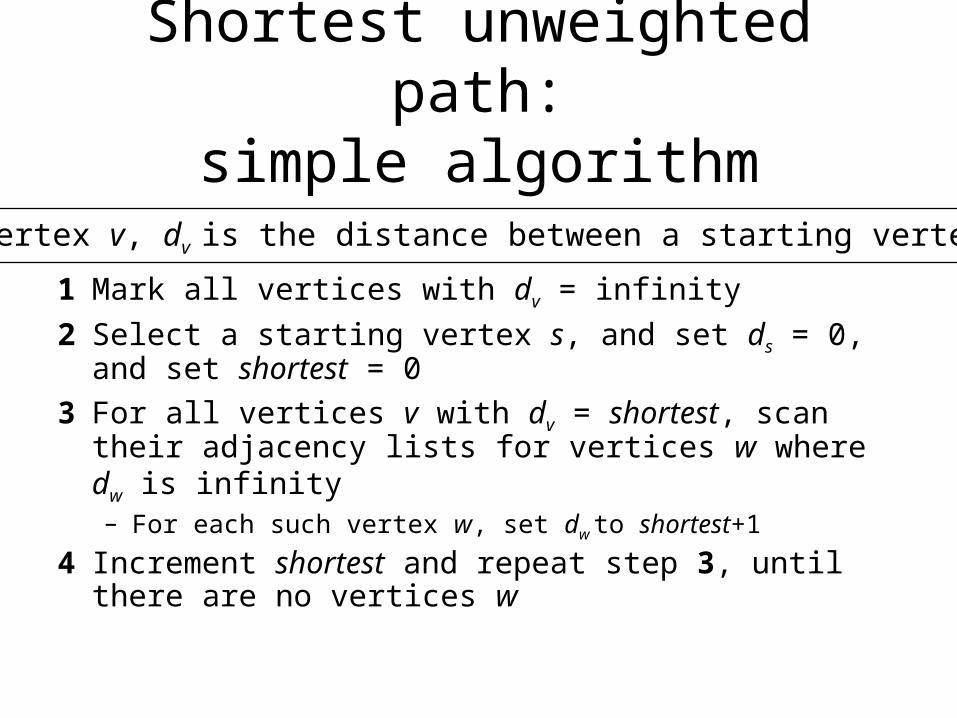
Shortest unweighted path:simple algorithm
1 Mark all vertices with dv = infinity
2 Select a starting vertex s, and set ds = 0, and set shortest = 0
3 For all vertices v with dv = shortest, scan their adjacency lists for vertices w where dw is infinity– For each such vertex w, set dw to shortest+1
4 Increment shortest and repeat step 3, until there are no vertices w
For a vertex v, dv is the distance between a starting vertex and v
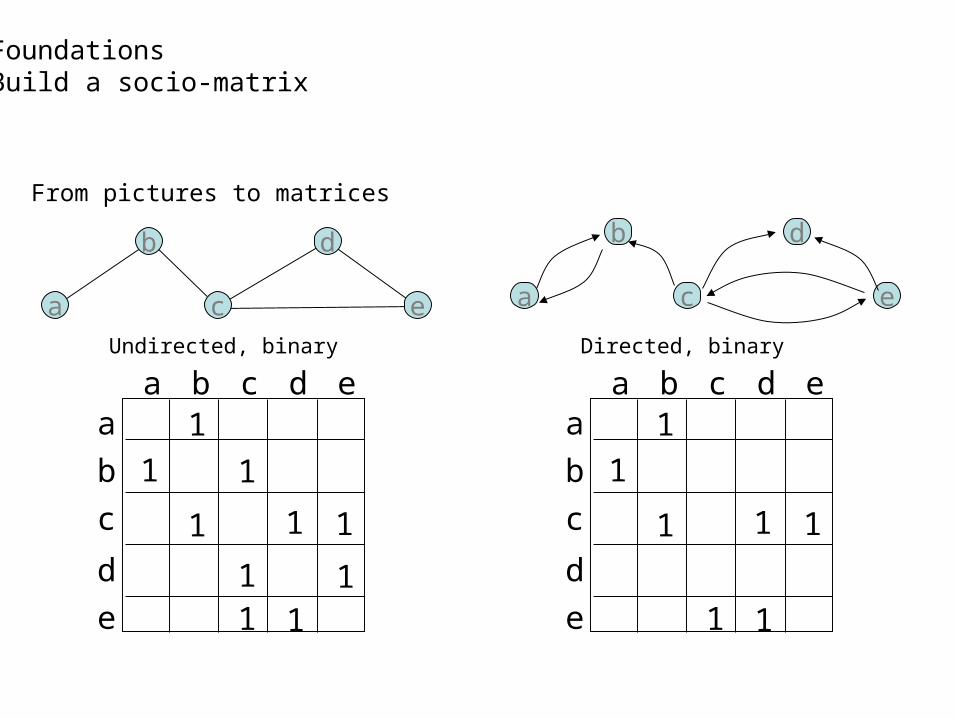
From pictures to matrices
a
b
c e
d
Undirected, binary Directed, binary
a
b
c e
d
a b c d ea
b
c
d
e
1
1
1 1 1
1 1
a b c d ea
b
c
d
e
1
1 1
1 1 1
1 11 1
FoundationsBuild a socio-matrix
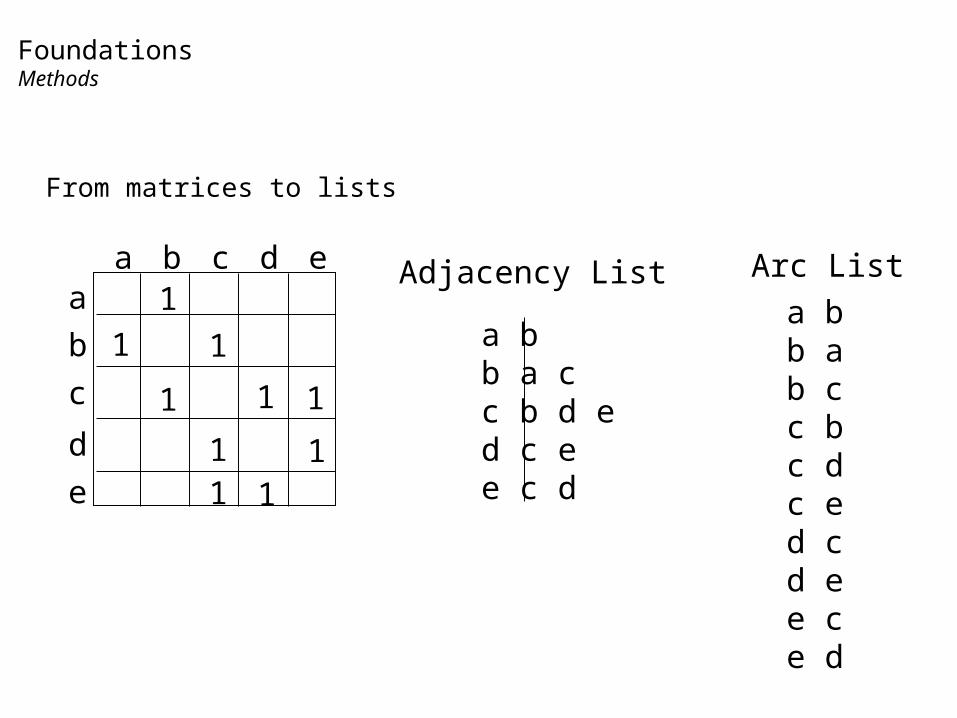
From matrices to lists
a b c d ea
b
c
d
e
1
1 1
1 1 1
1 11 1
a bb a cc b d ed c ee c d
a bb ab cc bc dc ed cd ee ce d
Adjacency List Arc List
FoundationsMethods
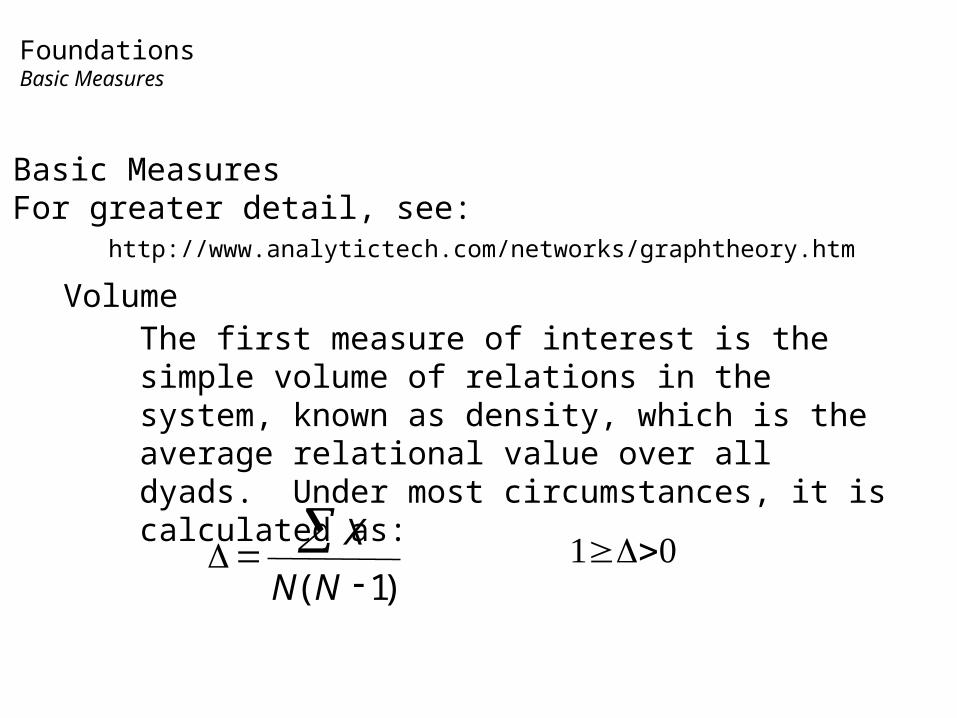
Basic Measures For greater detail, see:
http://www.analytictech.com/networks/graphtheory.htm
VolumeThe first measure of interest is the simple volume of relations in the system, known as density, which is the average relational value over all dyads. Under most circumstances, it is calculated as:
FoundationsBasic Measures
)1(
NN
X
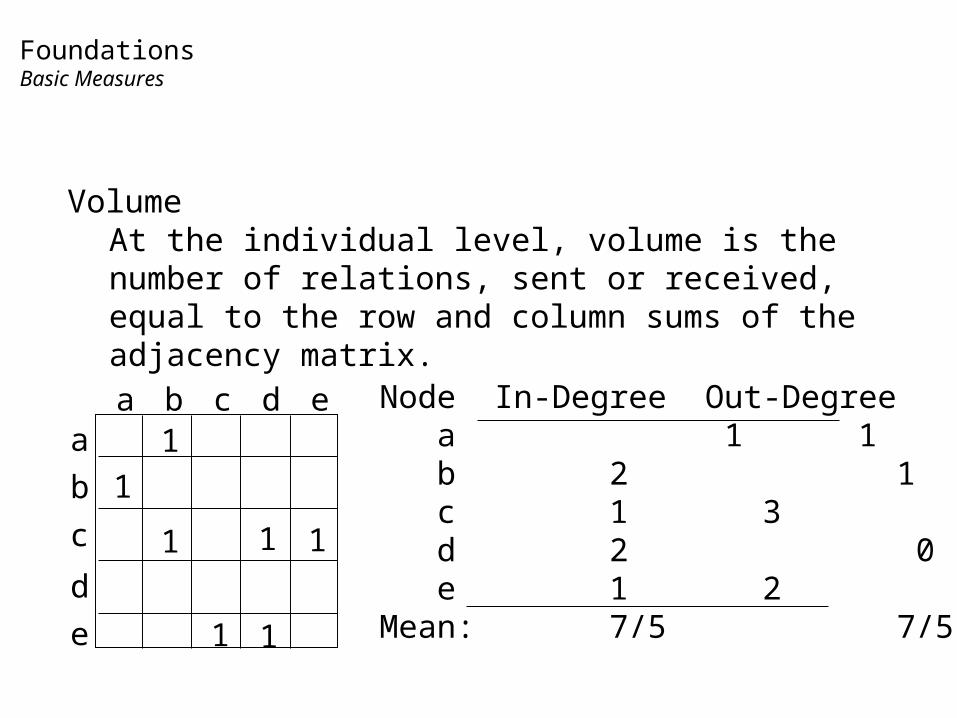
VolumeAt the individual level, volume is the number of relations, sent or received, equal to the row and column sums of the adjacency matrix.
a b c d ea
b
c
d
e
1
1
1 1 1
1 1
Node In-Degree Out-Degree a 1 1 b 2 1 c 1 3 d 2 0 e 1 2Mean: 7/5 7/5
FoundationsBasic Measures
d e
c
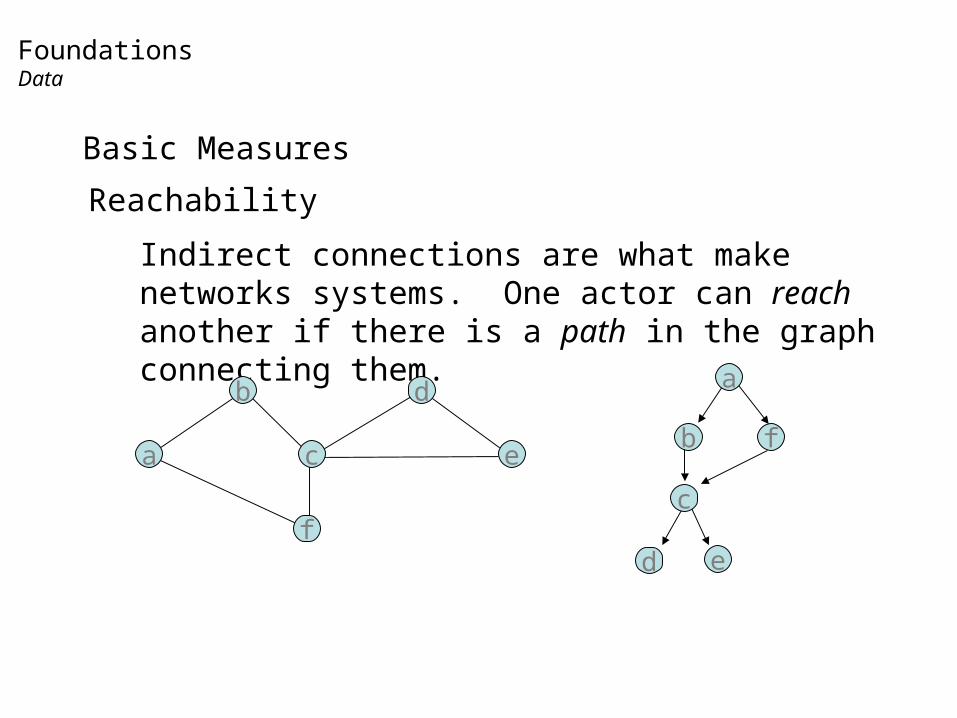
Basic Measures
Reachability
Indirect connections are what make networks systems. One actor can reach another if there is a path in the graph connecting them.
a
b
c e
d
f
b f
a
FoundationsData
SNA disciplines
More diverse than expected!• Sociology• Political Science• Business• Economics• Sciences• Computer science• Information science• Others?
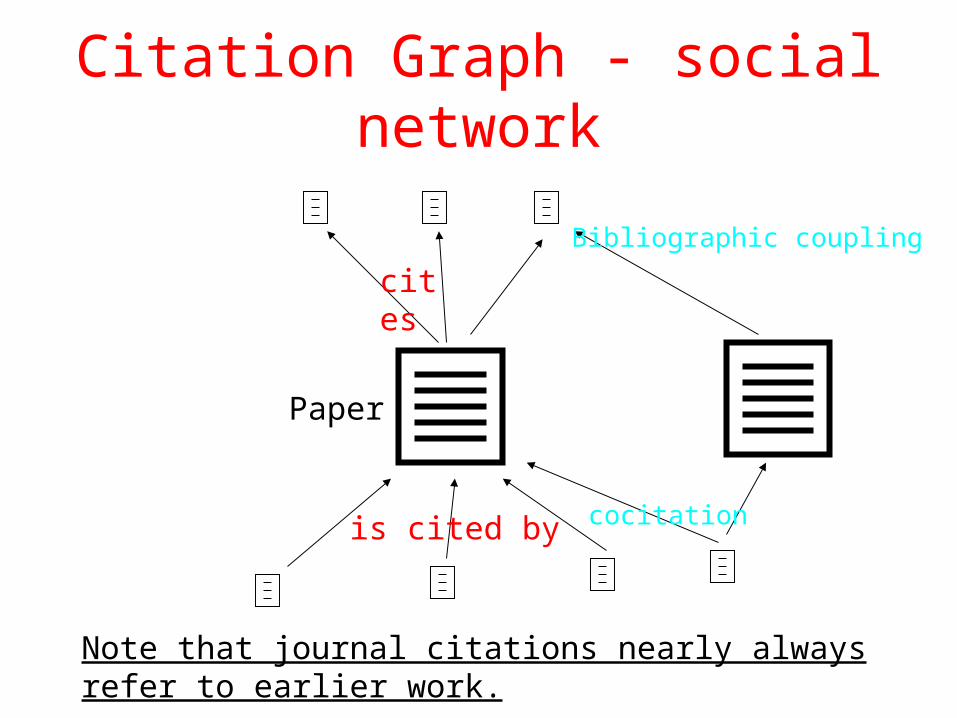
Citation Graph - social network
Paper
cites
is cited by
Note that journal citations nearly always refer to earlier work.
Bibliographic coupling
cocitation
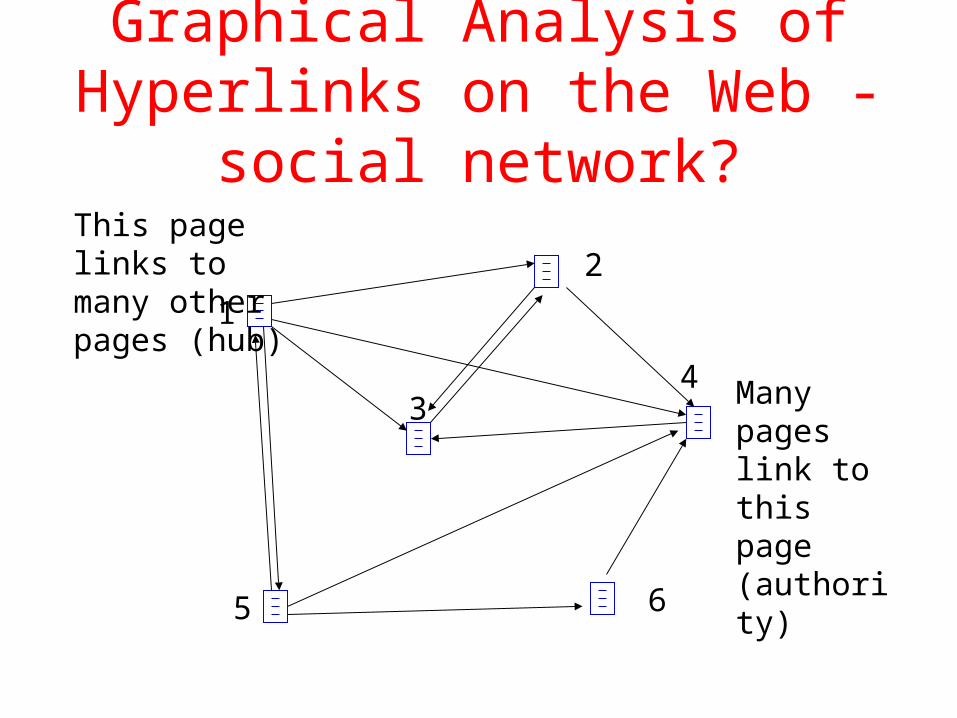
Graphical Analysis of Hyperlinks on the Web - social network?
This page links to many other pages (hub)
Many pages link to this page (authority)
1
2
34
5 6
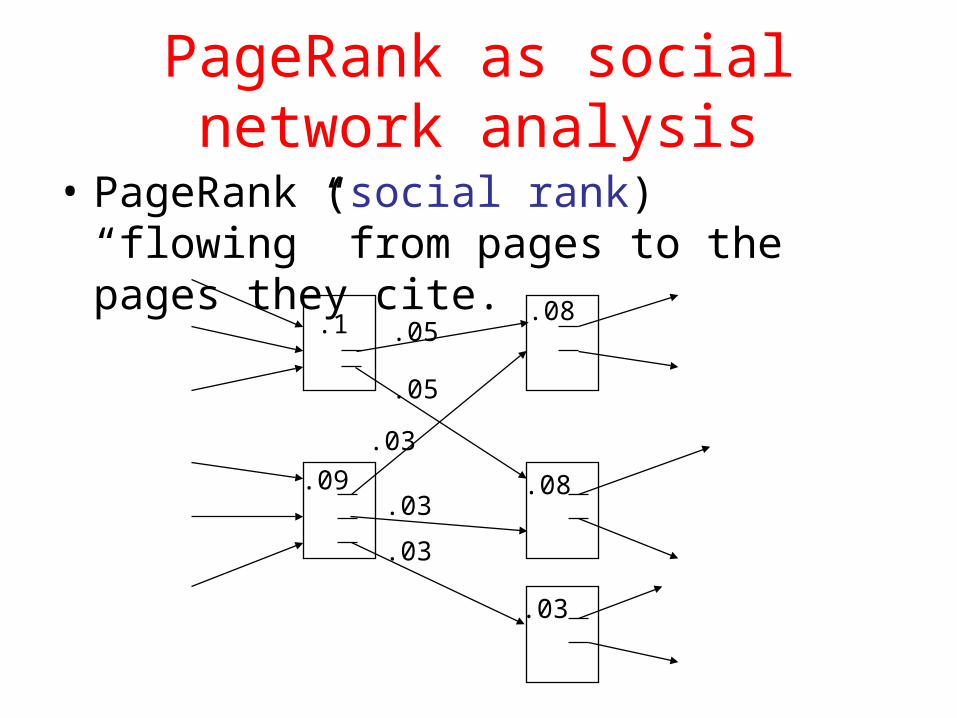
PageRank as social network analysis
• PageRank (social rank) “flowing” from pages to the pages they cite.
.1
.09
.05
.05
.03
.03
.03
.08
.08
.03
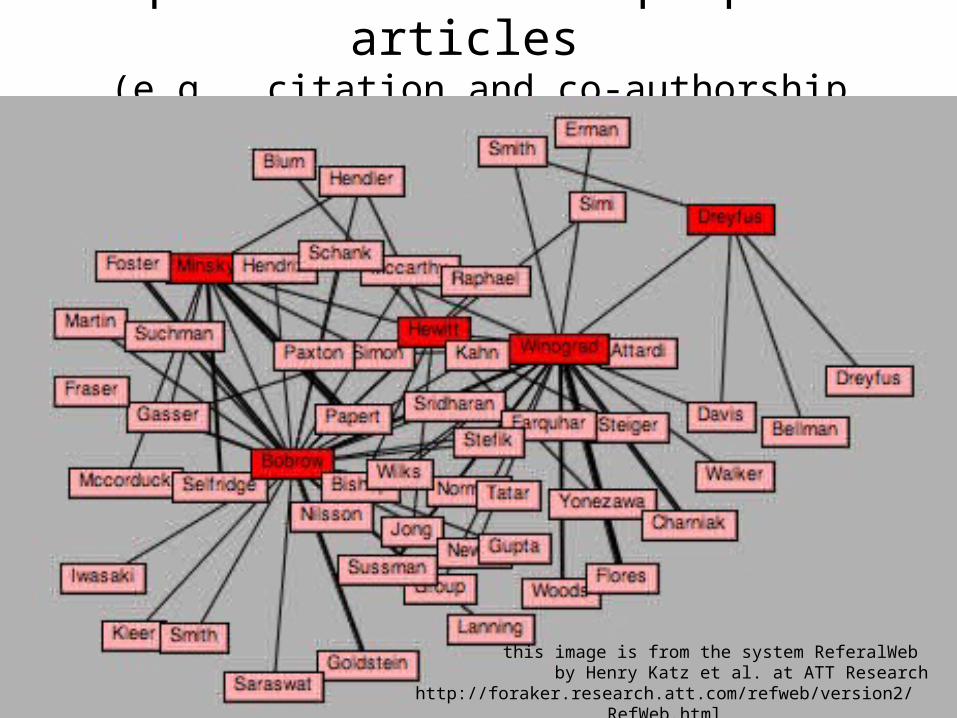
example: networks of people and articles (e.g., citation and co-authorship networks)
this image is from the system ReferalWeb by Henry Katz et al. at ATT Research
http://foraker.research.att.com/refweb/version2/RefWeb.html
SNA and the Web 2.0
• Wikis• Blogs• Folksonomies• Collaboratories• What next?
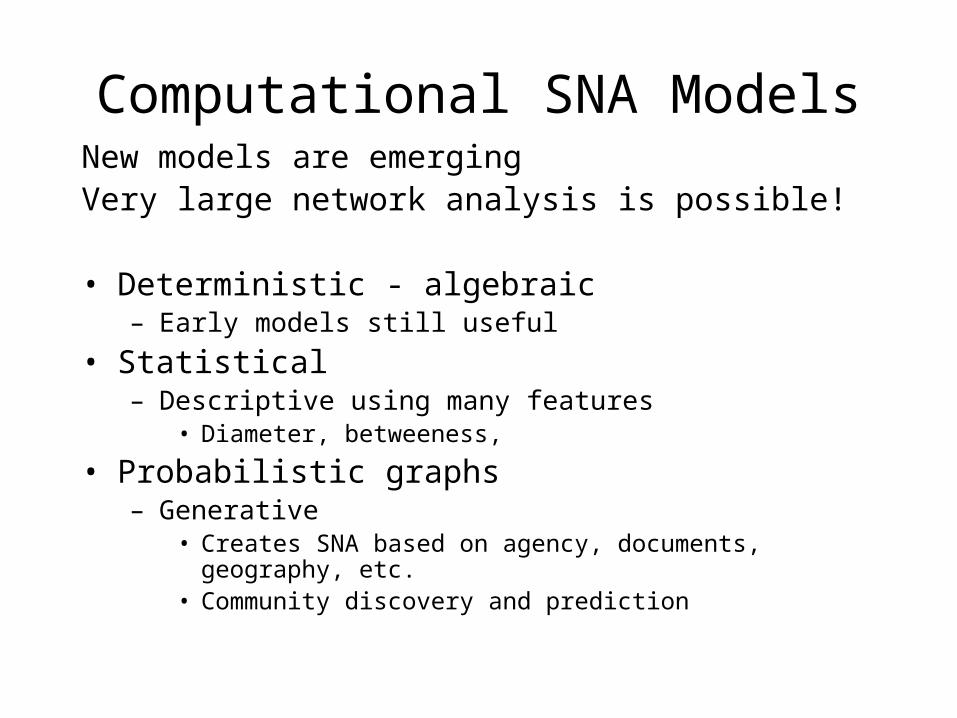
Computational SNA ModelsNew models are emergingVery large network analysis is possible!
• Deterministic - algebraic– Early models still useful
• Statistical– Descriptive using many features
• Diameter, betweeness,
• Probabilistic graphs– Generative
• Creates SNA based on agency, documents, geography, etc.• Community discovery and prediction
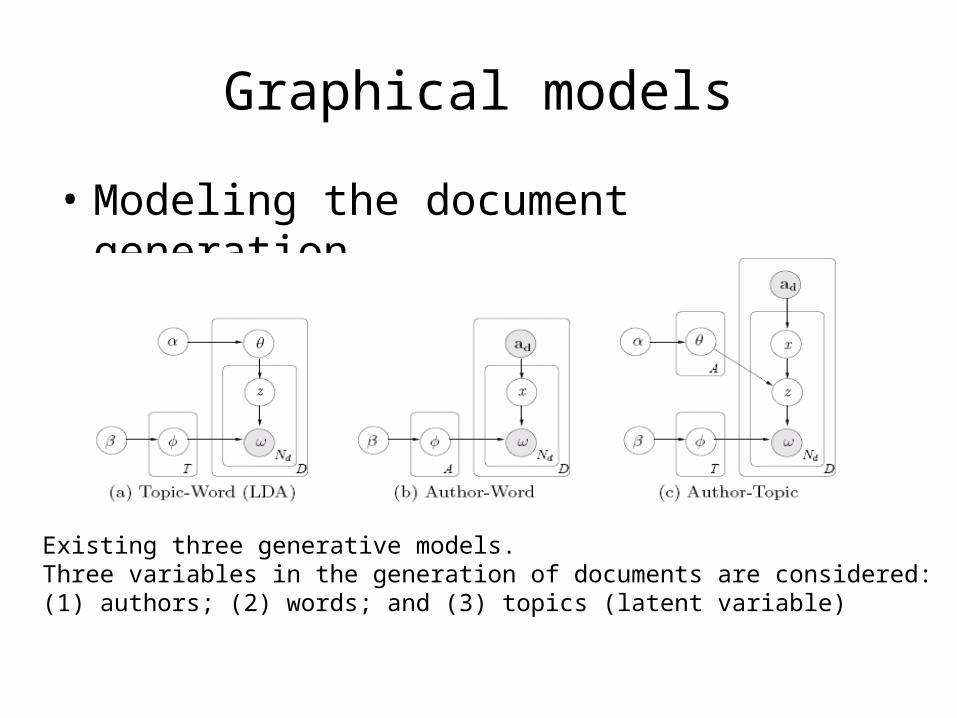
Graphical models
• Modeling the document generation
Existing three generative models. Three variables in the generation of documents are considered:(1) authors; (2) words; and (3) topics (latent variable)
Theories used in SNA
• Graph/network– Heterogeneous graphs– Hypergraphs– Probabilistic graphs
• Economics/game theory• Optimization• Visualization/HCI• Actor/Network• Many more
Future of social networks?
• Tribes - Seth Godin
• Human flesh search engine– Internet mobbing
• Will there be war?
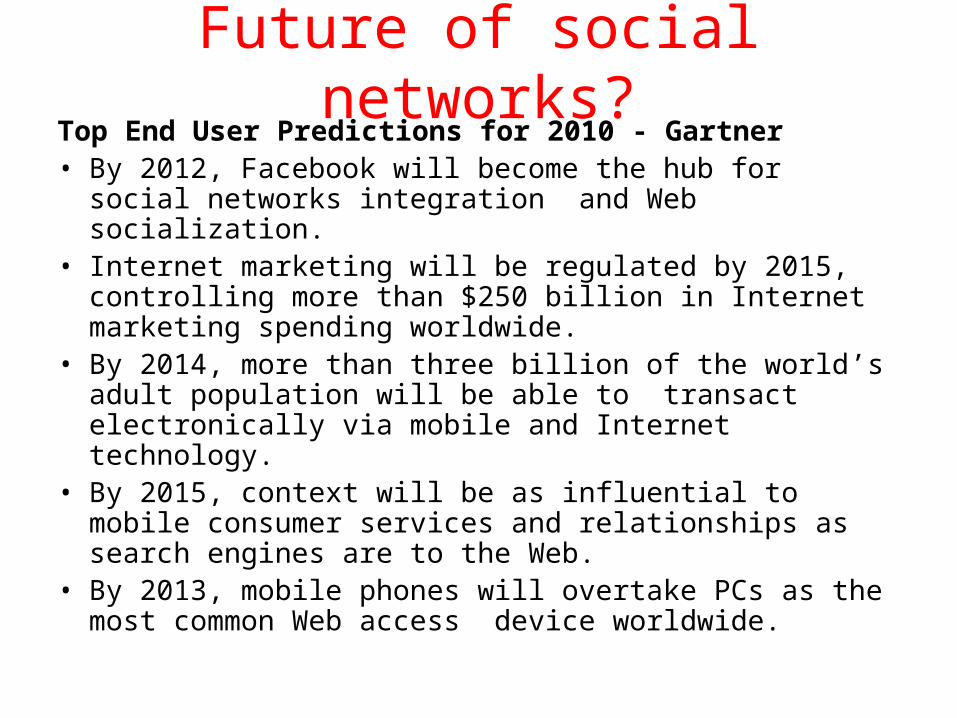
Future of social networks?Top End User Predictions for 2010 - Gartner• By 2012, Facebook will become the hub for social
networks integration and Web socialization. • Internet marketing will be regulated by 2015, controlling
more than $250 billion in Internet marketing spending worldwide.
• By 2014, more than three billion of the world’s adult population will be able to transact electronically via mobile and Internet technology.
• By 2015, context will be as influential to mobile consumer services and relationships as search engines are to the Web.
• By 2013, mobile phones will overtake PCs as the most common Web access device worldwide.
Open questions
• Scalability
• Data acquisition and data rights
• Search (socialnetworkrank?)
• Trust
• Heterogeneous network analysis
• Business models!