Embed Size (px)
Citation preview

NEURO-FUZZY TECHNIQUE APPLICATION FOR IDENTIFYING FLOW
REGIMES OF PARTICLES CONVEYING IN PNEUMATIC PIPELINE
MUTAZ MOHAMED ELHASSAN ELSAWI KHAIRALLA
UNIVERSITI TEKNOLOGI MALAYSIA

NEURO-FUZZY TECHNIQUE APPLICATION FOR IDENTIFYING FLOW
REGIMES OF PARTICLES CONVEYING IN PNEUMATIC PIPELINE
MUTAZ MOHAMED ELHASSAN ELSAWI KHAIRALLA
A project report submitted in partial fulfilment of the
requirements for the award of the degree of
Master of Engineering (Electrical – Mechatronics & Automatic Control)
Faculty of Electrical Engineering
Universiti Teknologi Malaysia
JULY 2012

iii
To my beloved mother and father
To my brothers and sisters
To the Islamic nation

iv
ACKNOWLEDGEMENT
In The Name Of Allah, Most Gracious, Most Merciful
First and foremost, I must be thankful to Allah SWT on His blessing for
finishing the research.
I would like to express my sincere thanks and appreciation to my supervisor
Prof Dr Mohd Fua'ad bin Hj Rahmat, for his precious guidance, encouragement,
constructive criticisms, advice and motivation. Without his continual support and
interest, this project report would not have been that same as presented here.
Besides that, my highly appreciation extended to my parents for their
supporting, patience, love, prayer and sacrifice are unbounded during my study. My
special thanks must be extended to All my friends who supports me and help me.
Last but not least, thanks to all those who give helps and support to me directly or
indirectly for the success of this thesis
v
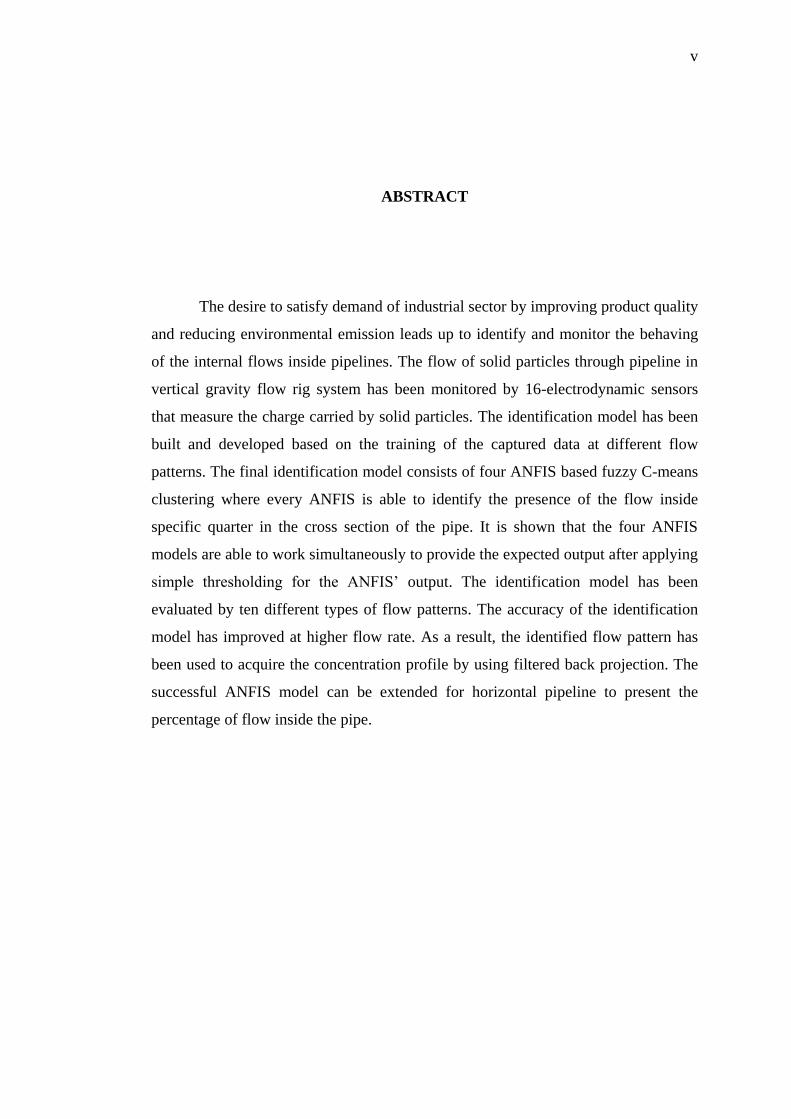
ABSTRACT
The desire to satisfy demand of industrial sector by improving product quality
and reducing environmental emission leads up to identify and monitor the behaving
of the internal flows inside pipelines. The flow of solid particles through pipeline in
vertical gravity flow rig system has been monitored by 16-electrodynamic sensors
that measure the charge carried by solid particles. The identification model has been
built and developed based on the training of the captured data at different flow
patterns. The final identification model consists of four ANFIS based fuzzy C-means
clustering where every ANFIS is able to identify the presence of the flow inside
specific quarter in the cross section of the pipe. It is shown that the four ANFIS
models are able to work simultaneously to provide the expected output after applying
simple thresholding for the ANFIS’ output. The identification model has been
evaluated by ten different types of flow patterns. The accuracy of the identification
model has improved at higher flow rate. As a result, the identified flow pattern has
been used to acquire the concentration profile by using filtered back projection. The
successful ANFIS model can be extended for horizontal pipeline to present the
percentage of flow inside the pipe.
vi
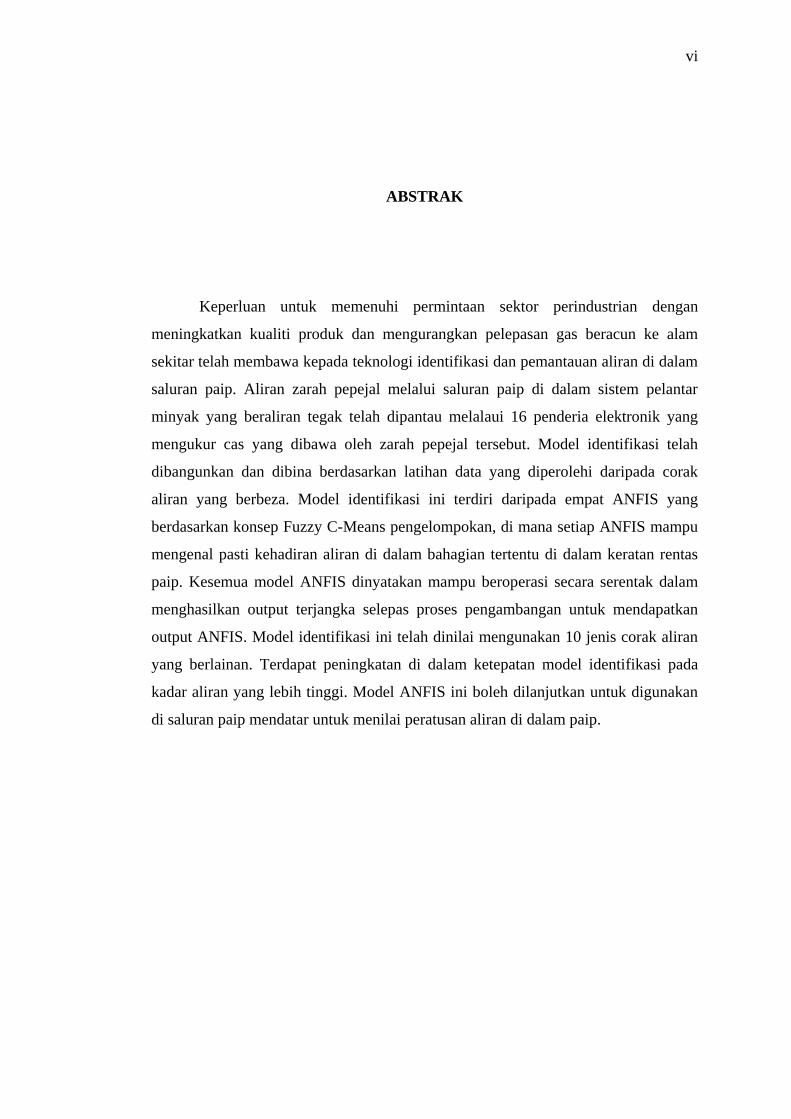
ABSTRAK
Keperluan untuk memenuhi permintaan sektor perindustrian dengan
meningkatkan kualiti produk dan mengurangkan pelepasan gas beracun ke alam
sekitar telah membawa kepada teknologi identifikasi dan pemantauan aliran di dalam
saluran paip. Aliran zarah pepejal melalui saluran paip di dalam sistem pelantar
minyak yang beraliran tegak telah dipantau melalaui 16 penderia elektronik yang
mengukur cas yang dibawa oleh zarah pepejal tersebut. Model identifikasi telah
dibangunkan dan dibina berdasarkan latihan data yang diperolehi daripada corak
aliran yang berbeza. Model identifikasi ini terdiri daripada empat ANFIS yang
berdasarkan konsep Fuzzy C-Means pengelompokan, di mana setiap ANFIS mampu
mengenal pasti kehadiran aliran di dalam bahagian tertentu di dalam keratan rentas
paip. Kesemua model ANFIS dinyatakan mampu beroperasi secara serentak dalam
menghasilkan output terjangka selepas proses pengambangan untuk mendapatkan
output ANFIS. Model identifikasi ini telah dinilai mengunakan 10 jenis corak aliran
yang berlainan. Terdapat peningkatan di dalam ketepatan model identifikasi pada
kadar aliran yang lebih tinggi. Model ANFIS ini boleh dilanjutkan untuk digunakan
di saluran paip mendatar untuk menilai peratusan aliran di dalam paip.

vii
TABLE OF CONTENTS
CHAPTER TITLE PAGE
DECLARATION ii
DEDICATION iii
ACKNOWLEDGEMENT iv
ABSTRACT v
ABSTRAK vi
TABLE OF CONTENTS vii
LIST OF TABLES ix
LIST OF FIGURES x
LIST OF SYMBOLS xii
LIST OF APPENDICES xiii
1 INTRODUCTION 1
1.1 Background 1
1.2 Problem Statement 2
1.3 Project objectives 3
1.4 Scope of project 3
2 LITERATURE REVIEW 4
2.1 Introduction 4
2.2 Process tomography 5
2.2.1 Electrical capacitance tomography 5
2.2.2 Optical Tomography 6
2.2.3 Radiometric sensor 7
2.2.4 Electrodynamic sensor 8
2.3 Flow regime identification 9
viii
2.3.1 Identification using fuzzy logic 10
2.3.2 Identification using neural network 11
2.3.3 Identification using neuro-fuzzy 12
3 METHODOLOGY 14
3.1 Introduction 14
3.2 Methodology 14
3.3 Experimental setup 16
3.4 Adaptive-Network-based Fuzzy Inference System 19
4 RESULTS AND DISCUSSION 23
4.1 Introduction 23
4.2 Experimental results of the captured data 23
4.3 Training of the identification model 28
4.4 Evaluation of the identification model 30
4.5 Concentration profile of the flow 33
5 CONCLUSION AND FUTURE WORKS 35
5.1 Introduction 35
5.2 Conclusion 35
5.3 Future Work 36
REFERENCES 38
Appendices A – D 41-66
ix
LIST OF TABLES
TABLE NO. TITLE PAGE
4.1 Specification of the trained ANFIS 28
4.2 Accuracy of the identification model 32
4.3 The accuracy of the complete identification model 33
A.1 Samples from the Training data 44
A.2 Samples from the Testing data 46
x
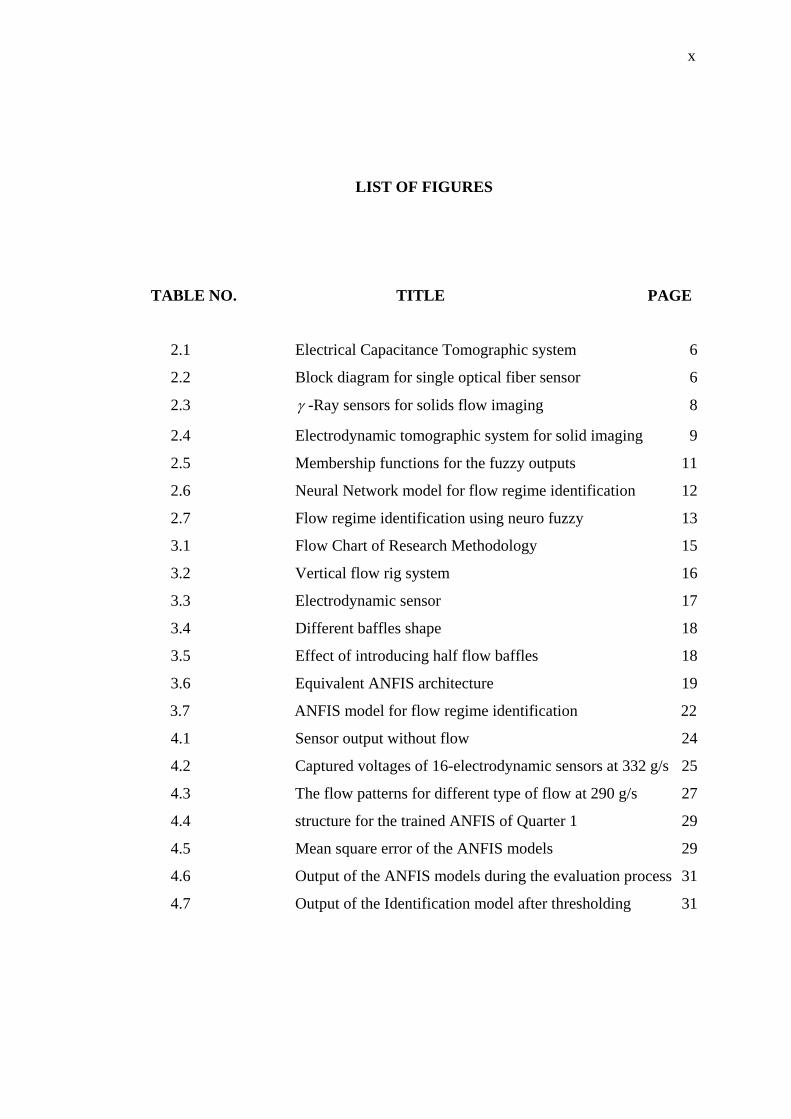
LIST OF FIGURES
TABLE NO. TITLE PAGE
2.1 Electrical Capacitance Tomographic system 6
2.2 Block diagram for single optical fiber sensor 6
2.3 -Ray sensors for solids flow imaging 8
2.4 Electrodynamic tomographic system for solid imaging 9
2.5 Membership functions for the fuzzy outputs 11
2.6 Neural Network model for flow regime identification 12
2.7 Flow regime identification using neuro fuzzy 13
3.1 Flow Chart of Research Methodology 15
3.2 Vertical flow rig system 16
3.3 Electrodynamic sensor 17
3.4 Different baffles shape 18
3.5 Effect of introducing half flow baffles 18
3.6 Equivalent ANFIS architecture 19
3.7 ANFIS model for flow regime identification 22
4.1 Sensor output without flow 24
4.2 Captured voltages of 16-electrodynamic sensors at 332 g/s 25
4.3 The flow patterns for different type of flow at 290 g/s 27
4.4 structure for the trained ANFIS of Quarter 1 29
4.5 Mean square error of the ANFIS models 29
4.6 Output of the ANFIS models during the evaluation process 31
4.7 Output of the Identification model after thresholding 31

xi
4.8 Example of concentration profile by using linearized filtered
back-projection 34
4.9 Concentration profile after by using filtered back-projection
algorithm 34
B.1 The sensitivity model for sensor 1 48
B.2 The sensitivity map for sensor 1 49
B.3 The half flow filter mask 50
D.1 KUSB-3116 Module 64

xii
LIST OF SYMBOLS
- Electrical charge
- Distance
- Permittivity of Free Space
- Uniform Radial Field
- Neural-Fuzzy Weight
- Neural-Fuzzy Membership
- Neural-Fuzzy Node Output

xiii
LIST OF APPENDICES
APPENDIX TITLE PAGE
A Training and Testing Data 40
B Concentration Profile 46
C MATLAB Codes 50

CHAPTER 1
1 INTRODUCTION
1.1 Background
Tomographic imaging systems are designed to analyze the structure and
compositions of objects by examining them with waves, radiation or other electrical
techniques and by calculating virtual cross section through them (Grangeat, 2010).
Tomography means that the process to obtain the cross sectional image of a body or
a process. The development of tomographic instrumentation, started in the 1950s,
has led to the widespread availability of body scanners, which are so much a part of
modern medicine (Beck & Williams, 1996). The first whole-body computerized
tomography (CT) was been introduced in 1975.
Since 1990s, industry has become under pressure to utilize resources more
efficiently and to satisfy demand and legislation for product quality and reduced
environmental emissions. Hence there is an increasing need to know more about the
exact way the internal flows in process equipment are behaving. Often this must be
done non-invasively by tomographic instrumentation because conventional
measuring instruments may either be unsuitable for exposure to the harsh internal
conditions of the process, or by their presence upset the operation of the process.
There is now a widespread appreciation of the need for the direct analysis of the
internal characteristics of process equipment; the measuring instruments for such
applications must use robust, non-invasive sensors which can operate in the
proximity of aggressive and fast-moving fluids and multiphase mixtures.

2
Tomographic imaging systems also involve using tomographic imaging methods to
manipulate the data from remote sensors in order to obtain precise quantitative
information from inaccessible locations (Beck & Williams, 1996).
The process tomography is basically consist of set of sensors mounted around
the cross section of the pipeline to sense some characteristics of the flow particles
that will be used to reconstruct an image for the cross section of the pipe by using
some reconstruction algorithms. There are a lot of reconstruction algorithm that are
been used to obtain tomogram of the flow like back projection, iterative
reconstruction and there are some analytical reconstruction approaches. But some
reconstruction algorithms need to identify the type of flow for the conveying
particles to better obtain the final tomogram of the flow.
Industrial processes use various methods for tomographic imaging and the
selection between these techniques is affected by:
1. The nature of components contained in the pipeline, vessel, reactor or
material being examined.
2. The information sought from the process and its intended purpose.
3. The size of the process equipment and the length scale of the phenomena
being investigated.
4. The process environment (Williams & Beck, 1995).
1.2 Problem Statement
Electrodynamic sensors have been used to obtain the tomogram of the
conveyed solid particles in the pneumatic pipeline. The collected data has been used
to reconstruct the image of the flow in the cross section of the pipe by using filtered
back-projection algorithm. Filtered back projection algorithm needs to know the
type of the flow regime conveying inside the pipeline before it be able to calculate
the filter mask which has been used to obtain the tomogram of the flow. Neuro-
fuzzy system has been trained to classify the type of flow into quarter, half, three

3
quarter, inverse quarter, inverse half, inverse three quarter, center, full flow in order
to improve the previous researcher results using neural network and fuzzy logic.
1.3 Project objectives
The specific objectives of this project are:
To use the outputs of the electrodynamic sensors, which are mounted around
the cross section of the pipeline to obtain the tomography of the flow.
To identify flow regime of particles inside the pipe of vertical gravity flow rig
system by using neuro-fuzzy technique.
To use feuro-fuzzy identification model and electrodynamic sensors’ outputs
to obtain the tomogram of the flow.
1.4 Scope of project
The scope of this project begins with collecting the output of the 16-
electrodynamic sensors around the circumstance of the pipe at different flow regimes
of particles in vertical flow rig system. The Neuro-Fuzzy model will be trained by
using set of the output of the electrodynamic sensors as inputs for the model at
different flow regimes, which is determined by using baffles of different shapes, and
then the Neuro-Fuzzy model will be able to predict the type of flow inside the
pipeline for other sets of inputs.
REFERENCES
Abraham, A., 2005. Adaptation of Fuzzy Inference System Using Neural Learning.
In: N. Nedjah & L. d. Macedo Mourelle, eds. Fuzzy Systems Engineering.
s.l.:Springer Berlin / Heidelberg, p. 914.
Beck, M. S. & Williams, R. A., 1996. Process tomography: a European innovation
and its applications. Measurement Science and Technology, 7(3), p. 215.
Grangeat, P., 2010. Introduction to Tomography. In: Tomography. s.l.:ISTE, pp. 1-
20.
Green, R. et al., 1998. Concentration profiles in a gravity chute conveyor by optical
tomography measurement. Powder Technology, 95(1), pp. 49-54.
Green, R. G. et al., 1997. Velocity and mass flow rate profiles of dry powders in a
gravity drop conveyor using an electrodynamic tomography system.
Measurement Science and Technology, 8(4), p. 429.
Green, R. G. et al., 1997. Concentration profiles of dry powders in a gravity
conveyor using an electrodynamic tomography system. Measurement Science
and Technology, 8(2), p. 192.
Huang, S. M., Plaskowski, A. B., Xie, C. G. & Beck, M. S., 1989. Tomographic
imaging of two-component flow using capacitance sensors. Journal of Physics
E: Scientific Instruments, 22(3), p. 173.
Jang, J. S., 1993. ANFIS: adaptive-network-based fuzzy inference system. Systems,
Man and Cybernetics, IEEE Transactions on, May/June, 23(3), pp. 665-685.
Jiaqing Shao, Krabicka, J. & Yong Yan, 2010. Velocity Measurement of
Pneumatically Conveyed Particles Using Intrusive Electrostatic Sensors.
Instrumentation and Measurement, IEEE Transactions on, May, 59(5), pp.
1477-1484.
Le Corre, J.-M., Aldorwish, Y., Kim, S. & Ishii, M., 1999. Two-phase flow pattern
identification using a fuzzy methodology. s.l., s.n., pp. 155-161.
39
Machida, M. & Scarlett, B., 2005. Process tomography system by electrostatic
charge carried by particles. Sensors Journal, IEEE, April, 5(2), pp. 251-259.
Meng Sun, Shi Liu, Jing Lei & Zhihong Li, 2008. Mass flow measurement of
pneumatically conveyed solids using electrical capacitance tomography.
Measurement Science and Technology, 19(4), p. 045503.
Mi, Y., Ishii, M. & Tsoukalas, . L., 1998. Vertical two-phase flow identification
using advanced instrumentation and neural networks. Nuclear Engineering and
Design, 184(2-3), pp. 409 - 420.
Panella, M. & Gallo, A., 2005. An input-output clustering approach to the synthesis
of ANFIS networks. Fuzzy Systems, IEEE Transactions on, February, 13(1), pp.
69-81.
Rahmat, M. F., Isa, M. D., Rahim, R. A. & Hussin, T. A. R., 2009. Electrodynamics
Sensor for the Image Reconstruction Process in an Electrical Charge
Tomography System. Sensors, 9(12), pp. 10291--10308.
Rahmat, M. F. & Kamaruddin, N. S., 2012. Application of fuzzy logic and
electrodynamic sensors as flow pattern identifier. Sensor review, 32(2), pp. 123-
133.
Rahmat, M. F., Kamaruddin, N. S. & Isa, M. D., 2009. Flow regime identification in
pneumatic conveyor using electrodynamic transducer and fuzzy logic method.
International journal on smart sensing and intelligent systems, September, 2(3),
pp. 396-416.
Rahmat, M. F. & Sabit, H. A., 2004. Flow Regime Identification Using Neural
Network Based Electrodynamic Tomography System. Jurnal Teknologi, June,
Volume 40, pp. 109-118.
Rahmat, M. F. & Sabit, H. A., 2007. Application of Neural Network Technique and
Electrodynamic Sensors in the Identification of Solid Flow Regimes. Jurnal
Teknologi, June, Volume 46, pp. 77-92.
Rahmat, M. F., Sabit, H. A. & Abdul Rahim, R., 2010. Application of neural network
and electrodynamic sensor as flow pattern identifier. Sensor Review, 30(2), pp.
137-141.
Tsoukalas, L. H., Ishii, M. & Mi, Y., 1997. A neurofuzzy methodology for
impedance-based multiphase flow identification. Engineering Applications of
Artificial Intelligence, 10(6), pp. 545-555.
21
Williams, . R. & Beck, M., 1995. Process tomography: principles, techniques, and
applications. s.l.:Butterworth-Heinemann.
Yang, W. Q. & Lihui Peng, 2003. Image reconstruction algorithms for electrical
capacitance tomography. Measurement Science and Technology, 14(1), p. R1.
Yan, Y., 1996. Mass flow measurement of bulk solids in pneumatic pipelines.
Measurement Science and Technology, 7(12), p. 1687.
Yan, Y., Byrne, B., Woodhead, S. & Coulthard, J., 1995. Velocity measurement of
pneumatically conveyed solids using electrodynamic sensors. Measurement
Science and Technology, 6(5), p. 515.
Yaw, W. L., 2007. Real-Time Mass Flow Rate Measurement For Bulk Solid Flow,
Johor: Faculty of Electrical Engineering, Universiti Teknologi Malaysia.