Embed Size (px)
Citation preview

For personal use. Only reproduce with permission from The Lancet Publishing Group.
ARTICLES
THE LANCET • Published online December 10, 2002 • http://image.thelancet.com/extras/01art9092web.pdf 1
Summary
Background Psychotic disorders, such as schizophrenia, areassociated with neuroanatomical abnormalities, but whetherthese predate the onset of symptoms or developprogressively over the course of illness is unclear. Weinvestigated this issue with MRI to study people withprodromal symptoms who are at ultra high-risk for thedevelopment of psychosis.
Methods We did two comparisons, cross-sectional andlongitudinal. For the cross-sectional comparison, 75 peoplewith prodromal signs of psychosis were scanned with MRI.After at least 12 months of follow-up, 23 (31%) haddeveloped psychosis and 52 (69%) had not. Baseline MRIdata from these two subgroups were compared. For thelongitudinal comparison, 21 of the ultra high-risk individualswere scanned again with MRI after at least 12 months. Tenof these had developed psychosis and 11 had not. MRI datafrom baseline and follow-up were compared within eachgroup of people.
Findings In the cross-sectional comparison, compared withpeople who did not develop psychosis, those who diddevelop the disorder had less grey matter in the right medialtemporal, lateral temporal, and inferior frontal cortex, and inthe cingulate cortex bilaterally. In the longitudinalcomparison, when re-scanned, individuals who haddeveloped psychosis showed a reduction in grey matter inthe left parahippocampal, fusiform, orbitofrontal andcerebellar cortices, and the cingulate gyri. In those who had
Cognitive Neuropsychiatry Research and Academic Unit, andMelbourne Neuropsychiatry Centre, Mental Health Programme,Department of Psychiatry, University of Melbourne and SunshineHospital, Melbourne, Victoria, Australia (C Pantelis FRANZCP,D Velakoulis FRANZCP, S J Wood PhD, W Brewer PhD, B Soulsby BSc);Applied Schizophrenia Division, Mental Health Research Instituteof Victoria, Melbourne (C Pantelis, D Velakoulis, S J Wood,W Brewer, B Soulsby); Early Psychosis Prevention and InterventionCentre, Personal Assessment and Crisis Evaluation Clinic, andDepartment of Psychiatry, University of Melbourne, Melbourne(Prof P D McGorry FRANZCP, L J Phillips MPsych (Clin), A R Yung FRANZCP);Department of Radiology, University of Melbourne and RoyalMelbourne Hospital, Melbourne (P Desmond FRACR); Clinical AgeResearch Unit, Guy’s, King’s, and St Thomas’ Medical School,London, UK (J Suckling PhD); Brain Mapping Unit, Department ofPsychiatry, University of Cambridge, Cambridge (Prof E T Bullmore MRCPsych); Section of Neuroimaging, Institute ofPsychiatry, London (Prof P K McGuire MRCPsych); and Outreach andSupport in South London, South London and Maudsley NHS Trust,London (Prof P K McGuire)
Correspondence to: Dr Christos Pantelis, Cognitive NeuropsychiatryResearch and Academic Unit, Sunshine Hospital, PO Box 294, St Albans, Victoria 3021, Australia(e-mail: [email protected])
not become psychotic, longitudinal changes were restrictedto the cerebellum.
Interpretation Some of the grey-matter abnormalitiesassociated with psychotic disorders predate the onset offrank symptoms, whereas others appear in association withtheir first expression.
Published online December 10, 2002http://image.thelancet.com/extras/01art9092web.pdfSee Commentary
IntroductionPsychotic disorders involve striking disturbances ofthought, perception, affect, and behaviour. The majorpsychotic disorders, especially schizophrenia and bipolardisorder, are relatively undifferentiated during the earlyphase of illness, so that to distinguish them at this stagecan be difficult.1 However, studies done early in thecourse of psychosis are essential for an understanding ofthe neurobiology and treatment of these disorders.
Although increasing consensus exists that thestructure of the brain is abnormal in major psychoticdisorders, whether these abnormalities predate onset ofillness and are relatively fixed over its course, or whetherthey are progressive, remains controversial.2 Results ofneuroimaging studies suggest that abnormalities that arequalitatively similar to those evident in establishedschizophrenia and bipolar disorder are apparent inpatients presenting with their first episode of psychosis3–6
and in individuals without psychosis with a strongfamilial risk of schizophrenia.7 However, results of recentlongitudinal neuroimaging studies in patients withschizophrenia have shown structural changes within thesame patients over time, especially in the early stages ofillness.8 These two sets of findings raise the possibilitythat neuroanatomical abnormalities seen in patients withpsychotic disorders reflect a combination of pre-existingvulnerability and changes associated with the firstexpression of psychotic symptoms.
We aimed to investigate this model of psychosis withMRI, to assess people at ultra high-risk of developmentof psychosis before and after onset of their first episodeof psychosis. On the basis of our own and other work, wepredicted that ultra high-risk people would showvolumetric abnormalities before they became psychotic,and that these would be qualitatively similar to thoseseen in patients with established schizophrenia andbipolar disorder.3–6 A second prediction was that therewould also be progressive loss of grey matter in themedial temporal cortex associated with development ofpsychosis in ultra high-risk indviduals. This hypothesiswas based on findings of smaller medial temporalvolumes in patients with psychosis than in ultra high-riskindividuals.7,9
Neuroanatomical abnormalities before and after onset ofpsychosis: a cross-sectional and longitudinal MRI comparison
Christos Pantelis, Dennis Velakoulis, Patrick D McGorry, Stephen J Wood, John Suckling, Lisa J Phillips, Alison R Yung,Edward T Bullmore, Warrick Brewer, Bridget Soulsby, Patricia Desmond, Philip K McGuire
For personal use. Only reproduce with permission from The Lancet Publishing Group.
Participants and methodsParticipantsWe recruited people at ultra high-risk of development ofpsychosis from the personal assessment and crisisevaluation (PACE) clinic in Melbourne, Australia, whichmanages young people at risk of this disorder.10 We useda close-in strategy to identify individuals at ultra high-riskof psychosis with a combination of trait and state factors(panel).10 This strategy identified people whosetheoretical risk of becoming psychotic was 41% within a12-month period.10 We enrolled all individuals at thisclinic who gave written informed consent to be scannedand who met our inclusion criteria, including adequateclinical follow-up to confirm diagnostic outcome. Weexcluded individuals if they had a history of head injury,seizures, cerebrovascular disease, other neurologicaldisease, impaired thyroid function, or steroid abuse. Atenrolment, we assessed all participants with the briefpsychiatric rating scale (BPRS), scale for the assessmentof negative symptoms (SANS), and national adultreading test (NART). The study was approved by thelocal research and ethics committee.
ProceduresIn the first, cross-sectional comparison, we scannedindividuals at baseline and then followed them upclinically for 24 months. We compared MRI data from thesubgroup of individuals who subsequently developedpsychosis within the follow-up period with data fromthose who did not develop this disorder. We did the cross-sectional comparison to show whether volumetric MRIdifferences between the two groups were evident beforeonset of psychosis.
In people who developed psychosis, we assessed the typeof psychotic disorder with the structured clinical interviewfor the diagnostic and statistical manual of mentaldisorders, 4th edition (SCID).
In the second, longitudinal comparison, we rescanned asubset of individuals from the cross-sectional comparisonwith the same MRI protocol (see below). This subset ofpeople included all those in whom follow-up scanning waspossible. We compared MRI scans done at baseline withthose done at follow-up. This longitudinal within-subjectcomparison showed whether transition from the ultra high-risk to the psychotic state was associated with progressivechanges in grey-matter volume.
We acquired high-resolution 3-mm thick, contiguous,interleaved, two-dimensional, dual-echo fast spin-echoimages parallel to the AC-PC (anterior and posteriorcommissure) line, covering the entire brain. Proton density(PD)-weighted and T2-weighted images were acquiredalmost simultaneously (echo time 1, 20 ms; echo time 2,85 ms; repetition time, 4000 ms; eight-echo train length).We set the matrix size and field of view at 256�192, and22 cm, respectively, and every voxel was represented with a16-bit integer value.
The methods we used for segmentation and registrationof each image dataset have been described in detailelsewhere.11,12 Briefly, voxels representing extracerebraltissue were automatically identified and set to zero with alinear scale space set of features obtained from derivativesof the Gaussian kernel.11 Manual editing of the segmentedimages was only necessary to remove brainstem from thecerebral hemispheres and diencephalon. We thenestimated the probability of each intracerebral voxelbelonging to each of four possible tissue classes (grey
ARTICLES
2 THE LANCET • Published online December 10, 2002 • http://image.thelancet.com/extras/01art9092web.pdf
Intake and exit criteria
Intake criteria
Group 1: attenuated psychotic symptoms● Presence of at least one of the following symptoms: ideas of reference, magical thinking, perceptual disturbance, paranoid
ideation, odd thinking and speech (2–3 on unusual thought content scale; 1–2 on hallucinations scale; 2–3 on suspiciousnessscale; or 1–3 on conceptual disorganisation scale of BPRS)
● Held with a reasonable degree of conviction, as defined by a score of 2 on the CASH rating scale for delusions● Frequency of symptoms: several times per week● Change in mental state present for at least 1 week and not longer than 5 years
Group 2: brief limited intermittent psychotic symptoms ● Transient psychotic symptoms: ideas of reference, magical thinking, perceptual disturbance, paranoid ideation, odd thinking and
speech (4+ on unusual thought content scale; 3+ on hallucinations scale; 4+ on suspiciousness scale [or it is held with strongconviction, as defined by a score of 3 or more on the CASH rating scale for delusions]; or 4+ on conceptual disorganisation scaleof BPRS)
● Duration of episode of less than 1 week● Symptoms resolve spontaneously● The brief limited psychotic symptom must have happened within the past year
Group 3: trait and state risk factors● First-degree relative with a psychotic disorder or schizotypal personality disorder; or individual has schizotypal personality disorder● Significant decrease in mental state or functioning: maintained for at least a month (reduction in GAF scale of 30 points from
premorbid level)● The decrease in functioning arose within the past year
Exit criteria: acute psychosis● At least one of the following symptoms: hallucinations (defined by a score of 3 or more on the hallucinations scale of the BPRS);
delusions (defined by a score of 4 or more on the unusual thought content scale of the BPRS or a score of 4 or more on thesuspiciousness scale of the BPRS, or it is held with strong conviction, as defined by a score of 3 or more on the CASH ratingscale for delusions or formal thought disorder [defined by a score of 4 or more on the conceptual disorganisation scale BPRS])
● Frequency of symptoms is at least several times a week● Duration of mental state change is longer than 1 week
BPRS=brief psychiatric rating scale; CASH=comprehensive assessment of symptoms and history; GAF=global assessment of function scale. These arethe criteria for identifying people as high risk for psychosis. People are included if they meet criteria for one or more of the three groups. Further detailsare provided elsewhere.9,10 Adapted from reference 9 with permission.

For personal use. Only reproduce with permission from The Lancet Publishing Group.
matter, white matter, cerebrospinal fluid, or dura/vasculature) by a modified fuzzy clustering algorithm.11 Weapplied this algorithm via a sliding window to the images,so that classification was adaptive to local variation intissue contrast attributable to radio frequency or static fieldinhomogeneity, which can be a difficulty in the cerebellarregion in particular.11 On the basis of previous findings, weassumed that the resulting probabilities of tissue-classmembership could be equated with the proportionalvolumes of each tissue class in the often heterogeneousvolume of tissue represented by each voxel.11 So, forexample, if the probability of grey-matter-classmembership was 0·8 for a particular voxel, then we
assumed that 80% of the tissue represented by that voxelwas grey matter.
To estimate between-group structural differences andwithin-group changes over time at each intracerebral voxel,we first co-registered the PD-weighted images from eachfast spin-echo dataset with a template image in thestandard space of Talairach and Tournoux by an affinetransformation,12 implemented with the Fletcher-Davidon-Powell algorithm.12 The template image was constructedby registering each of the images acquired from a subset ofcomparison participants in this study in standard space byan affine transformation, and then averaging these images.The affine transformation matrix that mapped each
ARTICLES
THE LANCET • Published online December 10, 2002 • http://image.thelancet.com/extras/01art9092web.pdf 3
Cross-sectional analysis Longitudinal analysis
People who developed People who did not p People who developed People who did not ppsychosis (n=23) develop psychosis (n=52) psychosis (n=10) develop psychosis (n=11)
Sex (male/female) 13/10 30/22 0·93 3/7 4/7 0·76Age at baseline (years) 19·3 (3·7) 21·6 (3·3) 0·009 18·9 (4·5) 20·5 (3·7) 0·29Age at second scan (years) ·· ·· ·· 20·0 (4·5) 22·3 (4·0) 0·14NART-estimated premorbid IQ 94·3 (11·9) 95·8 (14·5) 0·70 89·9 (12·1) 94·0 (14·7) 0·594at baseline*Time between scans (days) ·· ·· ·· 374 (180) 637 (382) 0·04Days between baseline scan 200 (215) ·· ·· 172 (213) ·· ··and onset of psychosisDays between onset of ·· ·· ·· 202 (74) ·· ··psychosis and follow-up scanDuration of symptoms (days)† 662 (788) 509 (884) 0·22 610 (570) 318 (498) 0·27BPRS at intake 20·1 (7·8) 19·4 (8·4) 0·73 20·3 (4·9) 19·1 (10·5) 0·70SANS at intake 29·6 (16·3) 24·4 (14·9) 0·18 27·6 (15·8) 22·0 (10·0) 0·57
Data are mean (SD) unless otherwise stated. *Ten people (six with psychosis and four without) did not have NART data available at baseline. †Two people (one withpsychosis and one without) did not have symptom-duration data available.
Table 1: Demographic data for the two groups of people
Z=–12·0 Z=–9·0 Z=–6·0 Z=–3·0
Z=–18·0 Z=–15·0Z=–21·0Z=–24·0Z=–27·0Z=–30·0
Z=0·0 Z=3·0
Z=6·0 Z=9·0 Z=12·0 Z=15·0 Z=18·0 Z=21·0
Z=24·0 Z=27·0 Z=30·0 Z=33·0 Z=36·0 Z=39·0
R L
Figure 1: Grey-matter probability maps for baseline comparison of people who developed psychosis with those who did notRed regions denote areas of reduced grey-matter volume in people who developed psychosis. Images are presented in standard radiological fashion, whereright is left and vice versa. Z coordinate shows position of each slice with respect to the Talairach atlas. Clusterwise probability of type I error, p<0·004,meaning less than one false-positive test is expected over the whole map.
For personal use. Only reproduce with permission from The Lancet Publishing Group.
individual’s PD-weighted image onto this template was thenapplied identically to each of that person’s four tissue-classprobability maps to register them in standard space at thesame voxel size as the original acquisition.
Statistical analysisWe estimated between-group differences in grey-mattervolume by fitting an analysis of covariance (ANCOVA)model at each intracerebral voxel in standard space, whichincluded age at scan and global grey-matter volume ascovariates. We assessed within-group differences in greymatter with repeated-measures ANCOVA, also with globalgrey-matter volume and time between scans as covariates.Interaction terms (group by follow-up) were investigated toassess which areas showed significant differential changesbetween the groups over time (with time between scans andglobal grey-matter volume as covariates). In both cases, wemodelled the effects of the covariates as simple linear effectson the grounds of parsimony.
We tested the null hypothesis by permutation at clusterlevel, as described in detail elsewhere.12 In brief, a map ofthe standardised ANCOVA model coefficient of interest (�)at each voxel was thresholded such that if �>2(Prob(�)<0·05, approximately) the voxel value was set to�−2, otherwise the voxel value was set to zero. Thisprocedure generates a set of suprathreshold voxel clusters inthree dimensions, each of which can be described in termsof its mass, or the sum of suprathreshold voxel statistics itcomprises. The mass of each cluster was tested against anull distribution ascertained by repeated randompermutation of the relevant factor in the ANCOVA model;refitting of the model and estimation of standardisedcoefficients at each voxel; and thresholding of the permuted coefficient maps to generate a set of 3-dimensional suprathreshold voxel clusters under the nullhypothesis. The rationale for this non-parametric mode ofinference is that test statistics for image analysis, whichincorporate spatial information such as 3-dimensionalcluster mass, are generally more powerful than otherpossible test statistics, such as �, which are informed only bydata at a single voxel. Yet theoretical approximations to thenull distribution of spatial statistics estimated in imagingdata might be over-conservative or intractable.12 Here, wehave consistently used probability thresholds for clusterwisetesting such that the expected number of false-positive testsfor each map is less than one.
Significant foci were anatomically localised with thestandard atlas of Talairach and Tournoux,13 except for fociclose to the cerebellum where we used the atlas ofSchmahmann and colleagues,14 because the Talairach atlasdoes not show great anatomical detail in the cerebellarregion.
Role of the funding sourceThe sponsor of the study had no role in study design, datacollection, data analysis, data interpretation, or writing ofthe report.
ResultsWe enrolled 75 people for the cross-sectionalcomparison. All participants were aged 14–30 years andhad never had an episode of frank psychosis. Of these,23 (31%) developed psychosis during follow-up, 18within 12 months and a further five within 24 months.The remaining 52 (69%) did not develop psychosisduring the follow-up period. Follow-up was for at least12 months: 67 (89%) people were reassessed between 12and 18 months; maximum follow-up was 44 months.The groups did not differ by sex, baseline BPRS, SANS,or NART score, duration of symptoms, or totalcorrected brain volume (table 1). However, participantswho developed psychosis were significantly younger thanthose who did not develop this disorder (p=0·009).
In the 23 people who developed psychosis, thedisorders were: schizophrenia (n=8); schizoaffectivedisorder (2); brief psychotic episode (1); psychosis nototherwise specified (1); bipolar disorder with psychoticfeatures (6); and major depression with moodincongruent psychotic disorder (4). One individualdeveloped a psychosis with affective features (SCIDdiagnosis unavailable). 28 (54%) of 52 individuals whodid not develop a psychosis had no psychiatric diagnosisat follow-up. Of those who did meet criteria for apsychiatric disorder (n=24), 11 had a mood disorder(five with major depressive disorder; six withdysthymia); eight had an anxiety disorder (four socialphobia; two general anxiety disorder; two panicdisorder); three had obsessive-compulsive disorder; onehad an eating disorder; and one had adjustmentdisorder.
21 (28%) of the 75 participants were included in thelongitudinal comparison. These individuals wererepresentative of the larger pool of ultra high-risk peoplewe scanned at baseline in terms of all demographic andclinical variables (age, height, IQ, duration of symptoms,and BPRS and SANS ratings), apart from sex (morefemales than in the original group, p=0·012), and theydid not differ for whole brain volume. Ten (48%) of the21 participants became psychotic during follow-up, and11 did not (table 1).
The diagnostic breakdown of psychotic disorders inpatients rescanned in the longitudinal comparison (asdefined with the SCID) was: schizophrenia (n=5);schizoaffective disorder (1); brief psychotic episode (1);psychosis not otherwise specified (1); manic episodewith psychotic features (1); and major depression withmood incongruent psychotic disorder (1). Six of 11 people who were not psychotic when rescanned in thelongitudinal comparison had no psychiatric diagnosis atfollow-up, whereas the remaining five were diagnosedwith major depressive disorder, dysthymia, generalisedanxiety disorder, eating disorder, and obsessive-compulsive disorder.
Most participants did not receive antipsychotic drugs,either before onset of psychosis (in those who developed
ARTICLES
4 THE LANCET • Published online December 10, 2002 • http://image.thelancet.com/extras/01art9092web.pdf
Left or right Brodmann’s area Talairach coordinates of voxel of maximum significance Size in voxels
x y z
Area Hippocampus, parahippocampus, R 28/35/36/38 29 –24 –17 270and surrounding cortexSuperior temporal gyrus and temporal pole R 12/22/38 49 2 –11 300Inferior frontal gyrus, ventrolateral prefrontal R 44/45/47 32 18 –9 1428cortex, and basal gangliaAnterior and posterior cingulate L/R 23/24/29/31/32 2 –29 28 2222
Table 2: Talairach coordinates and Brodmann’s areas for regions of reduced grey-matter volume in people in the cross-sectionalcomparison who developed psychosis
For personal use. Only reproduce with permission from The Lancet Publishing Group.
psychosis) or by time of second MRI scan (in those withoutpsychosis), except for three without psychosis and two withthe disorder, who received 1–2 mg risperidone for up to 6months after baseline scan. After onset of psychosis, allpatients but one received atypical antipsychotic drugs (ninepatients were treated with 1–3 mg risperidone, one receivedtrifluoperazine). One patient who was treated withrisperidone did not adhere to treatment.
In the longitudinal comparison, participants who did ordid not develop psychosis did not differ by age, sex,premorbid IQ, or baseline symptom ratings. However, theinterval between scans was significantly longer for the ultrahigh-risk people who did not develop psychosis. The timebetween scans was therefore used as a covariate to removeany potential effects of differences in the interscan interval(table 1). A secondary analysis with age as the covariate didnot substantially change these results.
In the cross-sectional comparison,participants who subsequentlydeveloped psychosis had smaller grey-matter volumes at baseline in fourregions than those who did not developpsychosis (figure 1, table 2; p<0·004).These regions comprised: a rightmedial temporal region, whichincluded the hippocampus, andparahippocampal cortex; a right lateraltemporal region, encompassing thesuperior temporal gyrus and temporalregion; a right inferior frontal region,which included the orbital portion ofthe inferior frontal gyrus and theadjacent parts of the insula and basalganglia; and a cingulate region, whichincluded the anterior and posteriorcingulate gyrus bilaterally. At a lessconservative statistical threshold(p<0·01), participants who subse-quently developed psychosis alsoshowed smaller grey-matter volumes inthe left homologues of the first threeregions, and in the dorsolateralprefrontal cortex.
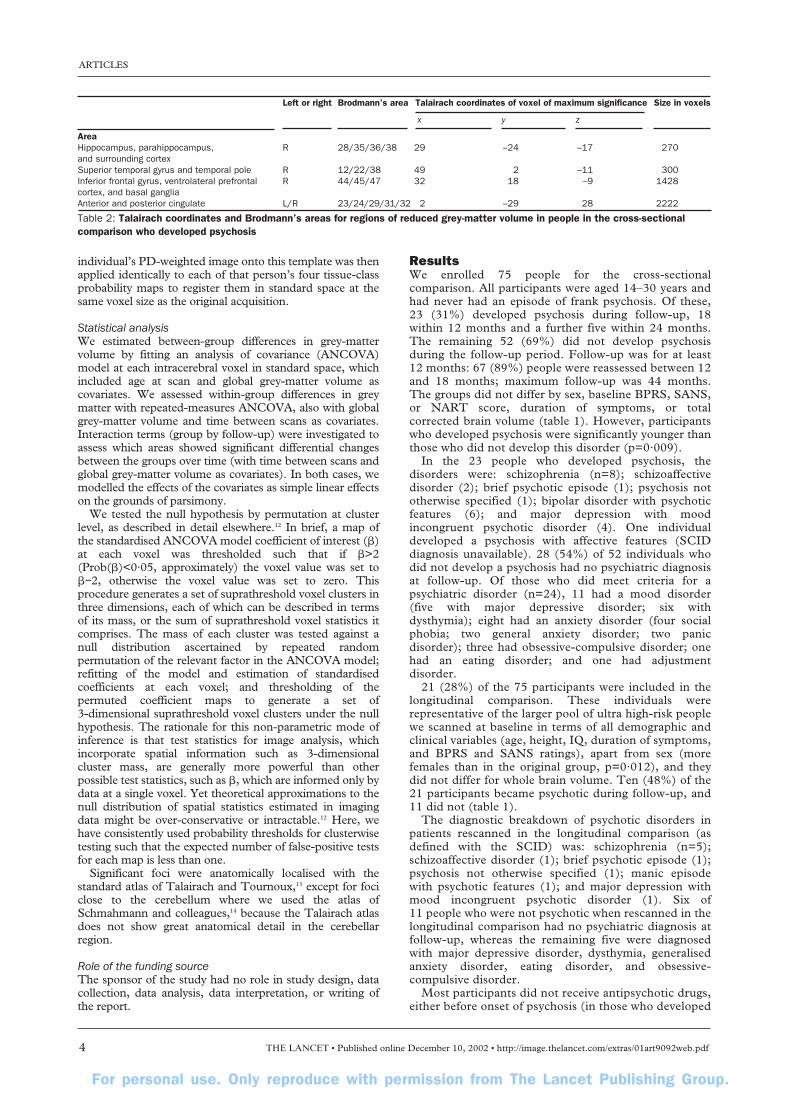
In the longitudinal comparison, in people who developed psychosis, a significant bilateral reduction (p<0·003) in grey-matter volume wasnoted between the baseline and follow-up MRI scans in the cingulate gyri.Further reductions in grey-mattervolume were evident in the left para-hippocampal gyrus, left fusiform gyrus,the left orbitofrontal cortex, and oneregion in the left cerebellar cortex
(figure 2; table 3). One area of increased volume wasrecorded, in the right cuneus.
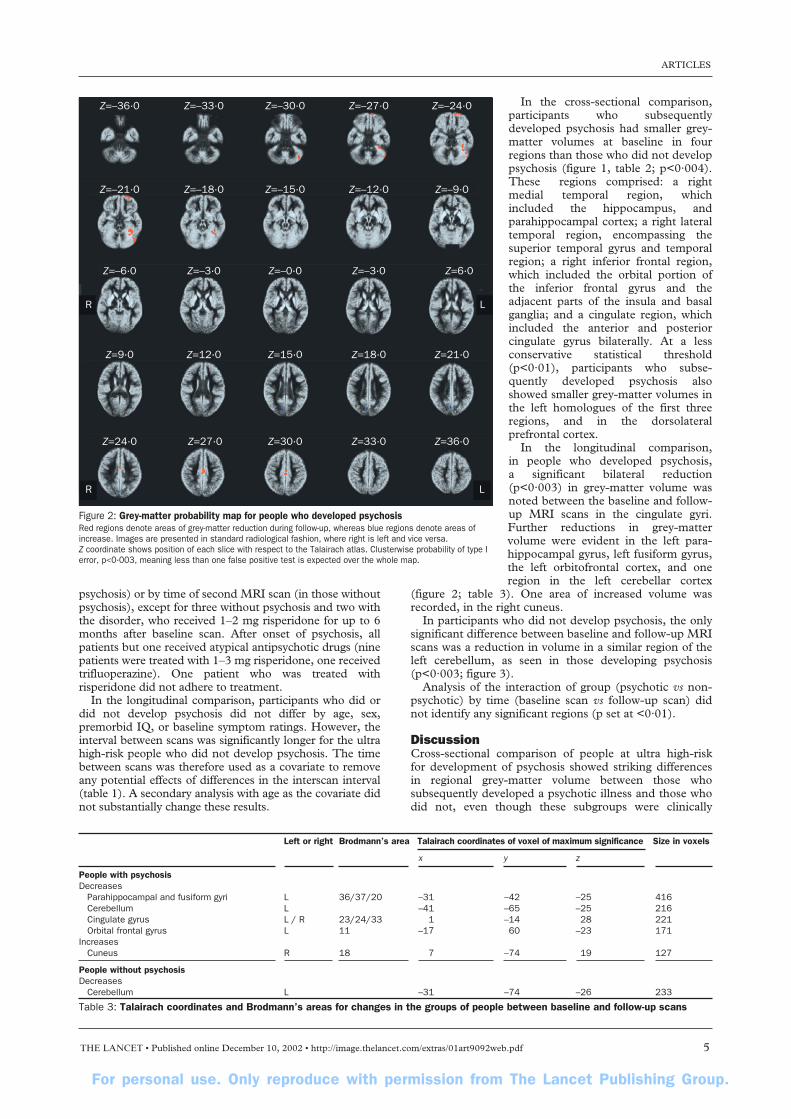
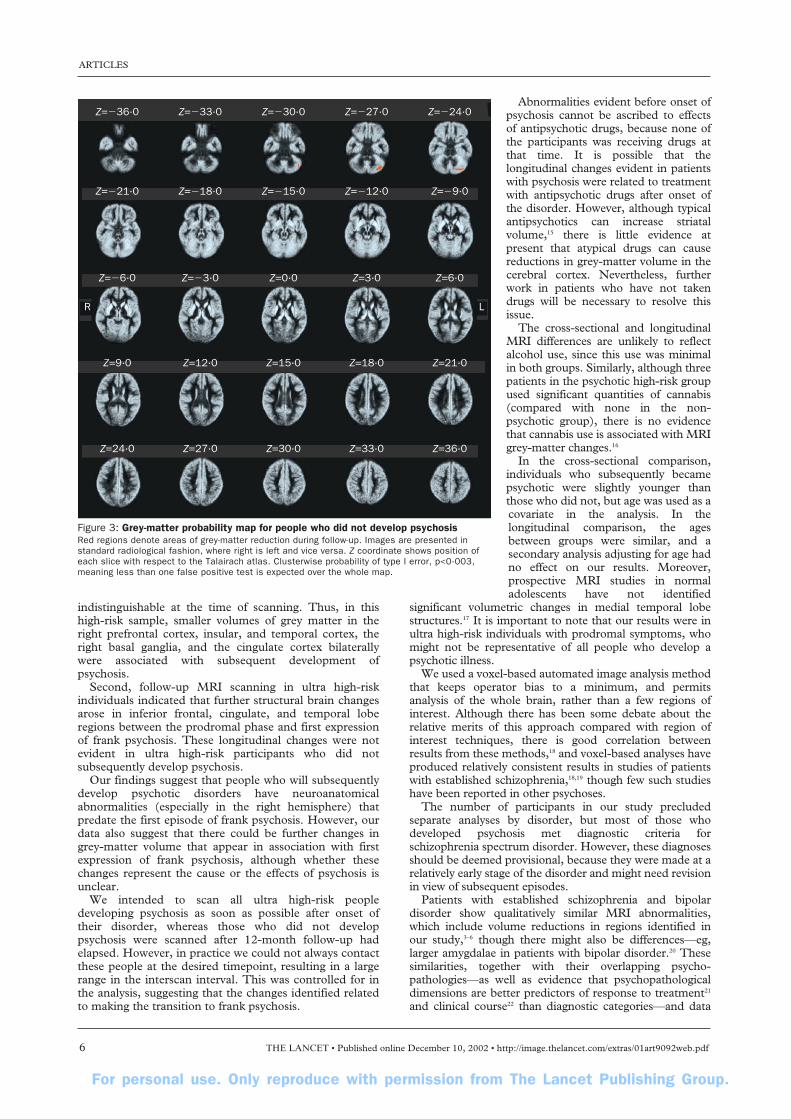
In participants who did not develop psychosis, the onlysignificant difference between baseline and follow-up MRIscans was a reduction in volume in a similar region of theleft cerebellum, as seen in those developing psychosis (p<0·003; figure 3).
Analysis of the interaction of group (psychotic vs non-psychotic) by time (baseline scan vs follow-up scan) didnot identify any significant regions (p set at <0·01).
DiscussionCross-sectional comparison of people at ultra high-risk for development of psychosis showed striking differencesin regional grey-matter volume between those whosubsequently developed a psychotic illness and those whodid not, even though these subgroups were clinically
ARTICLES
THE LANCET • Published online December 10, 2002 • http://image.thelancet.com/extras/01art9092web.pdf 5
Z=–33·0Z=–36·0 Z=–30·0 Z=–27·0 Z=–24·0
Z=–21·0 Z=–18·0 Z=–12·0Z=–15·0 Z=–9·0
Z=–6·0 Z=6·0Z=–3·0Z=–3·0 Z=–0·0
Z=9·0 Z=12·0 Z=15·0 Z=18·0 Z=21·0
Z=24·0 Z=27·0 Z=30·0 Z=33·0 Z=36·0
R L
R L
Left or right Brodmann’s area Talairach coordinates of voxel of maximum significance Size in voxels
x y z
People with psychosisDecreases
Parahippocampal and fusiform gyri L 36/37/20 –31 –42 –25 416Cerebellum L –41 –65 –25 216Cingulate gyrus L / R 23/24/33 1 –14 28 221Orbital frontal gyrus L 11 –17 60 –23 171
IncreasesCuneus R 18 7 –74 19 127
People without psychosisDecreases
Cerebellum L –31 –74 –26 233
Table 3: Talairach coordinates and Brodmann’s areas for changes in the groups of people between baseline and follow-up scans
Figure 2: Grey-matter probability map for people who developed psychosisRed regions denote areas of grey-matter reduction during follow-up, whereas blue regions denote areas ofincrease. Images are presented in standard radiological fashion, where right is left and vice versa.Z coordinate shows position of each slice with respect to the Talairach atlas. Clusterwise probability of type Ierror, p<0·003, meaning less than one false positive test is expected over the whole map.
For personal use. Only reproduce with permission from The Lancet Publishing Group.
indistinguishable at the time of scanning. Thus, in thishigh-risk sample, smaller volumes of grey matter in theright prefrontal cortex, insular, and temporal cortex, theright basal ganglia, and the cingulate cortex bilaterallywere associated with subsequent development ofpsychosis.
Second, follow-up MRI scanning in ultra high-riskindividuals indicated that further structural brain changesarose in inferior frontal, cingulate, and temporal loberegions between the prodromal phase and first expressionof frank psychosis. These longitudinal changes were notevident in ultra high-risk participants who did notsubsequently develop psychosis.
Our findings suggest that people who will subsequentlydevelop psychotic disorders have neuroanatomicalabnormalities (especially in the right hemisphere) thatpredate the first episode of frank psychosis. However, ourdata also suggest that there could be further changes ingrey-matter volume that appear in association with firstexpression of frank psychosis, although whether thesechanges represent the cause or the effects of psychosis isunclear.
We intended to scan all ultra high-risk peopledeveloping psychosis as soon as possible after onset oftheir disorder, whereas those who did not developpsychosis were scanned after 12-month follow-up hadelapsed. However, in practice we could not always contactthese people at the desired timepoint, resulting in a largerange in the interscan interval. This was controlled for inthe analysis, suggesting that the changes identified relatedto making the transition to frank psychosis.
Abnormalities evident before onset ofpsychosis cannot be ascribed to effectsof antipsychotic drugs, because none ofthe participants was receiving drugs atthat time. It is possible that thelongitudinal changes evident in patientswith psychosis were related to treatmentwith antipsychotic drugs after onset ofthe disorder. However, although typicalantipsychotics can increase striatalvolume,15 there is little evidence atpresent that atypical drugs can causereductions in grey-matter volume in thecerebral cortex. Nevertheless, furtherwork in patients who have not takendrugs will be necessary to resolve thisissue.
The cross-sectional and longitudinalMRI differences are unlikely to reflectalcohol use, since this use was minimalin both groups. Similarly, although threepatients in the psychotic high-risk groupused significant quantities of cannabis(compared with none in the non-psychotic group), there is no evidencethat cannabis use is associated with MRIgrey-matter changes.16
In the cross-sectional comparison,individuals who subsequently becamepsychotic were slightly younger thanthose who did not, but age was used as acovariate in the analysis. In thelongitudinal comparison, the agesbetween groups were similar, and asecondary analysis adjusting for age hadno effect on our results. Moreover,prospective MRI studies in normaladolescents have not identified
significant volumetric changes in medial temporal lobestructures.17 It is important to note that our results were inultra high-risk individuals with prodromal symptoms, whomight not be representative of all people who develop apsychotic illness.
We used a voxel-based automated image analysis methodthat keeps operator bias to a minimum, and permitsanalysis of the whole brain, rather than a few regions ofinterest. Although there has been some debate about therelative merits of this approach compared with region ofinterest techniques, there is good correlation betweenresults from these methods,18 and voxel-based analyses haveproduced relatively consistent results in studies of patientswith established schizophrenia,18,19 though few such studieshave been reported in other psychoses.
The number of participants in our study precludedseparate analyses by disorder, but most of those whodeveloped psychosis met diagnostic criteria forschizophrenia spectrum disorder. However, these diagnosesshould be deemed provisional, because they were made at arelatively early stage of the disorder and might need revisionin view of subsequent episodes.
Patients with established schizophrenia and bipolardisorder show qualitatively similar MRI abnormalities,which include volume reductions in regions identified inour study,3–6 though there might also be differences—eg,larger amygdalae in patients with bipolar disorder.20 Thesesimilarities, together with their overlapping psycho-pathologies—as well as evidence that psychopathologicaldimensions are better predictors of response to treatment21
and clinical course22 than diagnostic categories—and data
ARTICLES
6 THE LANCET • Published online December 10, 2002 • http://image.thelancet.com/extras/01art9092web.pdf
R L
Z=�36·0 Z=�33·0 Z=�30·0 Z=�27·0 Z=�24·0
Z=�21·0 Z=�18·0 Z=�15·0 Z=�12·0 Z=�9·0
Z=�6·0 Z=�3·0 Z=0·0 Z=3·0 Z=6·0
Z=9·0 Z=12·0 Z=15·0 Z=18·0 Z=21·0
Z=24·0 Z=27·0 Z=30·0 Z=33·0 Z=36·0
Figure 3: Grey-matter probability map for people who did not develop psychosisRed regions denote areas of grey-matter reduction during follow-up. Images are presented instandard radiological fashion, where right is left and vice versa. Z coordinate shows position ofeach slice with respect to the Talairach atlas. Clusterwise probability of type I error, p<0·003,meaning less than one false positive test is expected over the whole map.

For personal use. Only reproduce with permission from The Lancet Publishing Group.
suggesting cosegregation of familial risk for schizophreniaand bipolar disorder23 have prompted some authorities toconclude that these disorders form part of a continuum ofpsychosis.24 Our results could thus inform ourunderstanding of psychosis in general and be relevant toboth schizophrenia and bipolar disorder. Further work willbe necessary to investigate the extent to which the findingsare associated with specific psychotic disorders.
At baseline, reduced grey-matter volumes were noted inindividuals who later went on to develop psychosis in theprefrontal, cingulate, and to a lesser extent, temporalcortex. These regions have consistently been implicated inneuroimaging,3–6,19,25 neuropsychological,26 and neuropath-ological studies27 of patients with psychosis. Neuroimagingabnormalities in these regions have also been described inpeople at increased risk of psychosis for other reasons, suchas the probands of monozygotic twin pairs discordant forschizophrenia,28 first-degree relatives of patients withpsychosis,7 and individuals with schizotypal personalitydisorder.29
The main areas of the brain that showed longitudinalchanges in patients who developed psychosis were the leftmedial temporal and the left orbitofrontal cortices, andbilaterally in the cingulate cortex, with the most extensivechanges in the left medial temporal region. All these regionshave been implicated in psychotic disorders, and meta-analyses of neuroimaging studies suggest that the medialtemporal region is the site of the most robust abnormalitiesin schizophrenia.25 Although there is also evidence that thecerebellum is implicated in schizophrenia,25,30 thelongitudinal differences in the left cerebellum were noted inpeople with and without psychosis, suggesting that thischange was not related to onset of the disorder. Thefindings in the cuneus were not predicted and are difficultto interpret, although this region has been shown to behypoactive in functional imaging studies of schizophrenia.30
Our data suggest that progressive changes in psychosiscould arise at different sites to areas in which non-progressive abnormalities are seen. This finding accordswith data from Cannon and colleagues,28 who reported thatthe genetic vulnerability to schizophrenia in twins wasassociated with reduced prefrontal cortical thickness,whereas the psychotic phenotype was associated withreduced thickness in temporal and parietal cortex. Anassociation between temporal abnormalities and expressionof psychosis would also accord with data from cross-sectional comparisons of first-episode psychotic and high-risk groups.7,9 These observations, and our data, suggestthat volumetric changes might develop in certain corticalregions, such as the medial temporal lobe, during thetransition to psychosis. Whether these changes representloss of grey matter or changes in the biochemicalcomposition of the tissue cannot be established from ourstudy, and would need to be investigated with othertechniques.
It is important to note that although the cross-sectionalMRI differences we noted between ultra high-riskindividuals who did and did not subsequently developpsychosis suggest that some neuroanatomical abnormalitiespredate expression of psychosis, they could also haveresulted from an earlier progressive process. However, thispossibility seems unlikely, because the duration ofprodromal symptoms at the time of the baseline scan didnot differ between the groups who did and did not go on todevelop psychosis. This issue could be clarified further byserial examination of individuals within the prodromalphase.
Our cross-sectional data raise the possibility that MRI orother investigations could help to distinguish ultra high-
risk people who will subsequently develop psychosis fromthose who will not, although at present it is still too early tosay whether MRI will prove to be usable as a diagnostictool. The fact that progressive changes might be happeningbefore onset of frank psychotic symptoms has importantimplications for treatment of psychotic disorders. Atpresent, treatment is normally withheld until the clinicianis confident that the patient has a psychotic disorder,although there is evidence that the longer the delay beforeinitiating treatment, the poorer the prognosis.31 Our datasuggest that neuroanatomical changes might be happeningbefore or during the transition to psychosis, raising thepossibility that intervention might be indicated beforeexpression of frank psychotic symptoms,32 and might havean effect on the underlying pathological process.
ContributorsC Pantelis, D Velakoulis, S J Wood, and P D McGorry had a role instudy design, supervision of staff involved in data collection at all stages,data analysis, and drafting of the report. L J Phillips, A R Yung, and W Brewer assessed all participants clinically, coordinated MRI scanning,and participated at all stages of development of the final report. P Desmond was the radiologist involved in MRI scanning, reported onall scans, and assisted with the report. B Soulsby undertook theautomated analysis in close collaboration with J Suckling and E T Bullmore, and commented on various drafts of the report. J Suckling, E T Bullmore, and P K McGuire were involved in design,analysis, and drafting of the final report. All co-authors have seen andapproved the final version of the report.
Conflict of interest statementNone declared.
AcknowledgmentsThis research, and the clinical research structure of the personalassessment and crisis evaluation (PACE) clinic in Melbourne, Australia,was supported by project grants from the National Health and MedicalResearch Council (NHMRC; grant ID numbers 970598 and 970391);Victorian Health Promotion Foundation; the Stanley Foundation, Ian Potter Foundation; and Woods Family Trust. D Velakoulis and S J Wood were supported as Research Officers with funding from theNHMRC. P D McGorry was supported by a National Alliance forResearch on Schizophrenia and Depression distinguished investigatoraward, and E T Bullmore was supported by the Wellcome Trust.
References1 McGorry PD, Copolov DL, Singh BS. Current concepts in
functional psychosis: the case for a loosening of associations.Schizophr Res 1990; 3: 221–34.
2 Weinberger DR, McClure RK. Neurotoxicity, neuroplasticity, andmagnetic resonance imaging morphometry: what is happening in theschizophrenic brain? Arch Gen Psychiatry 2002; 59: 553–58.
3 Elkis H, Friedman L, Wise A, Meltzer HY. Meta-analyses of studiesof ventricular enlargement and cortical sulcal prominence in mooddisorders: comparisons with controls or patients with schizophrenia.Arch Gen Psychiatry 1995; 52: 735–46.
4 Videbech P. MRI findings in patients with affective disorder: a meta-analysis. Acta Psychiatr Scand 1997; 96: 157–68.
5 Roy PD, Zipursky RB, Saint-Cyr JA, Bury A, Langevin R, Seeman MV. Temporal horn enlargement is present in schizophreniaand bipolar disorder. Biol Psychiatry 1998; 44: 418–22.
6 Velakoulis D, Pantelis C, McGorry PD, et al. Hippocampal volumein first-episode psychoses and chronic schizophrenia: a high-resolution magnetic resonance imaging study. Arch Gen Psychiatry1999; 56: 133–40.
7 Lawrie SM, Whalley H, Kestelman JN, et al. Magnetic resonanceimaging of brain in people at high risk of developing schizophrenia.Lancet 1999; 353: 30–33.
8 Wood SJ, Velakoulis D, Smith D, et al. A longitudinal study ofhippocampal volume in first episode psychosis and chronicschizophrenia. Schizophr Res 2001; 52: 37–46.
9 Phillips LJ, Velakoulis D, Pantelis C, et al. Non-reduction inhippocampal volume is associated with higher risk of psychosis.Schizophr Res 2002; 58: 145–58.
10 Yung AR, Phillips LJ, McGorry PD, et al. Prediction of psychosis: astep towards indicated prevention of schizophrenia. Br J Psychiatry1998; 172 (suppl 33): 14–20.
11 Suckling J, Sigmundsson T, Greenwood K, Bullmore ET. A modified fuzzy clustering algorithm for operator independent tissue
ARTICLES
THE LANCET • Published online December 10, 2002 • http://image.thelancet.com/extras/01art9092web.pdf 7
For personal use. Only reproduce with permission from The Lancet Publishing Group.
classification of dual echo MR images. Magn Reson Imaging 1999;17: 1065–76.
12 Bullmore ET, Suckling J, Overmeyer S, Rabe-Hesketh S, Taylor E,Brammer M. Global, voxel and cluster tests, by theory andpermutation for a difference between two groups of structural MR images of the brain. IEEE Trans Med Imaging 1999; 18: 32–42.
13 Talairach J, Tournoux P. Co-planar stereotaxic atlas of the humanbrain. New York: Thieme Medical Publishers, 1988.
14 Schmahmann JD, Doyon J, McDonald D, et al. Three-dimensionalMRI atlas of the human cerebellum in proportional stereotaxicspace. Neuroimage 1999; 10: 233–60.
15 Keshavan MS, Bagwell WW, Haas GL, Sweeney JA, Schooler NR,Pettegrew JW. Changes in caudate volume with neuroleptictreatment. Lancet 1994; 344: 1434.
16 Aasly J, Storsaeter O, Nilsen G, Smevik O, Rinck P. Minorstructural brain changes in young drug abusers: a magneticresonance study. Acta Neurol Scand 1993; 87: 210–14.
17 Rapoport JL, Giedd JN, Blumenthal J, et al. Progressive corticalchange during adolescence in childhood-onset schizophrenia: alongitudinal magnetic resonance imaging study. Arch Gen Psychiatry1999; 56: 649–54.
18 Wright IC, Ellison Z, Sharma T, Friston KJ, Murray RM, McGuire PK. Mapping of grey matter changes in schizophrenia.Schizophr Res 1999; 35: 1–14.
19 Sigmundsson T, Suckling J, Maier M, et al. Structural abnormalitiesin frontal, temporal, and limbic regions and interconnecting whitematter tracts in schizophrenic patients with prominent negativesymptoms. Am J Psychiatry 2001; 158: 234–43.
20 Altshuler LL, Bartzokis G, Grieder T, et al. An MRI study oftemporal lobe structures in men with bipolar disorder orschizophrenia. Biol Psychiatry 2000; 48: 147–62.
21 Johnstone EC, Frith CD, Crow TJ, et al. The Northwick Park‘functional’ psychosis study: diagnosis and outcome. Psychol Med1992; 22: 331–46.
22 van Os J, Jones P, Sham P, Bebbington P, Murray RM. Psychosis asa continuum of variation in dimensions of psychopathology. In:Haffner H, Gattaz W, eds. Search for the causes of schizophrenia.Berlin: Springer, 1999: 59–80.
23 Cardno AG, Rijsdijk FV, Sham PC, Murray RM, McGuffin P. A twin study of genetic relationships between psychotic symptoms. Am J Psychiatry 2002; 159: 539–45.
24 Crow TJ. Nature of the genetic contribution to psychotic illness: a continuum viewpoint. Acta Psychiatr Scand 1990; 81: 401–08.
25 Wright IC, Rabe-Hesketh S, Woodruff PW, David AS, Murray RM,Bullmore ET. Meta-analysis of regional brain volumes inschizophrenia. Am J Psychiatry 2000; 157: 16–25.
26 Pantelis C, Wood SJ, Maruff P. Schizophrenia. In: Owen AM,Harrison J, eds. Cognitive deficits in brain disorders. London:Martin Dunitz, 2001: 217–48.
27 Harrison PJ. The neuropathology of schizophrenia: a critical review of the data and their interpretation. Brain 1999; 122:593–624.
28 Cannon T, Thompson P, van Erp T, et al. A probabilistic atlas ofcortical gray matter changes in monozygotic twins discordant forschizophrenia. Neuroimage 2001; 13: S1034.
29 Dickey CC, McCarley RW, Voglmaier MM, et al. Schizotypalpersonality disorder and MRI abnormalities of temporal lobe graymatter. Biol Psychiatry 1999; 45: 1393–402.
30 Crespo-Facorro B, Paradiso S, Andreasen NC, et al. Recalling word lists reveals “cognitive dysmetria” in schizophrenia: a positron emission tomography study. Am J Psychiatry 1999; 156:386–92.
31 Wyatt R. Early intervention for schizophrenia: can the course of theillness be altered? Biol Psychiatry 1995; 38: 1–3.
32 McGorry PD, Yung AR, Phillips LJ, et al. Randomized controlledtrial of interventions designed to reduce the risk of progression tofirst-episode psychosis in a clinical sample with sub thresholdsymptoms. Arch Gen Psychiatry 2002; 59: 921–28.
ARTICLES
8 THE LANCET • Published online December 10, 2002 • http://image.thelancet.com/extras/01art9092web.pdf