Embed Size (px)
Citation preview
New bioenergy business concepts during emission trading in the Baltic Sea Region
Pirkko Vesterinen
VTT, Jyväskylä
VTT TECHNICAL RESEARCH CENTRE OF FINLAND
2
PROJECT PARTNERS:VTT Processes, FinlandUniversity of Jyväskylä, FinlandTallinn Technical University, EstoniaFNR, GermanyEC BREC/IBMER, PolandBIOP Institute, GermanyVapo Oy, FinlandAS Tootsi Turvas, Estonia
FINANCERS:INTERREG IIIBNational and local authorities in each country
BI PINSTITUT
VTT TECHNICAL RESEARCH CENTRE OF FINLAND
3
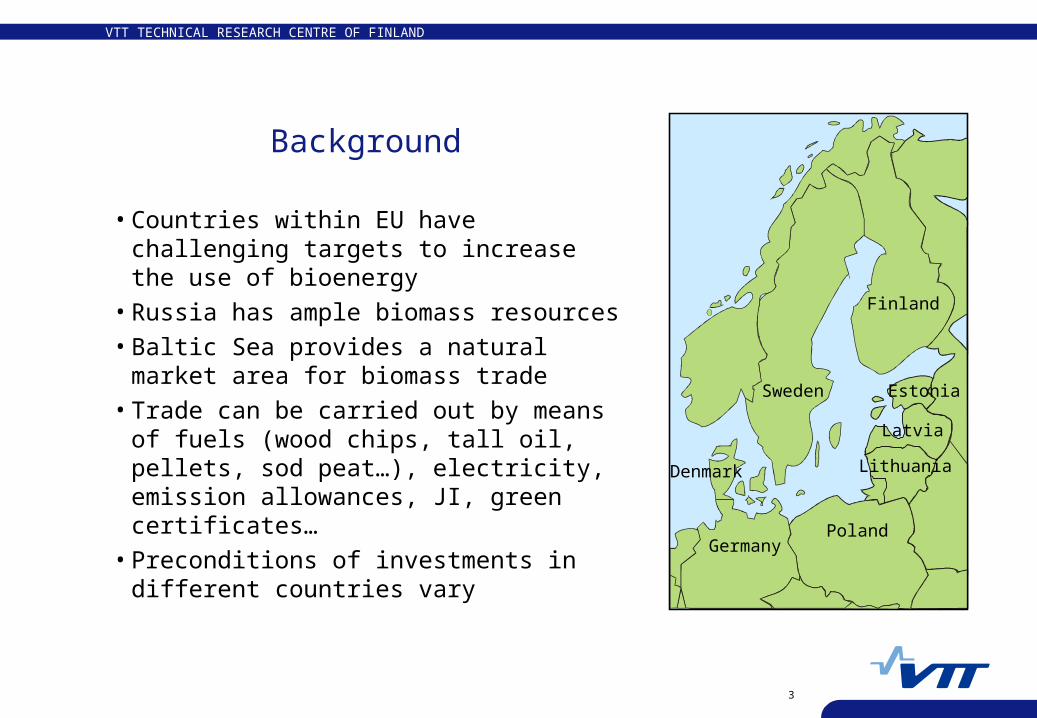
Background
• Countries within EU have challenging targets to increase the use of bioenergy
• Russia has ample biomass resources • Baltic Sea provides a natural market
area for biomass trade• Trade can be carried out by means of
fuels (wood chips, tall oil, pellets, sod peat…), electricity, emission allowances, JI, green certificates…
• Preconditions of investments in different countries vary
Denmark
Finland
Germany
Sweden Estonia
Latvia
Lithuania
Poland
VTT TECHNICAL RESEARCH CENTRE OF FINLAND
4
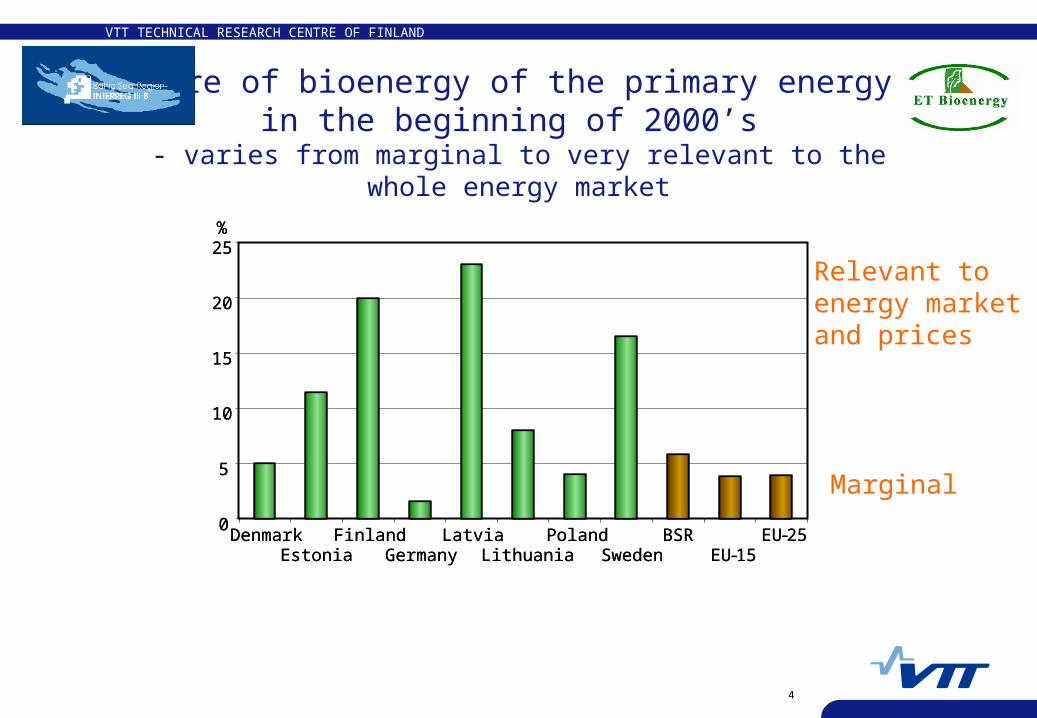
Share of bioenergy of the primary energy in the beginning of 2000’s
- varies from marginal to very relevant to the whole energy market
0
5
10
15
20
25
BSR
%
DenmarkEstonia
FinlandGermany
LatviaLithuania
PolandSweden EU-15
EU-250
5
10
15
20
25
BSR
%
DenmarkEstonia
FinlandGermany
LatviaLithuania
PolandSweden EU-15
EU-25
Marginal
Relevant to energy market and prices
VTT TECHNICAL RESEARCH CENTRE OF FINLAND
5
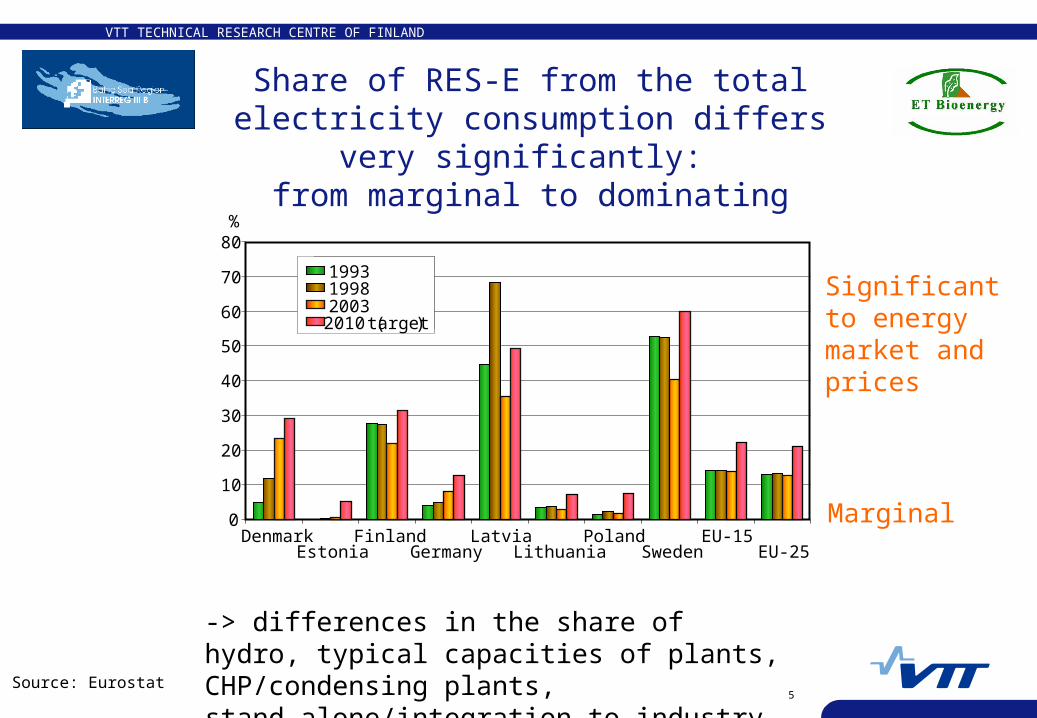
Share of RES-E from the total electricity consumption differs very significantly:
from marginal to dominating
Source: Eurostat
0
10
20
30
40
50
60
70
80
DenmarkEstonia
FinlandGermany
LatviaLithuania
PolandSweden
EU-15EU-25
%
1993199820032010 (target)
1993199820032010 (target)
Marginal
Significant to energy market and prices
-> differences in the share of hydro, typical capacities of plants, CHP/condensing plants, stand-alone/integration to industry
VTT TECHNICAL RESEARCH CENTRE OF FINLAND
6
EU has decided to use of 20 % renewable energy sources by 2020, now the share is under 7 % -
role of bioenergy in each country ?
Background report
VTT TECHNICAL RESEARCH CENTRE OF FINLAND
7
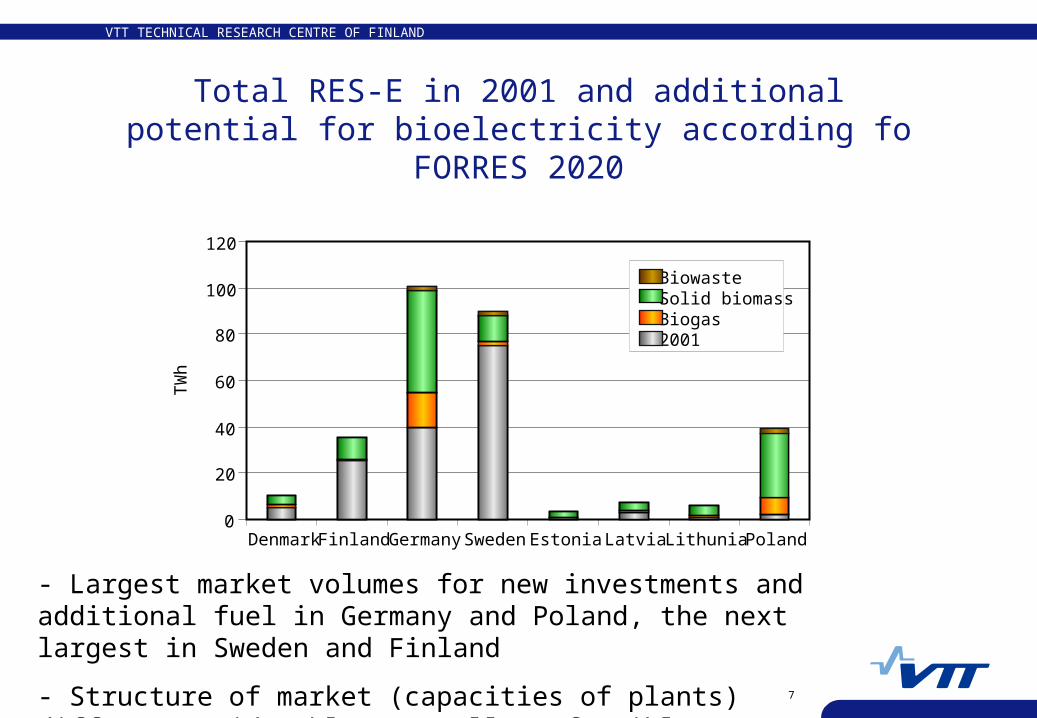
Total RES-E in 2001 and additional potential for bioelectricity according fo FORRES 2020
0
20
40
60
80
100
120
Denmark Finland Germany Sweden Estonia Latvia Lithunia Poland
TW
h
BiowasteSolid biomassBiogas2001
- Largest market volumes for new investments and additional fuel in Germany and Poland, the next largest in Sweden and Finland
- Structure of market (capacities of plants) differs considerably, as well as feasible promotion incentives
VTT TECHNICAL RESEARCH CENTRE OF FINLAND
8
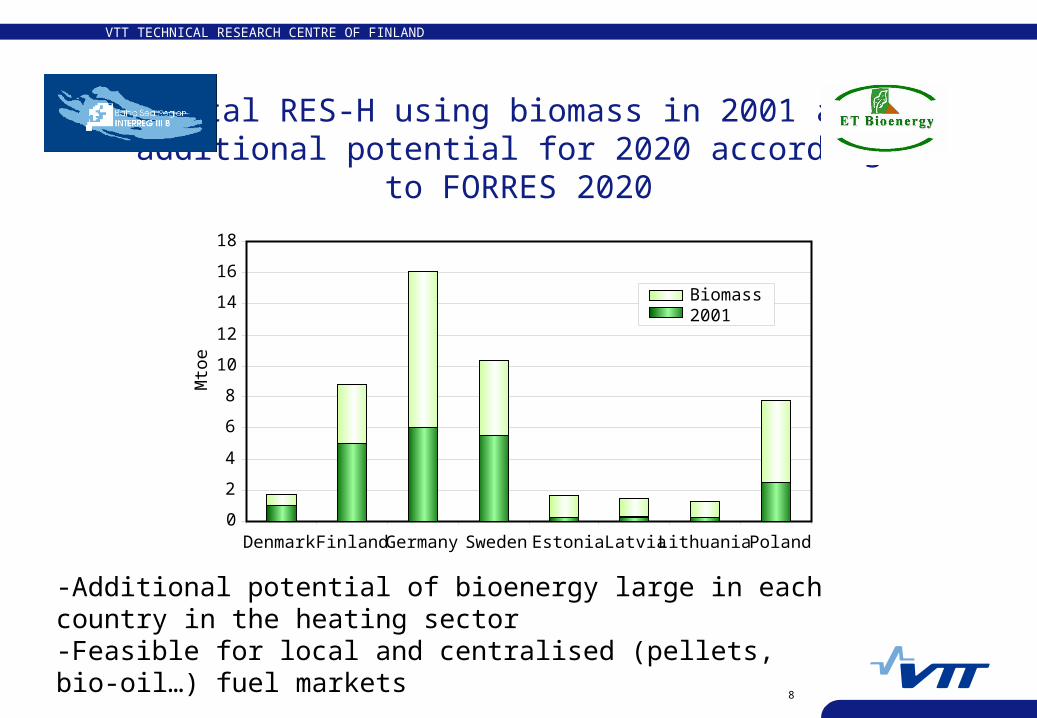
Total RES-H using biomass in 2001 andadditional potential for 2020 according
to FORRES 2020
0
2
4
6
8
10
12
14
16
18
Denmark Finland Germany Sweden Estonia Latvia Lithuania Poland
Mto
e
Biomass2001
-Additional potential of bioenergy large in each country in the heating sector -Feasible for local and centralised (pellets, bio-oil…) fuel markets
VTT TECHNICAL RESEARCH CENTRE OF FINLAND
9
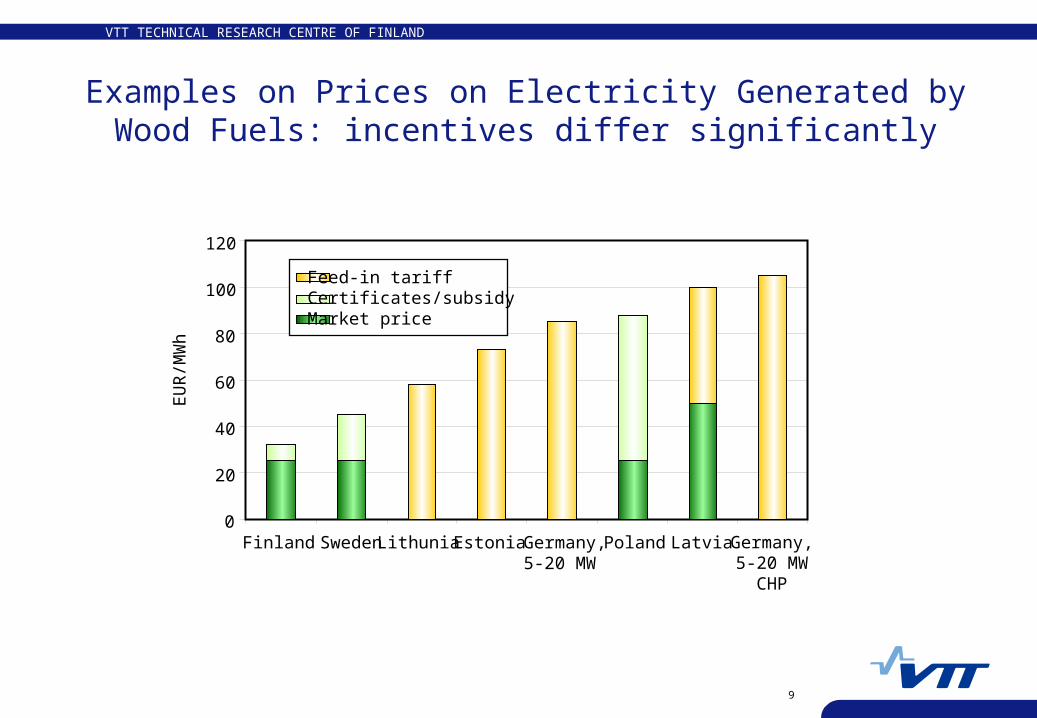
Examples on Prices on Electricity Generated by Wood Fuels: incentives differ significantly
0
20
40
60
80
100
120
Finland Sweden Lithunia Estonia Germany,5-20 MW
Poland Latvia Germany,5-20 MW
CHP
EU
R/M
Wh
Feed-in tariffCertificates/subsidyMarket price
VTT TECHNICAL RESEARCH CENTRE OF FINLAND
10
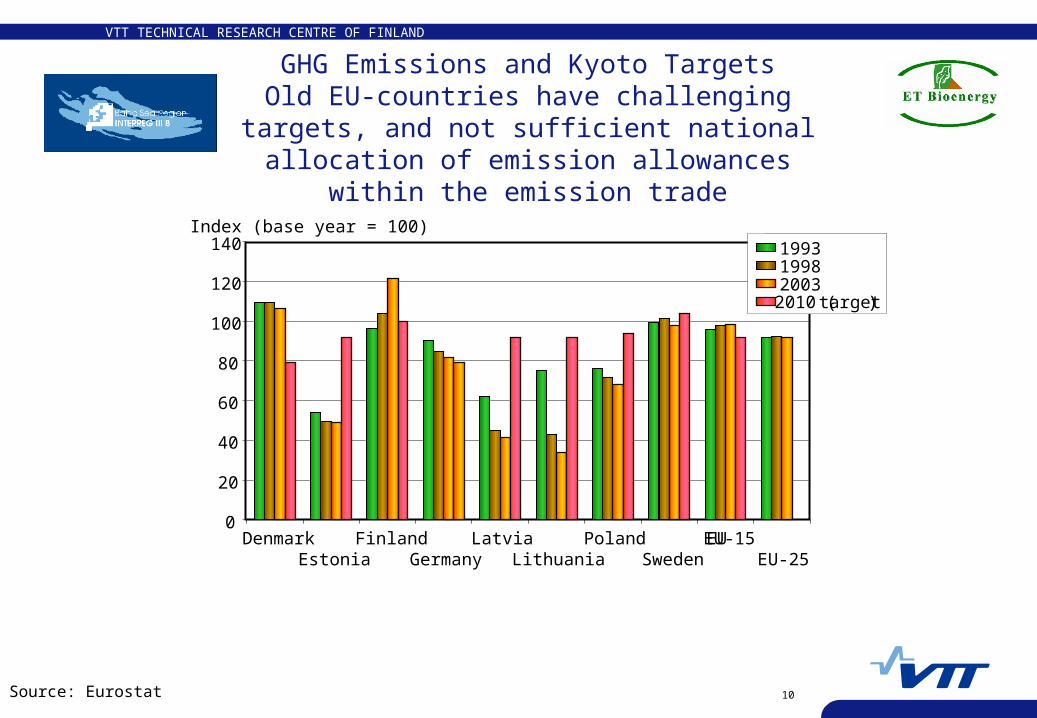
GHG Emissions and Kyoto TargetsOld EU-countries have challenging targets, and not sufficient national allocation of emission allowances
within the emission trade
Source: Eurostat
0
20
40
60
80
100
120
140
EUDenmarkEstonia
FinlandGermany
LatviaLithuania
PolandSweden
EU-15EU-25
Index (base year = 100)1993199820032010 (target)
1993199820032010 (target)
VTT TECHNICAL RESEARCH CENTRE OF FINLAND
11
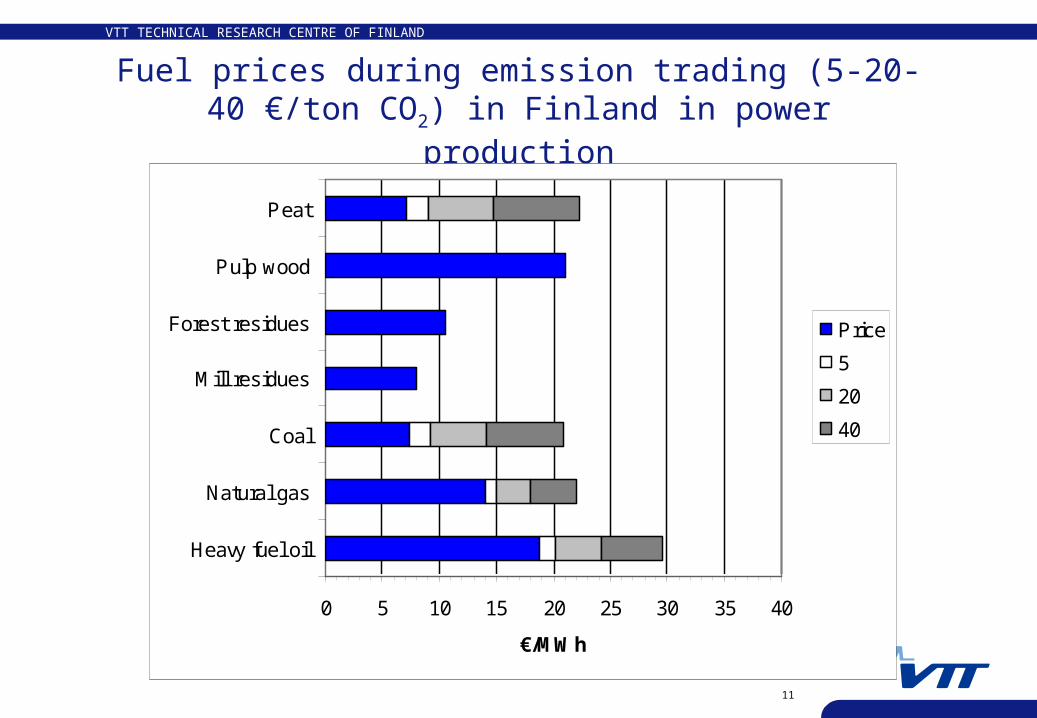
Fuel prices during emission trading (5-20-40 €/ton CO2) in Finland in power production
0 5 10 15 20 25 30 35 40
Heavy fuel oil
Natural gas
Coal
Mill residues
Forest residues
Pulp wood
Peat
€/MWh
Price
5
20
40
VTT TECHNICAL RESEARCH CENTRE OF FINLAND
12
Calculation of production costs of heat and electricity in each country for chosen plants
• Investment estimations for similar plants in each country• Comparison of the heat and electricity production costs
• Case 1: District heating plant, 5 MW, peak load utilization 5000 h/a
• Case 2: CHP plant, 17 MWe / 40 MWth, peak load utilization 6000 h/a
• (Case 3: CHP plant, 3.5 MWe / 16 MWth, peak load utilization 6000 h/a)
VTT TECHNICAL RESEARCH CENTRE OF FINLAND
13
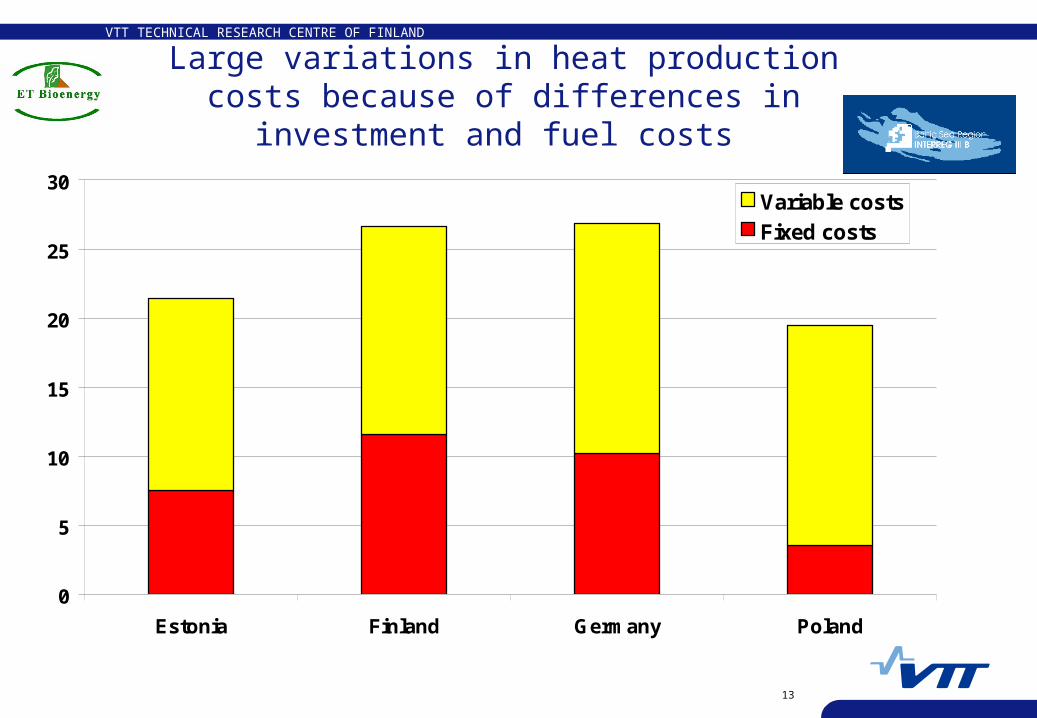
Large variations in heat production costs because of differences in investment and fuel costs
0
5
10
15
20
25
30
Estonia Finland Germany Poland
Variable costs
Fixed costs
EUR/MWh
Heat production costs, 5 MWth, 5000 h/a
VTT TECHNICAL RESEARCH CENTRE OF FINLAND
14
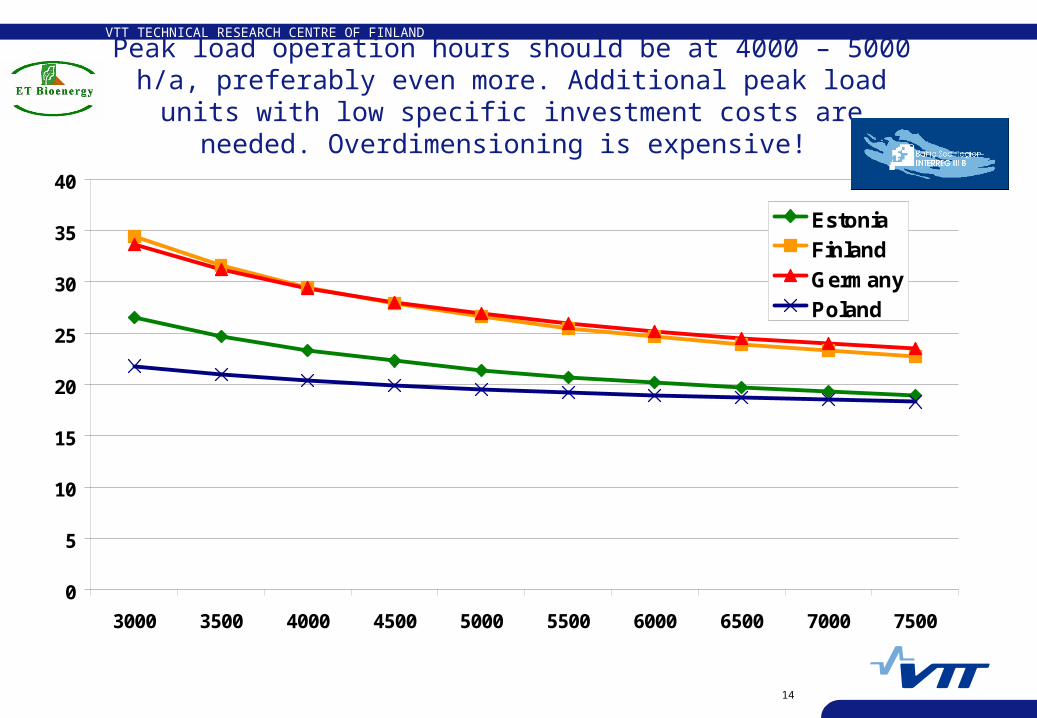
Peak load operation hours should be at 4000 – 5000 h/a, preferably even more. Additional peak load units with low specific investment
costs are needed. Overdimensioning is expensive!
0
5
10
15
20
25
30
35
40
3000 3500 4000 4500 5000 5500 6000 6500 7000 7500
Estonia
Finland
Germany
Poland
EUR/MWh
Peak load utilization, h/a
VTT TECHNICAL RESEARCH CENTRE OF FINLAND
15
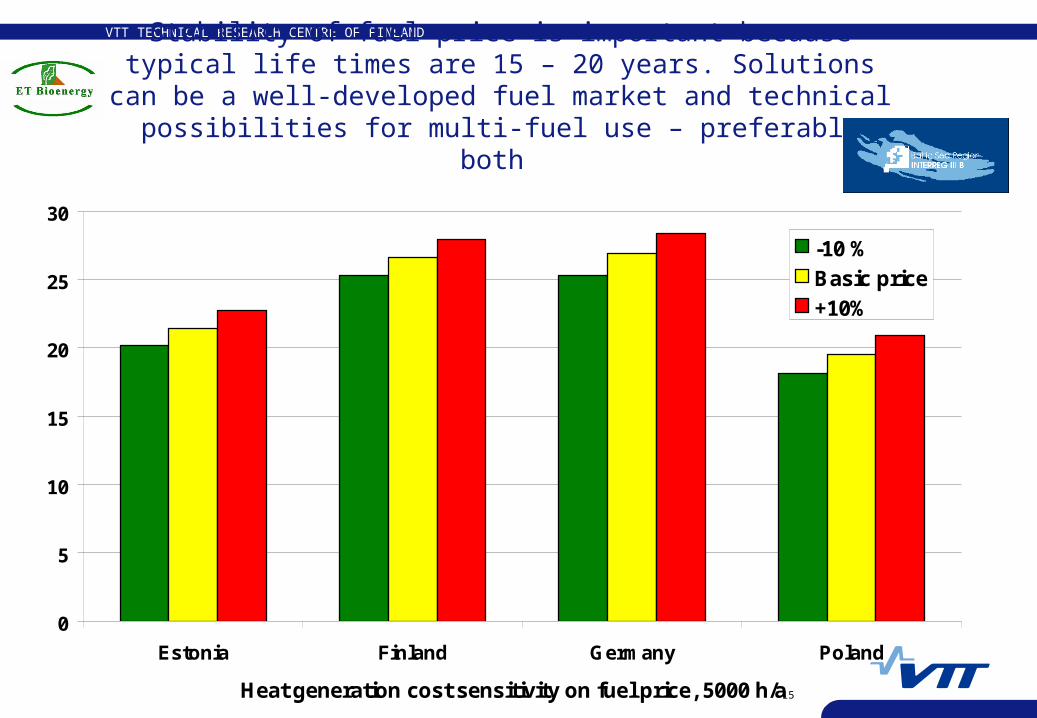
Stability of fuel price is important because typical life times are 15 – 20 years. Solutions can be a well-developed fuel market and
technical possibilities for multi-fuel use – preferably both
Heat generation cost sensitivity on fuel price, 5000 h/a
0
5
10
15
20
25
30
Estonia Finland Germany Poland
-10 %
Basic price
+10%
EUR/MWh
VTT TECHNICAL RESEARCH CENTRE OF FINLAND
16
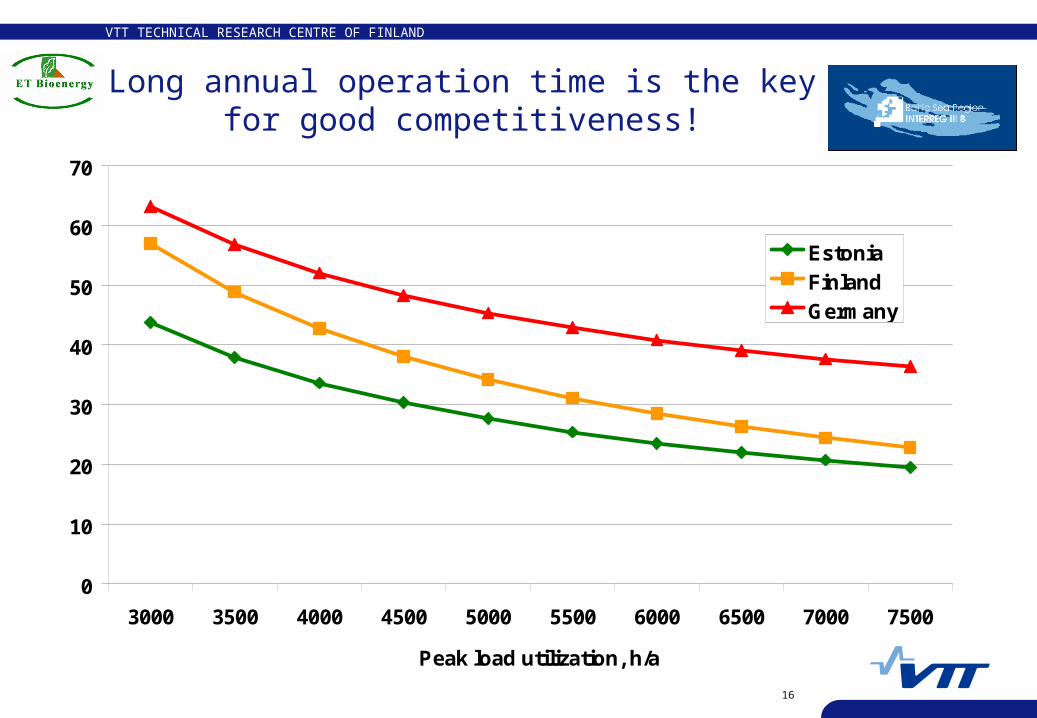
Long annual operation time is the key for good competitiveness!
Peak load utilization, h/a
0
10
20
30
40
50
60
70
3000 3500 4000 4500 5000 5500 6000 6500 7000 7500
Estonia
Finland
Germany
EUR/MWh
VTT TECHNICAL RESEARCH CENTRE OF FINLAND
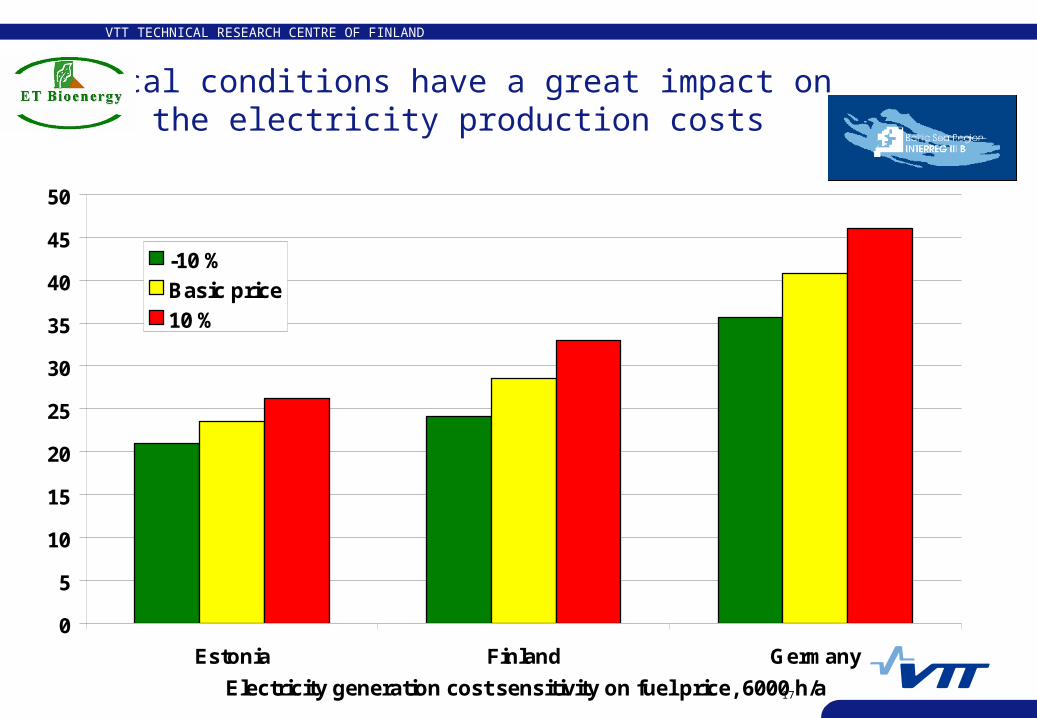
17 Electricity generation cost sensitivity on fuel price, 6000 h/a
0
5
10
15
20
25
30
35
40
45
50
Estonia Finland Germany
-10 %
Basic price
10 %
EUR/MWh
Local conditions have a great impact on the electricity production costs
VTT TECHNICAL RESEARCH CENTRE OF FINLAND
18
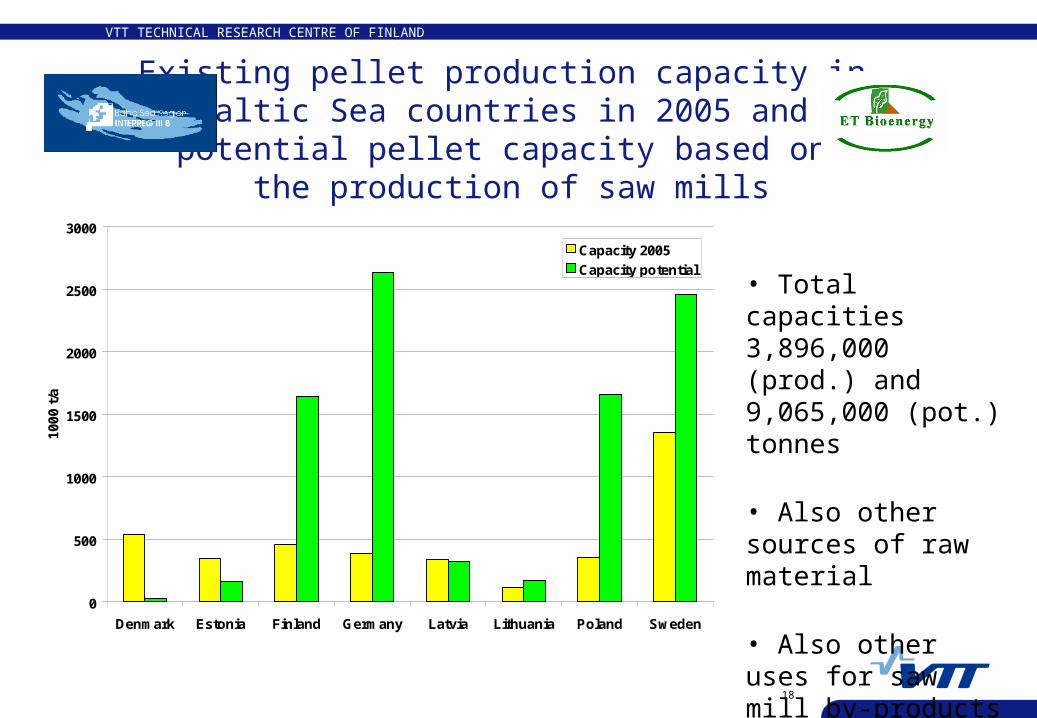
Existing pellet production capacity in Baltic Sea countries in 2005 and potential pellet capacity based on
the production of saw mills
0
500
1000
1500
2000
2500
3000
Denmark Estonia Finland Germany Latvia Lithuania Poland Sweden
1000
t/a
Capacity 2005
Capacity potential
• Total capacities 3,896,000 (prod.) and 9,065,000 (pot.) tonnes
• Also other sources of raw material
• Also other uses for saw mill by-products
VTT TECHNICAL RESEARCH CENTRE OF FINLAND
19
Conclusions
• Role of bioenergy varies in different countries significantly: from marginal to dominating in the energy market
• National incentives on bioenergy have significant variations
-> Increase of biomass trade, spot markets
-> Increase of volatility on prices of biomass-based fuels
-> Bioenergy is not anymore only local, but widely utilised source of energy
VTT TECHNICAL RESEARCH CENTRE OF FINLAND
20
THANK YOU FOR YOUR ATTENTION!
Pirkko Vesterinen
ET-Bioenergy project
New Bioenergy Business During Emission Trading
Co-financed by EU BSR INTERREG III B NP