Embed Size (px)
Citation preview

New Capabilities in Autodesk® Simulation Moldflow®
Insight and Research Directions Franco Costa – Autodesk
SM1869-P
This class reviews new functionality in Autodesk Simulation Moldflow Insight software and discusses recent and current research directions of Moldflow development. We cover the following capabilities: viscoelastic warp calculations, improved wall slip calculations, the influence of mold deflection, ejection force predictions, analysis of mold fatigue, flow imbalances (airflow), 3D compression molding, 3D conformal cooling, 3D hot runner elements, crystallization analysis, long fiber composites, and mesh preparation.
Learning Objectives At the end of this class, you will be able to:
Identify when to use viscoelastic residual stress calculation
Explain the influence of mold deflection on pressure, shrinkage, and warpage prediction
Enable a wall slip calculation to simulate jetting effects
Perform a 3D flow analysis which can capture shear heating induced flow imbalances
About the Speaker
Dr. Franco Costa is a Senior Research Leader for the Autodesk® DLS-Simulation group. Over 21 years
with Autodesk Moldflow®, he has contributed to the technologies of 3-dimensional flow simulations,
thermal analysis, crystallization analysis, structural analysis, final net part shape prediction and multi-
physics for the plastic injection molding simulation industry. Franco now leads key strategic research
projects for the Autodesk Simulation technology group. Franco often presents overviews of Autodesk
Moldflow research technology directions at Autodesk Moldflow user meetings, has acted as a reviewer
for academic journals and internal technical publications. Franco is based in the Autodesk R&D Center
in Melbourne, Australia
New Capabilities in Autodesk® Simulation Moldflow® Insight and Research Directions
2
THE INFLUENCE OF MOLD DEFLECTION ON THE PREDICTION OF PACKING
PRESSURE DECAY AND PART SHRINKAGE
Introduction
In recent years, the popularity of injection molding simulation has continued to grow as part and mold designers
seek to reduce the number of costly mold trials and mold modifications required to achieve high quality injection
molded parts. A key outcome sought from numerical simulation is the prediction of final part dimensions (shrinkage
and warpage). Together with a sound material characterization, a basic requirement for accurate shrinkage and
warpage prediction is the correct prediction of cavity pressures present during solidification of the molded article.
Typically, cavity pressures cannot be controlled after the gate has frozen and so cavity pressure begins to decay as a
result of continued material cooling after gate freeze. Therefore, the accurate prediction of cavity pressure decay
phenomena is necessary if an accurate final part shape is to be predicted.
In past years, a number of researchers considering cavity pressure decay prediction accuracy have demonstrated the importance of considering the dynamic deflection of the mold due to the forces exerted on the mold by the
pressurized polymer in the cavity. Leo and Cuvelliez [1] demonstrated mold elastic deformation by the correlation
of residual cavity pressures to part sample thickness and monitored mold backplate flexure by use of a strain gauge.
They also achieved improved cavity pressure predictions using an existing commercial simulation package by
adding the mold compliance effect into the material PVT characteristic. This method is valid for parts of uniform
thickness, but is not generally applicable to parts with variations in thickness. Vietri et al. [2] also demonstrated
good improvements with a similar PVT based method and proposed a way to determine the approximate mold
compliance by a simple beam deformation equation. Pantani et al. [3] implemented an injection molding simulation
for simplified geometries which included local cavity thickness changes according to the local pressure and with this
achieved improved predictions of cavity pressure decay. This method is applicable to simplified part geometries
with variable thicknesses. Delaunay et al. [4] demonstrated a method for estimating the mold compliance
characteristic based on recorded cavity pressures and measured part dimensions.
To date, none of the commercially available injection molding simulation packages (which have the capability to
analyze complex part geometries) have include the mold deformation effect in the flow and shrinkage calculations.
This present work is a demonstration of the significant role that mold deformation can play in improving the
prediction of cavity pressure decay and part shrinkage.
Experimental
Instrumented Mold
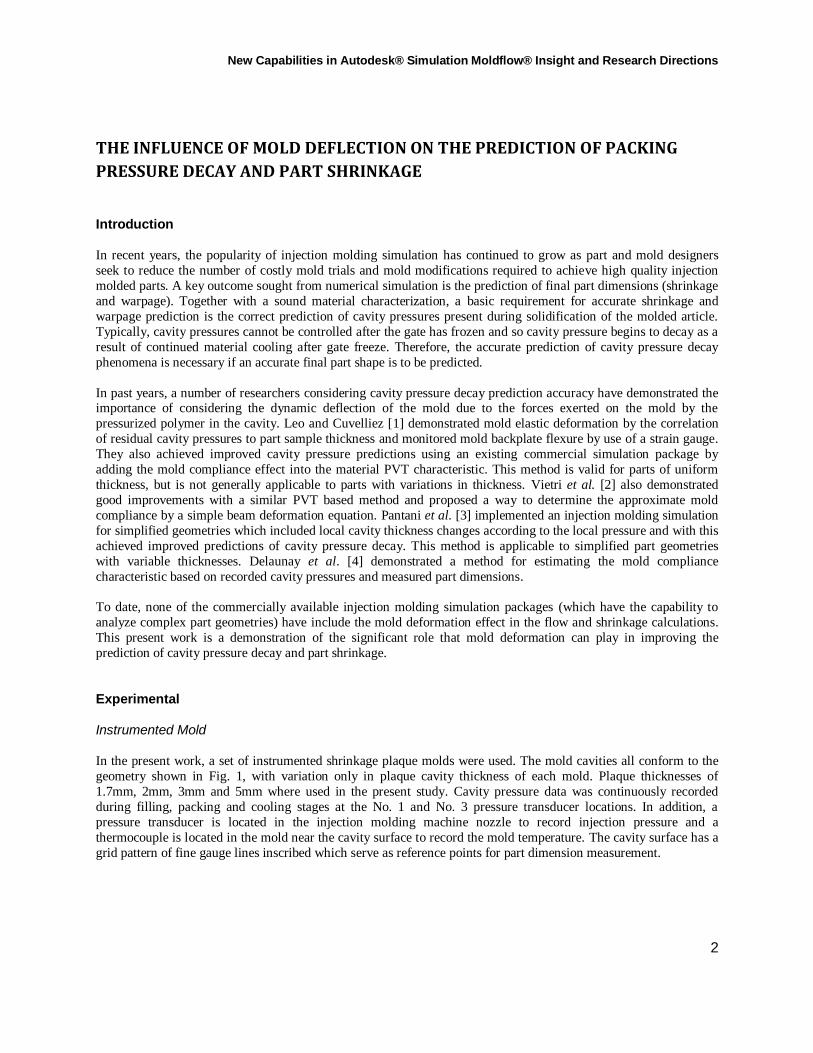
In the present work, a set of instrumented shrinkage plaque molds were used. The mold cavities all conform to the
geometry shown in Fig. 1, with variation only in plaque cavity thickness of each mold. Plaque thicknesses of
1.7mm, 2mm, 3mm and 5mm where used in the present study. Cavity pressure data was continuously recorded
during filling, packing and cooling stages at the No. 1 and No. 3 pressure transducer locations. In addition, a
pressure transducer is located in the injection molding machine nozzle to record injection pressure and a
thermocouple is located in the mold near the cavity surface to record the mold temperature. The cavity surface has a
grid pattern of fine gauge lines inscribed which serve as reference points for part dimension measurement.
New Capabilities in Autodesk® Simulation Moldflow® Insight and Research Directions
3
Figure 1 – Geometry of instrumented mold
Polymer Material Grades
Four unfilled amorphous polymer materials were used for the present study. The use of fiber filled materials was
avoided in this first study to ensure that part shrinkage in the flow and perpendicular directions would be similar,
and so an averaging of the in-plane shrinkage could be performed without significant loss of detail. The use of amorphous materials was preferred to avoid in the first instance the complications in pressure decay response of
semi-crystalline materials due to cooling rate effects and abrupt density changes upon solidification. Semi-
crystalline and fiber filled materials will be considered in future studies.
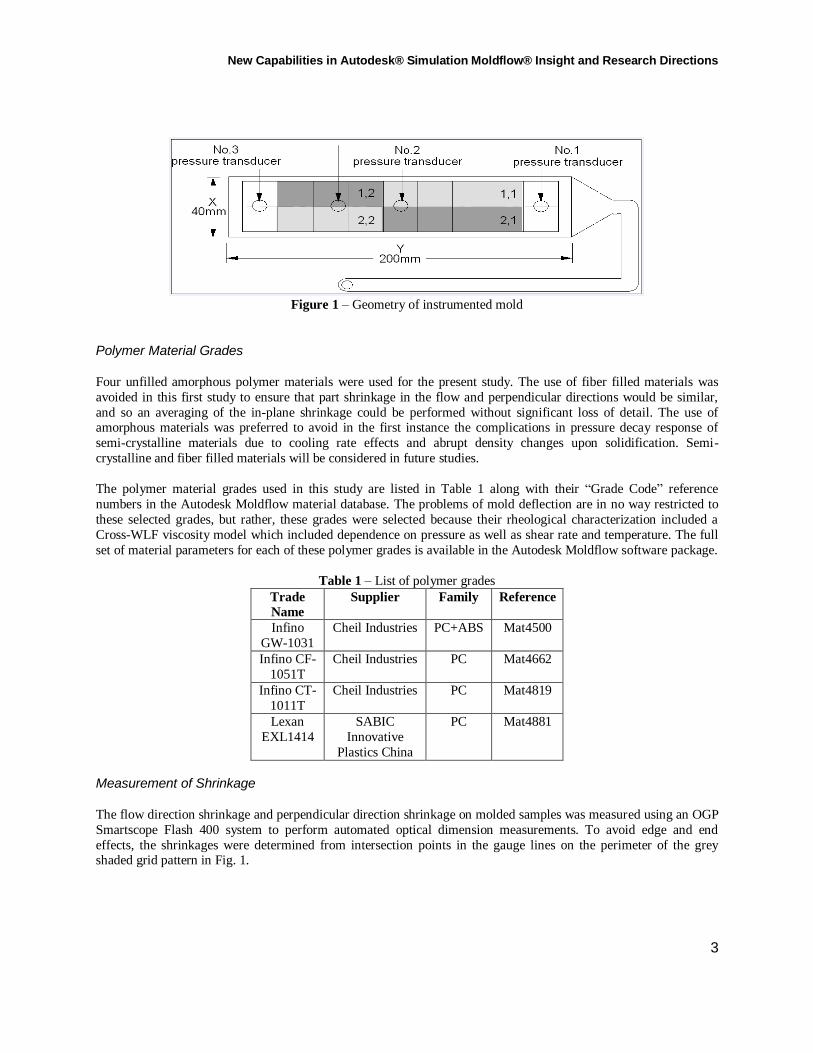
The polymer material grades used in this study are listed in Table 1 along with their “Grade Code” reference
numbers in the Autodesk Moldflow material database. The problems of mold deflection are in no way restricted to
these selected grades, but rather, these grades were selected because their rheological characterization included a
Cross-WLF viscosity model which included dependence on pressure as well as shear rate and temperature. The full
set of material parameters for each of these polymer grades is available in the Autodesk Moldflow software package.
Table 1 – List of polymer grades
Trade
Name
Supplier Family Reference
Infino
GW-1031
Cheil Industries PC+ABS Mat4500
Infino CF-
1051T
Cheil Industries PC Mat4662
Infino CT-
1011T
Cheil Industries PC Mat4819
Lexan
EXL1414
SABIC
Innovative
Plastics China
PC Mat4881
Measurement of Shrinkage
The flow direction shrinkage and perpendicular direction shrinkage on molded samples was measured using an OGP
Smartscope Flash 400 system to perform automated optical dimension measurements. To avoid edge and end
effects, the shrinkages were determined from intersection points in the gauge lines on the perimeter of the grey shaded grid pattern in Fig. 1.
New Capabilities in Autodesk® Simulation Moldflow® Insight and Research Directions
4
Processing Conditions
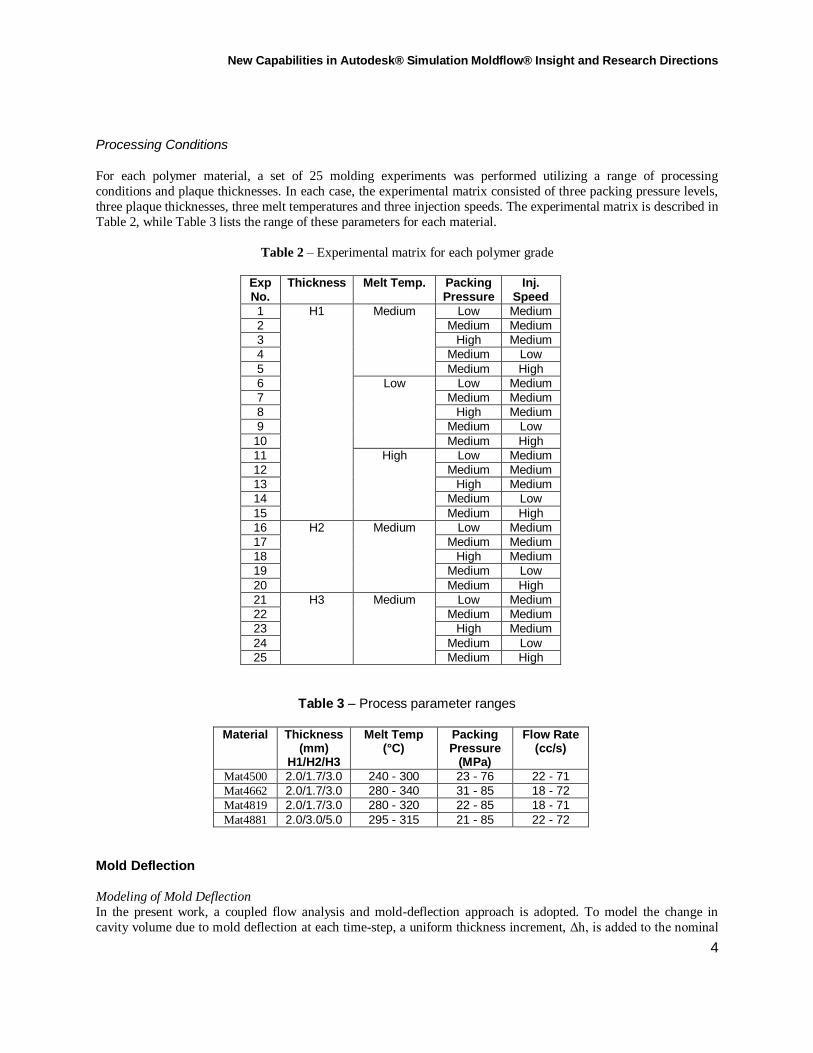
For each polymer material, a set of 25 molding experiments was performed utilizing a range of processing
conditions and plaque thicknesses. In each case, the experimental matrix consisted of three packing pressure levels,
three plaque thicknesses, three melt temperatures and three injection speeds. The experimental matrix is described in
Table 2, while Table 3 lists the range of these parameters for each material.
Table 2 – Experimental matrix for each polymer grade
Exp No.
Thickness Melt Temp. Packing Pressure
Inj. Speed
1 H1 Medium Low Medium
2 Medium Medium
3 High Medium
4 Medium Low
5 Medium High
6 Low Low Medium
7 Medium Medium
8 High Medium
9 Medium Low
10 Medium High
11 High Low Medium
12 Medium Medium
13 High Medium
14 Medium Low
15 Medium High
16 H2 Medium Low Medium
17 Medium Medium
18 High Medium
19 Medium Low
20 Medium High
21 H3 Medium Low Medium
22 Medium Medium
23 High Medium
24 Medium Low
25 Medium High
Table 3 – Process parameter ranges
Material Thickness (mm)
H1/H2/H3
Melt Temp (°C)
Packing Pressure
(MPa)
Flow Rate (cc/s)
Mat4500 2.0/1.7/3.0 240 - 300 23 - 76 22 - 71
Mat4662 2.0/1.7/3.0 280 - 340 31 - 85 18 - 72
Mat4819 2.0/1.7/3.0 280 - 320 22 - 85 18 - 71
Mat4881 2.0/3.0/5.0 295 - 315 21 - 85 22 - 72
Mold Deflection
Modeling of Mold Deflection
In the present work, a coupled flow analysis and mold-deflection approach is adopted. To model the change in
cavity volume due to mold deflection at each time-step, a uniform thickness increment, Δh, is added to the nominal
New Capabilities in Autodesk® Simulation Moldflow® Insight and Research Directions
5
cavity thickness at each location on the parting plane of the cavity geometry. The thickness increment is determined
as follows:
clampMFCh . (1)
where CM is the mold compliance and Fclamp is the total force of polymer contact projected onto the mold
parting plane. While Fclamp is readily available at each time-step from existing simulations of mold filling
and packing, the mold compliance is a characteristic of the mold which must be determined.
Determination of Mold Compliance
To determine the mold compliance of the molds used in this study, a search was made for molding data set where
the final cavity pressures before mold opening were still positive at both cavity pressures sensors. In such cases, the
polymer was still fully in contact with the mold prior to the mold opening, indicating that no shrinkage away from
the cavity surface have yet occurred. It is useful to note that these over packed moldings cases need not be restricted
to the materials which are to be simulated, since it is a mold characteristic which is being determined rather than a
polymer characteristic. For the present study, two molding case studies with a high number of over-pack moldings
were selected. These were a PC+ABS material and a PET material.
Typically in such over-packed cases, the recorded cavity pressures before mold opening had stabilized to a constant
pressure, which indicated that the polymer material had cooled to the mold temperature and no further cooling was
occurring. In this way, the complete physical state (pressure and temperature) of the polymer was known at the instant before mold opening. The resulting thickness of the molded plaques was measured using a micrometer.
Repeat thickness measurements were taken at 18 locations on each plaque and then averaged to give an overall
plaque thickness at room temperature and pressure. Using the PVT (pressure-volume-temperature) characteristic of
the molded material, a correction was made to the measured plaque thicknesses to determine what would have been
the plaque thickness (and so also the mold cavity thickness) at the recorded cavity pressure and mold temperature
immediately prior to mold opening. The assumption used here was that upon ejection the plaque would contract
uniformly in all directions due to cooling from the mold temperature to room temperature (and also expand
uniformly in all directions due to the pressure release). The mold deflection was then determined by subtracting the
nominal cavity thickness (adjusted to account for mold thermal expansion) from these in-cavity plaque thicknesses.
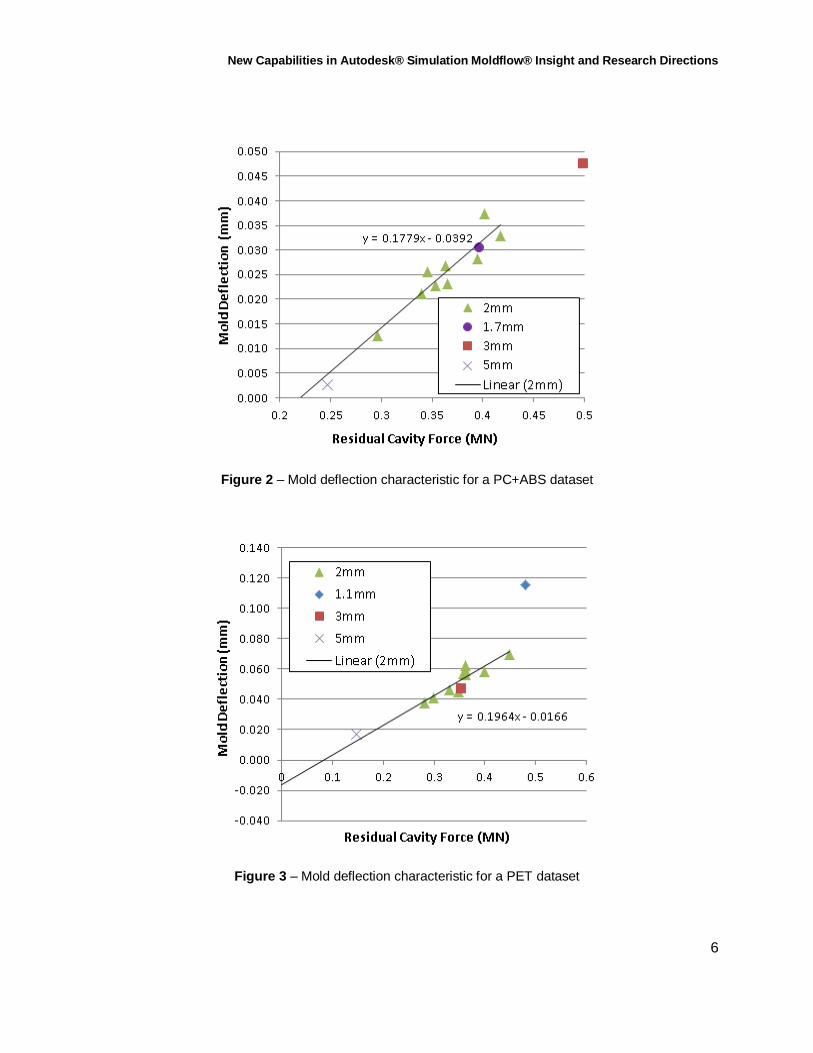
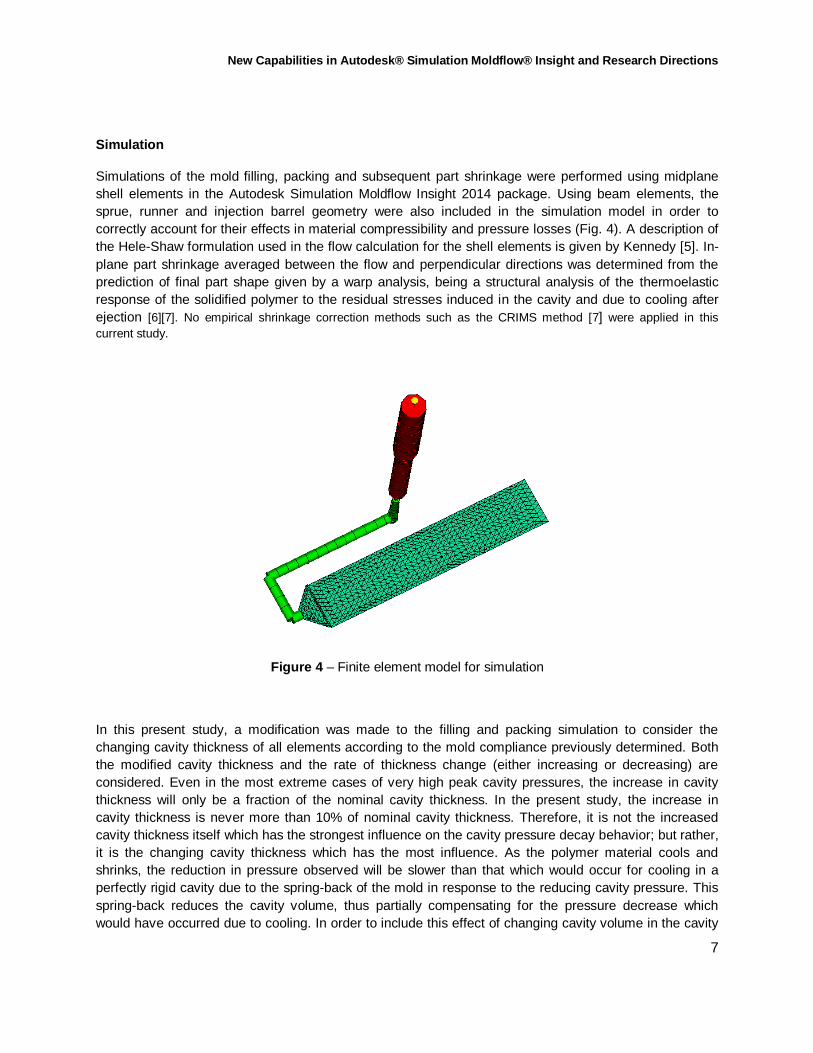
The mold deflections where correlated against the residual cavity force, which can be easily determined from the residual cavity pressures. Shown in Fig. 2 and Fig. 3, the gradient of this correlation gives the mold compliance
characteristic to be used. Only the mold deflections for the 2mm thick parts were used to determine the correlation
gradient because some uncertainty exists in the nominal cavity thickness values. However, the mold deflections for
over-packed moldings of the other cavity thicknesses are also shown in Fig. 2 and Fig. 3 to illustrate the general
consistency of the approach. Averaging the determined mold compliance characteristic obtained from these two
datasets, the mold compliance used in the present study was 0.187 mm/MN.
New Capabilities in Autodesk® Simulation Moldflow® Insight and Research Directions
6
Figure 2 – Mold deflection characteristic for a PC+ABS dataset
Figure 3 – Mold deflection characteristic for a PET dataset
New Capabilities in Autodesk® Simulation Moldflow® Insight and Research Directions
7
Simulation
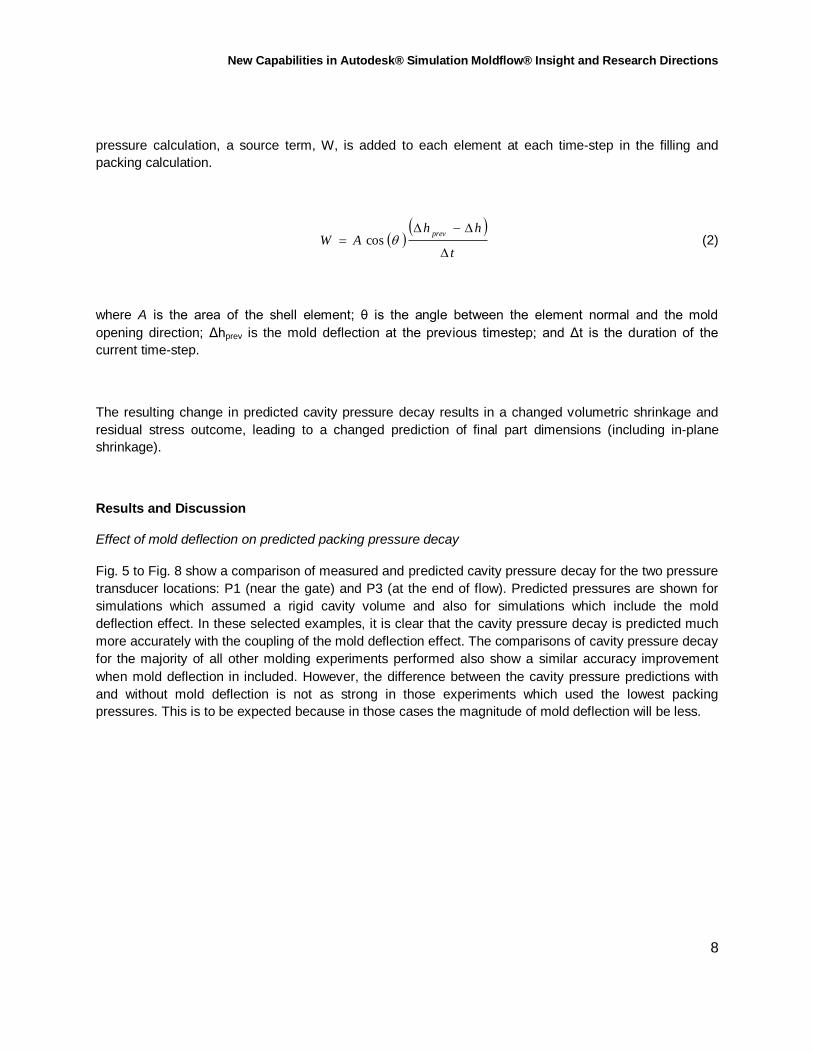
Simulations of the mold filling, packing and subsequent part shrinkage were performed using midplane
shell elements in the Autodesk Simulation Moldflow Insight 2014 package. Using beam elements, the
sprue, runner and injection barrel geometry were also included in the simulation model in order to
correctly account for their effects in material compressibility and pressure losses (Fig. 4). A description of
the Hele-Shaw formulation used in the flow calculation for the shell elements is given by Kennedy [5]. In-
plane part shrinkage averaged between the flow and perpendicular directions was determined from the
prediction of final part shape given by a warp analysis, being a structural analysis of the thermoelastic
response of the solidified polymer to the residual stresses induced in the cavity and due to cooling after
ejection [6][7]. No empirical shrinkage correction methods such as the CRIMS method [7] were applied in this
current study.
Figure 4 – Finite element model for simulation
In this present study, a modification was made to the filling and packing simulation to consider the
changing cavity thickness of all elements according to the mold compliance previously determined. Both
the modified cavity thickness and the rate of thickness change (either increasing or decreasing) are
considered. Even in the most extreme cases of very high peak cavity pressures, the increase in cavity
thickness will only be a fraction of the nominal cavity thickness. In the present study, the increase in
cavity thickness is never more than 10% of nominal cavity thickness. Therefore, it is not the increased
cavity thickness itself which has the strongest influence on the cavity pressure decay behavior; but rather,
it is the changing cavity thickness which has the most influence. As the polymer material cools and
shrinks, the reduction in pressure observed will be slower than that which would occur for cooling in a
perfectly rigid cavity due to the spring-back of the mold in response to the reducing cavity pressure. This
spring-back reduces the cavity volume, thus partially compensating for the pressure decrease which
would have occurred due to cooling. In order to include this effect of changing cavity volume in the cavity
New Capabilities in Autodesk® Simulation Moldflow® Insight and Research Directions
8
pressure calculation, a source term, W, is added to each element at each time-step in the filling and
packing calculation.
t
hhAW
prev
cos (2)
where A is the area of the shell element; θ is the angle between the element normal and the mold
opening direction; Δhprev is the mold deflection at the previous timestep; and Δt is the duration of the
current time-step.
The resulting change in predicted cavity pressure decay results in a changed volumetric shrinkage and
residual stress outcome, leading to a changed prediction of final part dimensions (including in-plane
shrinkage).
Results and Discussion
Effect of mold deflection on predicted packing pressure decay
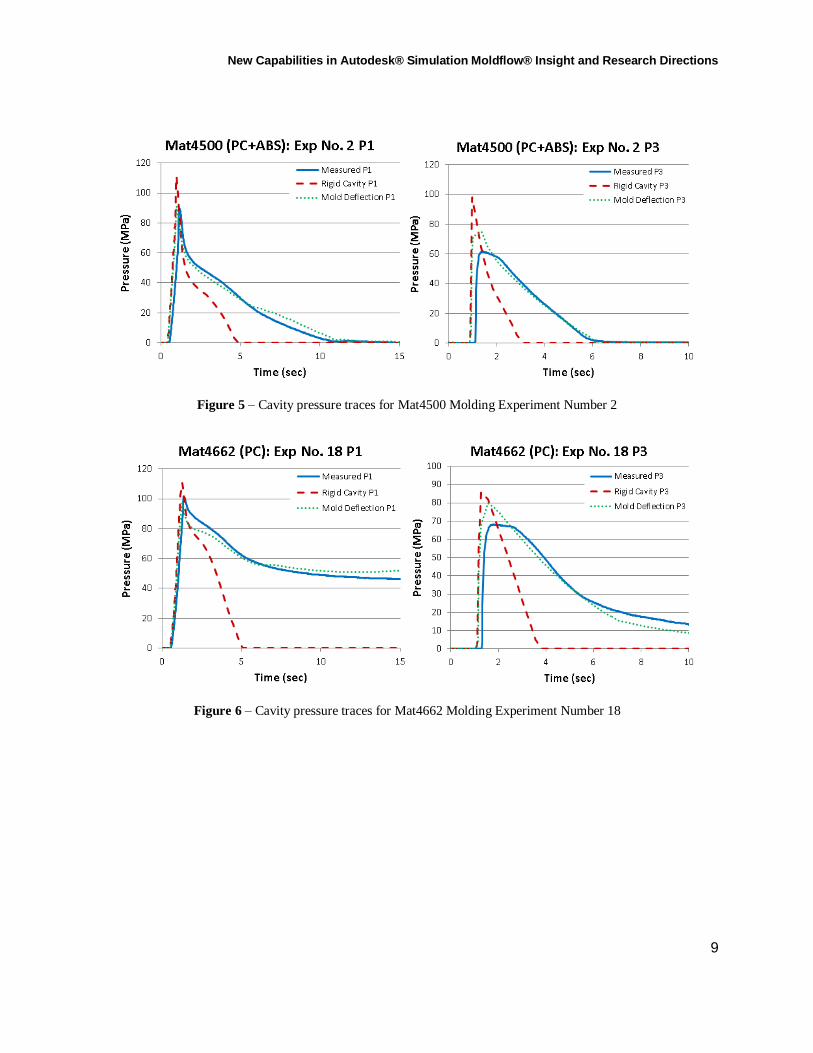
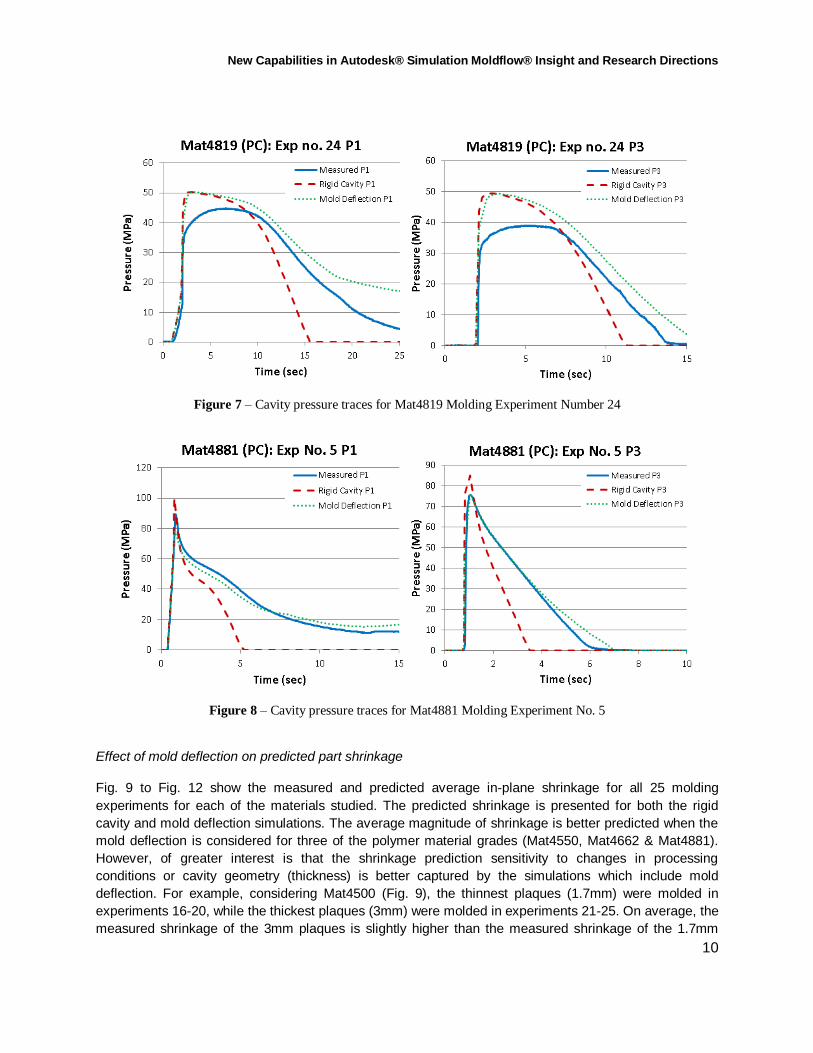
Fig. 5 to Fig. 8 show a comparison of measured and predicted cavity pressure decay for the two pressure
transducer locations: P1 (near the gate) and P3 (at the end of flow). Predicted pressures are shown for
simulations which assumed a rigid cavity volume and also for simulations which include the mold
deflection effect. In these selected examples, it is clear that the cavity pressure decay is predicted much
more accurately with the coupling of the mold deflection effect. The comparisons of cavity pressure decay
for the majority of all other molding experiments performed also show a similar accuracy improvement
when mold deflection in included. However, the difference between the cavity pressure predictions with
and without mold deflection is not as strong in those experiments which used the lowest packing
pressures. This is to be expected because in those cases the magnitude of mold deflection will be less.
New Capabilities in Autodesk® Simulation Moldflow® Insight and Research Directions
9
Figure 5 – Cavity pressure traces for Mat4500 Molding Experiment Number 2
Figure 6 – Cavity pressure traces for Mat4662 Molding Experiment Number 18
New Capabilities in Autodesk® Simulation Moldflow® Insight and Research Directions
10
Figure 7 – Cavity pressure traces for Mat4819 Molding Experiment Number 24
Figure 8 – Cavity pressure traces for Mat4881 Molding Experiment No. 5
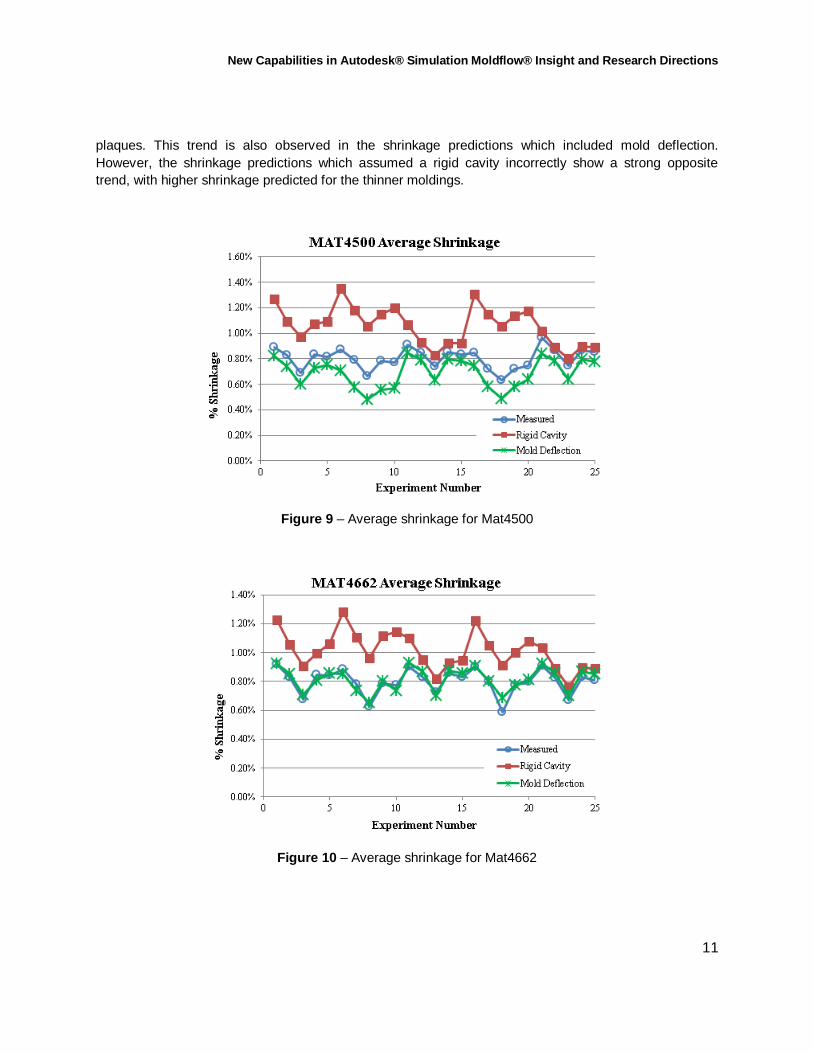
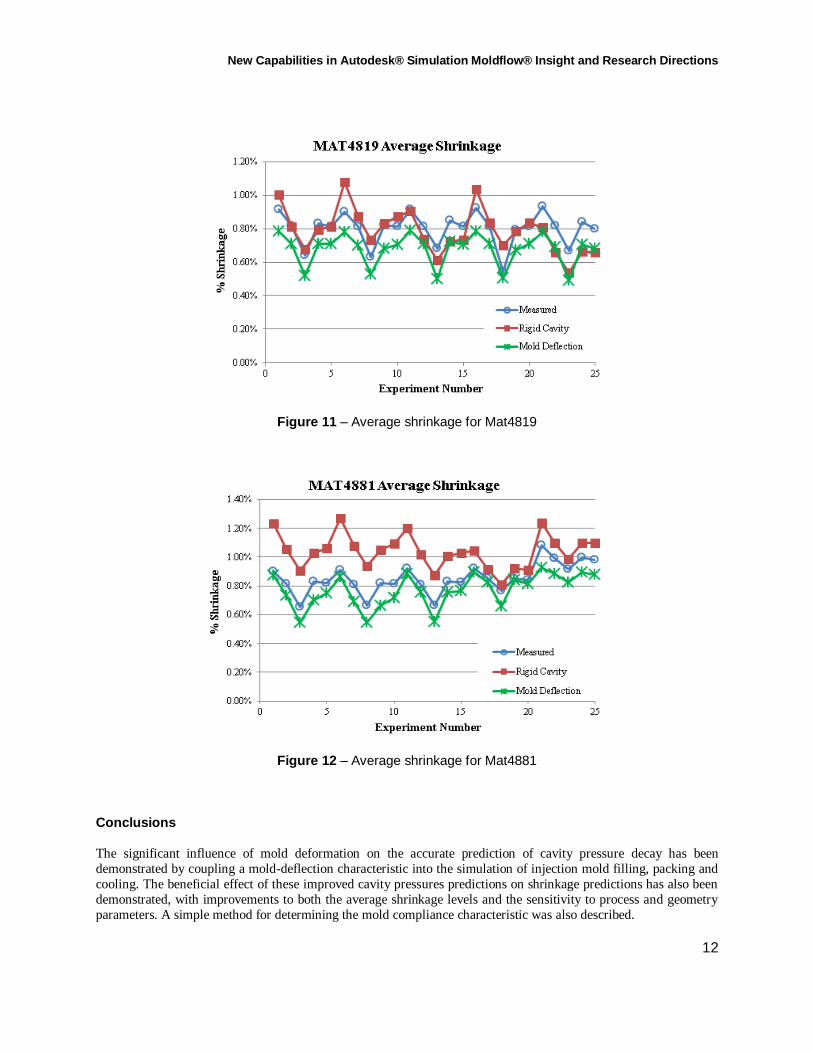
Effect of mold deflection on predicted part shrinkage
Fig. 9 to Fig. 12 show the measured and predicted average in-plane shrinkage for all 25 molding
experiments for each of the materials studied. The predicted shrinkage is presented for both the rigid
cavity and mold deflection simulations. The average magnitude of shrinkage is better predicted when the
mold deflection is considered for three of the polymer material grades (Mat4550, Mat4662 & Mat4881).
However, of greater interest is that the shrinkage prediction sensitivity to changes in processing
conditions or cavity geometry (thickness) is better captured by the simulations which include mold
deflection. For example, considering Mat4500 (Fig. 9), the thinnest plaques (1.7mm) were molded in
experiments 16-20, while the thickest plaques (3mm) were molded in experiments 21-25. On average, the
measured shrinkage of the 3mm plaques is slightly higher than the measured shrinkage of the 1.7mm
New Capabilities in Autodesk® Simulation Moldflow® Insight and Research Directions
11
plaques. This trend is also observed in the shrinkage predictions which included mold deflection.
However, the shrinkage predictions which assumed a rigid cavity incorrectly show a strong opposite
trend, with higher shrinkage predicted for the thinner moldings.
Figure 9 – Average shrinkage for Mat4500
Figure 10 – Average shrinkage for Mat4662
New Capabilities in Autodesk® Simulation Moldflow® Insight and Research Directions
12
Figure 11 – Average shrinkage for Mat4819
Figure 12 – Average shrinkage for Mat4881
Conclusions
The significant influence of mold deformation on the accurate prediction of cavity pressure decay has been
demonstrated by coupling a mold-deflection characteristic into the simulation of injection mold filling, packing and
cooling. The beneficial effect of these improved cavity pressures predictions on shrinkage predictions has also been
demonstrated, with improvements to both the average shrinkage levels and the sensitivity to process and geometry
parameters. A simple method for determining the mold compliance characteristic was also described.
New Capabilities in Autodesk® Simulation Moldflow® Insight and Research Directions
13
Acknowledgements
The author wishes to thank the Autodesk laboratory staff who conducted the molding experiments and shrinkage
measurements used throughout this study.
References
1. V. Leo; CH. Cuvelliez Polym. Eng. Sci. 1996, 36, 1961-1971.
2. U. Vietri; A. Sorrentino; V. Speranza; R. Pantani Polym. Eng. Sci. 2011, 51, 2542-2551.
3. R. Pantani; V. Speranza; G. Titomanlio Polym. Eng. Sci. 2001, 41, 2022-2035.
4. D. Delaunay; P Le Bot; R. Fulchiron; J.F. Luye; G. Regnier Polym. Eng. Sci. 2000, 40, 1692-1700.
5. P. Kennedy, Flow Analysis of Injection Molds, Hanser, Munich, 1995.
6. R. Zheng; P. Kennedy; N. Phan-Thien; X-J. Fan J. Non-Newtonian Fluid Mech. 1999, 84, 159-190.
7. P. Kennedy and R. Zheng in SPE-ANTEC Tech. Papers 48, 2002.