Embed Size (px)
Citation preview

CASESCASES
Data sourced from management information and may differ from official statistics.
0
100
200
300
400
500
600
18 Mar 01 Apr 15 Apr 29 Apr 13 May 27 May
New cases by reported day and new cases by test date
New cases by reported day New cases reported (7 day average)New cases by test date
0
2,000
4,000
6,000
8,000
10,000
12,000
14,000
16,000
18 Mar 01 Apr 15 Apr 29 Apr 13 May 27 May
Number of cumulative cases reported
Source: Public Health Wales
Data as at:02/06/2020
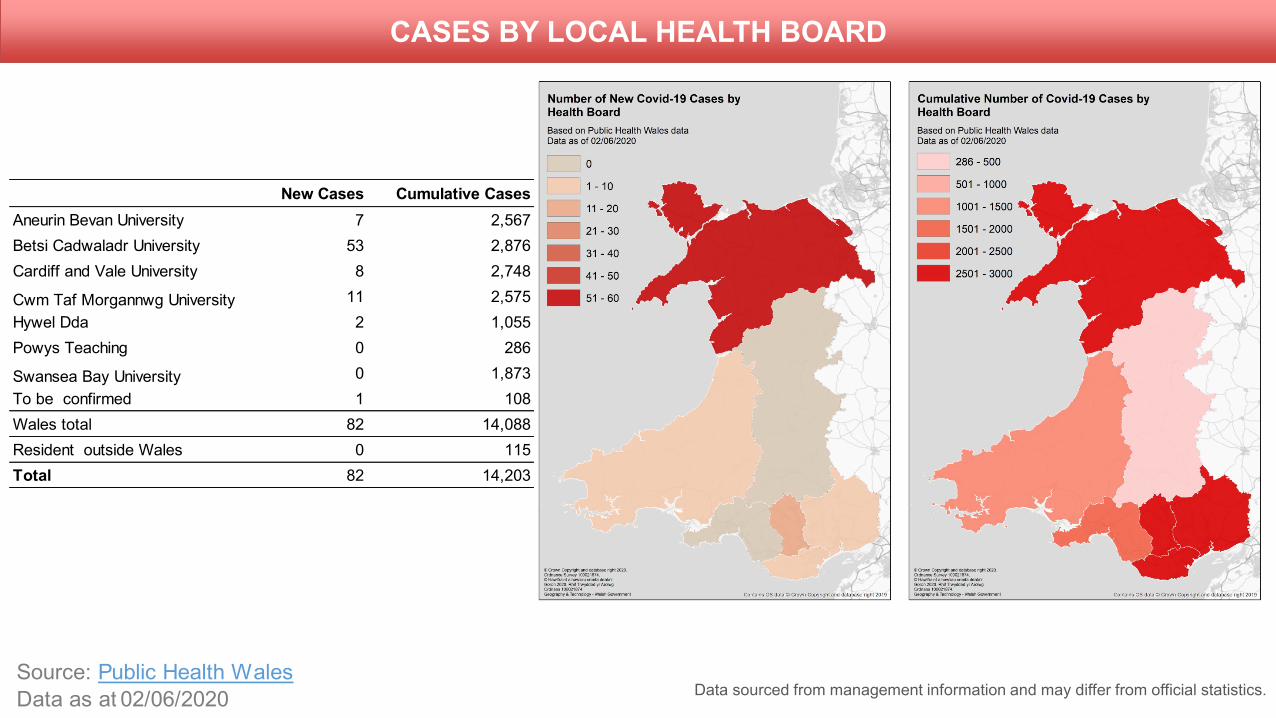
CASES BY LOCAL HEALTH BOARDCASES BY LOCAL HEALTH BOARD
Data sourced from management information and may differ from official statistics.
New Cases Cumulative Cases
Aneurin Bevan University 7 2,567
Betsi Cadwaladr University 53 2,876
Cardiff and Vale University 8 2,748
Cwm Taf Morgannwg University 11 2,575
Hywel Dda 2 1,055
Powys Teaching 0 286
Swansea Bay University 0 1,873
To be confirmed 1 108
Wales total 82 14,088
Resident outside Wales 0 115
Total 82 14,203
Source: Public Health Wales
Data as at:02/06/2020

CUMULATIVE DEATHSCUMULATIVE DEATHS
Source: Public Health Wales and Office for National Statistics
Data as at 02/06/20 and up to 22/05/20
Note: The Chief Statistician’s blog explains why the PHW data differs to the more
comprehensive ONS data
Data sourced from management information and may differ from official statistics.
Number of deaths involving COVID-19, reported and by date of deaths, by source:
5 March to 02 June 2020
0
250
500
750
1,000
1,250
1,500
1,750
2,000
2,250
8March
16March
24March
1 April 9 April 17 April 24 April 1 May 8 May 15 May 22 May 29 May
ONS deaths by actual date of death (Wales only),registered by 30 May
PHW by date of death as published on 02 June
Daily deaths reported by PHW
s
COPY TITLE MANUALLY WITH GRAPH
0
20
40
60
80
100
120
17 Mar 25 Mar 2 Apr 10 Apr 18 Apr 26 Apr 4 May 12 May 20 May 28 May
Number of deaths involving COVID-19 reported by Public Health Wales
Newly reported deaths Date of deaths Date of deaths (7 days rolling average)
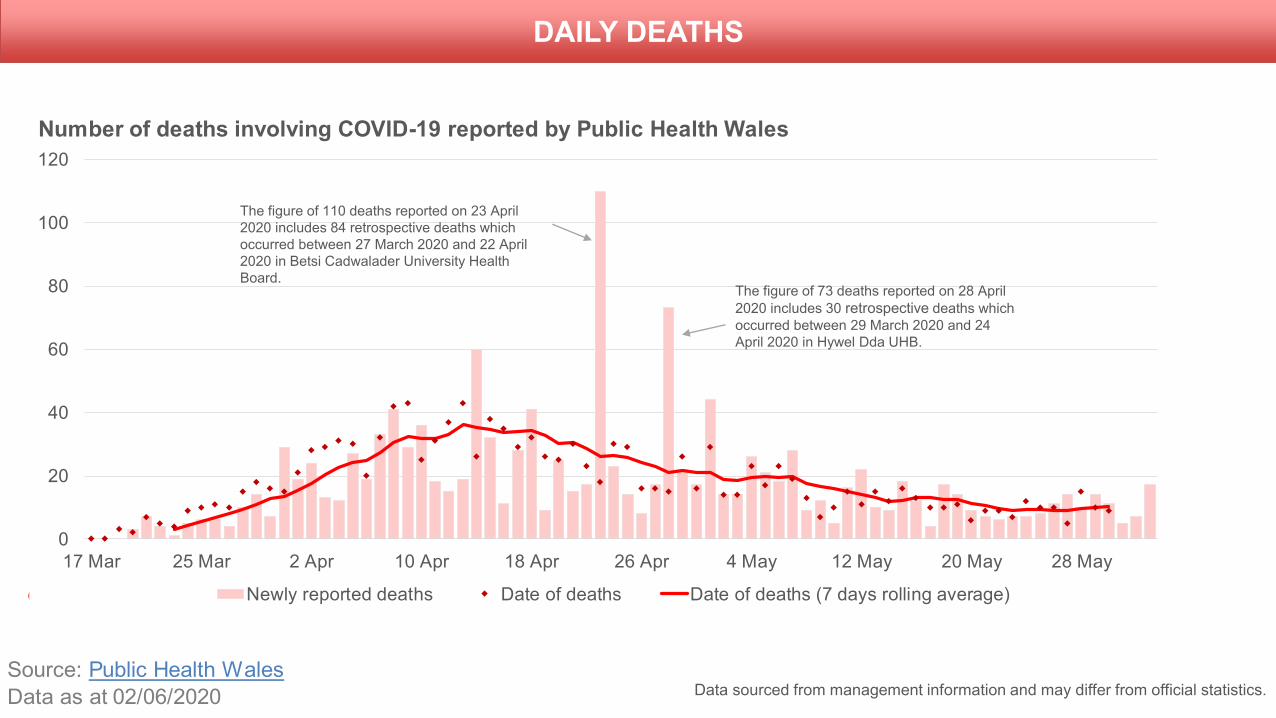
DAILY DEATHSDAILY DEATHS
The figure of 110 deaths reported on 23 April
2020 includes 84 retrospective deaths which
occurred between 27 March 2020 and 22 April
2020 in Betsi Cadwalader University Health
Board.The figure of 73 deaths reported on 28 April
2020 includes 30 retrospective deaths which
occurred between 29 March 2020 and 24
April 2020 in Hywel Dda UHB.
Data sourced from management information and may differ from official statistics.Source: Public Health Wales
Data as at 02/06/2020

OFFICIAL: SENSITIVE
FOR INTERNAL WELSH
GOVERNMENT USE ONLYINVASIVE VENTILATED BEDSINVASIVE VENTILATED BEDS
Data sourced from management information and may differ from official statistics.
0
50
100
150
200
250
300
350
400
450
24 Mar 31 Mar 07 Apr 14 Apr 21 Apr 28 Apr 05 May 12 May 19 May 26 May 02 Jun
Number of invasive ventilated beds, by useVacant Occupied by COVID-19 case Occupied by non-COVID-19 case
0%
10%
20%
30%
40%
50%
60%
70%
80%
90%
100%
24 Mar 31 Mar 07 Apr 14 Apr 21 Apr 28 Apr 05 May 12 May 19 May 26 May 02 Jun
Percentage of invasive ventilated beds, by use% Vacant % Occupied by COVID-19 case % Occupied by non-COVID-19 case
Source: NHS Wales Informatics Service
Data as at: 03/06/2020
Note: Please see the
Chief Statistician’s blog
for more information on
the termninology change.
0
1,000
2,000
3,000
4,000
5,000
6,000
7,000
8,000
9,000
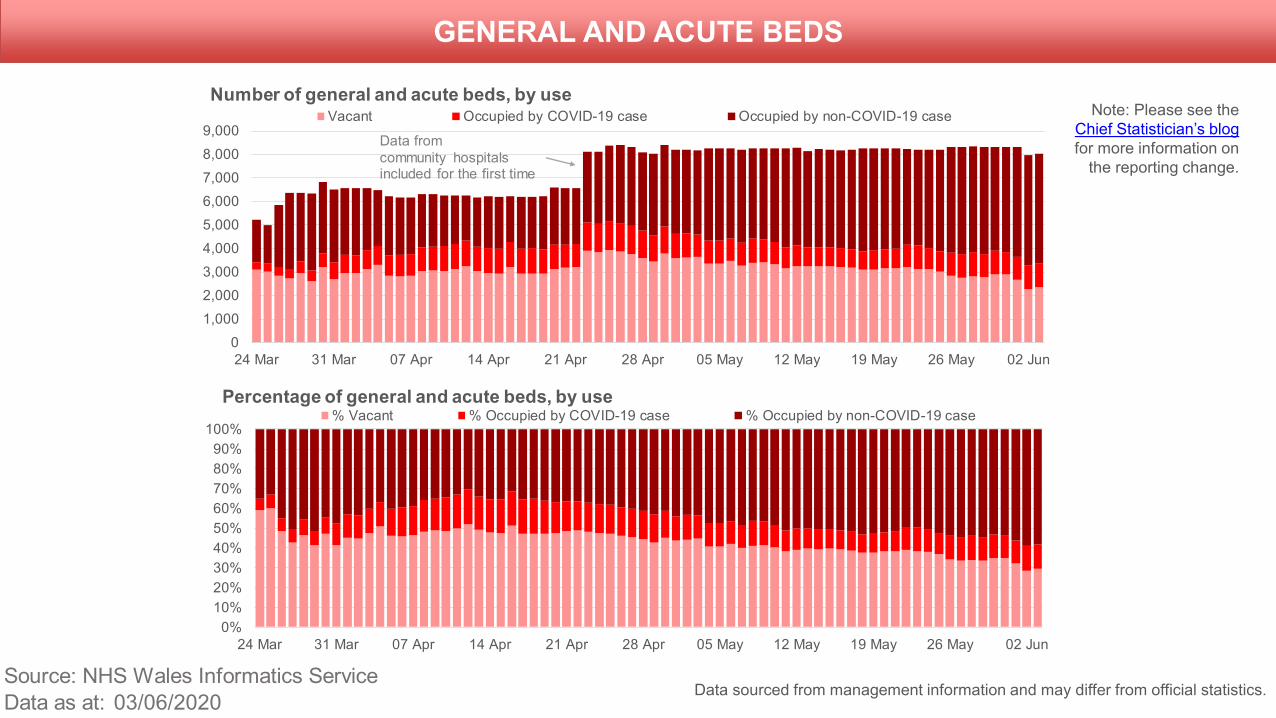
24 Mar 31 Mar 07 Apr 14 Apr 21 Apr 28 Apr 05 May 12 May 19 May 26 May 02 Jun
Number of general and acute beds, by useVacant Occupied by COVID-19 case Occupied by non-COVID-19 case
Data from
community hospitals included for the first time
0%
10%
20%
30%
40%
50%
60%
70%
80%
90%
100%
24 Mar 31 Mar 07 Apr 14 Apr 21 Apr 28 Apr 05 May 12 May 19 May 26 May 02 Jun
Percentage of general and acute beds, by use% Vacant % Occupied by COVID-19 case % Occupied by non-COVID-19 case
OFFICIAL: SENSITIVE
FOR INTERNAL WELSH
GOVERNMENT USE ONLYGENERAL AND ACUTE BEDSGENERAL AND ACUTE BEDS
Data sourced from management information and may differ from official statistics.Source: NHS Wales Informatics Service
Data as at: 03/06/2020
Note: Please see the
Chief Statistician’s blog
for more information on
the reporting change.

OFFICIAL: SENSITIVE
FOR INTERNAL WELSH
GOVERNMENT USE ONLYHOSPITALISATIONS AND NEW ADMISSIONSHOSPITALISATIONS AND NEW ADMISSIONS
Data sourced from management information and may differ from official statistics.Source: NHS Wales Informatics Service
Data as at:03/06/2020
0
50
100
150
200
250
26 Mar 02 Apr 09 Apr 16 Apr 23 Apr 30 Apr 07 May 14 May 21 May 28 May
New daily admissions related to COVID-19
0
1,000
2,000
3,000
4,000
5,000
6,000
7,000
26 Mar 02 Apr 09 Apr 16 Apr 23 Apr 30 Apr 07 May 14 May 21 May 28 May
Total number of hospitalisationsConfirmed COVID-19 Suspected COVID-19 Recovering COVID-19 All hospitalisations
Data from community hospitals included for the first time
Change in reporting which re-classified some patients as COVID-19 Patients. One health board made the change earlier, including recovering patients in their confirmed numbers until 25 May.
1,000
2,000
3,000
4,000
5,000
6,000
7,000
Cyfanswm cleifion mewn ysbytai
Note: Please see the
Chief Statistician’s blog
for more information on
the reporting change.

OFFICIAL: SENSITIVE
FOR INTERNAL WELSH
GOVERNMENT USE ONLYEMERGENCY AMBULANCE CALLSEMERGENCY AMBULANCE CALLS
Data sourced from management information and may differ from official statistics.

OFFICIAL: SENSITIVE
FOR INTERNAL WELSH
GOVERNMENT USE ONLY111 AND NHS DIRECT CALLS111 AND NHS DIRECT CALLS
Data sourced from management information and may differ from official statistics.
Source: Welsh Ambulance Service NHS Trust
Data as at 02/06/2020
0
1,000
2,000
3,000
4,000
5,000
6,000
7,000
01 Mar 15 Mar 29 Mar 12 Apr 26 Apr 10 May 24 May
Calls answered or abandoned after 60 seconds
Calls answered or abandoned after 60 seconds Seven day rolling average

OFFICIAL: SENSITIVE
FOR INTERNAL WELSH
GOVERNMENT USE ONLYDAILY A&E ATTENDANCES DAILY A&E ATTENDANCES
Data sourced from management information and may differ from official statistics.
Source: NHS Wales Informatics Service
Data as at 01/06/2020
0
500
1,000
1,500
2,000
2,500
3,000
3,500
01 Feb 15 Feb 29 Feb 14 Mar 28 Mar 11 Apr 25 Apr 09 May 23 May
Number of daily A&E attendances

OFFICIAL: SENSITIVE
FOR INTERNAL WELSH
GOVERNMENT USE ONLYWEEKLY AVERAGE PERCENTAGE OF NHS STAFF ABSENCESWEEKLY AVERAGE PERCENTAGE OF NHS STAFF ABSENCES
Data sourced from management information and may differ from official statistics.Source: Welsh Government
Data as at: 01/06/2020
1.9 1.81.5
1.2 1.1 1.10.9
3.73.5
3.0
2.5 2.6 2.6
2.22.0 2.0 2.0
1.6 1.7 1.71.4
2.5 2.42.2
1.8 1.9 1.91.6
0.0
1.0
2.0
3.0
4.0
5.0
6.0
14 - 20 April 21 - 27 April 28 April - 4 May 5 - 11 May 12 - 18 May 19 - 25 May 26 May - 1June
The weekly average percentage of NHS Staff absent in Wales due to COVID-19
Medical and dental Nursing and midwifery (registered) Other staff groups Total workforce
2.72.5
2.32.1 2.2
2.4 2.4
5.6
5.25.4
4.9
4.4 4.44.2
5.1 5.04.8 4.7 4.6 4.5 4.4
5.04.8 4.7
4.54.3 4.3 4.2
0.0
1.0
2.0
3.0
4.0
5.0
6.0
14 - 20 April 21 - 27 April 28 April - 4 May 5 - 11 May 12 - 18 May 19 - 25 May 26 May - 1June
The weekly average percentage of NHS Staff self-isolating in Wales
Medical and dental Nursing and midwifery (registered) Other staff groups Total workforce
OFFICIAL: SENSITIVE
FOR INTERNAL WELSH
GOVERNMENT USE ONLYNOTESNOTES
The data published here are taken from management information and are subject to change. These data
have not been subject to the same validation processes undertaken for official statistics releases.
However, they are provided to support transparency and understanding of NHS activity at this time. The
official statistics should continue to be considered the authoritative source of data.
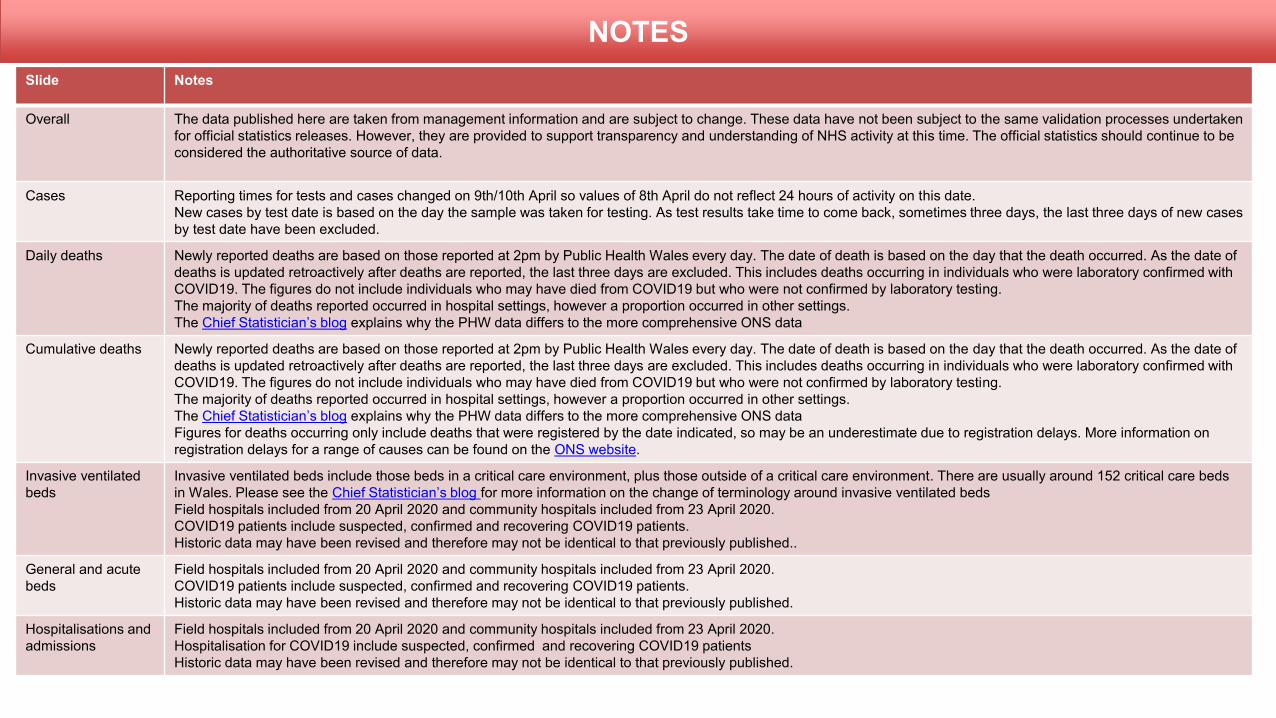
Slide Notes
Overall The data published here are taken from management information and are subject to change. These data have not been subject to the same validation processes undertaken
for official statistics releases. However, they are provided to support transparency and understanding of NHS activity at this time. The official statistics should continue to be
considered the authoritative source of data.
Cases Reporting times for tests and cases changed on 9th/10th April so values of 8th April do not reflect 24 hours of activity on this date.
New cases by test date is based on the day the sample was taken for testing. As test results take time to come back, sometimes three days, the last three days of new cases
by test date have been excluded.
Daily deaths Newly reported deaths are based on those reported at 2pm by Public Health Wales every day. The date of death is based on the day that the death occurred. As the date of
deaths is updated retroactively after deaths are reported, the last three days are excluded. This includes deaths occurring in individuals who were laboratory confirmed with
COVID19. The figures do not include individuals who may have died from COVID19 but who were not confirmed by laboratory testing.
The majority of deaths reported occurred in hospital settings, however a proportion occurred in other settings.
The Chief Statistician’s blog explains why the PHW data differs to the more comprehensive ONS data
Cumulative deaths Newly reported deaths are based on those reported at 2pm by Public Health Wales every day. The date of death is based on the day that the death occurred. As the date of
deaths is updated retroactively after deaths are reported, the last three days are excluded. This includes deaths occurring in individuals who were laboratory confirmed with
COVID19. The figures do not include individuals who may have died from COVID19 but who were not confirmed by laboratory testing.
The majority of deaths reported occurred in hospital settings, however a proportion occurred in other settings.
The Chief Statistician’s blog explains why the PHW data differs to the more comprehensive ONS data
Figures for deaths occurring only include deaths that were registered by the date indicated, so may be an underestimate due to registration delays. More information on
registration delays for a range of causes can be found on the ONS website.
Invasive ventilated
beds
Invasive ventilated beds include those beds in a critical care environment, plus those outside of a critical care environment. There are usually around 152 critical care beds
in Wales. Please see the Chief Statistician’s blog for more information on the change of terminology around invasive ventilated beds
Field hospitals included from 20 April 2020 and community hospitals included from 23 April 2020.
COVID19 patients include suspected, confirmed and recovering COVID19 patients.
Historic data may have been revised and therefore may not be identical to that previously published..
General and acute
beds
Field hospitals included from 20 April 2020 and community hospitals included from 23 April 2020.
COVID19 patients include suspected, confirmed and recovering COVID19 patients.
Historic data may have been revised and therefore may not be identical to that previously published.
Hospitalisations and
admissions
Field hospitals included from 20 April 2020 and community hospitals included from 23 April 2020.
Hospitalisation for COVID19 include suspected, confirmed and recovering COVID19 patients
Historic data may have been revised and therefore may not be identical to that previously published.

OFFICIAL: SENSITIVE
FOR INTERNAL WELSH
GOVERNMENT USE ONLYNOTESNOTES
Slide Notes
Invasive ventilated
beds; General and
acute beds and
Hospitalisations and
admissions
From this week we are also publishing the numbers of patients recovering. Please see the Chief Statistician’s blog for more information. Recovering patients are COVID
positive patients who had been in hospital for 14+ days with no signs and symptoms, but remain in hospital on a COVID treatment pathway, often for rehabilitation. Health
boards were asked to make the change from the 26 May 2020. One health board made the change on 22 May, including the recovering COVID patients in the confirmed
category until 25 May. One health board is currently unable to report recovering COVID patients, but these are included in their confirmed COVID numbers.
Ambulance calls Number of incidents in Wales attended by WAST resources, excluding incidents in England.
111 and NHS Direct
calls
Figures represent total calls answered or calls abandoned after 60 seconds to 111 and NHS Direct. This data also differs from the Public Heath Wales Dashboard.
The PHW dashboard only includes calls logged into their system for certain protocol and does not include all callers who wished to speak to an operator
Daily A&E
attendances
Includes attendances to both major and minor hospitals. Some small minor A&E units are not able to submit daily data, therefore there is probably a small undercount in total
attendance.
NHS staff absences These figures include data for all NHS organisations in Wales but exclude data for Swansea Bay until 20 May (as they were unable to provide data on the same basis as the
other organisations until that date).
Cardiff & Vale do not provide data for weekends / bank holidays. Therefore, data for the previous Friday is repeated over Saturday and Sunday (and bank holiday Monday).
Nursing and midwifery category includes only registered staff.
The percentage of staff self-isolating does not necessarily reflect staff absent from work. For example, there will be staff who are able to continue working at home.