Embed Size (px)
Citation preview
RESEARCH ARTICLE10.1002/2016JC011959
New insights on the upper layer circulation north of theGulf of GuineaG. Herbert1, B. Bourles1, P. Penven2, and J. Grelet3
1Institut de Recherche pour le D�eveloppement, Laboratoire d’Etudes en G�eophysique et Oc�eanographie Spatiales, Brest,France, 2Institut de Recherche pour le D�eveloppement, Laboratoire d’Oc�eanographie Physique et Spatiale, Brest, France,3Institut de Recherche pour le D�eveloppement, Unit�e de Service Instrumentation, Moyens Analytiques, Observatoires enG�eophysique et Oc�eanographie, Brest, France
Abstract The oceanic circulation in the upper layers of the north of the Gulf of Guinea is analyzed, asinferred from in situ observations and numerical simulations. This particular region, in spite of the presenceof a coastal upwelling and its impact on resources and regional climate, is still poorly documented. Cruisescarried out in the framework of different international programs (e.g., EGEE/AMMA, PIRATA) allowed toshow the existence of an eastward flowing undercurrent, found under the Guinea Current, named the Guin-ea UnderCurrent (GUC). Numerical results from high resolution simulation allowed the description of theseasonal variability of this current. It appears that the GUC is stronger in spring and reverses westward inAugust–September. We also depict the fate and the sources of the GUC based on selected trajectories fromnumerical particle tracking. The simulated trajectories reveal: (i) a preferred route of the GUC along 48Nfrom Cape Palmas to Cape Three Points and following the coast east of Cape Three Points; (ii) strong recircu-lations in the most eastern part of the Gulf of Guinea and off Cape Palmas including warm and salty watersof the South Equatorial Current; (iii) a weak inflow from northern latitudes through a subsurface currentflowing southward along the West African coast. In addition, Lagrangian experiments show that the GUC isnot an extension of the North Equatorial UnderCurrent and confirm that this current does not penetrateinto the Gulf of Guinea.
1. Introduction
The Gulf of Guinea (GG) is a particular region of the Tropical Atlantic characterized by a strong variability ofthe Sea Surface Temperature (SST) at seasonal to interannual time scales [e.g., Picaut, 1983], and where theEquatorial UnderCurrent (EUC) termination plays a significant role for the Atlantic Subtropical Cell and theglobal inter-hemispheric transport of salty subtropical waters [e.g., Hazeleger and de Vries, 2003; Schott et al.,2004]. It has been the subject of many recent studies, mainly dedicated to the analysis of the processesresponsible for the Atlantic Cold Tongue (ACT) and its potential impact on the West African Monsoon(WAM) in the framework of the international ‘‘African Monsoon Multidisciplinary Analysis’’ (AMMA) [Redel-sperger et al., 2006] program [e.g., Kolodziejczyk et al., 2009; Marin et al., 2009; Brandt et al., 2011; Caniauxet al., 2011; Leduc-Leballeur et al., 2013].
The GG is also a place where a particular coastal upwelling is present in the North along the zonal coastbetween Liberia and Nigeria [Roy, 1995]. In contrast to other most coastal upwelling systems, it occurs alonga zonal coast and is not explained by the wind and Ekman theory only [Bakun, 1978]. Different hypothesishave been put forward [Marchal and Picaut, 1977; Djakour�e et al., 2014, 2016] to explain this upwelling,including the seasonal intensification of the Guinea Current (GC) [Morliere, 1970; Bakun, 1978; Colin, 1988].
The GC is generally considered as an eastward continuation of the North Equatorial CounterCurrent (NECC),intensified in boreal summer-fall [Hisard and Merle, 1979; Arnault, 1987; Stramma and Schott, 1999; Lumpkinand Garzoli, 2005]. However, a precise description of the circulation in the north of Gulf of Guinea and of itsvariability is still needed for a better understanding of the regional ocean and coastal upwelling dynamics.Close to the coast, a westward current under the GC were measured for the first time in September 1964and described by Donguy and Priv�e [1964], firstly named Guinea CounterCurrent (GCC) or Ivoirian UnderCur-rent (IUC) for its component located over the continental shelf [Lemasson and Rebert, 1968], then Guinea
Key Points:� A 100/250 m depth eastward current
observed north of 48N in the Gulf ofGuinea: the Guinea UnderCurrent� The Guinea UnderCurrent is stronger
in spring and reverses westward inAugust–September� It is fed from recirculation current
system and a weak subsurfacecurrent flowing along the WestAfrican coast
Correspondence to:G. Herbert,[email protected]
Citation:Herbert, G., B. Bourles, P. Penven, andJ. Grelet (2016), New insights on theupper layer circulation north of theGulf of Guinea, J. Geophys. Res. Oceans,121, 6793–6815, doi:10.1002/2016JC011959.
Received 11 MAY 2016
Accepted 26 AUG 2016
Accepted article online 29 AUG 2016
Published online 13 SEP 2016
VC 2016. American Geophysical Union.
All Rights Reserved.
HERBERT ET AL. CIRCULATION NORTH OF THE GULF OF GUINEA 6793
Journal of Geophysical Research: Oceans
PUBLICATIONS
UnderCurrent (GUC) by Lemasson and Rebert [1973a]. Lemasson and Rebert [1973b] suggested that the GUCoriginates in the far east of the Gulf of Guinea and appears at the surface during some periods of the year,and named the westward flow observed around 38N west of 68E the GCC. Verstraete [1992] described thesubthermocline westward flows as being separated in two components: a coastal GUC flowing along theshelf break and, around 38N, the GCC considered as being a possible northern part of the EUC return flow.At subsurface depths, the fate of the eastward North Equatorial UnderCurrent (NEUC) in the eastern TropicalAtlantic is still not clear. This current, fed by subtropical salty waters, also contributes to the Subtropical Celland supplies upwelled waters in the East. Most of the studies suggest that the NEUC does not penetrateinto the GG, since it is rather deviated northward during its eastward route off West Africa and veering with-in the Guinea Dome [Hisard et al., 1976; Arhan et al., 1998; Stramma and Schott, 1999; Bourles et al., 2002].However, Mercier et al. [2003] observed subsurface eastward currents in January–March 1995 (i) at 98Waround 28 300N that they suggested to be a signature of the NEUC and (ii) at 38E around 48N that they attrib-uted to the GC (and not to the NEUC). During the same period, these authors also observed a westwardflow associated with salinity maximum waters around 38N at 38E. Such subsurface salinity maximum, thatcan only be transported by the EUC into the region, has already been observed either associated to west-ward or eastward flows [e.g., Piton and Wacongne, 1985; Verstraete; 1992; Gouriou and Reverdin, 1992]. Fromrecent in situ measurements, Kolodziejczyk et al. [2014] clearly evidenced EUC westward recirculations in theeastern GG south and north of the equator, around 38S and 38N, confirming earlier suggestions by Verstraete[1992], but additionally described the seasonal variability of these currents and of the EUC maximum salinitywaters fate in the equatorial band. The northern recirculation around 38N could correspond to the GCCdescribed by Lemasson and Rebert [1973b] and Verstraete [1992] at this latitude, but could also be associat-ed with the northern branch of the South Equatorial Current (nSEC) [Stramma and Schott, 1999]. Precise def-initions and descriptions of both the GCC and the GUC and of their variability are still missing and areneeded.
In this paper, we provide additional information of the currents in the north of the Gulf of Guinea as inferredfrom in situ observations carried out in the framework of different international programs, and mostly focuson eastward flows. The analysis of observations clearly evidences the presence of an eastward flow with rel-ative velocity maxima in the 100/250 m depth range close to the coast, which may reverse to a westwardflow. Hereinafter, and to clarify the different currents names found in the literature, we will define this flowto be the Guinea UnderCurrent (GUC) since it is observed below the GC and in the same direction. Thedetailed analysis of our observations induce some questions: 1) is the GUC the result of a direct advectionfrom the west or of local recirculation? 2) what is its seasonal variability? 3) is it linked to the GC, part of it,or the signature of local circulation pattern?
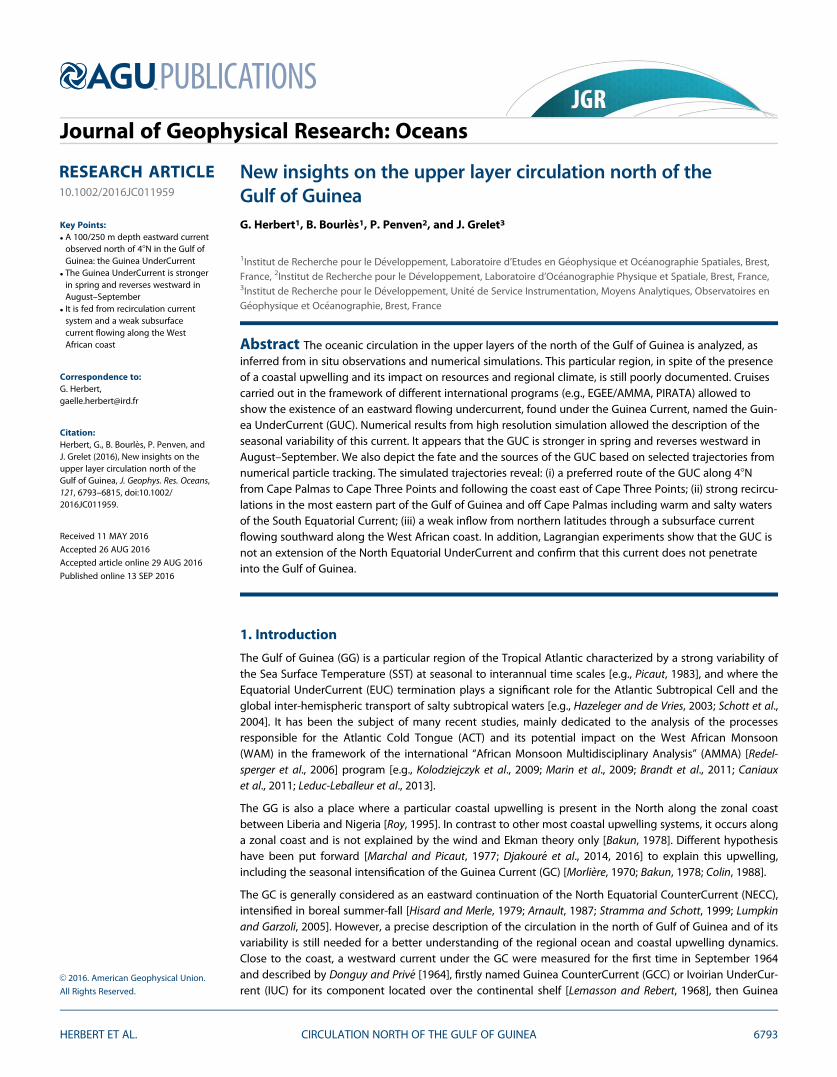
Since the cruises are sparsely distributed along the year, we also use results of a high resolution numericalmodel of the regional ocean circulation in order to better describe the complex circulation in this particulararea and to analyze the seasonal variability of the observed currents (Figure 1). In particular, our
Figure 1. Parent and child ‘s domain (indicated by the black square) superimposed with black solid and dashed arrows indicating respec-tively main surface and subsurface currents in the area: NEC: North Equatorial Current; nSEC: Northern South Equatorial Current, cSEC: Cen-tral South Equatorial Current; sSEC: Southern South Equatorial Current; EUC: Equatorial Under Current; NECC: North Equatorial CounterCurrent; NEUC: North Equatorial Under Current; NBC: North Brazil Current; GC: Guinea Current; GUC: Guinea Under Current. The contourslines indicate the bathymetry at 1000, 1500, 2000, 3000, and 4000 m. Cape Palmas and Cape Three Points are respectively indicated by C.Pand C.T.P.
Journal of Geophysical Research: Oceans 10.1002/2016JC011959
HERBERT ET AL. CIRCULATION NORTH OF THE GULF OF GUINEA 6794
investigation takes a Lagrangian point of view based on a tracking of particles advected by the modelvelocity field in order to further clarify the water mass pathways in the studied region. The data, the numeri-cal model and the Lagrangian tool are presented in section 2. Section 3 is dedicated to the description of insitu measurements while the model results are presented in section 4. After comparisons between thenumerical model results and in situ measurements, the model is used to describe the seasonal variations ofthe currents and associated salinity. Then, the results obtained from Lagrangian experiments are described.Finally, a conclusive discussion of the main results is proposed in section 5.
2. Method
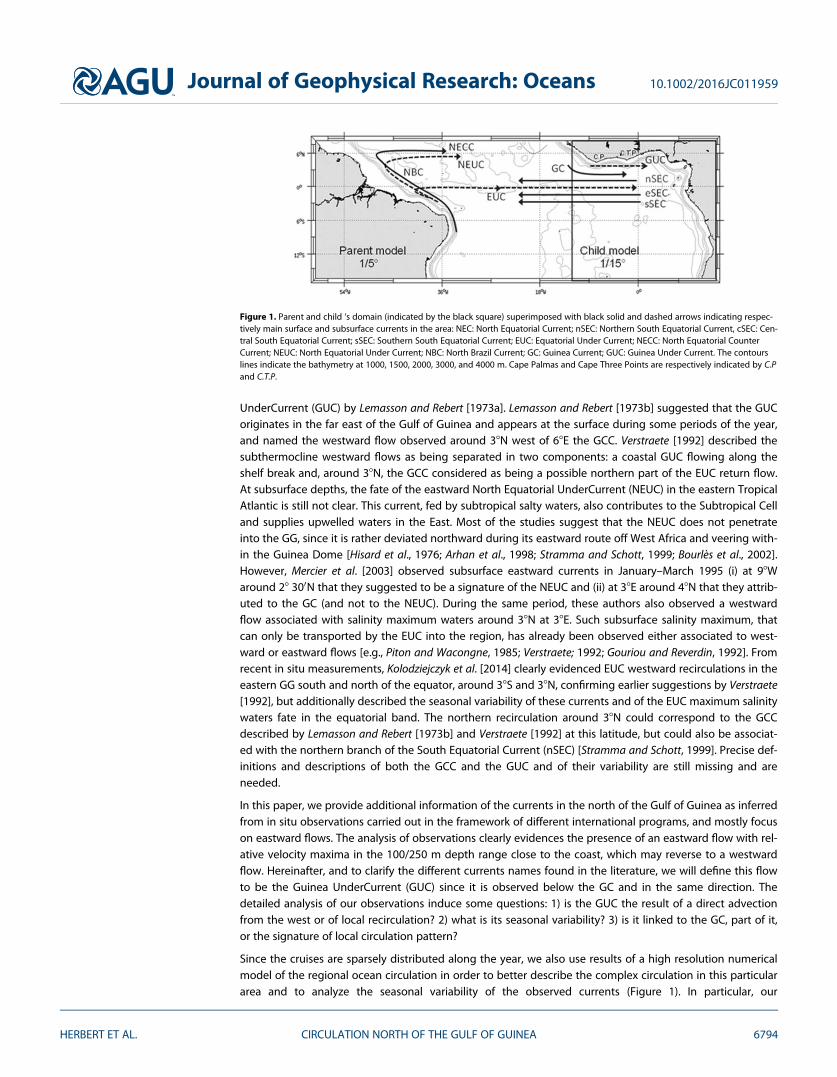
2.1. In Situ DataThe data used in this study were collected in the Gulf of Guinea principally during recent cruises carried outin the framework of the programs ‘‘Prediction and Research moored Array in the Tropical Atlantic’’ (PIRATA)[Bourles et al., 2008] and « Etude de la circulation oc�eanique et des �echanges oc�ean-atmosphere dans leGolfe de Guin�ee » (EGEE) [Bourles et al., 2007], the French oceanographic component of the ‘‘African Mon-soon Multidisciplinary Analysis’’ program (AMMA) [Redelsperger et al., 2006]. We also occasionally used addi-tional older data from the CITHER-3 cruise [Mercier et al., 2003] and from the EQUALANT 1999 and 2000cruises [Bourles et al., 2002]. The data from cruise dates prior to 1995 have not been used due to a lack ofprecision of the current measurements. All the sections of the cruises carried out in our area of study areshown on Figure 2. During all these cruises, hydrological profiles were carried out at a spatial resolution of1/38 to 1/28 in latitude along meridional sections. We have selected the measurements in the region of theGulf of Guinea, north of 28N. Temperature, salinity and dissolved oxygen measurements were collectedfrom CTD-O2 SeaBird probes [Kolodziejczyk et al., 2009], except for during CITHER-3 cruise during which aNeil-Brown Mark III CTD instrument was used [e.g., Hisard and H�enin, 1987; Gouriou and Reverdin, 1992; Mer-cier et al., 2003]. For most of the cruises, measurements of the two horizontal components of the currentswere carried out with a Ship-mounted Acoustic Doppler Current Profilers (SADCP) (for details on acquisitionand measurements accuracy, see Kolodziejczyk et al. [2009] and Herbert et al. [2015]). En-route SADCP meas-urements cover the depth range from about 20 m down to 200 m or 350 m, depending upon the SADCPacoustic signal frequency. Absolute referencing was provided by Global Positioning System (GPS)navigation.
2.2. Numerical ModelThe numerical model used in this paper is the Regional Oceanic Modeling System (ROMS) [Shchepetkin andMcWilliams, 2005]. ROMS is a three-dimensional free surface, split-explicit ocean model which solves theNavier-Stokes primitive equations following the Boussinesq and hydrostatic approximations. We used the
Figure 2. Map of oceanographic sections obtained during EQUALANT, PIRATA, EGEE, and CITHER1/3 cruises.
Journal of Geophysical Research: Oceans 10.1002/2016JC011959
HERBERT ET AL. CIRCULATION NORTH OF THE GULF OF GUINEA 6795
ROMS version developed at the Institut de Recherche pour le D�eveloppement (IRD) featuring a two-waynesting capability based on AGRIF (Adaptative Grid Refinement In Fortran) [Debreu et al., 2012]. The two-way capability allows interactions between a large-scale (parent) configuration at lower resolution and aregional (child) configuration at high resolution (see Figure 1). The ROMSTOOLS package [Penven et al.,2008] is used for the design of the configuration. The model configuration is built following the one per-formed by Djakour�e et al. [2014] over the Tropical Atlantic. The large scale domain extends from 608W to15.38E and from 178S to 88N and the nested high resolution zoom focuses between 178S and 6.68N andbetween 108W and 14.18E domain. This configuration allows for equatorial Kelvin waves induced by tradewind variations in the western part of the basin to propagate into the Gulf of Guinea and influence thecoastal upwelling [Servain et al., 1982; Picaut, 1983]. The horizontal grid resolution is 1/58 (i.e., 22 km) for theTropical Atlantic (parent) grid and 1/158 (i.e., 7 km) for the Gulf of Guinea (child) grid. This should allow anaccurate resolution of the mesoscale dynamics since the first baroclinic Rossby radius of deformation rangesfrom 150 to 230 km in the region [Chelton et al., 1998]. The vertical coordinate is discretized into 45 sigmalevels with vertical S-coordinate surface and bottom stretching parameters set to theta_s56 andtheta_b50, to keep a sufficient resolution near the surface for an accurate resolution of the GC [Haidvogeland Beckmann, 1999]. The vertical S-coordinate Hc parameter, which gives approximately the transitiondepth between the horizontal surface levels and the bottom terrain following levels, is set to Hc510 m. TheGEBCO1 (Global Earth Bathymetric Chart of the Oceans) is used for the topography (www.gebco.net). Therunoff forcing is provided from Dai and Trenberth’s global monthly climatological run-off data set [Dai andTrenberth, 2002]. The rivers properties of salinity and temperature are prescribed as annual mean values.One river (Amazon) is prescribed in the parent model while five rivers, that correspond to the major riverspresent in the region, are prescribed in the child model (Congo, Niger, Ogoou, Sanaga, Volta). At the surface,the model is forced with the surface heat and freshwater fluxes as well as monthly wind stress climatologyderived from the Comprehensive Ocean Atmosphere Data Set (COADS) (horizontal resolution of 18x1) [DaSilva et al., 1994]. Our model has three open boundaries (North, South, and West) forced by temperatureand salinity fields from the World Ocean Atlas 2009 (WOA09) monthly climatology (horizontal resolutionof 18x18). The simulation has been performed on IFREMER Caparmor super-computer and integrated for15 climatologic years with the outputs averaged every 2 days. A statistical equilibrium is reached after6 years of spin-up. Model analyses are based on the monthly averaged model outputs averaged from year7 to year 15.
2.3. The ARIANE Lagrangian Diagnostic ToolLagrangian diagnoses have been made using an off-line ARIANE Lagrangian diagnostic tool [Blankeand Raynaud, 1997, http://stockage.univ-brest.fr/grima/Ariane/] developed in LOPS (Laboratoired’Oc�eanographie Physique et Spatiale).
ARIANE is a computational tool dedicated to the offline computation of 3-D streamlines in a given outputvelocity field and subsequent water masses analyses. The analysis consists of releasing virtual particles andadvecting them using the model 3-D time-varying velocity fields. As the particles are only advected by themodel velocities fields, the turbulent diffusion processes are not explicitly used to calculate the trajectories.The signature of those processes, parameterized in the numerical model, is provided implicitly by thealong-trajectory change in tracer properties calculated by the local Eulerian fields of the model. Otherwise,the diagnostic tool gives the possibility to choose between two different modes, qualitative and quantita-tive. For our study, Lagrangian experiments were performed offline to identify the pathway and the originof the eastward subsurface current observed and simulated by the model north of 28N. The trajectory ofeach particle is computed at every grid cell at their storage frequency, i.e., using successive monthly aver-aged modeled velocity fields. The method is presented in detail and discussed by Blanke and Raynaud[1997] and Blanke et al. [1999].
3. Results From In Situ Observations
All the six EGEE cruises carried out from 2005 to 2007 allowed to get high quality measurements along oraround 28500E when leaving from, or returning back to, the port of Cotonou (Benin); three cruises were inearly boreal summer (May–July) and the three other ones in boreal fall (September–November) during each
Journal of Geophysical Research: Oceans 10.1002/2016JC011959
HERBERT ET AL. CIRCULATION NORTH OF THE GULF OF GUINEA 6796

year. We mainly focus in this paper on the flows located north of 2–38N, i.e., around the GC and surroundingflows.
3.1. Highlight of an Eastward Flow Below the GCMeasurements of the zonal component of the currents along 28500E and 28200E during the three cruisesdone in June (Figure 3) show the eastward GC in the upper 50 m between 28300N and 58N in June 2005 andJune 2007. In June 2006, it is mostly found between 38300N and 58N. It appears with deeper extensions inJune 2006 and 2007, when eastward velocities are observed down to 200/250 m depth below its surfacevelocity core (up to 20 cm.s21).
In June 2006 and June 2007, the GC is embedded between westward flows. The main one, located south of48N, corresponds to the GCC [Lemasson and Rebert, 1973b; Verstraete, 1992] and/or to the nSEC [Tsuchiya,1986; Stramma and Schott, 1999]. The one observed close to the surface around and north of 58N, with a rel-ative velocity maximum around 50 m depth, corresponds to the GUC, according to Lemasson and Rebert[1973b]. This westward flow appears down to 250 m depth in June 2006, with a second relative velocitycore around 150 m depth. In June 2005, the surface GC north-south extension is larger andthe distinction ofthe two westward flows is less evident.
Figure 3. Vertical sections of zonal velocity (cm.s21) down to 300 meters depth from 2 min averaged SADCP measurements obtained during the EGEE1, EGEE3 and EGEE5 cruises, carriedout respectively during 25–26 June 2005, 15–16 June 2006, and 14–16 June 2007 at 2839’ E, 2850’E and 2820’E.
Figure 4. Vertical sections of zonal velocity (cm.s21) down to 300 m depth between 28N and 68N from 2 min averaged SADCP measure-ments obtained during the EGEE2 and EGEE4 cruises carried out respectively during (left) September 2005 at 2850’E and (right) November2006 at 2820’E.
Journal of Geophysical Research: Oceans 10.1002/2016JC011959
HERBERT ET AL. CIRCULATION NORTH OF THE GULF OF GUINEA 6797

An interesting new feature is the presence of eastward flows trapped along the coast, with a velocity corebetween 50 and 150 m in June 2005 and between 150 and 200 m depth in June 2007, when eastwardvelocities reach 20 cm.s21. To our knowledge, it is the first time that such eastward flows, clearly distinctfrom the surface GC, are observed at this location (keeping in mind that this area was still very poorly docu-mented before these cruises, principally below the surface).
In order to verify if such eastward subsurface coastal flows have also been observed at other longitudesand/or during other (previous) cruises, although they were not explicitly identified in the rare previous stud-ies, we looked at other available zonal current sections that allowed evidencing the presence of these flows.For example, current measurements carried out in fall along the same longitude in September 2005 andNovember 2006 (Figure 4) also show the presence of a subsurface eastward velocity core trapped at thecoast between 100 and 250 m depth in September and November 2006, but characterized with weakervelocities than during spring.
Farther in the west, measurements have been obtained along 48W in April 2012 (PIRATA-FR22; Figure 5,left). During this cruise, the GC is observed between 28300N and 48300N with a velocity core about 30 mdepth reaching 50 cm.s21. A westward flow is also observed from 48300N to the coast. A subsurface east-ward flow is observed between 50 m to 250 m depth, below the GC, with a velocity maximum at 250 mdepth (�20 cm.s21) and between 48N to 48400N. It is separated from the coast by a thin westward flow. Alsoalong 48W, a cruise done in October 1998 (PIRATA-FR2), strongly suggest the presence of a coastal eastwardflow below 100 m depth (not shown).
The eastward current is also observed at 78W, from measurements obtained in March 2012 (PIRATA-FR22;Figure 5, middle). At this location the GC extends from 28N to 48300N with a surface velocity maximum ofabout 45 cm.s21. The eastward flow is observed below the GC from 100 m to 250 m depth with two maxi-mum velocities: one close to the coast and another around 38500N. At this location, just off Cape Palmas,the eastward flow velocities are higher than farther in the east, suggesting two different contributions tothis flow.
Along the slanted section from 38E-28N to 48W-68N (PIRATA-FR22; Figure 5, right), two eastward subsurfaceflows are observed: one branch between 3.58N-48N around 28100W and another branch trapped to the coastnorth of 58N, between 38100W and 48W.
In order to help the identification of the different observed currents, and to avoid any possible confusiondue to the different names used in the literature for the same currents (as recalled in the introductionabove), we choose hereinafter to name the coastal westward flow as the Guinea CounterCurrent (GCC, inopposite direction to the GC), and to name the eastward flow observed in the subsurface layers (same direc-tion but at lower depths than the GC) the Guinea UnderCurrent (GUC), while the westward flow observe
Figure 5. Vertical sections of zonal velocity (cm.s21) down to 300 meters depth north of 28N from 2 min averaged SADCP measurement obtained during the PIRATA-FR22 cruise carriedout in April 2012 respectively at (left) 48W, (middle) 78W, and (right) from 38E/28N to 48W/58N.
Journal of Geophysical Research: Oceans 10.1002/2016JC011959
HERBERT ET AL. CIRCULATION NORTH OF THE GULF OF GUINEA 6798

south of 48N is clearly identified as to be a deep component of the nSEC, issued from the northern recircula-tion of the EUC. Analyzes of the SADCP zonal current measurements have been made for all the cruises athand carried out in the area and the depth/latitude of the GUC during the different cruises has been identi-fied and summarized in Table 1. In particular, we have selected 43 vertical sections located between 28Nand the northern coast and the Gulf of Guinea, sparsely distributed along the year (most of sections (26/43)are available during April/May/June while only 7 sections are available during boreal summer (July, August,September)).
The results indicate that:
1) the GUC is observed for all sections obtained during March/April/May and missing during those obtainedduring July/August where the current is reversed westward, suggesting a seasonal variability of the GUC; 2)When the GUC is observed, it is located around 48N – 48300N in the western part of Gulf of Guinea andtrapped to the coast in the eastern part of the Gulf; however for three sections obtained around 48W, twoveins are observed: one around 48N-48300N and another one trapped to the coast; 3) The upper part of theGUC core tends to be deeper in winter and spring (from January to June) (150 m for 4/33 sections and
Table 1. Observation of the GUC
Month Year Cruise GUC (Y/N)GUC CoreLongitude
GUC CoreLatitude GUC Deptha
January 1995 Cither 3 Y 78W 48N 50–250 m1998 Pirata fr1b Y 58W 48N 100–200 m1999 Pirata fr3 Y 58W 48N 150–200 m2003 Pirata fr11 Y 1815’E 38N 100–150 m
March 1993 Cither 1 Y 48W 48N 100–250 m1995 Cither 3 Y 38E 48N 100–250 m2000 Pirata fr6 Y 58W 48N 100–200 m
April 2012 Pirata fr22 leg1 Y 78W 4840’N 100–250 m2012 Pirata fr22 leg1 Y 5810’W 4830’N 100–250 m2012 Pirata fr22 leg2 Y 48W 4830’N 100–250 m2012 Pirata fr22 leg2 Y 68W and 48W 48N and 4848N 100–250 m and
150–250 m2012 Pirata fr22 leg3 Y 3838’W 4830N 100–250 m2012 Pirata fr22 leg3 Y 2810’W and 3810’W 48N and 4.408N 100–200 m and
150–250 m2014 Pirata fr24 Y 5840’W 48N 150–200 m
May 2011 Pirata fr21 leg1 Y 2820’E 68N 100–250 m2011 Pirata fr21 leg2 Y 2820’E 68N 100–200 m2011 Pirata fr21 leg2 Y 2810’E 68N 100–250 m2011 Pirata fr21 leg3 Y 2825’E 5850N 100–250 m2013 Pirata fr23 leg1 Y 5840’W 48N 150–250 m2014 Pirata fr24 Y 48W 58N 100–150 m
June 2005 Egee1 Y 68E 38N 100–200 m2005 Egee1 Y 2850’E 5830’N 50–200 m2005 Egee1 Y 28W 48N 50–200 m2005 Egee1 Y 2850’E 68N 50–100 m2006 Egee3 N 2850’E2007 Pirata fr16 Y 0830’E 5820’N 50–250 m2007 Egee5/Pirata fr17 Y 2850’E 68N 100–250 m2007 Egee5/Pirata fr17 Y 2820’E 5850’N 100–200 m2007 Egee5/Pirata fr17 Y 68E 48N 100–200 m2007 Egee5/Pirata fr17 Y 0830’E 5820’N 100–250 m2007 Egee5/Pirata fr17 Y 2850’E 68N 50–250 m2013 Pirata fr23 leg2 Y 2830’W 48N 150–250 m2013 Pirata fr23 leg2 Y 2820’W 3850’N 100–200 m
July 2000 Eq2000/Pirata fr7 N 68EAugust 1999 Eq1999/Pirata fr5 N 58WSeptember 2005 Egee2 Y 2850’E 5830’N 50–150 m
2005 Egee2 Y 2820’E 58N40’ 50–150 m2005 Egee2 N 2815’E2007 Egee6 Y 1845’E 5820’N 50–250 m2008 Pirata fr18 Y 2820’E 5850’N 100–250 m
October 1998 Pirata fr2 Y 58W 3840’N 100–200 m2010 Pirata fr20 leg2 Y 1853’E 58N 50–200 m
November 2006 Egee4 Y 2850’E 5830’N 50–250 m
aNote that the depth range of the GUC is limited by the SADCP depth range (�200–300 m).
Journal of Geophysical Research: Oceans 10.1002/2016JC011959
HERBERT ET AL. CIRCULATION NORTH OF THE GULF OF GUINEA 6799
100 m for 22/33 sections) than in fall (from September to November) (50 m for 5/8 sections). Its lower partis more difficult to estimate given the depth range of the SADCP measurements (�200 to 300 m).
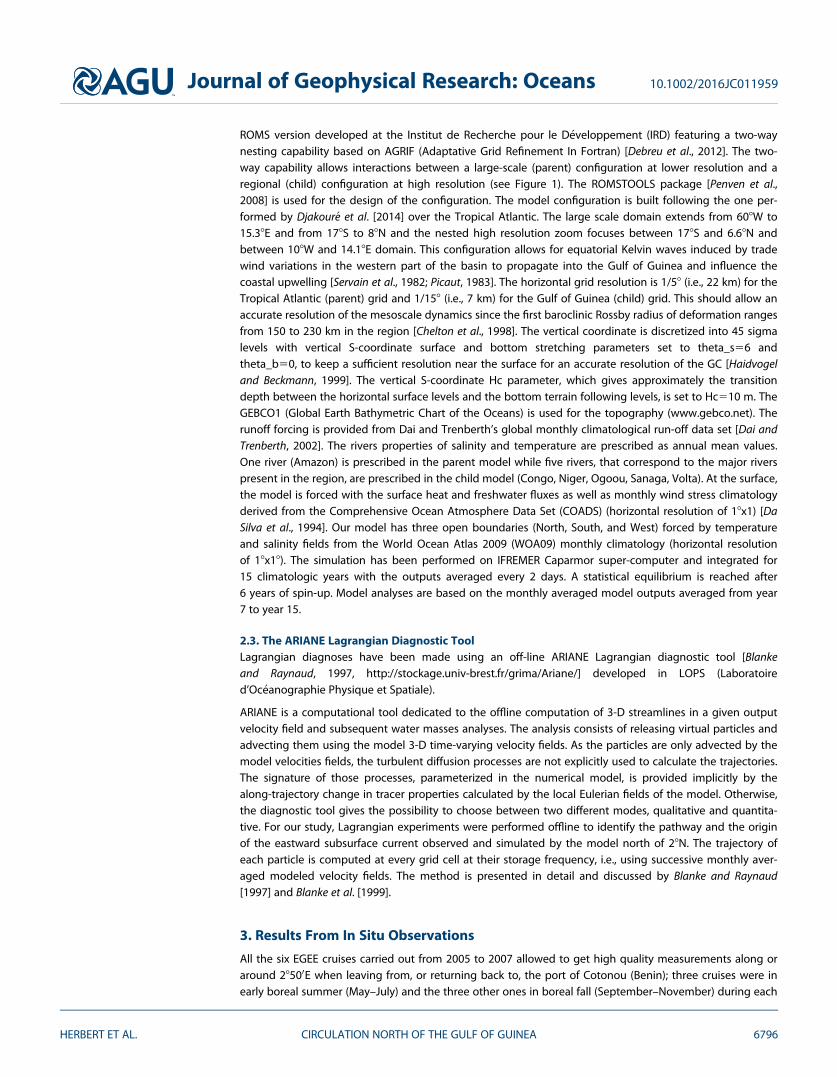
In addition, to estimate the robust component of the eastward subsurface signal attributed to the GUC, themean of the vertical distribution of zonal velocities from 28N to the north coast of Gulf of Guinea has beencalculated for April–May–June period by combining SADCP sections in two distinct areas: 6 sections West ofCape Three Points around 48W and 8 sections East of Cape Three Points around 28200E. These averaged sec-tions are shown on Figure 6.
In spite of large variability (more important around 48W), the results clearly confirm that the GUC is a robustcomponent of the circulation in this region and that it exhibits different patterns along both longitudes, asalready summarized from individual sections. Around 48W, the GUC is located from 150 m to 250/300 mdepth and north of 48N, whereas around 28200E, it is located from 100 m to 200/250 m depth and north of58N, trapped to the coast.
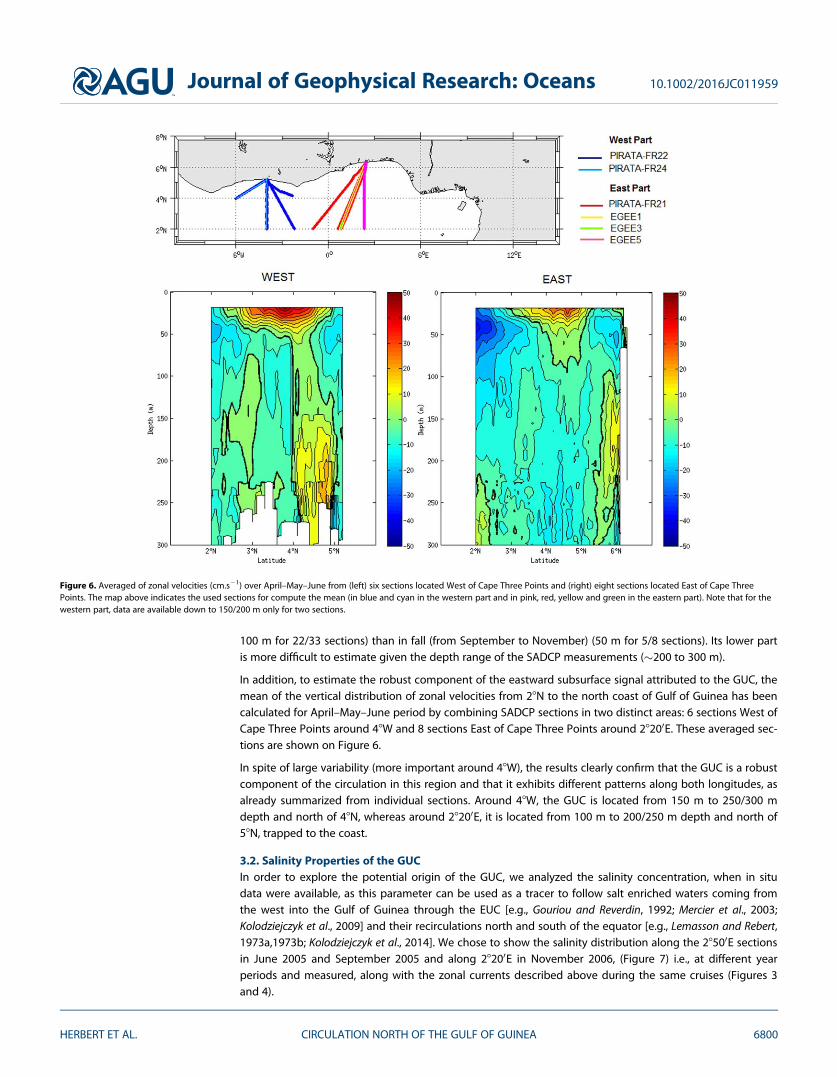
3.2. Salinity Properties of the GUCIn order to explore the potential origin of the GUC, we analyzed the salinity concentration, when in situdata were available, as this parameter can be used as a tracer to follow salt enriched waters coming fromthe west into the Gulf of Guinea through the EUC [e.g., Gouriou and Reverdin, 1992; Mercier et al., 2003;Kolodziejczyk et al., 2009] and their recirculations north and south of the equator [e.g., Lemasson and Rebert,1973a,1973b; Kolodziejczyk et al., 2014]. We chose to show the salinity distribution along the 28500E sectionsin June 2005 and September 2005 and along 28200E in November 2006, (Figure 7) i.e., at different yearperiods and measured, along with the zonal currents described above during the same cruises (Figures 3and 4).
Figure 6. Averaged of zonal velocities (cm.s21) over April–May–June from (left) six sections located West of Cape Three Points and (right) eight sections located East of Cape ThreePoints. The map above indicates the used sections for compute the mean (in blue and cyan in the western part and in pink, red, yellow and green in the eastern part). Note that for thewestern part, data are available down to 150/200 m only for two sections.
Journal of Geophysical Research: Oceans 10.1002/2016JC011959
HERBERT ET AL. CIRCULATION NORTH OF THE GULF OF GUINEA 6800
We observe a layer of relative salinity maxima that extends over the whole sections from 28N to the Africancoast in the 50–100 m depth range, with a salinity core (up to 35.9 psu) around or just below 50 m depth. Inthe literature, this salinity maximum is explained by eastward advection in the area of subtropical waters.During the EGEE4 cruise, the eastward flow highlighted in 50–250 m depth layer in Figure 3 is associatedwith a salinity maximum. Also, during the EGEE1 cruise, although less obvious, a slight salinity maximum isnoticed close to the coast at the location of the eastward flow in the 50–150 m depth layer. During theEGEE2 cruise, the association between the eastward subsurface flow and the salinity maximum is lessobvious.
Such observations induce some questions: 1) is the subsurface eastward flow observed around 100–250 mdepth close to the coast the result of a direct advection from the west or of local recirculation? 2) what isthe seasonal variability of this flow, that apparently may reverse to a westward flow? 3) is the GUC, definedas the subsurface eastward flow observed below the GC with a relative velocity maxima in the 100–250 mdepth range, linked to the GC, part of it, or signature of local circulation pattern?
4. Presentation of Numerical Results
Despite of the large quantities of current measurements obtained during the cruises carried out in the Gulfof Guinea since 1995, the spatial and temporal distribution of the measurements is not sufficient enough toinvestigate the spatial and temporal variations of the circulation in the area. For this reason, we use theresults of a numerical simulation to better understand the characteristics and variability of the circulationnorth of the Gulf of Guinea.
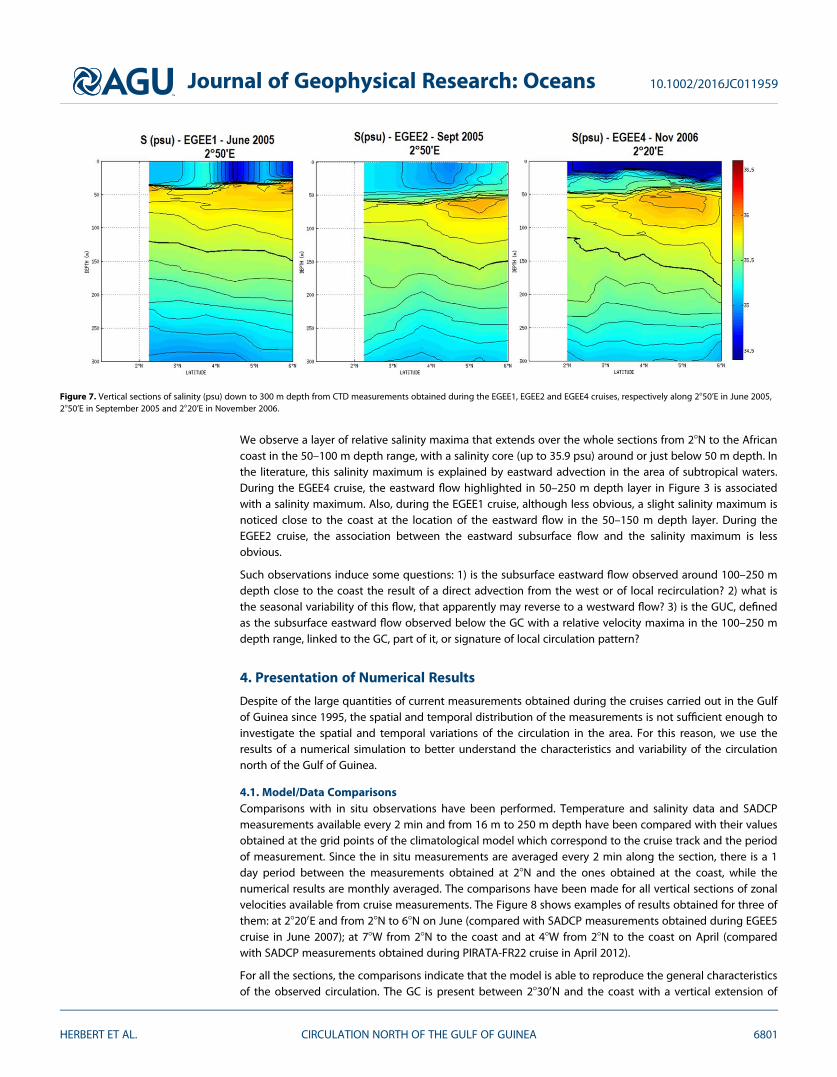
4.1. Model/Data ComparisonsComparisons with in situ observations have been performed. Temperature and salinity data and SADCPmeasurements available every 2 min and from 16 m to 250 m depth have been compared with their valuesobtained at the grid points of the climatological model which correspond to the cruise track and the periodof measurement. Since the in situ measurements are averaged every 2 min along the section, there is a 1day period between the measurements obtained at 28N and the ones obtained at the coast, while thenumerical results are monthly averaged. The comparisons have been made for all vertical sections of zonalvelocities available from cruise measurements. The Figure 8 shows examples of results obtained for three ofthem: at 28200E and from 28N to 68N on June (compared with SADCP measurements obtained during EGEE5cruise in June 2007); at 78W from 28N to the coast and at 48W from 28N to the coast on April (comparedwith SADCP measurements obtained during PIRATA-FR22 cruise in April 2012).
For all the sections, the comparisons indicate that the model is able to reproduce the general characteristicsof the observed circulation. The GC is present between 28300N and the coast with a vertical extension of
Figure 7. Vertical sections of salinity (psu) down to 300 m depth from CTD measurements obtained during the EGEE1, EGEE2 and EGEE4 cruises, respectively along 2850’E in June 2005,2850’E in September 2005 and 2820’E in November 2006.
Journal of Geophysical Research: Oceans 10.1002/2016JC011959
HERBERT ET AL. CIRCULATION NORTH OF THE GULF OF GUINEA 6801
about 40 m depth and zonal velocities reaching 50 cm.s21, surrounded by the two westward flows: theGCC, in a opposite direction of the GC and close to the coast, is well-established (values around 10 cm.s21)compared to observations at 78W and thicker than observation at 48W; and the nSEC south of the GC andextending at least down to 250 m depth. The eastward GUC is also simulated by the model, even withslightly weaker velocities than observations (around 10 cm.s21 against around 20 cm.s21), and at slightlydifferent depths or latitudes than observations, that may be partly explained by the thicker simulated GCClocated just above. At 48W, we can also notice a thin eastward vein trapped to the coast from 50 m to atleast 250 m depth, in agreement with observations (Figure 5 and Table 1). The simulated zonal velocities at48W and 28200E are also consistent with the mean sections calculated for April–May–June from SADCP dataaround 48W and around 28200E previously shown on Figure 6, indicating that the model reproduces theserobust components of the GUC in this area during spring.
Similar comparisons have been made with salinity and temperature sections drawn from available CTDmeasurements and numerical results.
Figure 9 shows three vertical sections of salinity at 78W, 48W and 28200E obtained respectively during twolegs of the PIRATA-FR22 cruise in April 2012 and during the EGEE5 cruise in June 2007. The figure can beanalyzed in tandem with zonal currents presented along the same sections in Figures 5 and 8. For each
Figure 8. Vertical sections of zonal velocity (cm.s21) down to 300 meters depth from the model at (a) 78W and (b) 48W in April (comparedwith the equivalent from SADCP measurements presented in Figure 4). (c) Same but at 2820’E from SADCP measurements obtained duringthe EGEE 5 cruise in June 2007, and (d) the equivalent simulated by the model. The instantaneous current measurements are comparedwith monthly averaged outputs of the climatologic numerical child model.
Journal of Geophysical Research: Oceans 10.1002/2016JC011959
HERBERT ET AL. CIRCULATION NORTH OF THE GULF OF GUINEA 6802
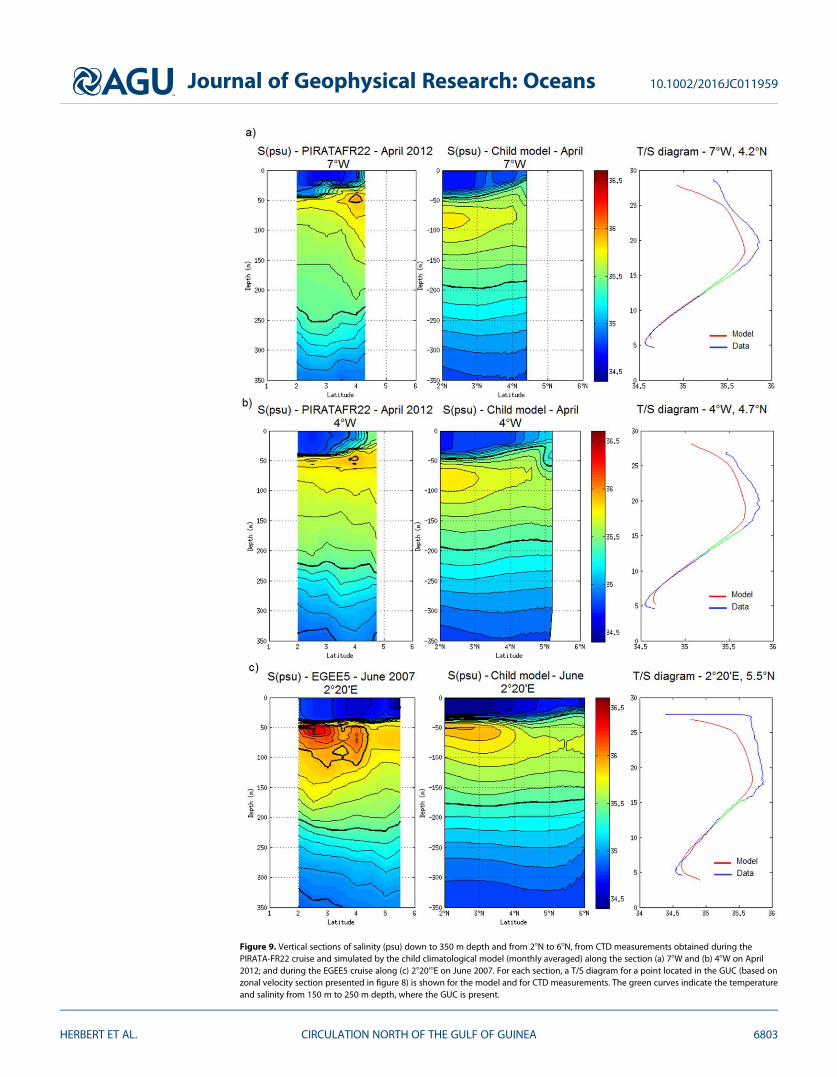
Figure 9. Vertical sections of salinity (psu) down to 350 m depth and from 28N to 68N, from CTD measurements obtained during thePIRATA-FR22 cruise and simulated by the child climatological model (monthly averaged) along the section (a) 78W and (b) 48W on April2012; and during the EGEE5 cruise along (c) 2820’8E on June 2007. For each section, a T/S diagram for a point located in the GUC (based onzonal velocity section presented in figure 8) is shown for the model and for CTD measurements. The green curves indicate the temperatureand salinity from 150 m to 250 m depth, where the GUC is present.
Journal of Geophysical Research: Oceans 10.1002/2016JC011959
HERBERT ET AL. CIRCULATION NORTH OF THE GULF OF GUINEA 6803
section a T/S diagram at the latitude where the GUC is observed and simulated is also shown. The greencurves indicate the temperature and salinity from 150 m to 250 m depth, where the GUC is present. Alongthe 3 sections, the simulated salinity is generally fresher than observations, up to 0.1 psu in the upper GUCand about 0.2 psu in the upper layers. These differences can be partly explained by a bias in the mean circu-lation pattern in the upper layers and by the fact that we compare instantaneous salinity measurementswith monthly averaged outputs of the climatologic numerical model, at one specific point. Thus, the highfrequency variability presents in in situ measurements are largely filtered in the numerical outputs. Howev-er, for the three longitudes, the T/S diagrams show that the salinity variations and maxima are relativelywell reproduced, allowing to follow significant water masses associated to the main currents.
The reliability of the model for its vertical structure (temperature, salinity and velocity), particularly in theequatorial band, has also been successfully tested by comparison with the annual mean of velocity, temper-ature and salinity, obtained by Kolodziejczyk et al. [2009] from 18 sections carried out along 108W (notshown).
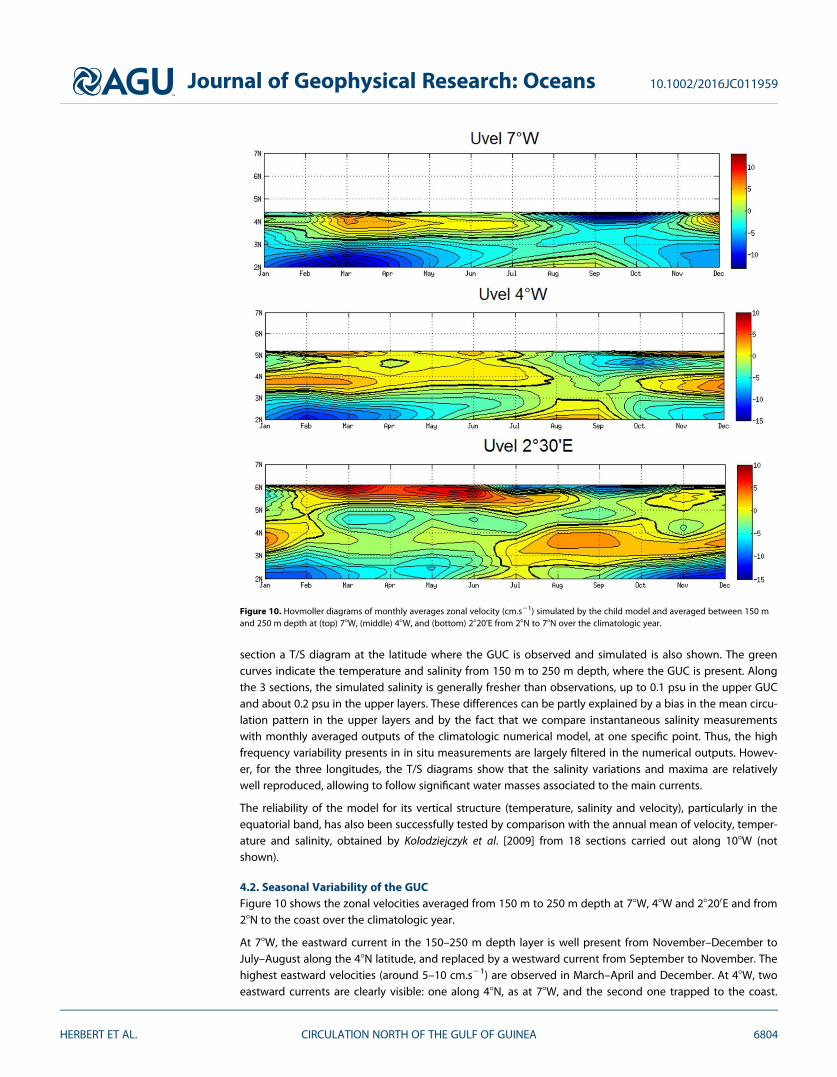
4.2. Seasonal Variability of the GUCFigure 10 shows the zonal velocities averaged from 150 m to 250 m depth at 78W, 48W and 28200E and from28N to the coast over the climatologic year.
At 78W, the eastward current in the 150–250 m depth layer is well present from November–December toJuly–August along the 48N latitude, and replaced by a westward current from September to November. Thehighest eastward velocities (around 5–10 cm.s21) are observed in March–April and December. At 48W, twoeastward currents are clearly visible: one along 48N, as at 78W, and the second one trapped to the coast.
Figure 10. Hovmoller diagrams of monthly averages zonal velocity (cm.s21) simulated by the child model and averaged between 150 mand 250 m depth at (top) 78W, (middle) 48W, and (bottom) 2820’E from 28N to 78N over the climatologic year.
Journal of Geophysical Research: Oceans 10.1002/2016JC011959
HERBERT ET AL. CIRCULATION NORTH OF THE GULF OF GUINEA 6804
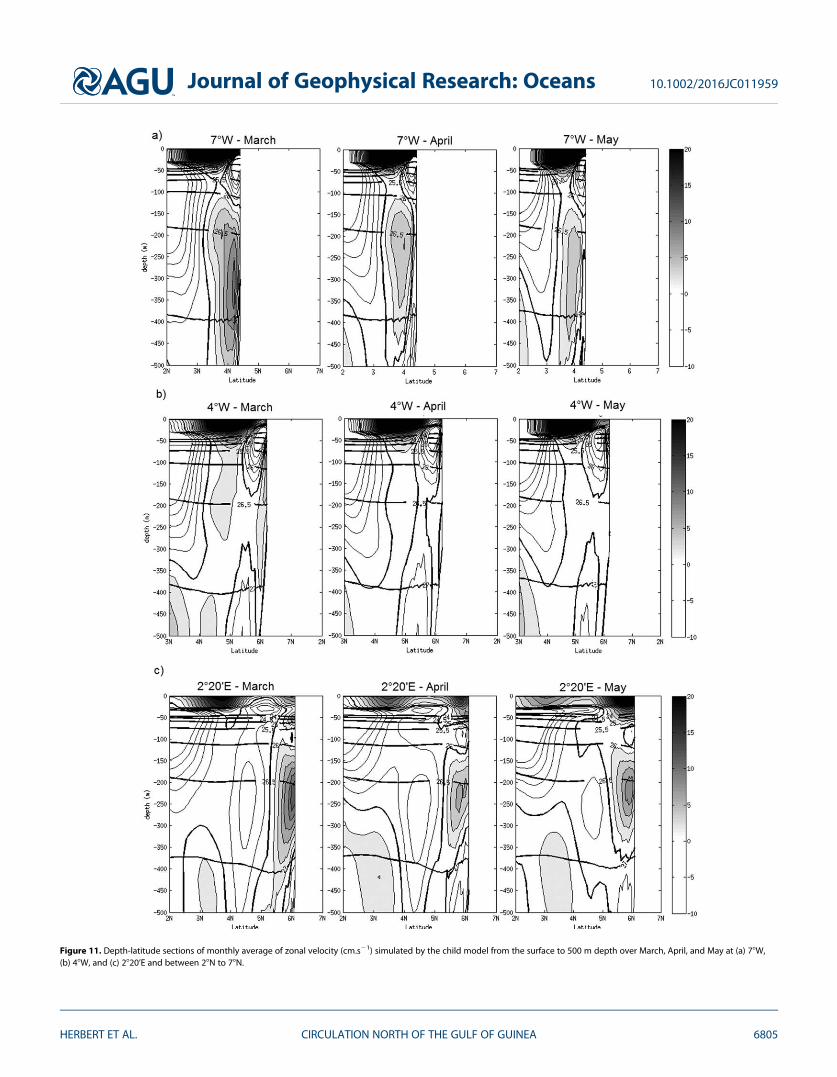
Figure 11. Depth-latitude sections of monthly average of zonal velocity (cm.s21) simulated by the child model from the surface to 500 m depth over March, April, and May at (a) 78W,(b) 48W, and (c) 2820’E and between 28N to 78N.
Journal of Geophysical Research: Oceans 10.1002/2016JC011959
HERBERT ET AL. CIRCULATION NORTH OF THE GULF OF GUINEA 6805
Both currents are present most of the year and replaced by westward flows from August to October. At28200E, two eastward currents are also present; around 3–48N it is mostly visible from July to January,while at the coast it appears from February to August and from October to December, with highestamplitude in March and May–June. In July–August and October–November, it is further off the coastthat from February to June. One might raise the question whether the eastward current observedaround 3–48N at 28200E from October to December is an eastward continuation of the one simulated at78W and 48W or has another origin. Furthermore, as previously noticed from comparisons betweenobservation and model results (Figure 8), the eastward velocities are slightly weaker at 48W than at 78Wand 28200E (maximum velocity core around 7 cm.s21 at 48W) maybe suggesting a recirculation zone off-shore of Cape Palmas and in the eastern part of Gulf of Guinea which would reinforce the eastward flowat this location.
In order to verify the vertical distribution of eastward velocities over the year and to give more details aboutthe eastward flow trapped to the coast, the depth-latitude sections of monthly averaged zonal velocities at78W, 48W and 28200E are shown in Figure 11 for March, April and May months. The eastward flow extendsfrom 100/150 m to 350/450 m depth with a maximum velocity core around 250/300 m depending of loca-tions. A strengthening of the flow at three locations in March is clearly depicted, in agreement with previousresults. In addition, the current is located between roughly the same isopycnal surfaces (26 and 27 kg.m23)for the three different locations indicating a connection between the currents at the west and at the east ofthe Gulf of Guinea. At 48W, a thin eastward component trapped to the coast is observed around 200 mdepth over the 3 months, in agreement with observations (Table 1) and previous results (Figure 10). In addi-tion to the GUC, we also noticed the westward 50/100 m depth flow under the GC identified as the GCC byLemasson and Rebert [1973b]. For the locations shown here, we do not notice any particular linkagebetween the GUC and the GCC.
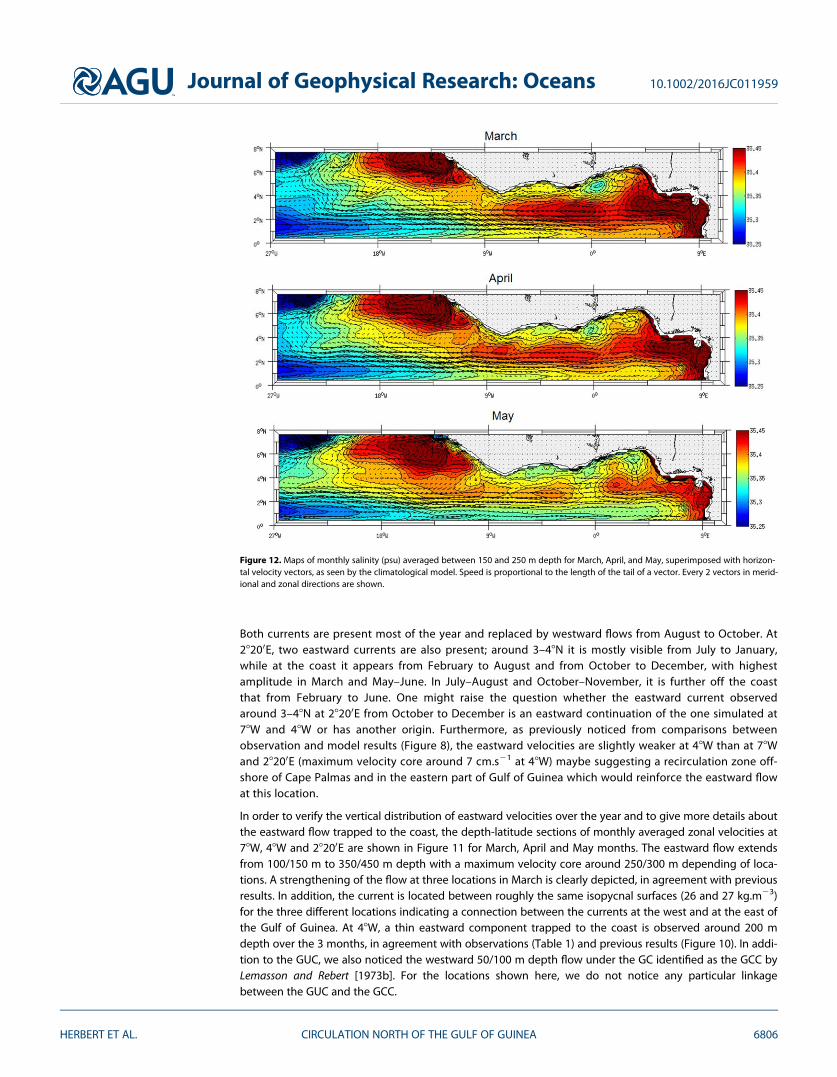
Figure 12. Maps of monthly salinity (psu) averaged between 150 and 250 m depth for March, April, and May, superimposed with horizon-tal velocity vectors, as seen by the climatological model. Speed is proportional to the length of the tail of a vector. Every 2 vectors in merid-ional and zonal directions are shown.
Journal of Geophysical Research: Oceans 10.1002/2016JC011959
HERBERT ET AL. CIRCULATION NORTH OF THE GULF OF GUINEA 6806
In order to have a global examination of current and salinity pattern in the 150–250 m layer in the studyregion and their seasonal variability, we show in Figure 12 maps of monthly salinity averaged between150 m to 250 m depth superimposed with vector velocity, as simulated by the climatological model.
The modeled velocity distribution and salinity field in 150–250 m depth layer over the climatologic yearshow well-known patterns of this region. We notice a westward recirculation of salinity maximum watersalong �38N which corresponds to the lower part of nSEC flow (around 35.4–35.5 psu), fed by a northernEUC recirculation in the far east of the Gulf of Guinea [Kolodziejczyk et al., 2014]. Another maximum salinityzone is also present in the northwestern region, associated with an anticyclonic circulation related to adownward displacement of isotherms. The two high-salinity tongues join in spring (Figure 12, March map)accompanied by a southward inflow in the eastern basin along the continental slope of West African coastand the northern coast of Gulf of Guinea. This eastward subsurface flow along the coast is in agreementwith previous results, i.e., highest transport in boreal spring and a weakening during fall and winter (notshown). In summer (not shown) this current effectively reverses westward, associated with fresher water (<35.35 psu), and reinforces the northward flow along the Northwest Africa coast. Otherwise, the March mapdepicts an anticyclonic circulation off Cape Palmas suggesting strong recirculation in this region that canexplain, at least partially, the stronger eastward velocities noticed at 78W.
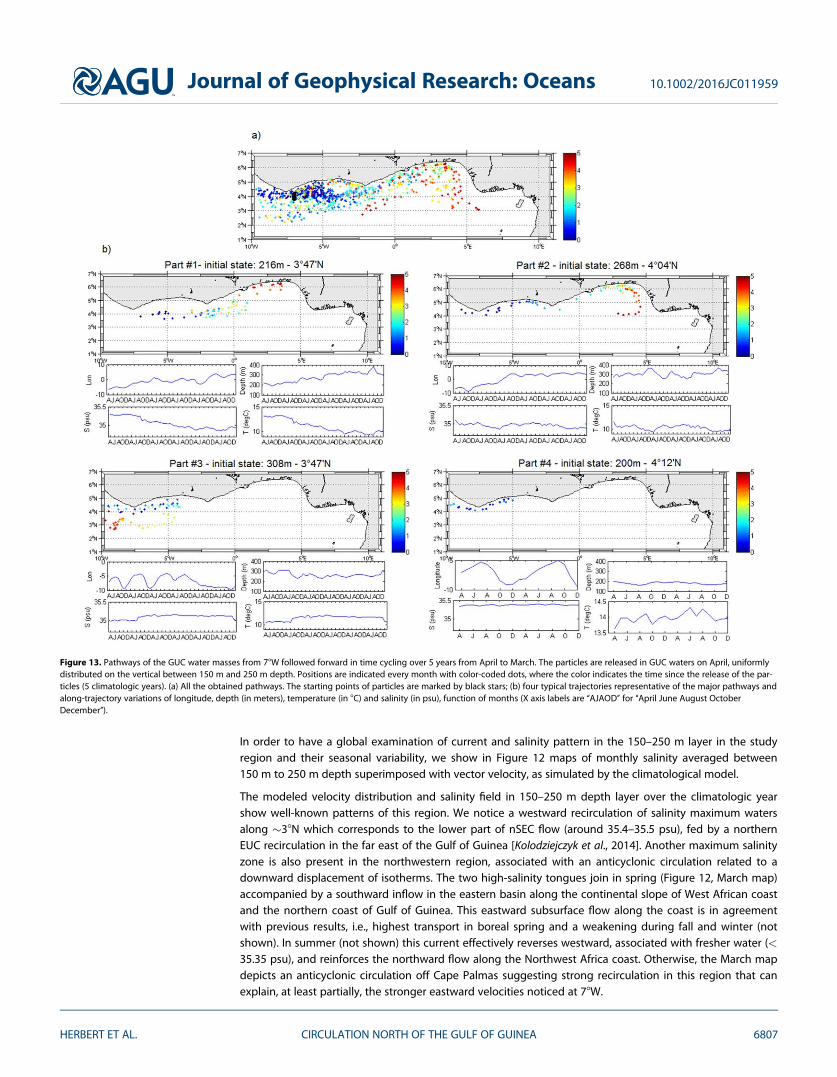
Figure 13. Pathways of the GUC water masses from 78W followed forward in time cycling over 5 years from April to March. The particles are released in GUC waters on April, uniformlydistributed on the vertical between 150 m and 250 m depth. Positions are indicated every month with color-coded dots, where the color indicates the time since the release of the par-ticles (5 climatologic years). (a) All the obtained pathways. The starting points of particles are marked by black stars; (b) four typical trajectories representative of the major pathways andalong-trajectory variations of longitude, depth (in meters), temperature (in 8C) and salinity (in psu), function of months (X axis labels are ‘‘AJAOD’’ for ‘‘April June August OctoberDecember’’).
Journal of Geophysical Research: Oceans 10.1002/2016JC011959
HERBERT ET AL. CIRCULATION NORTH OF THE GULF OF GUINEA 6807
4.3. GUC Pathway and SourcesThe analysis of in situ measurements obtained from the cruises carried out north of Gulf of Guinea since1983 highlighted the presence of an eastward current, the GUC, located from 50/150 m to 200/300 m withmean velocities of 10 cm.s21. The comparison with our climatological simulation results showed that thiscurrent is also present in our numerical simulation even though most often associated with slightly weakervelocities than from observations. This raises the question whether there is continuity between the east-ward GUC observed and simulated from Cape Palmas to Cape Three Points and the eastward currentobserved and simulated in the East of Cape Three Points, or whether this last one is attributable to a localrecirculation. To this end, Lagrangian trajectories have been computed from numerical outputs using theARIANE Lagrangian diagnostic tool.4.3.1. Pathway of the GUC Along the Northern Coast of Gulf of Guinea During SpringIn order to map the main Lagrangian pathways of the GUC and to assess the connection between the east-ward subsurface flows observed and simulated north of 38300N west and east of Cape Three Points, ARIANEwas used in qualitative mode: 27 particles are launched between 150 m to 250 m depth, uniformly distribut-ed in the patch of water flowing eastward between 38470N and the coast on April at 78W (Figure 13). The ini-tial positions of numerical particles have been chosen according to the analysis of SADCP measurementsand from numerical results, which attested the presence of an eastward subsurface current in this patch ofwater (see section III-1 and IV-1 and especially Figure 8). We chose to compute the trajectories cycling over5 years from April to March. Figure 13a shows all Lagrangian pathways.
The starting points of particles are marked by black stars. The trajectories highlight strong recirculationregions as well as the major pathway of the particles. They also clearly display a connection between waterslocated west and east of Cape Three Points. In particular, four main pathways scenarios are identified andpresented in Figure 13b through the trajectories of four particles associated with the along-trajectory varia-tions of their longitude, depth, temperature and salinity. The first particle illustrates the pathway of the GUCfrom West to East of the Gulf of Guinea. It travels eastward along the latitude 48N from Cape Palmas toCape Three Points and follows the coast until 38300E after around 4 years while gradually deepening from216 m to 400 m. Its eastward displacement is not direct from west to east but interrupted by current rever-sal during August–December period especially off Cape Palmas and off Cape Three Points. The second parti-cle, initially placed closer to the coast, at 48040N, and at 268 m has a similar pathway except that it followsan eastward flow trapped to the coast before reaching (more directly) the eastern part of the Gulf where itveers back (within the westward flow identified as the nSEC). The presence of this eastward coastal flowbetween the Cape Palmas and the Cape Three Points is consistent with the one identified on Figure 10 and11 and suggested from SADCP measurements (Figures 5 and 8b; Table 1).
The two other particles indicate strong recirculation off Cape Palmas. The third particle, initially placed at308 m and 38470N, suggests that a portion of the GUC is fed by anticyclonic recirculation off Cape Palmas,including lower part of the nSEC waters. Finally the trajectory of the fourth particle, initially placed closer tothe coast, evidences the strong variability of currents flowing alternately eastward (from December to July)
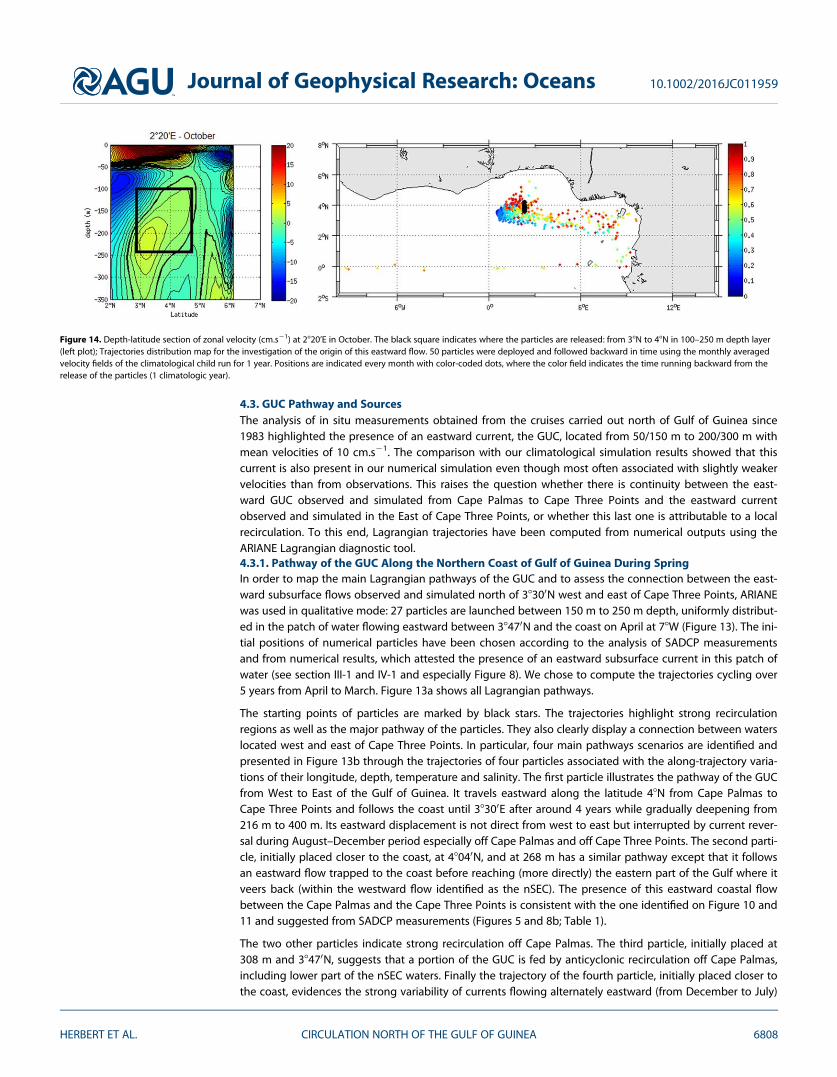
Figure 14. Depth-latitude section of zonal velocity (cm.s21) at 2820’E in October. The black square indicates where the particles are released: from 38N to 48N in 100–250 m depth layer(left plot); Trajectories distribution map for the investigation of the origin of this eastward flow. 50 particles were deployed and followed backward in time using the monthly averagedvelocity fields of the climatological child run for 1 year. Positions are indicated every month with color-coded dots, where the color field indicates the time running backward from therelease of the particles (1 climatologic year).
Journal of Geophysical Research: Oceans 10.1002/2016JC011959
HERBERT ET AL. CIRCULATION NORTH OF THE GULF OF GUINEA 6808
and westward (from August to November) along the African coast, as observed on Figure 10 (suggesting alink with more western waters). The temperature and salinity associated with GUC waters are rangedrespectively between 10 and 148C and between 35 and 35.4 psu.
These results are in agreement with the analysis of SADCP measurements and provide a better understand-ing of the GUC dynamic. They also attest a direct connection between the 150–250 m depth eastward
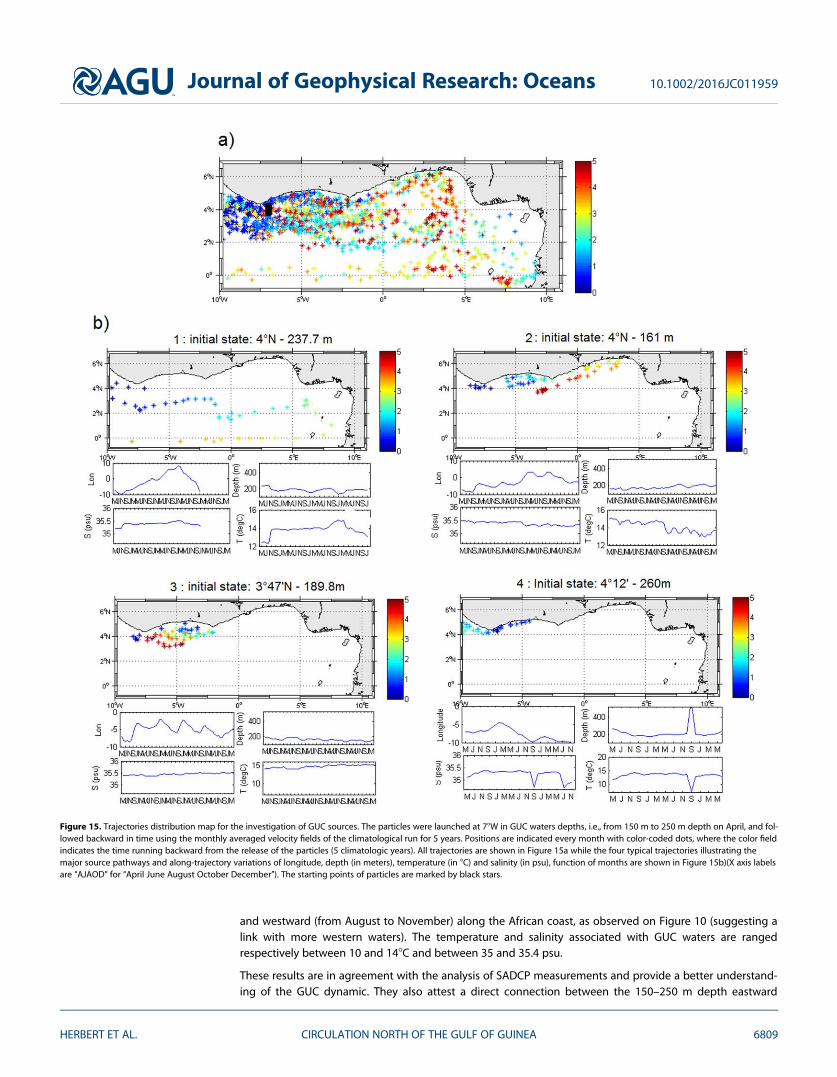
Figure 15. Trajectories distribution map for the investigation of GUC sources. The particles were launched at 78W in GUC waters depths, i.e., from 150 m to 250 m depth on April, and fol-lowed backward in time using the monthly averaged velocity fields of the climatological run for 5 years. Positions are indicated every month with color-coded dots, where the color fieldindicates the time running backward from the release of the particles (5 climatologic years). All trajectories are shown in Figure 15a while the four typical trajectories illustrating themajor source pathways and along-trajectory variations of longitude, depth (in meters), temperature (in 8C) and salinity (in psu), function of months are shown in Figure 15b)(X axis labelsare ‘‘AJAOD’’ for ‘‘April June August October December’’). The starting points of particles are marked by black stars.
Journal of Geophysical Research: Oceans 10.1002/2016JC011959
HERBERT ET AL. CIRCULATION NORTH OF THE GULF OF GUINEA 6809
currents observed in the west, off Cape Palmas, and in the east, off Cape Three Points. In particular, theresults suggest that the GUC flows along the coast east of Cape Three Points. That raises the question aboutthe origin of the eastward flow simulated in 150–250 m depth layer around 3–48N at 28200E during Octo-ber–December months (Figure 10). To address this question, a backward-in-time experiment has also beenperformed. The goal is to get information about the source regions of water parcels found within a prede-fined release zone. In the present case, 50 particles are deployed in the eastward flow located in the 100–250 m depth layer at 28200E between 38N and 48N on 1 October and followed them backward in time withmaximum transit time of 1 year.
The so-obtained trajectories (Figure 14) clearly indicate that the eastward current observed around 48N at28200E is not an eastward continuation of the GUC observed at 78W and 48W, but a regional recirculation ofEUC waters limited to the eastern part of the Gulf of Guinea. Similar results have obtained whit a releasedate in January and August (not shown).4.3.2. Origin of GUC Waters at 78WIn order to investigate the GUC sources at 78W, we performed another backward-in-time simulation. Wereleased simultaneously 27 particles from 150 m to 250 m depth within the GUC at 78W (see Figure 8) onApril and followed them backward in time with maximum transit time of 5 years. The results of the experi-ment as well as four typical trajectories are presented in Figure 15.
Figure 15a reveals a highest concentration of particles in the area of the release zone suggesting this regionto be the place of strong recirculation. We can distinguish four main groups of pathways illustrated respec-tively by the pathways of the 4 particles shown in Figure 15b. The first group (particle 1; top-left plot) indi-cates that the GUC is partly fed by EUC waters, as revealed by the trajectory of this particle whichrecirculates from the EUC through the nSEC and reaches the GUC at 78W with a transit time of around 3
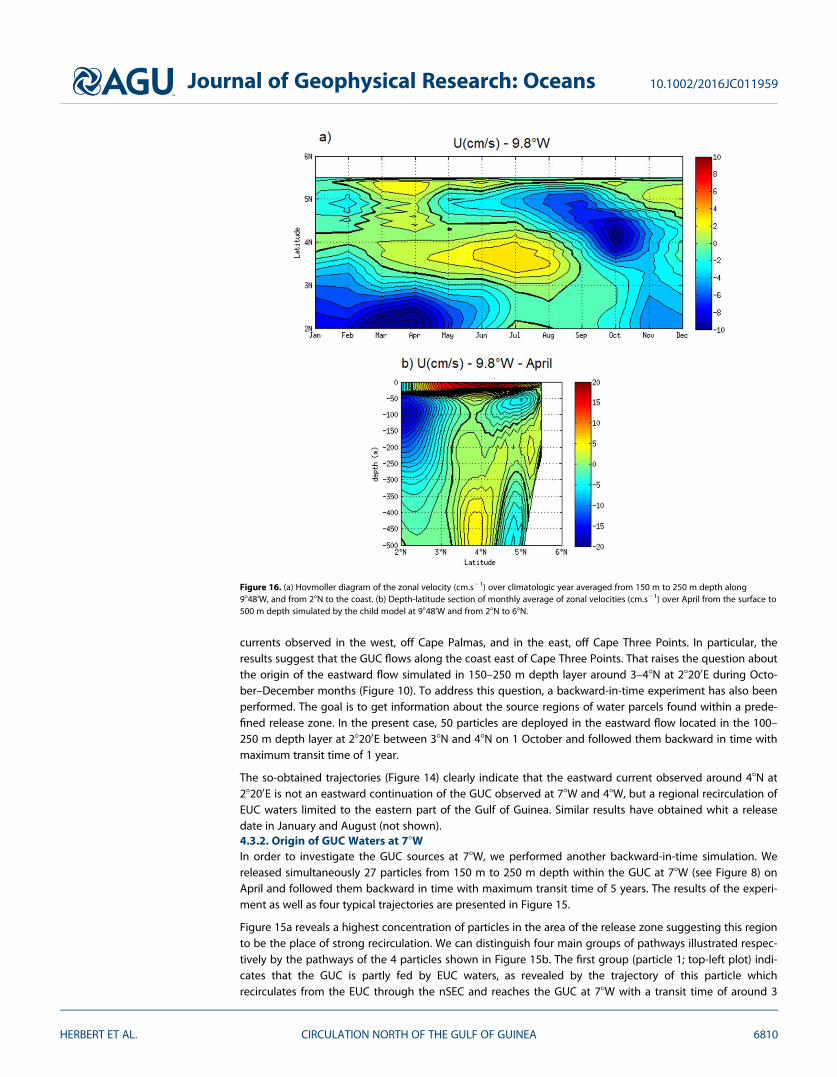
Figure 16. (a) Hovmoller diagram of the zonal velocity (cm.s21) over climatologic year averaged from 150 m to 250 m depth along9848’W, and from 28N to the coast. (b) Depth-latitude section of monthly average of zonal velocities (cm.s21) over April from the surface to500 m depth simulated by the child model at 9848’W and from 28N to 68N.
Journal of Geophysical Research: Oceans 10.1002/2016JC011959
HERBERT ET AL. CIRCULATION NORTH OF THE GULF OF GUINEA 6810
years. The mixing between the salty and warm EUC waters with lower nSEC waters is clearly identified by achange in physical properties of the particle during the second year September month: the temperatureand salinity along-path effectively drop by 0.1 psu and 18C respectively. Otherwise, the group 2 (particle 2;top-right plot) reveals a recirculation cell along the coast, characterized by a horizontal zigzag path fromwest to east due to the eastward to westward reversal of the subsurface current during August–Septembermonths (Figure 10). As a result, the travel time of the particles that transit from 78W to the eastern part ofthe Gulf of Guinea is generally longer than 3 years. Another anticyclonic recirculation pattern is observedoff Cape Palmas and concerns the particles of the third group (particle 3; bottom-left plot), initially releasedat depths superior or equal to 200m. Finally, the fourth group (particle 4; bottom-right plot) pathways showthat particles also originate from the west (northwest, north of 48N), out of the domain. Thus, the Lagrang-ian experiment reveals that the GUC is fed through three main source pathways: (1) strong recirculationsdue to the seasonal variability of the current; (2) recirculation of EUC and lower nSEC waters; and (3) inflowcoming from outside of the domain northwest of 48N-78W.
To better investigate the source of the inflow coming from west, we checked the zonal velocity yearly varia-tions at the western boundary of the child model (98480W), averaged between 150 and 250 m depth, shownin Figure 16 (bottom). This figure can be analyzed in tandem with the Hovmoller diagrams at 78W, 48W, and28200E presented in Figure 10. It shows that the seasonal variability of the eastward flow entering the Gulfof Guinea at 98480W north of 38300N is well correlated with the GUC’s one: it also exhibits a velocity maxi-mum in April, and the flow becomes westward in September–November. Furthermore, as previouslynoticed at 78W and 48W, we can identify two eastward flows: one coastally trapped around 58N, and anotherone around 48N. These two flows are clearly visible on depth-latitude section of zonal velocities averageover April month shown on Figure 16 (bottom).
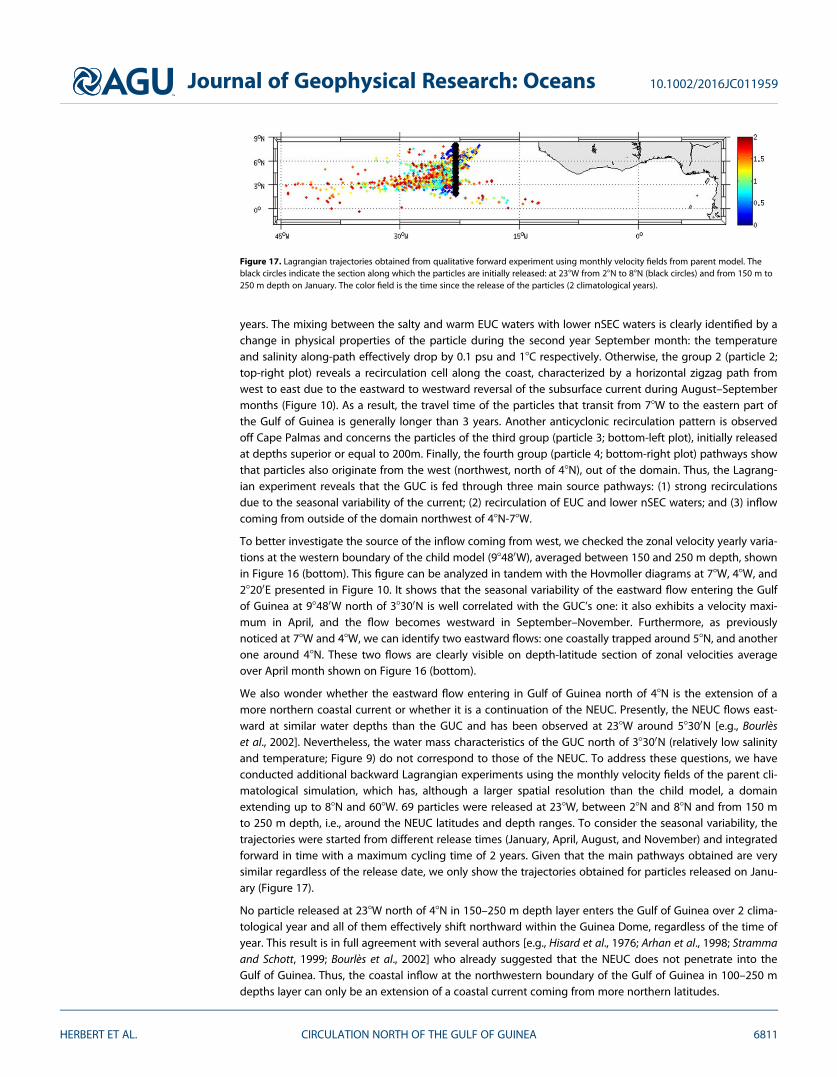
We also wonder whether the eastward flow entering in Gulf of Guinea north of 48N is the extension of amore northern coastal current or whether it is a continuation of the NEUC. Presently, the NEUC flows east-ward at similar water depths than the GUC and has been observed at 238W around 58300N [e.g., Bourleset al., 2002]. Nevertheless, the water mass characteristics of the GUC north of 38300N (relatively low salinityand temperature; Figure 9) do not correspond to those of the NEUC. To address these questions, we haveconducted additional backward Lagrangian experiments using the monthly velocity fields of the parent cli-matological simulation, which has, although a larger spatial resolution than the child model, a domainextending up to 88N and 608W. 69 particles were released at 238W, between 28N and 88N and from 150 mto 250 m depth, i.e., around the NEUC latitudes and depth ranges. To consider the seasonal variability, thetrajectories were started from different release times (January, April, August, and November) and integratedforward in time with a maximum cycling time of 2 years. Given that the main pathways obtained are verysimilar regardless of the release date, we only show the trajectories obtained for particles released on Janu-ary (Figure 17).
No particle released at 238W north of 48N in 150–250 m depth layer enters the Gulf of Guinea over 2 clima-tological year and all of them effectively shift northward within the Guinea Dome, regardless of the time ofyear. This result is in full agreement with several authors [e.g., Hisard et al., 1976; Arhan et al., 1998; Strammaand Schott, 1999; Bourles et al., 2002] who already suggested that the NEUC does not penetrate into theGulf of Guinea. Thus, the coastal inflow at the northwestern boundary of the Gulf of Guinea in 100–250 mdepths layer can only be an extension of a coastal current coming from more northern latitudes.
Figure 17. Lagrangian trajectories obtained from qualitative forward experiment using monthly velocity fields from parent model. Theblack circles indicate the section along which the particles are initially released: at 238W from 28N to 88N (black circles) and from 150 m to250 m depth on January. The color field is the time since the release of the particles (2 climatological years).
Journal of Geophysical Research: Oceans 10.1002/2016JC011959
HERBERT ET AL. CIRCULATION NORTH OF THE GULF OF GUINEA 6811
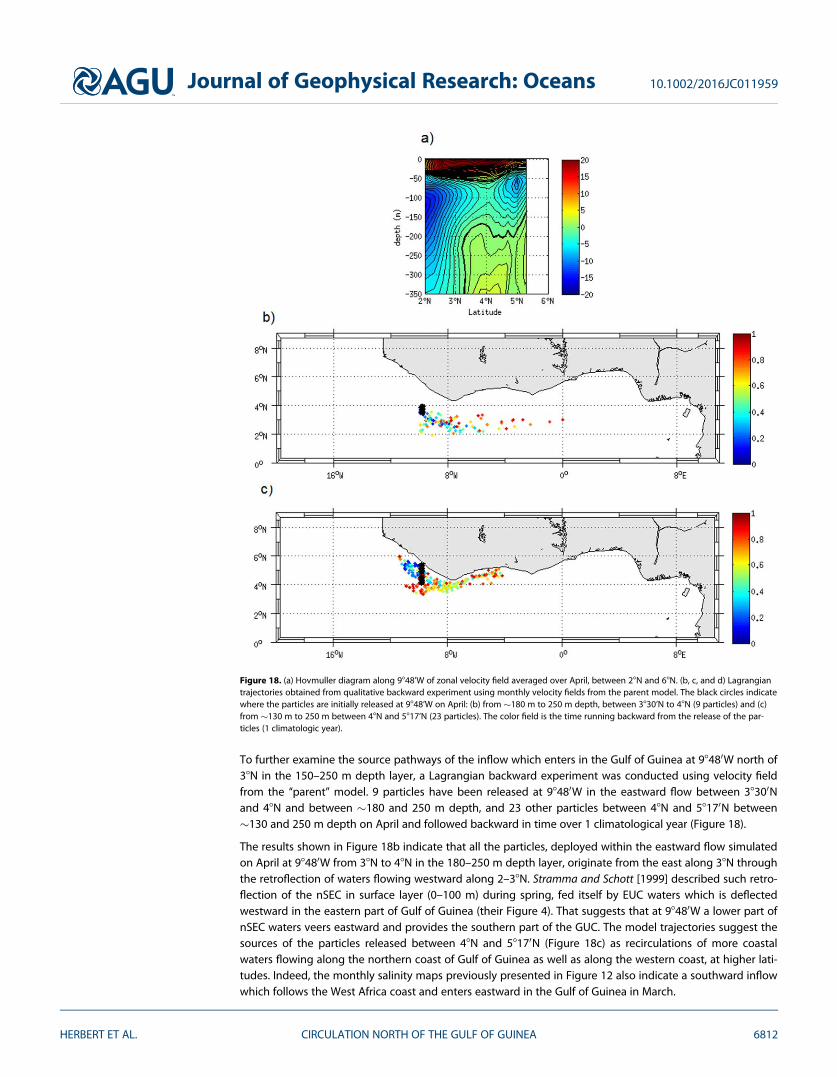
To further examine the source pathways of the inflow which enters in the Gulf of Guinea at 98480W north of38N in the 150–250 m depth layer, a Lagrangian backward experiment was conducted using velocity fieldfrom the ‘‘parent’’ model. 9 particles have been released at 98480W in the eastward flow between 38300Nand 48N and between �180 and 250 m depth, and 23 other particles between 48N and 58170N between�130 and 250 m depth on April and followed backward in time over 1 climatological year (Figure 18).
The results shown in Figure 18b indicate that all the particles, deployed within the eastward flow simulatedon April at 98480W from 38N to 48N in the 180–250 m depth layer, originate from the east along 38N throughthe retroflection of waters flowing westward along 2–38N. Stramma and Schott [1999] described such retro-flection of the nSEC in surface layer (0–100 m) during spring, fed itself by EUC waters which is deflectedwestward in the eastern part of Gulf of Guinea (their Figure 4). That suggests that at 98480W a lower part ofnSEC waters veers eastward and provides the southern part of the GUC. The model trajectories suggest thesources of the particles released between 48N and 58170N (Figure 18c) as recirculations of more coastalwaters flowing along the northern coast of Gulf of Guinea as well as along the western coast, at higher lati-tudes. Indeed, the monthly salinity maps previously presented in Figure 12 also indicate a southward inflowwhich follows the West Africa coast and enters eastward in the Gulf of Guinea in March.
Figure 18. (a) Hovmuller diagram along 9848’W of zonal velocity field averaged over April, between 28N and 68N. (b, c, and d) Lagrangiantrajectories obtained from qualitative backward experiment using monthly velocity fields from the parent model. The black circles indicatewhere the particles are initially released at 9848’W on April: (b) from �180 m to 250 m depth, between 3830’N to 48N (9 particles) and (c)from �130 m to 250 m between 48N and 5817’N (23 particles). The color field is the time running backward from the release of the par-ticles (1 climatologic year).
Journal of Geophysical Research: Oceans 10.1002/2016JC011959
HERBERT ET AL. CIRCULATION NORTH OF THE GULF OF GUINEA 6812
5. Discussion/Conclusion
The analysis of SADCP measurements obtained from several cruises carried out since 1995 in the Gulf ofGuinea evidences the presence of an eastward flow in the 35.2–35.5 salinity layer north of 3.58N from 100 mto 250 m depth with a mean velocity of 10 cm.s21. At some locations, the current is often associated with asalinity maximum, suggesting that it might be partly fed by EUC recirculating waters. Since the measure-ments obtained from the cruises are sparsely distributed along the year, a high resolution model, whichreproduces the general circulation, helped us to better describe the complex circulation in this particulararea. The model results showed that the eastward subsurface current reaches maximum velocities inMarch–April and reverses westward in August–September. The seasonal variability of the current is similarat the West and East of the study region, with higher eastward velocities at 78W and 28200E due to localrecirculations which reinforce the current at these locations, bringing relatively salty waters. Lagrangiantracking results confirmed the presence of strong anticyclonic recirculation patterns mainly in two particularareas: off Cape Palmas and east of Cape Three Points including recirculations of nSEC with relatively warmand salty waters. We also identified two distinct eastward flows at 150–250 m depth. The first one flowseastward below the GC around 48N from Cape Palmas to Cape Three Points and follows the route close tothe coast east of Cape Three Points. The second one is trapped against the coast between Cape Palmas toCape Three Points. We have decided to call the eastward current below the GC the Guinea UnderCurrent(GUC), while the coastal eastward current is called the North Guinea Coastal UnderCurrent (NGCUC).
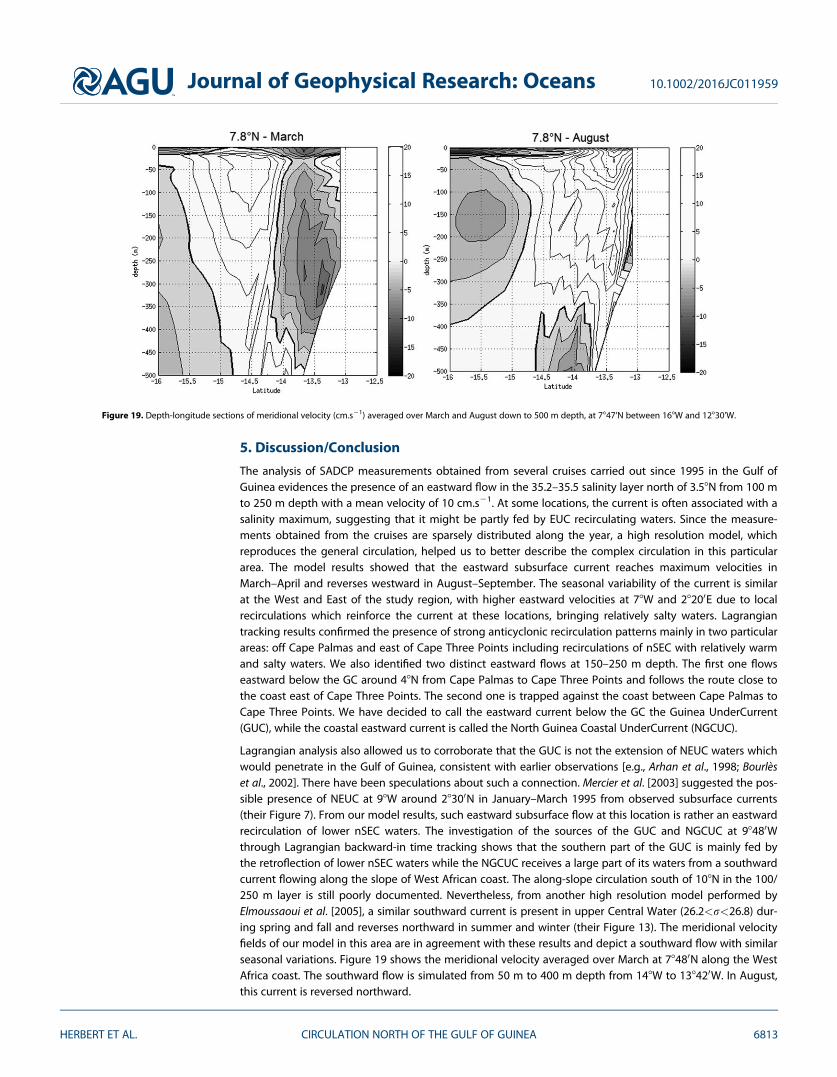
Lagrangian analysis also allowed us to corroborate that the GUC is not the extension of NEUC waters whichwould penetrate in the Gulf of Guinea, consistent with earlier observations [e.g., Arhan et al., 1998; Bourleset al., 2002]. There have been speculations about such a connection. Mercier et al. [2003] suggested the pos-sible presence of NEUC at 98W around 28300N in January–March 1995 from observed subsurface currents(their Figure 7). From our model results, such eastward subsurface flow at this location is rather an eastwardrecirculation of lower nSEC waters. The investigation of the sources of the GUC and NGCUC at 98480Wthrough Lagrangian backward-in time tracking shows that the southern part of the GUC is mainly fed bythe retroflection of lower nSEC waters while the NGCUC receives a large part of its waters from a southwardcurrent flowing along the slope of West African coast. The along-slope circulation south of 108N in the 100/250 m layer is still poorly documented. Nevertheless, from another high resolution model performed byElmoussaoui et al. [2005], a similar southward current is present in upper Central Water (26.2<r<26.8) dur-ing spring and fall and reverses northward in summer and winter (their Figure 13). The meridional velocityfields of our model in this area are in agreement with these results and depict a southward flow with similarseasonal variations. Figure 19 shows the meridional velocity averaged over March at 78480N along the WestAfrica coast. The southward flow is simulated from 50 m to 400 m depth from 148W to 138420W. In August,this current is reversed northward.
Figure 19. Depth-longitude sections of meridional velocity (cm.s21) averaged over March and August down to 500 m depth, at 7847’N between 168W and 12830’W.
Journal of Geophysical Research: Oceans 10.1002/2016JC011959
HERBERT ET AL. CIRCULATION NORTH OF THE GULF OF GUINEA 6813

Apart from the GUC, the analysis of SADCP measurements and model results reveal the presence of the GC in0–50 m depth layer as well as the westward 50/100 m depth flow under the GC as described by Lemassonand Rebert [1973b], without any clear link with the GUC variability. Nevertheless, although the concernedwater layer differs, the spring pattern of the GUC fate and its source pathways can recall the source of the GCdescribed by Stramma and Schott [1999] (their Figure 4): waters from the west (the NECC) and from the north-west (the Canary Current: CC) penetrate into the Gulf of Guinea along 48N. The preferred pathway of the GUCalong 48N from Cape Palmas to Cape Three Points effectively follows the GC pathway, at deeper depth. How-ever, the seasonal variability of the GC velocity (minimum in winter and maximum in summer), affected bythe seasonal variability of both the NECC and CC, is different than the seasonal variability of the GUC.
On the other hand, it would be interesting to further investigate the role of the GUC on the mixing of thewater masses and the impact of tropical and coastal waves.
ReferencesArhan, M., H. Mercier, Y. Gouriou, and B. Bourles (1998), Hydrographic sections across the Atlantic Ocean at 78300N and 4830’S, Deep Sea
Res., Part I, 45, 829–872.Arnault, S. (1987), Tropical Atlantic geostrophic currents and ship drifts, J. Geophys. Res., 92(C5), 5076–5088.Bakun, A. (1978), Guinea current upwelling, Nature, 271, 147–150.Blanke, B., and S. Raynaud (1997), Kinematics of the Pacific equatorial undercurrent: An Eulerian and Lagrangian approach from GCM
results, J. Phys. Oceanogr., 27(6), 1038–1053.Blanke, B., M. Arhan, G. Madec, and S. Roche (1999), Warm water paths in the equatorial Atlanticas diagnosed with a general circulation
model, J. Phys. Oceanogr., 29, 2753–2768.Bourles, B., D’Orgeville, M., G. Eldin, Y. Gouriou, R. Chuchla, Y. DuPenhoat, and S. Arnault (2002), On the evolution of the thermocline and
subthermocline eastward currents in the equatorial Atlantic, Geophys. Res. Lett., 29(16), 1785, doi:10.1029/2002GL015098.Bourles, B., P. Brandt, G. Caniaux, M. Dengler, Y. Gouriou, E. Key, R. Lumpkin, F. Marin, R. L. Molinari, and C. Schmid (2007), African Monsoon
Multidisciplinary Analysis (AMMA): Special measurements in the Tropical Atlantic, CLIVAR Exch. Lett., 41, 12–2.Bourles, B., et al. (2008), PIRATA program: History, accomplishments and future directions, Bull. Am. Meteorol. Soc., 89(8), 1111–1125, doi:
10.1175/2008BAMS2462.1.Brandt, P., G. Caniaux, B. Bourles, A. Lazar, M. Dengler, A. Funk, V. Hormann, H. Giordani, and F. Marin (2011), Equatorial upper-ocean
dynamics and their interaction with the West African monsoon, Atmos. Sci. Lett., 12(1), 24–30, doi:10.1002/asl.287.Caniaux G., H. Giordani, J.-L. Redelsperger, F. Guichard, E. Key, and M. Wade (2011), Coupling between the Atlantic cold tongue and the
West African monsoon in boreal spring and summer, J. Geophys. Res., 116, C04003, doi:10.1029/2010JC006570.Chelton, D. B., R. A. deSzoeke, M. G. Schlax, K. E. Naggar, and N. Siwertz (1998), Geographical variability of the first-baroclinic Rossby radius
of deformation, J. Phys. Oceanogr., 28, 433–460.Colin, C. (1988), upwelling events in front of the Ivory Coast during the FOCAL program, Oceanol. Acta, 1(1), 125–138.Dai, A., and K. E. Trenberth (2002), Estimates of freshwater discharge from continents: Latitudinal and seasonal variations, J. Hydrometeorol.,
3, 660–687.Da Silva, A.M., C. C. Young, and S. Levitus (1994), Atlas of surface marine data 1994, Algorithms and Procedures, Vol. 1, NOAA (National Oce-
anic & Atmospheric Administration) Atlas NESDIS (National Environmental Satellite, Data, and Information Service), 6, 83pp.Debreu, L., P. Marchesiello, P. Penven, and G. Cambon (2012), Two-way nesting in split-explicit ocean models: Algorithms, implementation
and validation, Ocean Modell., 49-50, 1–21.Djakour�e, S., P. Penven, B. Bourles, J. Veitch, and V. Kon�e (2014), Coastally trapped eddies in the north of the Gulf of Guinea, J. Geophys.
Res. Oceans, 119, 6805–6819, doi:10.1002/2014JC010243.Djakour�e, S., P. Penven, B. Bourles, and V. Kon�e (2016) Inertial terms effects on the ocean dynamics in the Gulf of Guinea, in revision for
Geophysical Research-Oceans.Donguy, J. R., and M. Priv�e (1964), Les conditions de l’Atlantique entre Abidjan et l’�equateur. Deuxieme partie. Variations hydrologiques
annuelles, Cah. ORSTOM, S�er. Oceanogr., XVI, 3, 193–204.Elmoussaoui, A., M. Arhan, and A.-M. Treguier (2005), Model-inferred upper ocean circulation in the eastern tropics of the North Atlantic,
Deep Sea Res., Part I, 52(7), 1093–1120, doi:10.1016/j.dsr.2005.01.010.Gouriou, Y. and G. Reverdin (1992), Isopycnal and diapycnal circulation of the upper equatorial Atlantic Ocean in 1983-1984, J. Geophys.
Res., 97(C3), 3543–3572.Haidvogel, D., and A. Beckmann (1999), Numerical Ocean Circulation Modeling, Ser. Environ. Sci. Manage., vol. 2, 318 pp., Imperial College
Press, London.Hazeleger, W., and P. de Vries (2003), Fate of the Equatorial Undercurrent in the Atlantic, in Interhemispheric Water Exchange in the Atlantic
Ocean, edited by G. J. Goni and P. Malamotte-Rizzoli, pp. 175–191, Elsevier Oceanographic Series.Herbert, G., C. Kermabon, J. Grelet, and B. Bourles (2015), French PIRATA cruises S-ADCP data processing, Mercator Ocean Q. Newsl., 2015-
05(52), 22–26.Hisard, P., and C. H�enin (1987), Response of the equatorial Atlantic Ocean to the 1983-1984 wind from the Programme Francais Oc�ean et
Climat dans l’Atlantique �equatorial cruise dataset, J. Geophys. Res., 92(C4), 3759–3768.Hisard, P., and J. Merle (1979), Onset of surface summer cooling in the Gulf of Guinea during GATE, Deep Sea Res., Part A, 26(GATE suppl. II),
325-342.Hisard, P., J. Citeau, and A. Morliere (1976), Le systeme des contre-courants �equatoriaux subsuperf�ıciels, permanence et extension de la
branche sud dans l’Oc�ean Atlantique. Cahiers Off. Rech. Sci. Tech. Outre-Mer, S�er. Oc�eanogr., 14, 209–220.Kolodziejczyk, N., B. Bourles, F. Marin, J. Grelet, and R. Chuchla (2009), Seasonal variability of the Equatorial Undercurrent at 108W as
inferred from recent in situ observations, J. Geophys. Res., 114, C06014, doi:10.1029/2008JC004976.Kolodziejczyk, N., F. Marin, B. Bourles, Y. Gouriou, and H. Berger (2014), Seasonal variability of the equatorial undercurrent termination and
associated salinity maximum in the Gulf of Guinea, Clim. Dyn., 43(11), 3025–3046, doi:10.1007/s00382-014-2107-7.
AcknowledgmentsThe research leading to these resultsreceived funding from the EU FP7/2007-2013 under grant agreement603521, PREFACE. We want toacknowledge all those whocontributed to the PIRATA networkmaintenance and data processing andto the vessels ’officers and crews. Wedo thank Bruno Blanke and NicolasGrima for their help on ARIANELagrangian tool, as well as GildasCambon for his help and participationon the implementation of ROMSsimulations. We also acknowledgeCyrille Akuetevi and Fr�ed�eric Bonou,who initiated part of the descriptiveworks presented in this paper duringtheir Master 2 training periods at theInternational Chair UNESCO ofMathematical Physics and Applications(ICMPA) of University Abomey-Calaviin Cotonou (Benin). The set of PIRATAcruises used in this study are availablethrough: http://campagnes.flotteoceanographique.fr/series/14/under collection name ‘‘PIRATA’’(DOI:http://dx.doi.org/10.18142/14).The PIRATA processed SADCP datafrom 2007 to 2016 are availablethrough: http://seanoe.org/data/00335/44635/under collection name‘‘French PIRATA cruises: S-ADCP data’’(DOI: http://dx.doi.org/10.17882/44635).
Journal of Geophysical Research: Oceans 10.1002/2016JC011959
HERBERT ET AL. CIRCULATION NORTH OF THE GULF OF GUINEA 6814
Leduc-Leballeur, M., G. de Coetlogon, and L. Eymard (2013), Air – sea interaction in the Gulf of Guinea at intraseasonal time-scales: Windbursts and coastal precipitation in boreal spring, Q. J. R. Meteorol. Soc., 139, 387–400, doi:10.1002/qj.1981.
Lemasson, L., and J.-P. Rebert (1968), Observations de courants sur le plateau continental ivoirien: Mise en �evidence d’un sous-courant,Doc. Sci. Prov. Cent. Rech. Oc�eanogr. Abidjan, 22, 66.
Lemasson, L., and J.-P. Rebert (1973a), Circulation dans la partie orientale de l’Atlantique Sud, Doc. Sci. Cent. Rech. Oc�eanogr. Abidjan, IV(1),91–124.
Lemasson, L., and J.-P. Rebert (1973b), Les courants marins dans le Golfe Ivoirien, Cah. ORS TOM, S�er. Oc�eanogr., 11(1), 67–95.Lumpkin, R. and S. L. Garzoli (2005), Near-surface circulation in the tropical Atlantic Ocean, Deep-Sea Res., Part I, 52(3), 495–518, doi:
10.1016/j.dsr.2004.09.001.Marchal, E., and J. Picaut (1977), R�epartition et abondance �evalu�ees par �echo-int�egration des poissons du plateau ivoiro-ghan�een en rela-
tion avec les upwellings locaux, J. Rech. Oc�eanogr., II(4), 39–57.Marin, F., G. Caniaux, B. Bourles, H. Giordani, Y. Gouriou, and E. Key (2009), Why were sea surface temperatures so different in the Eastern
Equatorial Atlantic in June 2005 and 2006, J. Phys. Oceanogr., 39, 1416–1431, doi:10.1175/2008JPO4030.1.Mercier, H., M. Arhan, and J.R.E. Lutjeharms (2003), Upper-layer circulation in the eastern Equatorial and South Atlantic Ocean in January-
March 1995, Deep Sea Res., Part I, 50(7), 863–887.Morliere, A. (1970), Les saisons marines devant Abidjan, Doc. Sci. Cent. Rech. Oc�eanogr., 1(2), 1–15.Penven, P., P. Marchesiello, L. Debreu, and J. Lefevre (2008), Software tools for pre- and post-processing of oceanic regional simulations,
Environ. Modell. Software, 23, 2008 660–662.Picaut, J. (1983), Propagation of the seasonal upwelling in the eastern equatorial Atlantic, J. Phys. Oceanogr., 13, 18–37.Piton, B., and S. Wacongne (1985), Unusual amounts of very saline subsurface water in the Eastern gulf of Guinea in May 1984, Trop. Ocean
Atmos. Newsl., 32, 5–8.Redelsperger, J. L., C. Thorncroft, A. Diedhiou, T. Lebel, D. Parker and J. Polcher (2006), African Monsoon Multidisciplinary Analysis: An inter-
national project and field campaign, Bull. Am. Meteorol. Soc., 87(12), 1739–1746, doi:10.1175/BAMS-87-12-1739.Roy, C. (1995), The Cote d’Ivoire and Ghana Coastal Upwellings: Dynamics and Changes, in acts of DUSRU (Dynamics and Use of Sardinella
Resources From Upwelling off Ghana and Ivory Coast) meeting, edited by F. X. Bard and K. A. Koranteng, pp: 346–361, ORSTOM (Officede la Recherche Scientifique et Technique Outre Mer), Paris.
Schott, F., J. McCreary, and G. Johnson (2004), Shallow overturning circulations of the tropical subtropical oceans, in Earth Climate: TheOcean-Atmosphere Interaction, AGU Geophys. Monogr. Ser., 147, edited by C. Wang, S.-P. Xie, and J. A. Carton, pp. 261–304, AGU, Wash-ington, D. C.
Servain, J., J. Picaut, and J. Merle (1982), Evidence of remote forcing in the equatorial Atlantic Ocean, J. Phys. Oceanogr., 12, 457–463.Shchepetkin, A. F., and J.-C. McWilliams (2005), The Regional Ocean Modeling System: A split-explicit, free-surface, topography following
coordinates ocean model, Ocean Modell., 9, 347–404.Stramma, L., and F. A. Schott (1999), The mean flow field of the tropical Atlantic Ocean, Deep Sea Res., Part II, 46 (29), 279 – 303.Tsuchiya, M. (1986), Thermostats and circulation in the upper layer of the Atlantic Ocean, Prog. Oceanogr., 16, 235–267.Verstraete, J.-M. (1992), The seasonal upwellings in the Gulf of Guinea, Prog. Oceanogr., 29, 1–60.
Journal of Geophysical Research: Oceans 10.1002/2016JC011959
HERBERT ET AL. CIRCULATION NORTH OF THE GULF OF GUINEA 6815