Embed Size (px)
Citation preview
NEW JUABEN MUNICIPAL

ii
Copyright © 2014 Ghana Statistical Service
iii
PREFACE AND ACKNOWLEDGEMENT
No meaningful developmental activity can be undertaken without taking into account the
characteristics of the population for whom the activity is targeted. The size of the population
and its spatial distribution, growth and change over time, in addition to its socio-economic
characteristics are all important in development planning.
A population census is the most important source of data on the size, composition, growth
and distribution of a country’s population at the national and sub-national levels. Data from
the 2010 Population and Housing Census (PHC) will serve as reference for equitable
distribution of national resources and government services, including the allocation of
government funds among various regions, districts and other sub-national populations to
education, health and other social services.
The Ghana Statistical Service (GSS) is delighted to provide data users, especially the
Metropolitan, Municipal and District Assemblies (MMDAs), with district-level analytical
reports based on the 2010 PHC data to facilitate their planning and decision-making.
The District Analytical Report for the New Juaben Municipality is one of the 216 district
census reports aimed at making data available to planners and decision makers at the district
level. In addition to presenting the profile of the Municipality, the report discusses the social
and economic dimensions of demographic variables and their implications for policy
formulation, planning and interventions. The conclusions and recommendations drawn from
the district report are expected to serve as a basis for improving the quality of life of
Ghanaians through evidence-based decision-making, monitoring and evaluation of
developmental goals and intervention programmes.
For ease of accessibility to the census data, the district report and other census reports
produced by the GSS will be disseminated widely in both print and electronic formats. The
report will also be posted on the GSS website: www.statsghana.gov.gh.
The GSS wishes to express its profound gratitude to the Government of Ghana for providing
the required resources for the conduct of the 2010 PHC. While appreciating the contribution
of our Development Partners (DPs) towards the successful implementation of the Census, we
wish to specifically acknowledge the Department for Foreign Affairs, Trade and
Development (DFATD) formerly the Canadian International Development Agency (CIDA)
and the Danish International Development Agency (DANIDA) for providing resources for
the preparation of all the 216 district reports. Our gratitude also goes to the Metropolitan,
Municipal and District Assemblies, the Ministry of Local Government, Consultant Guides,
Consultant Editors, Project Steering Committee members and their respective institutions for
their invaluable support during the report writing exercise. Finally, we wish to thank all the
report writers, including the GSS staff who contributed to the preparation of the reports, for
their dedication and diligence in ensuring the timely and successful completion of the district
census reports.
Dr. Philomena Nyarko
Government Statistician
iv
TABLE OF CONTENTS
PREFACE AND ACKNOWLEDGEMENT ............................................................................. iii
LIST OF TABLES ....................................................................................................................... vi
LIST OF FIGURES .................................................................................................................... vii
ACRONYMS AND ABBREVIATIONS .................................................................................. viii
EXECUTIVE SUMMARY ......................................................................................................... ix
CHAPTER ONE: INTRODUCTION ........................................................................................ 1
1.1 Background ...................................................................................................................... 1
1.2 Physical Features .............................................................................................................. 1
1.3 Political and Administrative Structure ............................................................................. 3
1.4 Culture and Social Structure ............................................................................................ 3
1.5 Economy........................................................................................................................... 3
1.6 Census Methodology, Concepts and Definitions ............................................................. 4
1.7 Organization of the Report ............................................................................................. 14
CHAPTER TWO: DEMOGRAPHIC CHARACTERISTICS .............................................. 16
2.1 Introduction .................................................................................................................... 16
2.2 Population Size and Distribution ................................................................................... 16
2.3 Age-Sex Structure .......................................................................................................... 16
2.4 Migration, Fertility and Mortality .................................................................................. 19
CHAPTER THREE: SOCIAL CHARACTERISTICS ......................................................... 23
3.1 Introduction .................................................................................................................... 23
3.2 Household Size, Composition and Structure.................................................................. 23
3.3 Marital Status ................................................................................................................. 25
3.4 Nationality ...................................................................................................................... 29
3.5 Religious Affiliation ....................................................................................................... 29
3.6 Literacy and Education................................................................................................... 29
CHAPTER FOUR: ECONOMIC CHARACTERISTICS .................................................... 33
4.1 Introduction .................................................................................................................... 33
4.2 Economic Activity Status ............................................................................................... 33
4.3 Occupation ..................................................................................................................... 34
4.4 Industry........................................................................................................................... 35
4.5 Employment Status ........................................................................................................ 36
4.6 Employment Sector ........................................................................................................ 37
CHAPTER FIVE: INFORMATION COMMUNICATION TECHNOLOGY ................... 38
5.1 Introduction ................................................................................................................... 38
5.2 Ownership of Mobile Phones and use of Internet .......................................................... 38
5.3 Household ownership of Desktop or Laptop computer ................................................. 40
CHAPTER SIX: DISABILITY ................................................................................................ 41
6.1 Introduction .................................................................................................................... 41
6.2 Population with Disability .............................................................................................. 41
6.3 Disability and Activity Status ........................................................................................ 42
6.4 Disability, Education and Literacy ................................................................................. 43
CHAPTER SEVEN: AGRICULTURAL ACTIVITIES ........................................................ 45
7.1 Introduction .................................................................................................................... 45
7.2 Households in Agriculture ............................................................................................. 45

v
7.3 Types of Livestock and other Animals reared ............................................................... 46
CHAPTER EIGHT: HOUSING CONDITIONS .................................................................... 48
8.1 Introduction .................................................................................................................... 48
8.2 Housing Stock ................................................................................................................ 48
8.3 Type of Dwelling, Holding and Tenancy ....................................................................... 48
8.4 Construction Materials ................................................................................................... 50
8.5 Room Occupancy ........................................................................................................... 51
8.6 Access to Utilities and Household facilities ................................................................... 52
8.7 Main Source of Water for Drinking and for other Domestic Use .................................. 54
8.8 Bathing and Toilet facilities ........................................................................................... 55
8.9 Methods of Waste disposal ............................................................................................ 57
CHAPTER NINE: SUMMARY, CONCLUSION AND RECOMENDATIONS ................ 59
9.1 Summary of findings ...................................................................................................... 59
9.2 Conclusion ...................................................................................................................... 61
9.3 Recommendations .......................................................................................................... 62
REFERENCES ............................................................................................................................ 64
APPENDICES ............................................................................................................................. 65
LIST OF CONTRIBUTORS ..................................................................................................... 69
vi
LIST OF TABLES
Table 2.1: Population by sex and locality of residence ............................................................... 16 Table 2.2: Population by age, sex and type of locality ............................................................... 17 Table 2.3: Age dependency ratio by sex ...................................................................................... 19 Table 2.4: Birthplace by duration of residence of migrants ......................................................... 20 Table 2.5: Female population 12 years and older by age, children ever born, children surviving and sex of child ............................................................................. 20 Table 2.6: Reported total fertility rate, general fertility rate and crude birth rate by district ...... 21 Table 2.7: Household deaths by age, sex and pregnancy related deaths .................................... 22 Table 3.1: Household size by type of locality .............................................................................. 23 Table 3.2: Household population by composition and sex .......................................................... 24 Table 3.3: Household population by structure and sex ................................................................ 25 Table 3.4: Persons 12 years and older by sex, age-group and marital status ............................... 26 Table 3.5: Persons 12 years and older by sex, marital status and level of education .................. 27 Table 3.6: Persons 12 years and older by sex, marital status and economic activity status ........ 28 Table 3.7: Population by nationality and sex ............................................................................... 29 Table 3.8: Population by religion and sex ................................................................................... 29 Table 3.9: Population 11 years and older by sex and literacy status .......................................... 30 Table 3.10:Population 3 years and older by level of education, school attendance and sex ........ 32 Table 4.1: Population 15 years and older by activity status and sex ........................................... 34 Table 4.2: Employed population 15 years and older by occupation and sex ............................... 35 Table 4.3: Employed population 15 years and older by industry and sex ................................... 36 Table 4.4: Employed Population 15 years and older by employment status and sex .................. 37 Table 4.5: Percentage distribution of employed persons aged 15 years and above by sex and employment sector, 2000 – 2010 ................................................... 37 Table 5.1: Population 12 years and older owning mobile phones and using internet by sex ...... 39 Table 6.1: Population by type of locality, disability type and sex ............................................... 42 Table 6.2: Persons 15 years and older with disability by economic activity status and sex ........ 43 Table 6.3: Population 3 years and older by sex, disability type and ............................................ 44 Table 7.1: Households by agricultural activities and locality ...................................................... 46 Table 7.2: Distribution of livestock, other animals and keepers................................................. 47 Table 8.1: Stock of houses and households by type of locality ................................................... 48 Table 8.2: Ownership status of dwelling by sex of household head and type of locality ............ 49 Table 8.3: Type of dwelling by sex of household head and type of locality ............................... 49 Table 8.4: Main construction material for outer wall .................................................................. 50 Table 8.5: Main construction materials for the floor of dwelling unit by type of locality .......... 51 Table 8.6: Main construction material for roofing....................................................................... 51 Table 8.7: Household size and number of sleeping rooms occupied in dwelling unit ................ 52 Table 8.8: Main source of lighting of dwelling unit by type of locality ...................................... 53 Table 8.9: Main source of cooking fuel, and cooking space used by households ....................... 53 Table 8.10:Main source of drinking water for households ........................................................... 54 Table 8.11:Main source of water for other domestic use of households ...................................... 55 Table 8.12:Type of toilet facility and bathing facility used by household by type of locality ........................................................................................................... 56 Table 8.13:Method of solid and liquid waste disposal by type of locality ................................... 58 Table A1: Distribution of households engaged in tree growing or crop farming ........................ 65 by type of crop ............................................................................................................ 65
vii
Table A2: Total population, sex, number of households and houses in the 20 largest communities ............................................................................................... 67 Table A3: Population by age group in the 20 largest communities ............................................. 68
LIST OF FIGURES
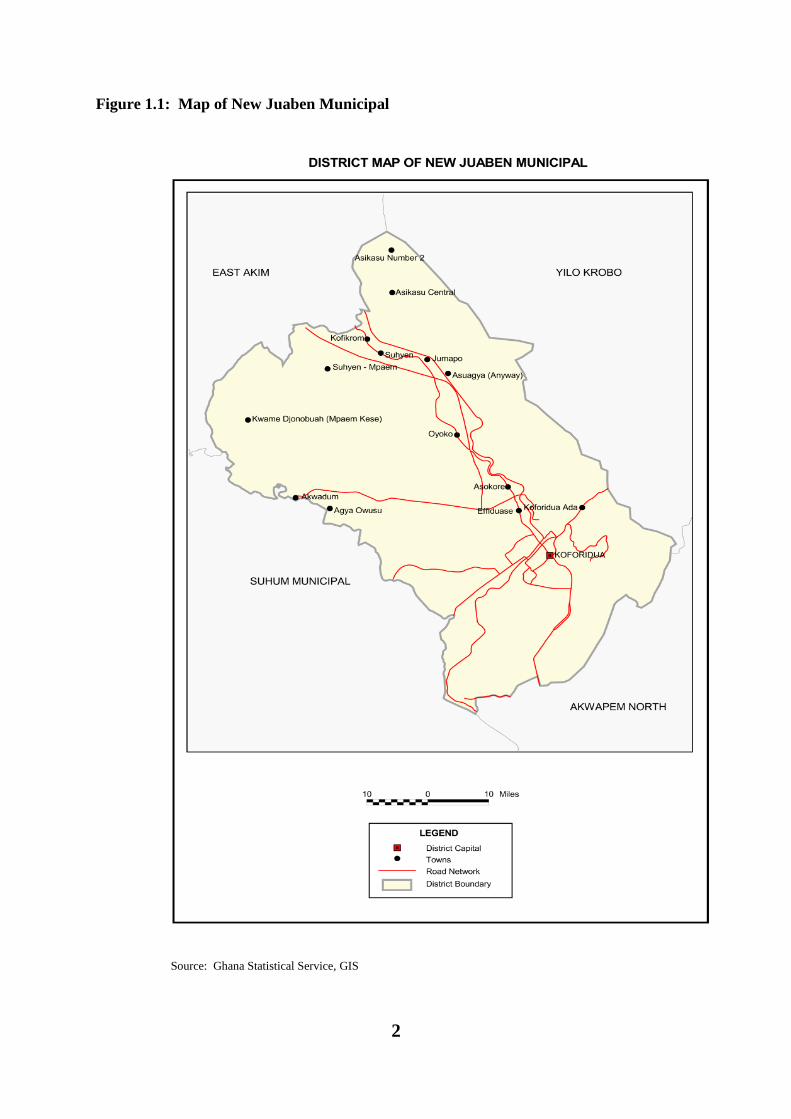
Figure 1.1: Map of New Juaben Municipal ................................................................................... 2
Figure 2.1: Population Pyramid of New Juaben Municipal ......................................................... 18
Figure 8.1: Distribution of bathing facility type in households ................................................... 57
viii
ACRONYMS AND ABBREVIATIONS
EFA Education for All
GDP Gross Domestic Product
JHS Junior High School
JSS Junior Secondary School
SHS Senior High School
SSS Senior Secondary School
ICT Information Communication Technology
ICT4AD Information Communication Technology for Accelerated Development
MDG Millennium Development Goal
MMDA Metropolitan Municipal and District Assembly
PHC Population and Housing census
PHC Primary Health care
PWD Persons with Disability
PWID Persons with Intellectual Disability
WHO World Health Organization
ix
EXECUTIVE SUMMARY
Introduction
The Municipal census report is the first of its kind since the first post-independence census
was conducted in 1960. The report provides basic information about the Municipality. It
gives a brief background of the Municipality, describing its physical features, political and
administrative structure, socio-cultural structure and economy. Using data from the 2010
Population and Housing Census (2010 PHC), the report discusses the population
characteristics of the Municipality, fertility, mortality, migration, marital status, literacy and
education, economic activity status, occupation, employment; Information Communication
Technology (ICT), disability, agricultural activities and housing conditions. The key findings
of the analysis are as follows (references are to the relevant sections of the report):
Population size, structure and composition
The population of New Juaben Municipality, according to the 2010 Population and Housing
Census, is 183,727 representing 6.9 percent of the Eastern region’s total population of
2,633,154. Males constitute 48.3 percent and females represent 51.7 percent. More than 90
percent (93.3%) of the population in the Municipality live in urban localities. The
Municipality has a sex ratio of 93, implying that to every 100 females there 93 males. The
Municipality has a youthful population with about one third (30.8%) of the population below
15 years. This age structure results in a broad base population pyramid which tapers off with
a small number of elderly persons (7.3%). The total age dependency ratio for the
Municipality is 56.1.
Fertility, mortality and migration
The Total Fertility Rate (TFR) for the Municipality 2.4 which lower than the Eastern region
average of 3.5. The General Fertility Rate (GFR) is 68 births per 1000 women aged 15-49
years which is the lowest for the region. The Crude Birth Rate (CBR) is 19.7 per 1000
population. The crude death rate for the Municipality is 5.9 per 1000. Migrants in the
Municipality are mainly from the neighboring regions (Greater Accra, Ashanti and Volta
Region. Migrants from Volta region constitute 11.0 percent of the migrant population, with
those from the Greater Accra and Ashanti regions constituting 10 percent and 9.7 percent
respectively.
Household size, composition and structure
The Municipality has a household population of 120,320 with a total number of 26,930
households. The average household size in the Municipality is 4.5 persons per household.
Children constitute the largest proportion of the household structure accounting for 45.5
percent. Spouses form about 11 percent. Nuclear households (head, spouse(s) and children)
constitute 33.1 percent of the total number of households in the Municipality.
Marital status
Close to half (47.2%) of the population aged 12 years and older in the Municipality have
never been married. A little over one third (36.1%) of the population in the given age bracket
have ever been married. The population divorced (4.1%) and those widowed (5.1%)
constitute less than six percent of the population aged 12 years and older. About five percent
of the population 12 years and older are in informal unions.
x
Nationality
Majority of the population in the Municipality are Ghanaians. Non Ghanaians account for
only 2.5 percent of the Municipality’s Population.
Literacy and education
More than 90 percent of the population aged 11 years and older in the Municipality are
literate. Females have higher proportion of not literate population than males. Close to three
quarters (72.0%) of the literate population are literate in English and a Ghanaian language(s).
Less than one percent are literate in English and French.
The majority (54.9%) of the population currently in school are in basic schools, i.e., primary
and JSS/JHS. Persons in senior secondary schools constitute 12 percent of the population
currently in school. The proportion (57.0%) of females in basic schools is higher than that of
males (52.8%), but the reverse is the case for those in tertiary education (9.7 % for females
and 15.3% for males).
Economic Activity Status
About 66.4 percent of the population aged 15 years and older are economically active while
33.6 per cent are economically not active. Of the economically active population, 92.7
percent are employed while 7.3 percent are unemployed. For those who are economically not
active, a larger percentage of them are students (62.1%), 12.4 percent perform household
duties and 3.9 percent are disabled or too sick to work. About 63 percent (62.8%) of the
unemployed are seeking work for the first time.
Occupation and industry
Majority (51.2%) of the working population are into service and sales, followed by craft and
related works. A higher percentage of females (35.7%) are into service and sales than males
(20.1%). Majority of male workers (27%) are rather into craft and related works. Wholesale
and retail is the predominant industry for both male (19.6%) and female (42.5%) workers in
the Municipality.
Employment status and section
More than half (53.1%) of the employed population are self-employed without employees.
Females (64.0%) are more likely to be self-employed without employees than males (40.9%).
About one third (31.3%) of the working population are employees, with higher percentage of
males being employees (40.9%) than females (21.7%). Three quarters (75%) of the employed
population are in the private informal sector.
Information Communication Technology
More than two thirds of the population aged aged 12 years and older in the New Juaben
Municipality own owned mobile phones with about one fifth (17.5%) having access to
Internet facilities. Males who own mobile phones constitute 72.3 percent as compared to 65.3
percent of females.With regards to owner of computer, 15.3 percent of households in the
Municipality own a computer (desktop/laptop) .
xi
Disability
About four percent (4.3%) of the population in the New Juaben Municipality have one type
of disability or the other. The majority of Persons with Disability (PWDs) have visual
impairment, followed by physically disability and emotional disorders. There are slightly
more females with mobility impairment (physical) than males. Slightly higher percentage of
females (4.7%) have disabilities than males (3.9%).
Agriculture
Agricultural households constitute 19.7 percent of the total households in the Municipality,
with majority of the households engaged in crop farming (87.6 %). Rural households tend to
be more involved in agriculture (53.2%) as compared to their urban counterparts (17.6%).
Housing
The housing stock of New Juaben Municipality is 22,619 representing 5.2 percent of the total
number of houses in the Eastern region. The average number of households per house is two
and population per house is eight.
Electricity is the main source of lighting for the majority (86.8%) of households in the
Municipality. Charcoal (48.6%). Gas (33%) and wood are the main sources of fuel for
cooking. The majority of households in the Municipality use pipe borne water (32.5% use
pipe borne inside dwelling and 15.9% pipe borne outside dwelling) for drinking. Water for
other domestic purposes is also mainly from pipe borne water (51.1%) with 28 percent from
protected wells. More than one third of households in the Municipality use public toilet with
close to one third using W.C. However, the majority of rural households use pit latrine while
majority of urban households use public toilet.
With regards to waste disposal, close to two thirds of households dispose of their solid waste
by dumping it onto public dump containers. More than one- third (39.0%) of households in
the Municipality dispose their liquid waste into gutters with 25 percent throwing into
compounds.
Type of tenancy arrangement and ownership of dwelling units
Compound houses constitute more than two thirds (68.5%) of houses in the Municipality with
separate houses making 16.2 percent. The majority (43%) of dwelling units in the
Municipality are owned by other private individual with a little over one third (34.4%) by
household members.
Material for construction of outer wall, floor and roof
About 90 percent of the outer walls of dwelling units in the Municipality are made of
cement/concrete. More than three quarters of the floors of dwelling units are made of
cement/concrete. The majority of roofs in the Municipality (94%) are roofed with metal
sheets.
Room occupancy
One room constitutes the highest percentage (24.9%) of sleeping rooms occupied by
households in housing units in the Municipality. About 10 percent of households with 10 or
more members occupy single rooms.
xii
Utilities and household facilities
Electricity is the main source of lighting for the majority (86.8%) of households in the
Municipality. Charcoal (48.6%). Gas (33%) and wood are the main sources of fuel for
cooking. The majority of households in the Municipality use pipe borne water (32.5% use
pipe borne inside dwelling and 15.9% pipe borne outside dwelling) for drinking. Water for
other domestic purposes is also mainly from pipe borne water (51.1%) with 28 percent from
protected wells. More than one third of households in the Municipality use public toilet with
close to one third using W.C. However, the majority of rural households use pit latrine while
majority of urban households use public toilet.
Waste disposal
The most widely method of solid waste disposal is by public dump into containers accounting
for 61.3 percent. About one tenth of households in the Municipality dispose of their solid
waste in open space public dumps. A little under two percent of households (1.8%) dump
their solid waste indiscriminately. House to house waste collection accounts for 5.1 percent.
More than one- third (39.0%) of households in the Municipality dispose their liquid waste
into gutters with 25 percent throwing into compounds.
1
CHAPTER ONE
INTRODUCTION
1.1 Background
Since 1960 Ghana has produced national census reports. However, the unit of analysis has
not moved beyond that of the region in many instances, although it is recognized that
Metropolitan/Municipal/ District level information is critical for the design and targeting of
interventions aimed at improving upon the living conditions of the population.
An analytical census report for the New Juaben Municipality using the 2010 Population and
Housing Census (2010 PHC) data will be useful for planning socio-economic developments
for the Municipality. This chapter provides brief background information of the New Juaben
Municipality for the socio-economic and demographic analysis of the 2010 Population and
Housing Census as they relate to the Municipality.
The topics discussed included; physical features, political and administrative structure, social
and cultural structure and the economy. The organization of the report, census methodology
and definition of concepts are also included in the chapter.
1.2 Physical Features
1.2.1 Location and Size
The New Juaben Municipality is one of the districts in the Eastern Region and was
established in 1988 by the Legislative Instrument (LI) 1426. The Municipality lies between
longitudes 1030’ West and 0030 East and latitudes 60 and 70 North. The Municipality shares
common boundaries with East-Akim Municipal to the North-East, Akwapim North District to
the East and South and Suhum-Kraboa-Coaltar District to the East. It covers a land area of
159 square kilometers representing approximately 0.6 percent of the total surface area of the
Eastern Region. It has 52 major communities with Koforidua as its capital.
The Municipality is well served with road networks. Almost all the existing settlements in the
Municipality are reached by improved condition of tarred roads and feeder roads. The
Municipality has a road network totaling 72km and road density of 0.62 km.
1.2.2 Topography and Drainage
The land in the Municipality is generally undulating with heights ranging between 152m and
198m above sea level. The highest area is the mountain belt along the eastern boundary of the
Municipality locally called Obuotabiri.
The Municipality is largely drained by the Densu River and its tributaries, which serve as the
main source of drinking water for residents. The River has a dam constructed at Densuano
from which treated water is transmitted to the Koforidua township and its suburbs. Few
waterfalls are found at different sections of the Densu River.
2
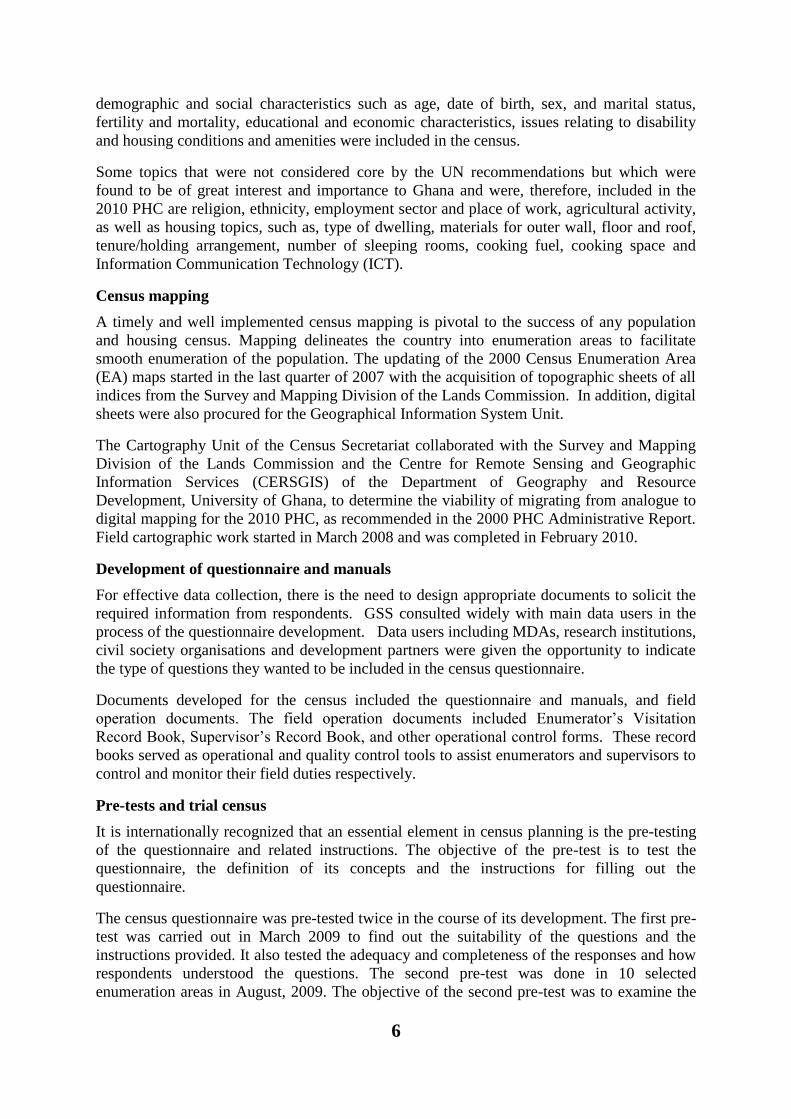
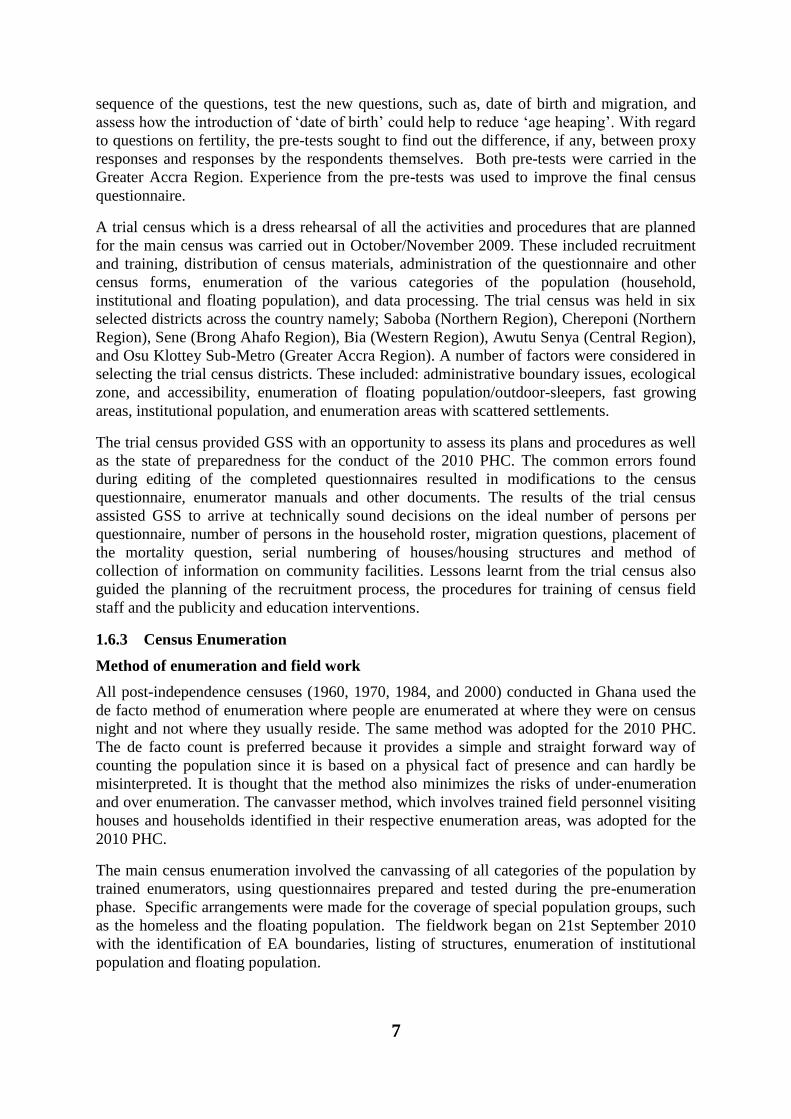
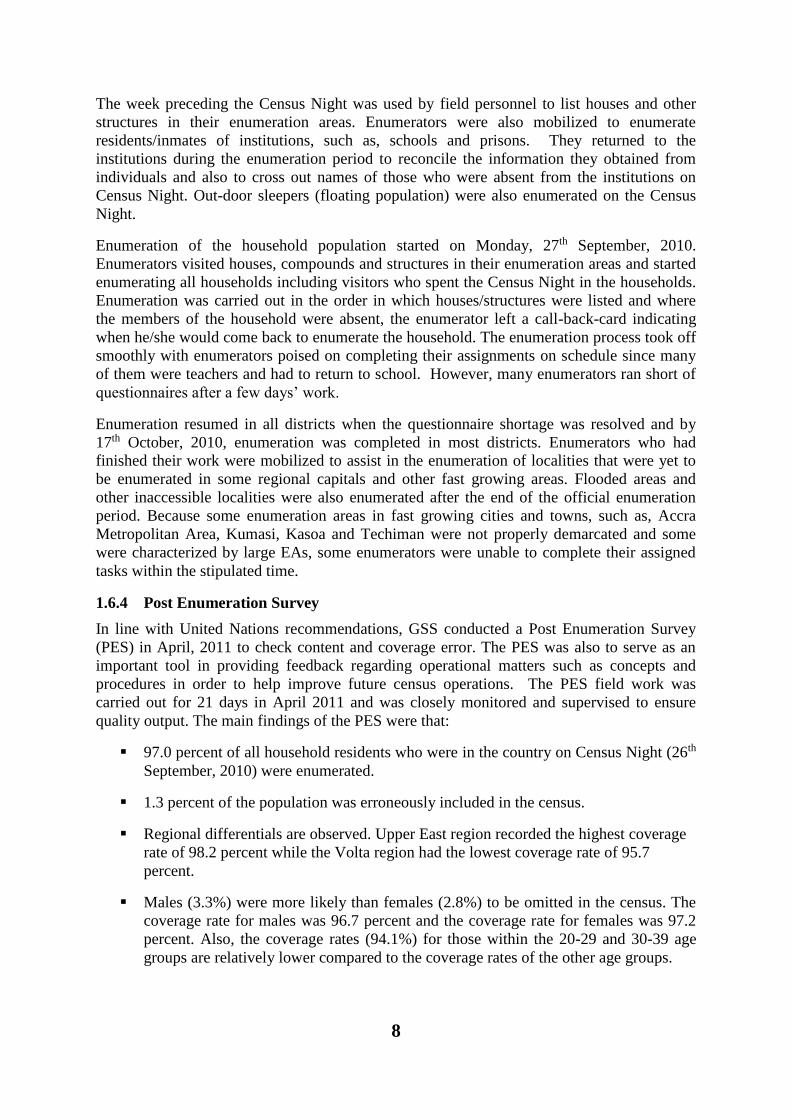
Figure 1.1: Map of New Juaben Municipal
Source: Ghana Statistical Service, GIS
3
1.2.3 Climate and Vegetation
The Municipality falls within the semi-deciduous rain forest climatic zone with a bi-modal
rainy season, with rainfall ranging between 1,200mm and 1,700mm reaching its maximum
during the two peak periods of May/June and September/October. The dry season is
relatively short and is experienced between November and February. Humidity and
temperatures are generally high ranging between 20℃ and 32℃. The relatively mild
temperatures make the Municipality a major tourist destination.
The vegetation is characterized by tall trees with evergreen undergrowth and rich in
economic trees including Odum, Onyina, Kyenkyen, Wawa etc. These species greatly
support lumbering and estate development activities. Scattered patches of secondary or
broken forest are also present.
1.3 Political and Administrative Structure
Like other districts in Ghana, the New Juaben Municipal Assembly has a distinct political
and administrative system. The Municipality is made up of 82 Assembly members; 54
elected, 35 Government appointees, Municipal Chief Executive and two Members of
Parliament. There are two constituencies namely New Juaben South and New Juaben North.
The sub-district structures in the Municipality consist of 13 Zonal Councils and 86 Unit
Committees. The political head is the Municipal Chief Executive and the Municipal
Coordinating Director is responsible for the day- to-day administration of the Assembly.
Figure 1 shows the political map of the New Juaben Municipal Assembly.
1.4 Culture and Social Structure
The Municipality is heterogonous in terms of ethnicity with a high dominance of Akans and
Ga-Adangbes. Ewes and people belonging to ethnic groups of the north also form significant
proportions of the population in the Municipality. With the Akan population, there is a fair
mix of Asantes, Kwahus and Akims with a sizeable number of Akwapims. The Municipality
is predominantly Christian, constituting a population of 82.8 percent, Moslems 6.1 percent
and traditional believers 2.4 percent. These religious inclinations have had a major influence
on the dissemination of information and constitute a significant force in mobilizing the
people towards developmental activities.
1.5 Economy
The key sectors of the Municipal economy are, the service sector which constitutes 39.9
percent, industrial manufacturing and processing 26.7 percent, agriculture 26.1 percent and
other socio-economic activities constitutes 7.3 percent. While majority of industrial
establishments are found in the central business area of the Municipality, agricultural
production is carried out in the small settlements and the peri-urban localities.
1.5.1 Manufacturing and Processing
Industrial activities are mostly medium and small scale involving the production of alcohol
and non-alcoholic beverages, textiles, crafts, soap making, carpentry and joinery, traditional
medicine, palm and kernel oil production and beads making. The leading industrial company
in the Municipality is the Intravenous Infusions Company that produces drugs for infusions
and injections.
4
1.5.2 Services
The service sector is the fastest growing economic sector in the Municipality employing 39.9
per cent of the population. A large number of small and medium scale service enterprises
have sprung up in the Municipality over the past decade mostly in the area of ICT and other
business set-ups such as restaurants, hotels, hair-dressing salons, repair shops (mechanics,
electricians, sprayers etc.), spare parts sales, drug/chemical stores, pharmacies, supermarkets,
drinking spots, photo studios and communication centres. There exist other service providers
like the banking, telecommunication and postal services.
1.5.3 Agricultural Sector
The agricultural sector is also an important source of employment for about 26.1 percent of
the population. They engage in the cultivation of food and cash crops such as, maize,
plantain, cassava, pawpaw, pepper, tomatoes, kola nuts etc. The adoption of scientific farm
practices is high among literate farmers and has prospects of increasing yield per acre.
1.5.4 Tourism Attractions
The full potential of the tourism industry in the Municipality is yet to be tapped. Some tourist
attractions that have been identified by the Assembly and yet to be developed include:
Kentenkeren Waterfall, Akyekyeso Crocodile Sanctuary, Obuotabiri bird view and Green
Belts among others. The Akyekyeso Alligator Cave provides tourists with the opportunity to
view and study alligators in their natural setting. These alligators are unique in that they have
pieces of gold nuggets stuck to their foreheads. The Akuodum-Mpaem forest has
immeasurable significance for development into an eco-tourism destination.
There are a number of good hotels and restaurants ready to accommodate potential tourists
who visit the Municipality. The scenic landscape, exotic cultures resulting from the multi-
ethnic character of the municipality and the many historic sites make New Juaben an exciting
destination for adventure seeking and exploratory tourists.
1.6 Census Methodology, Concepts and Definitions
1.6.1 Introduction
Ghana Statistical Service (GSS) was guided by the principle of international comparability
and the need to obtain accurate information in the 2010 Population and Housing Census
(2010 PHC). The Census was, therefore, conducted using all the essential features of a
modern census as contained in the United Nations Principles and Recommendations for
countries taking part in the 2010 Round of Population and Housing Censuses.
Experience from previous post independence censuses of Ghana (1960, 1970, 1984 and 2000)
was taken into consideration in developing the methodologies for conducting the 2010 PHC.
The primary objective of the 2010 PHC was to provide information on the number,
distribution and social, economic and demographic characteristics of the population of Ghana
necessary to facilitate the socio-economic development of the country.
1.6.2 Pre-enumeration activities
Development of census project document and work plans
A large scale statistical operation, such as the 2010 Population and Housing Census required
meticulous planning for its successful implementation. A working group of the Ghana
5
Statistical Service prepared the census project document with the assistance of two
consultants. The document contains the rationale and objectives of the census, census
organisation, a work plan as well as a budget. The project document was launched in
November 2008 as part of the Ghana Statistics Development Plan (GSDP) and reviewed in
November 2009.
Census secretariat and committees
A well-structured management and supervisory framework that outlines the responsibilities
of the various stakeholders is essential for the effective implementation of a population and
housing census. To implement the 2010 PHC, a National Census Secretariat was set up in
January 2008 and comprised professional and technical staff of GSS as well as staff of other
Ministries, Departments and Agencies (MDAs) seconded to GSS. The Census Secretariat was
primarily responsible for the day-to-day planning and implementation of the census activities.
The Secretariat had seven units, namely; census administration, cartography, recruitment and
training, publicity and education, field operations and logistics management, data processing,
and data analysis and dissemination.
The Census Secretariat was initially headed by an acting Census Coordinator engaged by the
United Nations Population Fund (UNFPA) in 2008 to support GSS in the planning of the
Census. In 2009, the Census Secretariat was re-organised with the Government Statistician
as the National Chief Census Officer and overall Coordinator, assisted by a Census
Management Team and a Census Coordinating Team. The Census Management Team had
oversight responsibility for the implementation of the Census. It also had the responsibility of
taking critical decisions on the census in consultation with other national committees. The
Census Coordinating Team, on the other hand, was responsible for the day-to-day
implementation of the Census programme.
A number of census committees were also set up at both national and sub-national levels to
provide guidance and assistance with respect to resource mobilization and technical advice.
At the national level, the committees were the National Census Steering Committee (NCSC),
the National Census Technical Advisory Committee (NCTAC) and the National Census
Publicity and Education Committee (NCPEC). At the regional and district levels, the
committees were the Regional Census Implementation Committee and the District Census
Implementation Committee, respectively.
The Regional and District Census Implementation Committees were inter-sectoral in their
composition. Members of the Committees were mainly from decentralized departments with
the Regional and District Coordinating Directors chairing the Regional Census
Implementation Committee and District Census Implementation Committee, respectively.
The Committees contributed to the planning of district, community and locality level
activities in areas of publicity and field operations. They supported the Regional and District
Census Officers in the recruitment and training of field personnel (enumerators and
supervisors), as well as mobilizing logistical support for the census.
Selection of Census topics
The topics selected for the 2010 Population and Housing Census were based on
recommendations contained in the UN Principles and Recommendations for 2010 Round of
Population and Housing Censuses and the African Addendum to that document as well as the
needs of data users. All the core topics recommended at the global level, i.e., geographical
and internal migration characteristics, international migration, household characteristics,
6
demographic and social characteristics such as age, date of birth, sex, and marital status,
fertility and mortality, educational and economic characteristics, issues relating to disability
and housing conditions and amenities were included in the census.
Some topics that were not considered core by the UN recommendations but which were
found to be of great interest and importance to Ghana and were, therefore, included in the
2010 PHC are religion, ethnicity, employment sector and place of work, agricultural activity,
as well as housing topics, such as, type of dwelling, materials for outer wall, floor and roof,
tenure/holding arrangement, number of sleeping rooms, cooking fuel, cooking space and
Information Communication Technology (ICT).
Census mapping
A timely and well implemented census mapping is pivotal to the success of any population
and housing census. Mapping delineates the country into enumeration areas to facilitate
smooth enumeration of the population. The updating of the 2000 Census Enumeration Area
(EA) maps started in the last quarter of 2007 with the acquisition of topographic sheets of all
indices from the Survey and Mapping Division of the Lands Commission. In addition, digital
sheets were also procured for the Geographical Information System Unit.
The Cartography Unit of the Census Secretariat collaborated with the Survey and Mapping
Division of the Lands Commission and the Centre for Remote Sensing and Geographic
Information Services (CERSGIS) of the Department of Geography and Resource
Development, University of Ghana, to determine the viability of migrating from analogue to
digital mapping for the 2010 PHC, as recommended in the 2000 PHC Administrative Report.
Field cartographic work started in March 2008 and was completed in February 2010.
Development of questionnaire and manuals
For effective data collection, there is the need to design appropriate documents to solicit the
required information from respondents. GSS consulted widely with main data users in the
process of the questionnaire development. Data users including MDAs, research institutions,
civil society organisations and development partners were given the opportunity to indicate
the type of questions they wanted to be included in the census questionnaire.
Documents developed for the census included the questionnaire and manuals, and field
operation documents. The field operation documents included Enumerator’s Visitation
Record Book, Supervisor’s Record Book, and other operational control forms. These record
books served as operational and quality control tools to assist enumerators and supervisors to
control and monitor their field duties respectively.
Pre-tests and trial census
It is internationally recognized that an essential element in census planning is the pre-testing
of the questionnaire and related instructions. The objective of the pre-test is to test the
questionnaire, the definition of its concepts and the instructions for filling out the
questionnaire.
The census questionnaire was pre-tested twice in the course of its development. The first pre-
test was carried out in March 2009 to find out the suitability of the questions and the
instructions provided. It also tested the adequacy and completeness of the responses and how
respondents understood the questions. The second pre-test was done in 10 selected
enumeration areas in August, 2009. The objective of the second pre-test was to examine the
7
sequence of the questions, test the new questions, such as, date of birth and migration, and
assess how the introduction of ‘date of birth’ could help to reduce ‘age heaping’. With regard
to questions on fertility, the pre-tests sought to find out the difference, if any, between proxy
responses and responses by the respondents themselves. Both pre-tests were carried in the
Greater Accra Region. Experience from the pre-tests was used to improve the final census
questionnaire.
A trial census which is a dress rehearsal of all the activities and procedures that are planned
for the main census was carried out in October/November 2009. These included recruitment
and training, distribution of census materials, administration of the questionnaire and other
census forms, enumeration of the various categories of the population (household,
institutional and floating population), and data processing. The trial census was held in six
selected districts across the country namely; Saboba (Northern Region), Chereponi (Northern
Region), Sene (Brong Ahafo Region), Bia (Western Region), Awutu Senya (Central Region),
and Osu Klottey Sub-Metro (Greater Accra Region). A number of factors were considered in
selecting the trial census districts. These included: administrative boundary issues, ecological
zone, and accessibility, enumeration of floating population/outdoor-sleepers, fast growing
areas, institutional population, and enumeration areas with scattered settlements.
The trial census provided GSS with an opportunity to assess its plans and procedures as well
as the state of preparedness for the conduct of the 2010 PHC. The common errors found
during editing of the completed questionnaires resulted in modifications to the census
questionnaire, enumerator manuals and other documents. The results of the trial census
assisted GSS to arrive at technically sound decisions on the ideal number of persons per
questionnaire, number of persons in the household roster, migration questions, placement of
the mortality question, serial numbering of houses/housing structures and method of
collection of information on community facilities. Lessons learnt from the trial census also
guided the planning of the recruitment process, the procedures for training of census field
staff and the publicity and education interventions.
1.6.3 Census Enumeration
Method of enumeration and field work
All post-independence censuses (1960, 1970, 1984, and 2000) conducted in Ghana used the
de facto method of enumeration where people are enumerated at where they were on census
night and not where they usually reside. The same method was adopted for the 2010 PHC.
The de facto count is preferred because it provides a simple and straight forward way of
counting the population since it is based on a physical fact of presence and can hardly be
misinterpreted. It is thought that the method also minimizes the risks of under-enumeration
and over enumeration. The canvasser method, which involves trained field personnel visiting
houses and households identified in their respective enumeration areas, was adopted for the
2010 PHC.
The main census enumeration involved the canvassing of all categories of the population by
trained enumerators, using questionnaires prepared and tested during the pre-enumeration
phase. Specific arrangements were made for the coverage of special population groups, such
as the homeless and the floating population. The fieldwork began on 21st September 2010
with the identification of EA boundaries, listing of structures, enumeration of institutional
population and floating population.
8
The week preceding the Census Night was used by field personnel to list houses and other
structures in their enumeration areas. Enumerators were also mobilized to enumerate
residents/inmates of institutions, such as, schools and prisons. They returned to the
institutions during the enumeration period to reconcile the information they obtained from
individuals and also to cross out names of those who were absent from the institutions on
Census Night. Out-door sleepers (floating population) were also enumerated on the Census
Night.
Enumeration of the household population started on Monday, 27th September, 2010.
Enumerators visited houses, compounds and structures in their enumeration areas and started
enumerating all households including visitors who spent the Census Night in the households.
Enumeration was carried out in the order in which houses/structures were listed and where
the members of the household were absent, the enumerator left a call-back-card indicating
when he/she would come back to enumerate the household. The enumeration process took off
smoothly with enumerators poised on completing their assignments on schedule since many
of them were teachers and had to return to school. However, many enumerators ran short of
questionnaires after a few days’ work.
Enumeration resumed in all districts when the questionnaire shortage was resolved and by
17th October, 2010, enumeration was completed in most districts. Enumerators who had
finished their work were mobilized to assist in the enumeration of localities that were yet to
be enumerated in some regional capitals and other fast growing areas. Flooded areas and
other inaccessible localities were also enumerated after the end of the official enumeration
period. Because some enumeration areas in fast growing cities and towns, such as, Accra
Metropolitan Area, Kumasi, Kasoa and Techiman were not properly demarcated and some
were characterized by large EAs, some enumerators were unable to complete their assigned
tasks within the stipulated time.
1.6.4 Post Enumeration Survey
In line with United Nations recommendations, GSS conducted a Post Enumeration Survey
(PES) in April, 2011 to check content and coverage error. The PES was also to serve as an
important tool in providing feedback regarding operational matters such as concepts and
procedures in order to help improve future census operations. The PES field work was
carried out for 21 days in April 2011 and was closely monitored and supervised to ensure
quality output. The main findings of the PES were that:
97.0 percent of all household residents who were in the country on Census Night (26th
September, 2010) were enumerated.
1.3 percent of the population was erroneously included in the census.
Regional differentials are observed. Upper East region recorded the highest coverage
rate of 98.2 percent while the Volta region had the lowest coverage rate of 95.7
percent.
Males (3.3%) were more likely than females (2.8%) to be omitted in the census. The
coverage rate for males was 96.7 percent and the coverage rate for females was 97.2
percent. Also, the coverage rates (94.1%) for those within the 20-29 and 30-39 age
groups are relatively lower compared to the coverage rates of the other age groups.
9
There was a high rate of agreement between the 2010 PHC data and the PES data for
sex (98.8%), marital status (94.6%), relationship to head of household (90.5%) and
age (83.0%).
1.6.5 Release and dissemination of results
The provisional results of the census were released in February 2011 and the final results in
May 2012. A National Analytical report, six thematic reports, a Census Atlas, 10 Regional
Reports and a report on Demographic, Social, Economic and Housing were prepared and
disseminated in 2013.
1.6.6 Concepts and definitions
Introduction
The 2010 Population and Housing Census of Ghana followed the essential concepts and
definitions of a modern Population and Housing Census as recommended by the United
Nations (UN). It is important that the concepts, definitions and recommendations are adhered
to since they form the basis upon which Ghana could compare her data with that of other
countries.
The concepts and definitions in this report cover all sections of the 2010 Population and
Housing Census questionnaires (PHC1A and PHC1B). The sections were: geographical
location of the population, Household and Non-household population, Literacy and
Education, Emigration, Demographic and Economic Characteristics, Disability, Information
and Communication Technology (ICT), Fertility, Mortality, Agricultural Activity and
Housing Conditions.
The concepts and definitions are provided to facilitate understanding and use of the data
presented in this report. Users are therefore advised to use the results of the census within the
context of these concepts and definitions.
Region
There were ten (10) administrative regions in Ghana during the 2010 Population and Housing
Census as they were in 1984 and 2000.
District
In 1988, Ghana changed from the local authority system of administration to the district
assembly system. In that year, the then existing 140 local authorities were demarcated into
110 districts. In 2004, 28 new districts were created; this increased the number of districts in
the country to 138. In 2008, 32 additional districts were created bringing the total number of
districts to 170. The 2010 Population and Housing Census was conducted in these 170
administrative districts (these are made-up of 164 districts/municipals and 6 metropolitan
areas). In 2012, 46 new districts were created to bring the total number of districts to 216.
There was urgent need for data for the 46 newly created districts for planning and decision-
making. To meet this demand, the 2010 Census data was re-programmed into 216 districts
after carrying out additional fieldwork and consultations with stakeholders in the districts
affected by the creation of the new districts.
Locality
A locality was defined as a distinct population cluster (also designated as inhabited place,
populated centre, settlement) which has a NAME or LOCALLY RECOGNISED STATUS. It

10
included fishing hamlets, mining camps, ranches, farms, market towns, villages, towns, cities
and many other types of population clusters, which meet the above criteria. There were two
main types of localities, rural and urban. As in previous censuses, the classification of
localities into ‘urban’ and ‘rural’ was based on population size. Localities with 5,000 or more
persons were classified as urban while localities with less than 5,000 persons were classified
as rural.
Population
The 2010 Census was a “de facto” count and each person present in Ghana, irrespective of
nationality, was enumerated at the place where he/she spent the midnight of 26th September
2010.
Household
A household was defined as a person or a group of persons, who lived together in the same
house or compound and shared the same house-keeping arrangements. In general, a
household consisted of a man, his wife, children and some other relatives or a house help who
may be living with them. However, it is important to remember that members of a household
are not necessarily related (by blood or marriage) because non-relatives (e.g. house helps)
may form part of a household.
Head of Household
The household head was defined as a male or female member of the household recognised as
such by the other household members. The head of household is generally the person who has
economic and social responsibility for the household. All relationships are defined with
reference to the head.
Household and Non-household population
Household population comprised of all persons who spent the census night in a household
setting. All persons who did not spend the census night in a household setting (except
otherwise stated) were classified as non-household population. Persons who spent census
night in any of the under listed institutions and locations were classified as non-household
population:
(a) Educational institutions
(b) Children's and old people’s homes
(c) Hospitals and healing centres
(d) Hotels
(e) Prisons
(f) Service barracks
(g) Soldiers on field exercise
(h) Floating population: The following are examples of persons in this category:
11
i. All persons who slept in lorry parks, markets, in front of stores and offices, public
bathrooms, petrol filling stations, railway stations, verandas, pavements, and all
such places which are not houses or compounds.
ii. Hunting and fishing camps.
iii. Beggars and vagrants (mentally sick or otherwise).
Age
The age of every person was recorded in completed years disregarding fractions of days and
months. For those persons who did not know their birthdays, the enumerator estimated their
ages using a list of district, regional and national historical events.
Nationality
Nationality is defined as the country to which a person belongs. A distinction is made
between Ghanaians and other nationals. Ghanaian nationals are grouped into Ghanaian by
birth, Ghanaian with dual nationality and Ghanaian by naturalization. Other nationals are
grouped into ECOWAS nationals, Africans other than ECOWAS nationals, and non-
Africans.
Ethnicity
Ethnicity refers to the ethnic group that a person belonged to. This information is collected
only from Ghanaians by birth and Ghanaians with dual nationality. The classification of
ethnic groups in Ghana is that officially provided by the Bureau of Ghana Languages and
which has been in use since the 1960 census.
Birthplace
The birthplace of a person refers to the locality of usual residence of the mother at the time of
birth. If after delivery a mother stayed outside her locality of usual residence for six months
or more or had the intention of staying in the new place for six or more months, then the
actual town/village of physical birth becomes the birthplace of the child.
Duration of Residence
Duration of residence refers to the number of years a person has lived in a particular place.
This question is only asked of persons not born in the place where enumeration took place.
Breaks in duration of residence lasting less than 12 months are disregarded. The duration of
residence of persons who made multiple movements of one (1) year or more is assumed to be
the number of years lived in the locality (town or village) since the last movement.
Religion
Religion refers to the individual’s religious affiliation as reported by the respondent,
irrespective of the religion of the household head or the head’s spouse or the name of the
person. No attempt was made to find out if respondents actually practiced the faith they
professed.
Marital status
Marital status refers to the respondent’s marital status as at Census Night. The question on
marital status was asked only of persons 12 years and older. The selection of the age limit of
12
12 years was based on the average age at menarche and also on the practice in some parts of
the country where girls as young as 12 years old could be given in marriage.
Literacy
The question on literacy referred to the respondent's ability to read and write in any language.
A person was considered literate if he/she could read and write a simple statement with
understanding. The question on literacy was asked only of persons 11 years and older.
Education
School Attendance
Data was collected on school attendance for all persons three (3) years and older. School
attendance refers to whether a person has ever attended, was currently attending or has never
attended school. In the census, school meant an educational institution where a person
received at least four hours of formal education.
Although the lower age limit of formal education is six years for primary one, eligibility for
the school attendance question was lowered to three years because pre-school education has
become an important phenomenon in the country.
Level of Education
Level of education refers to the highest level of formal school that a person ever attended or
was attending. This information was obtained for persons 3 years and older.
Activity Status
Activity status refers to economic or non-economic activity of respondents during the 7 days
preceding census night. Information on type of activity was collected on persons 5 years and
older. A person was regarded as economically active if he/she:
a. Worked for pay or profit or family gain for at least 1 hour within the 7 days preceding
Census Night. This included persons who were in paid employment or self-
employment or contributing family workers.
b. Did not work, but had jobs to return to.
c. Were unemployed.
The economically not active were persons who did not work and were not seeking for work.
They were classified by reasons for not being economically active. Economically not active
persons included homemakers, students, retired persons, the disabled and persons who were
unable to work due to their age or ill-health.
Occupation
This referred to the type of work the person was engaged in at the establishment where he/she
worked. This was asked only of persons 5 years and older who worked 7 days before the
census night, and those who did not work but had a job to return to as well as those
unemployed who had worked before. All persons who worked during the 7 days before the
census night were classified by the kind of work they were engaged in. The emphasis was on
the work the person did during the reference period and not what he/she was trained to do.
For those who did not work but had a job to return to, their occupation was the job they
would go back to after the period of absence. Also, for persons who had worked before and
13
were seeking for work and available for work, their occupation was on the last work they did
before becoming unemployed. If a person was engaged in more than one occupation, only the
main one was considered.
Industry
Industry referred to the type of product produced or service rendered at the respondent’s work
place. Information was collected only on the main product produced or service rendered in
the establishment during the reference period.
Employment Status
Employment status refers to the status of a person in the establishment where he/she currently
works or previously worked. Eight employment status categories were provided: employee,
self-employed without employees, self-employed with employees, casual worker,
contributing family worker, apprentice, domestic employee (house help). Persons who could
not be classified under any of the above categories were classified as “other”.
Employment Sector
This refers to the sector in which a person worked. The employment sectors covered in the
census were public, private formal, private informal, semi-public/parastatal, NGOs and
international organizations.
Disability
Persons with disability were defined as those who were unable to or were restricted in the
performance of specific tasks/activities due to loss of function of some part of the body as a
result of impairment or malformation. Information was collected on persons with visual/sight
impairment, hearing impairment, mental retardation, emotional or behavioural disorders and
other physical challenges.
Information Communication Technology (ICT)
ICT questions were asked for both individuals and households. Persons having mobile
phones refer to respondents 12 years and older who owned mobile phones (irrespective of the
number of mobile phones owned by each person). Persons using internet facility refers to
those who had access to internet facility at home, internet cafe, on mobile phone or other
mobile device. Internet access is assumed to be not only via computer, but also by mobile
phones, PDA, game machine and digital television.
Households having Personal Computers/Laptops refer to households who own
desktops/laptop computers. The fixed telephone line refers to a telephone line connecting a
customer’s terminal equipment (e.g. telephone set, facsimile machine) to the public switch
telephone network.
Fertility
Two types of fertility data were collected: lifetime fertility and current fertility. Lifetime
fertility refers to the total number of live births that females 12 years and older had ever had
during their life time. Current fertility refers to the number of live births that females 12-54
years old had in the 12 months preceding the Census Night.
14
Mortality
Mortality refers to all deaths that occurred in the household during the 12 months preceding
the Census Night. The report presents information on deaths due to accidents, violence,
homicide and suicide. In addition, data were collected on pregnancy-related deaths of
females 12-54 years.
Agriculture
The census sought information on household members who are engaged in agricultural
activities, including the cultivation of crops or tree planting, rearing of livestock or breeding
of fish for sale or family consumption. Information was also collected on their farms, types of
crops and number and type of livestock.
Housing Conditions and Facilities
The UN recommended definition of a house as “a structurally separate and independent place
of abode such that a person or group of persons can isolate themselves from the hazards of
climate such as storms and the sun’’ was adopted. The definition, therefore, covered any type
of shelter used as living quarters, such as separate houses, semi-detached houses,
flats/apartments, compound houses, huts, tents, kiosks and containers.
Living quarters or dwelling units refer to a specific area or space occupied by a particular
household and therefore need not necessarily be the same as the house of which the dwelling
unit may be a part.
Information collected on housing conditions included the type of dwelling unit, main
construction materials for walls, floor and roof, holding/tenure arrangement, ownership type,
type of lighting, source of water supply and toilet facilities. Data was also collected on
method of disposal of solid and liquid waste.
1.7 Organization of the Report
The report consists of nine chapters. Chapter one provides basic information about the
Municipality. It gives a brief background of the Municipality, describing its physical features,
political and administrative structure, social and cultural structure, economy and the
methodology and concepts used in the report. Chapter two discusses the population size,
composition and age structure. It further discusses the migratory pattern in the Municipality
as well as fertility and mortality.
In chapter three, the focus is on household size, composition and headship as well as the
marital characteristics and nationality of the inhabitants of the Municipality. The chapter also
discusses the religious affiliations and the educational statuses of the members of the
Municipality. Chapter four focuses on economic characteristics such as economic activity
status, occupation, industries and the employment status and sectors that the people are
employed.
Information Communication Technology (ICT) is discussed in chapter five. It analyses
mobile phone ownership, internet use and ownership of desktop/laptop computers while
chapter six is devoted to Persons living with disabilities (PWDs) and their socio-demographic
characteristics. Chapter seven concentrates on the agricultural activities of the households,
describing the types of farming activities, livestock rearing and numbers of livestock reared.
15
In chapter eight, housing conditions such as housing stock, type of dwelling and construction
materials, room occupancy, holding and tenancy, lighting and cooking facilities, bathing and
toilet facilities, waste disposal and source of water for drinking or for other domestic use in
the Municipality are discussed and analysed in detail. The final chapter, Chapter nine
presents the summary of findings and conclusions. It also discusses the policy implications of
the findings for the Municipality.
16
CHAPTER TWO
DEMOGRAPHIC CHARACTERISTICS
2.1 Introduction
For an administrative unit such as the New Juaben Municipality to be able to achieve its
desired objectives, implement its policies and be able to achieve a desired set of programmes,
knowledge of its population size is very vital for its development planning. It is for this
reason that the 2010 Population and Housing Census PHC), had, as one of its several
objectives, the provision and updating of data on socio-economic and demographic
characteristics at the national, regional and district levels. The two characteristics of
population which receive most attention in demographic analysis are age and sex. Age-sex
structure usually forms the basis for planning, research and population projections. The levels
and changes of the three components of population change, fertility, mortality and migration,
are important for socio-economic planning and policy adoption. In developing countries such
as Ghana, where population registers are virtually non-existent, censuses provide a more
comprehensive data on fertility, mortality and migration in terms of coverage than surveys
and other sources. The population size and distribution in the New Juaben Municipality, the
age-sex structure, the rates of migration, fertility and mortality are discussed in this chapter.
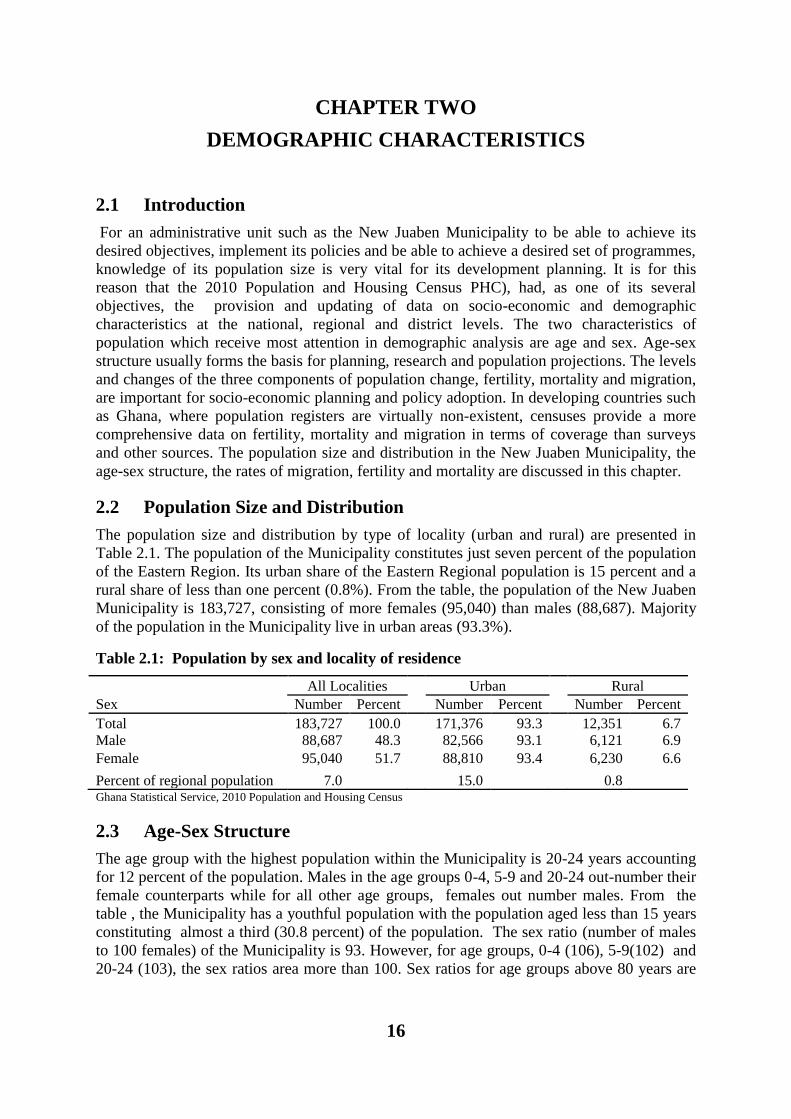
2.2 Population Size and Distribution
The population size and distribution by type of locality (urban and rural) are presented in
Table 2.1. The population of the Municipality constitutes just seven percent of the population
of the Eastern Region. Its urban share of the Eastern Regional population is 15 percent and a
rural share of less than one percent (0.8%). From the table, the population of the New Juaben
Municipality is 183,727, consisting of more females (95,040) than males (88,687). Majority
of the population in the Municipality live in urban areas (93.3%).
Table 2.1: Population by sex and locality of residence
All Localities Urban Rural
Sex Number Percent Number Percent Number Percent
Total 183,727 100.0
171,376 93.3
12,351 6.7
Male 88,687 48.3
82,566 93.1
6,121 6.9
Female 95,040 51.7
88,810 93.4
6,230 6.6
Percent of regional population 7.0 15.0 0.8 Ghana Statistical Service, 2010 Population and Housing Census
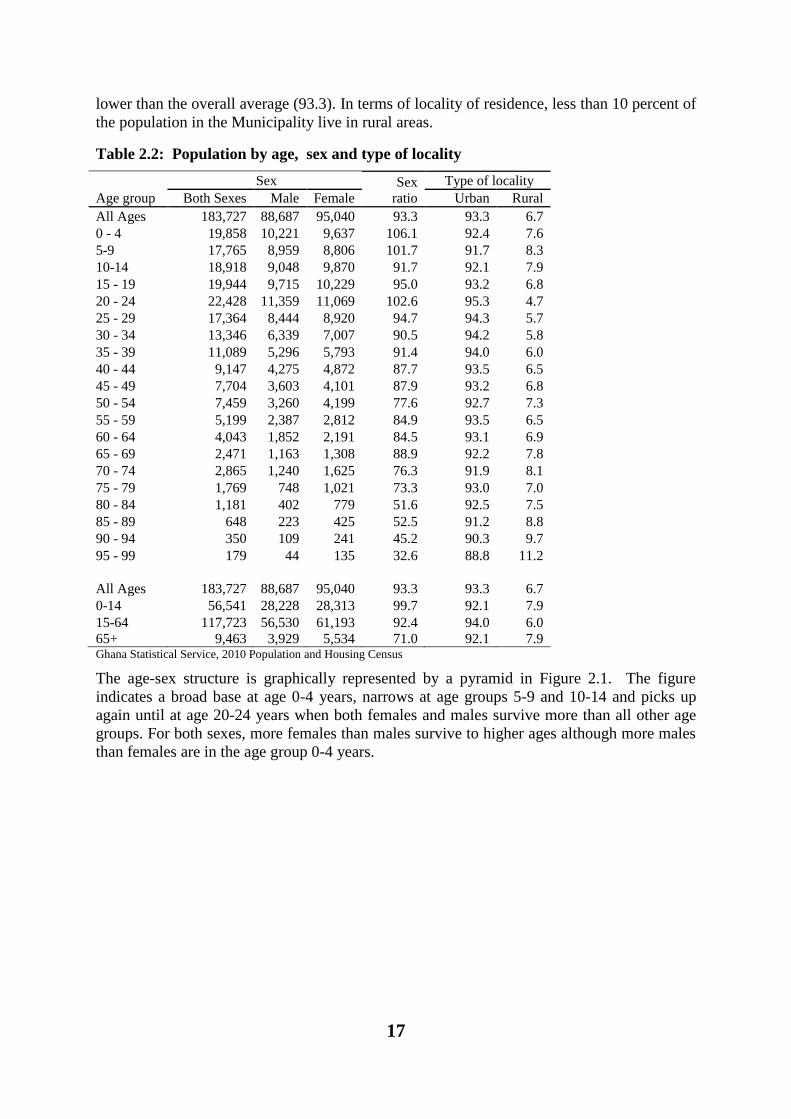
2.3 Age-Sex Structure
The age group with the highest population within the Municipality is 20-24 years accounting
for 12 percent of the population. Males in the age groups 0-4, 5-9 and 20-24 out-number their
female counterparts while for all other age groups, females out number males. From the
table , the Municipality has a youthful population with the population aged less than 15 years
constituting almost a third (30.8 percent) of the population. The sex ratio (number of males
to 100 females) of the Municipality is 93. However, for age groups, 0-4 (106), 5-9(102) and
20-24 (103), the sex ratios area more than 100. Sex ratios for age groups above 80 years are
17
lower than the overall average (93.3). In terms of locality of residence, less than 10 percent of
the population in the Municipality live in rural areas.
Table 2.2: Population by age, sex and type of locality
Sex Sex
ratio
Type of locality
Age group Both Sexes Male Female Urban Rural
All Ages 183,727 88,687 95,040 93.3 93.3 6.7
0 - 4 19,858 10,221 9,637 106.1 92.4 7.6
5-9 17,765 8,959 8,806 101.7 91.7 8.3
10-14 18,918 9,048 9,870 91.7 92.1 7.9
15 - 19 19,944 9,715 10,229 95.0 93.2 6.8
20 - 24 22,428 11,359 11,069 102.6 95.3 4.7
25 - 29 17,364 8,444 8,920 94.7 94.3 5.7
30 - 34 13,346 6,339 7,007 90.5 94.2 5.8
35 - 39 11,089 5,296 5,793 91.4 94.0 6.0
40 - 44 9,147 4,275 4,872 87.7 93.5 6.5
45 - 49 7,704 3,603 4,101 87.9 93.2 6.8
50 - 54 7,459 3,260 4,199 77.6 92.7 7.3
55 - 59 5,199 2,387 2,812 84.9 93.5 6.5
60 - 64 4,043 1,852 2,191 84.5 93.1 6.9
65 - 69 2,471 1,163 1,308 88.9 92.2 7.8
70 - 74 2,865 1,240 1,625 76.3 91.9 8.1
75 - 79 1,769 748 1,021 73.3 93.0 7.0
80 - 84 1,181 402 779 51.6 92.5 7.5
85 - 89 648 223 425 52.5 91.2 8.8
90 - 94 350 109 241 45.2 90.3 9.7
95 - 99 179 44 135 32.6 88.8 11.2
All Ages 183,727 88,687 95,040 93.3 93.3 6.7
0-14 56,541 28,228 28,313 99.7 92.1 7.9
15-64 117,723 56,530 61,193 92.4 94.0 6.0
65+ 9,463 3,929 5,534 71.0 92.1 7.9 Ghana Statistical Service, 2010 Population and Housing Census
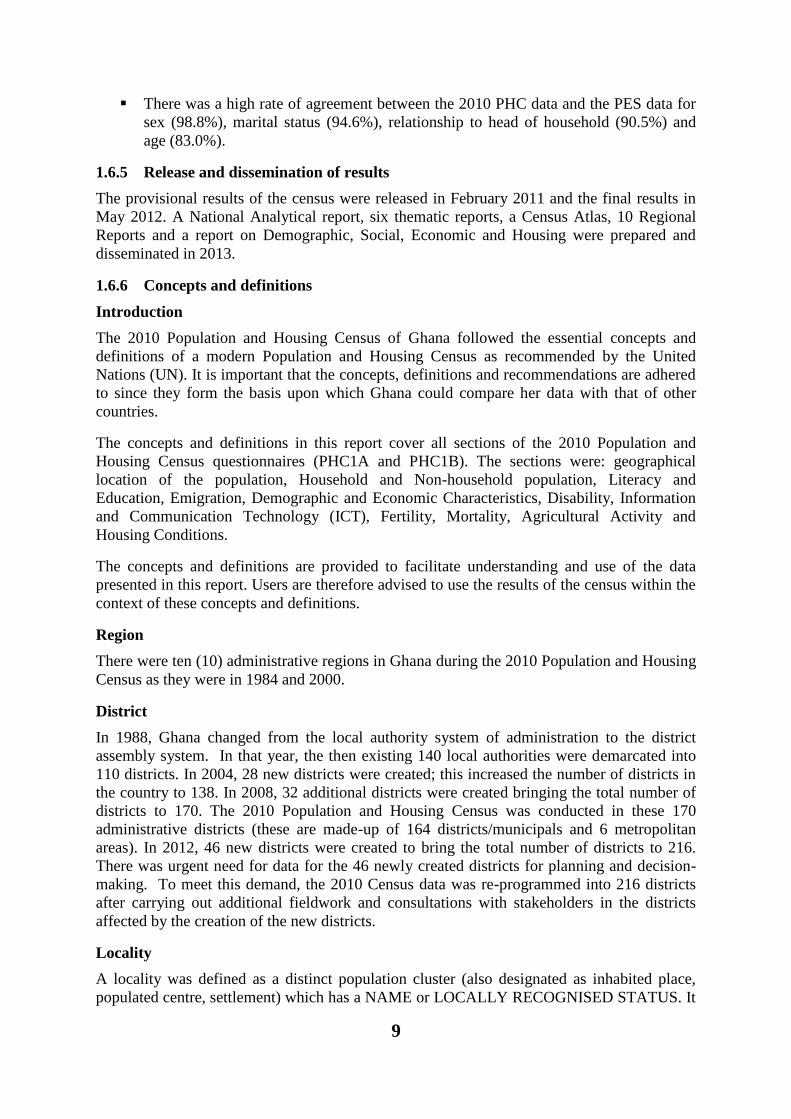
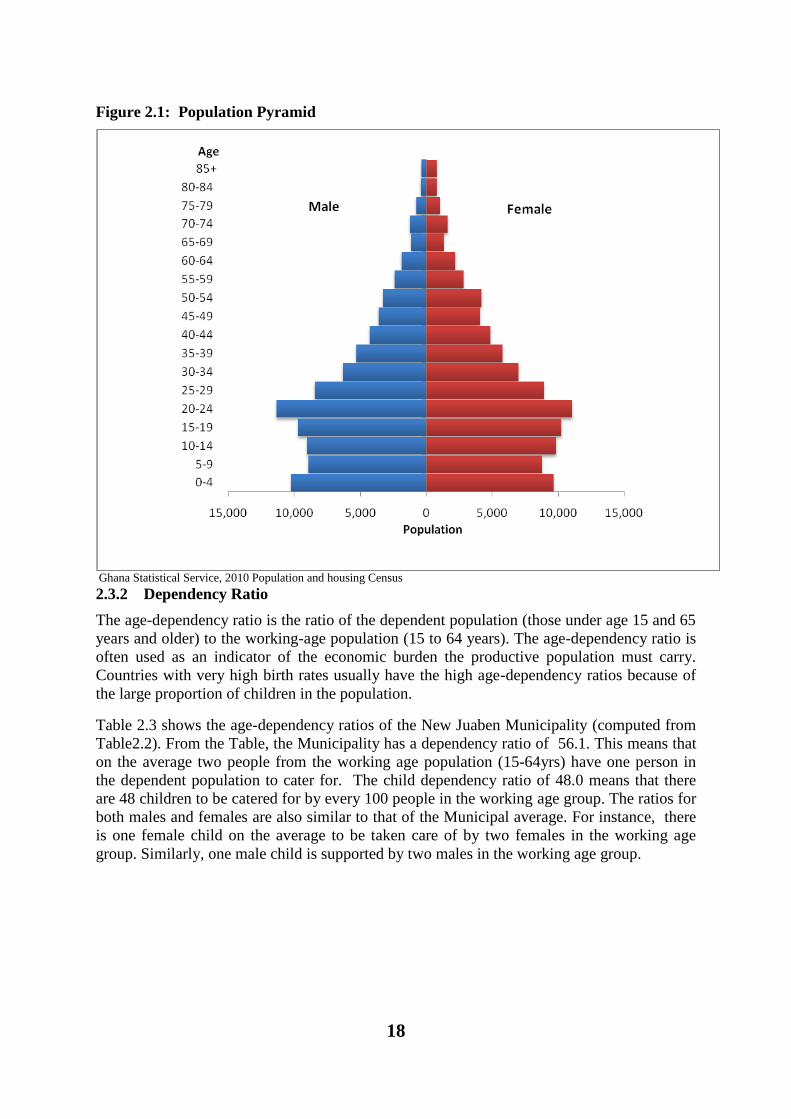
The age-sex structure is graphically represented by a pyramid in Figure 2.1. The figure
indicates a broad base at age 0-4 years, narrows at age groups 5-9 and 10-14 and picks up
again until at age 20-24 years when both females and males survive more than all other age
groups. For both sexes, more females than males survive to higher ages although more males
than females are in the age group 0-4 years.
18
Figure 2.1: Population Pyramid
Ghana Statistical Service, 2010 Population and housing Census
2.3.2 Dependency Ratio
The age-dependency ratio is the ratio of the dependent population (those under age 15 and 65
years and older) to the working-age population (15 to 64 years). The age-dependency ratio is
often used as an indicator of the economic burden the productive population must carry.
Countries with very high birth rates usually have the high age-dependency ratios because of
the large proportion of children in the population.
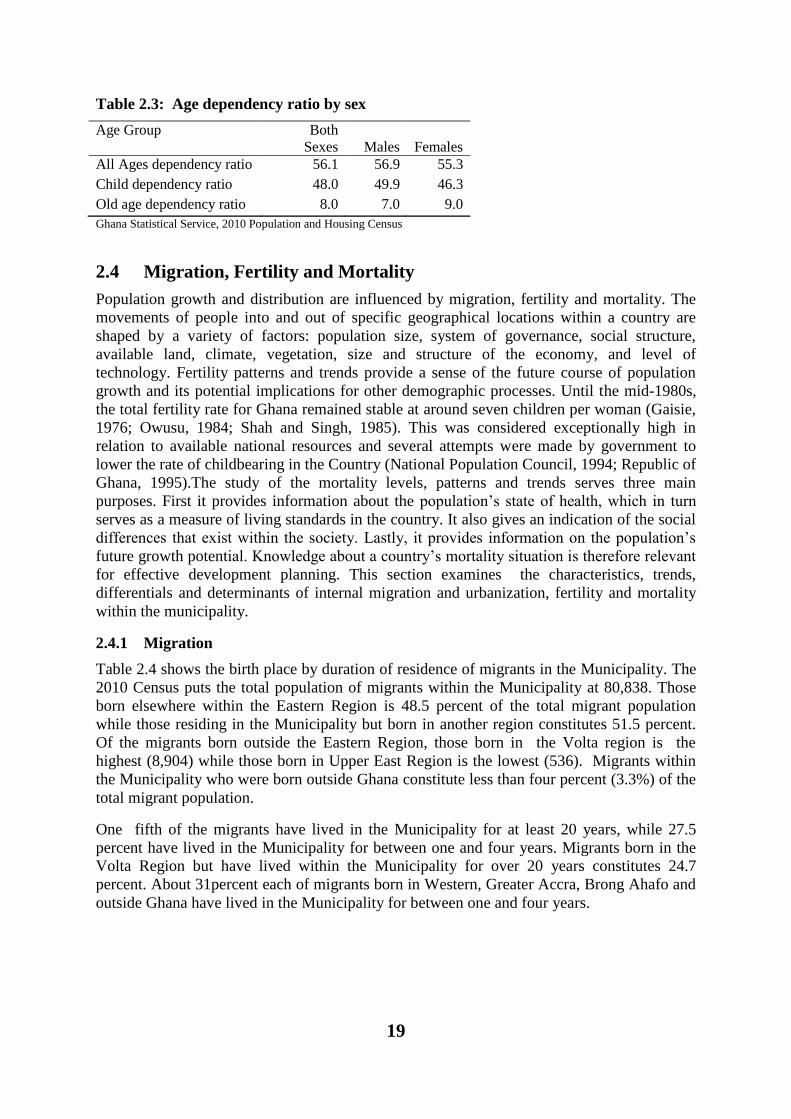
Table 2.3 shows the age-dependency ratios of the New Juaben Municipality (computed from
Table2.2). From the Table, the Municipality has a dependency ratio of 56.1. This means that
on the average two people from the working age population (15-64yrs) have one person in
the dependent population to cater for. The child dependency ratio of 48.0 means that there
are 48 children to be catered for by every 100 people in the working age group. The ratios for
both males and females are also similar to that of the Municipal average. For instance, there
is one female child on the average to be taken care of by two females in the working age
group. Similarly, one male child is supported by two males in the working age group.
19
Table 2.3: Age dependency ratio by sex
Age Group Both
Sexes
Males
Females
All Ages dependency ratio 56.1 56.9 55.3
Child dependency ratio 48.0 49.9 46.3
Old age dependency ratio 8.0 7.0 9.0
Ghana Statistical Service, 2010 Population and Housing Census
2.4 Migration, Fertility and Mortality
Population growth and distribution are influenced by migration, fertility and mortality. The
movements of people into and out of specific geographical locations within a country are
shaped by a variety of factors: population size, system of governance, social structure,
available land, climate, vegetation, size and structure of the economy, and level of
technology. Fertility patterns and trends provide a sense of the future course of population
growth and its potential implications for other demographic processes. Until the mid-1980s,
the total fertility rate for Ghana remained stable at around seven children per woman (Gaisie,
1976; Owusu, 1984; Shah and Singh, 1985). This was considered exceptionally high in
relation to available national resources and several attempts were made by government to
lower the rate of childbearing in the Country (National Population Council, 1994; Republic of
Ghana, 1995).The study of the mortality levels, patterns and trends serves three main
purposes. First it provides information about the population’s state of health, which in turn
serves as a measure of living standards in the country. It also gives an indication of the social
differences that exist within the society. Lastly, it provides information on the population’s
future growth potential. Knowledge about a country’s mortality situation is therefore relevant
for effective development planning. This section examines the characteristics, trends,
differentials and determinants of internal migration and urbanization, fertility and mortality
within the municipality.
2.4.1 Migration
Table 2.4 shows the birth place by duration of residence of migrants in the Municipality. The
2010 Census puts the total population of migrants within the Municipality at 80,838. Those
born elsewhere within the Eastern Region is 48.5 percent of the total migrant population
while those residing in the Municipality but born in another region constitutes 51.5 percent.
Of the migrants born outside the Eastern Region, those born in the Volta region is the
highest (8,904) while those born in Upper East Region is the lowest (536). Migrants within
the Municipality who were born outside Ghana constitute less than four percent (3.3%) of the
total migrant population.
One fifth of the migrants have lived in the Municipality for at least 20 years, while 27.5
percent have lived in the Municipality for between one and four years. Migrants born in the
Volta Region but have lived within the Municipality for over 20 years constitutes 24.7
percent. About 31percent each of migrants born in Western, Greater Accra, Brong Ahafo and
outside Ghana have lived in the Municipality for between one and four years.
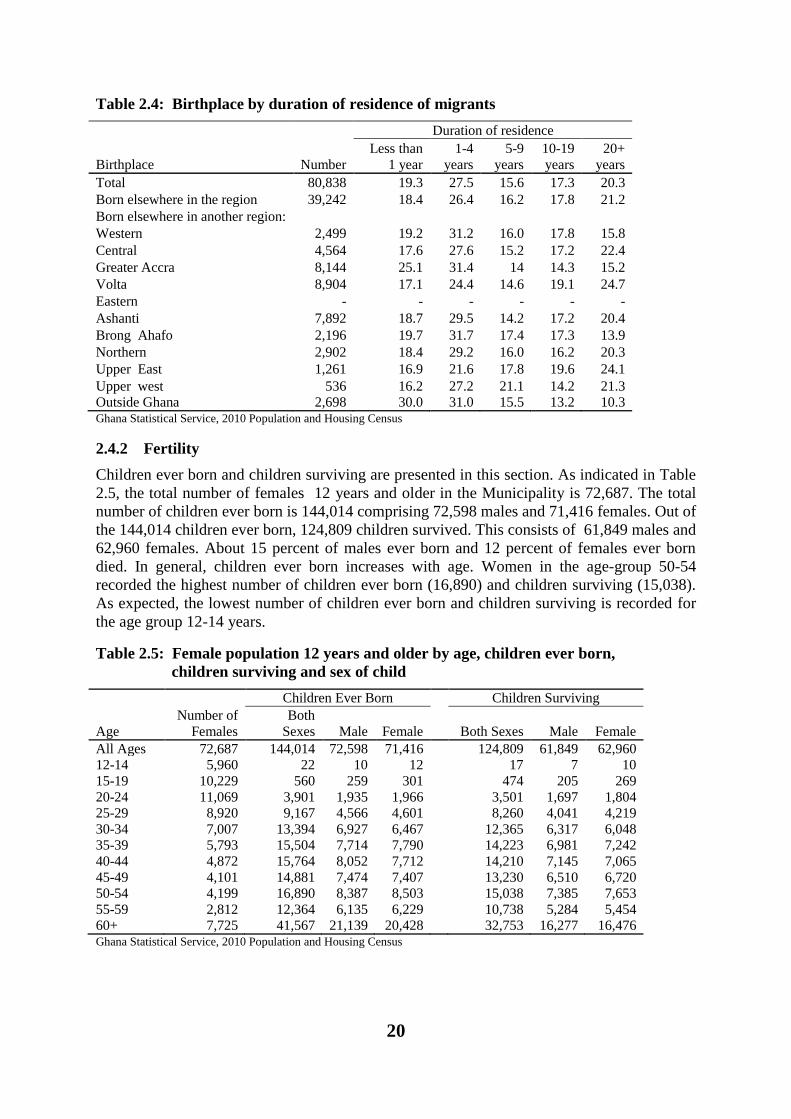
20
Table 2.4: Birthplace by duration of residence of migrants
Duration of residence
Birthplace Number
Less than
1 year
1-4
years
5-9
years
10-19
years
20+
years
Total 80,838 19.3 27.5 15.6 17.3 20.3
Born elsewhere in the region 39,242 18.4 26.4 16.2 17.8 21.2
Born elsewhere in another region:
Western 2,499 19.2 31.2 16.0 17.8 15.8
Central 4,564 17.6 27.6 15.2 17.2 22.4
Greater Accra 8,144 25.1 31.4 14 14.3 15.2
Volta 8,904 17.1 24.4 14.6 19.1 24.7
Eastern - - - - - -
Ashanti 7,892 18.7 29.5 14.2 17.2 20.4
Brong Ahafo 2,196 19.7 31.7 17.4 17.3 13.9
Northern 2,902 18.4 29.2 16.0 16.2 20.3
Upper East 1,261 16.9 21.6 17.8 19.6 24.1
Upper west 536 16.2 27.2 21.1 14.2 21.3
Outside Ghana 2,698 30.0 31.0 15.5 13.2 10.3 Ghana Statistical Service, 2010 Population and Housing Census
2.4.2 Fertility
Children ever born and children surviving are presented in this section. As indicated in Table
2.5, the total number of females 12 years and older in the Municipality is 72,687. The total
number of children ever born is 144,014 comprising 72,598 males and 71,416 females. Out of
the 144,014 children ever born, 124,809 children survived. This consists of 61,849 males and
62,960 females. About 15 percent of males ever born and 12 percent of females ever born
died. In general, children ever born increases with age. Women in the age-group 50-54
recorded the highest number of children ever born (16,890) and children surviving (15,038).
As expected, the lowest number of children ever born and children surviving is recorded for
the age group 12-14 years.
Table 2.5: Female population 12 years and older by age, children ever born,
children surviving and sex of child
Age
Number of
Females
Children Ever Born Children Surviving
Both
Sexes Male Female Both Sexes Male Female
All Ages 72,687 144,014 72,598 71,416
124,809 61,849 62,960
12-14 5,960 22 10 12
17 7 10
15-19 10,229 560 259 301
474 205 269
20-24 11,069 3,901 1,935 1,966
3,501 1,697 1,804
25-29 8,920 9,167 4,566 4,601
8,260 4,041 4,219
30-34 7,007 13,394 6,927 6,467
12,365 6,317 6,048
35-39 5,793 15,504 7,714 7,790
14,223 6,981 7,242
40-44 4,872 15,764 8,052 7,712
14,210 7,145 7,065
45-49 4,101 14,881 7,474 7,407
13,230 6,510 6,720
50-54 4,199 16,890 8,387 8,503
15,038 7,385 7,653
55-59 2,812 12,364 6,135 6,229
10,738 5,284 5,454
60+ 7,725 41,567 21,139 20,428 32,753 16,277 16,476 Ghana Statistical Service, 2010 Population and Housing Census

21
From Table 2.6, the Total Fertility Rate (TFR) for the Municipality is 2.4 which is lower than
the Eastern region average of 3.5. General Fertility Rate (GFR) and Crude Birth Rate for the
Municipality are 68.0 and 19.7 respectively.
Table 2.6: Reported total fertility rate, general fertility rate and
crude birth rate by district
District Population
Number
of women
15-49
years
Number
of births
in last 12
months
Total
Fertility
Rate
General
Fertility
Rate
Crude
Birth
Rate
All Districts 2,633,154 788,455 67,900 3.5 103.9 25.8
Birim South 119,767 35,212 3,259 3.9 114.3 27.2
Birim Municipal 144,869 45,720 3,411 3.1 90.1 23.5
West Akim Municipal 195,349 58,024 5,434 3.9 113.8 27.8
Suhum-Kraboa Coaltar 167,551 48,762 4,317 3.6 108.0 25.8
Akwapem South Municipal 123,501 38,447 3,091 3.3 95.5 25.0
Akwapem North 136,483 41,211 3,549 3.6 103.4 26.0
New Juaben Municipal 183,727 62,150 3,612 2.4 68.0 19.7
Yilo Krobo 87,847 27,007 2,030 2.9 90.1 23.1
Lower Manya 89,246 29,546 2,190 3.0 87.4 24.5
Asuogyaman 98,046 30,675 2,254 3.1 89.5 23.0
Upper Manya 72,092 20,332 1,859 3.7 111.5 25.8
Fanteakwa 108,614 31,368 2,769 3.7 107.2 25.5
East Akim Municipal 167,896 51,132 3,807 3.1 89.9 22.7
Kwaebibirem 192,562 58,556 5,407 3.9 111.4 28.1
Akyem Mansa 97,374 27,417 2,735 4.3 122.3 28.1
Birim North 78,907 22,778 2,163 3.9 116.1 27.4
Atiwa 110,622 31,359 3,207 4.2 125.9 29.0
Kwahu West Municipal 93,584 29,311 2,295 3.3 95.0 24.5
Kwahu South 69,757 20,311 1,872 3.8 114.0 26.8
Kwahu East 77,125 21,132 2,067 4.2 120.7 26.8
Kwahu North 218,235 58,005 6,572 4.4 132.3 30.1 Ghana Statistical Service, 2010 Population and Housing Census
2.4.3 Mortality
Within the 12 months preceding the census, 1,085 household deaths occurred in the
Municipality as reported by households. This translate to a Crude Death Rate (CDR) of 5.9
per 1000 population. Of the total household deaths, 581 were males and 504 were females.
Infant deaths accounted for the highest percentage of 11.8 of household deaths with the
lowest household deaths (1.0 percent) occurring in the age group 10-14 years.
Infant deaths amongst females is about 10 percent of total female deaths within the household
while that for the male infant is 13.4 percent of the total male deaths.
Within the same period, deaths of females aged 12-54 is 239 with pregnancy related deaths
accounting for 22 out of the number. Maternal deaths are higher for persons in age group 25-
34 years.
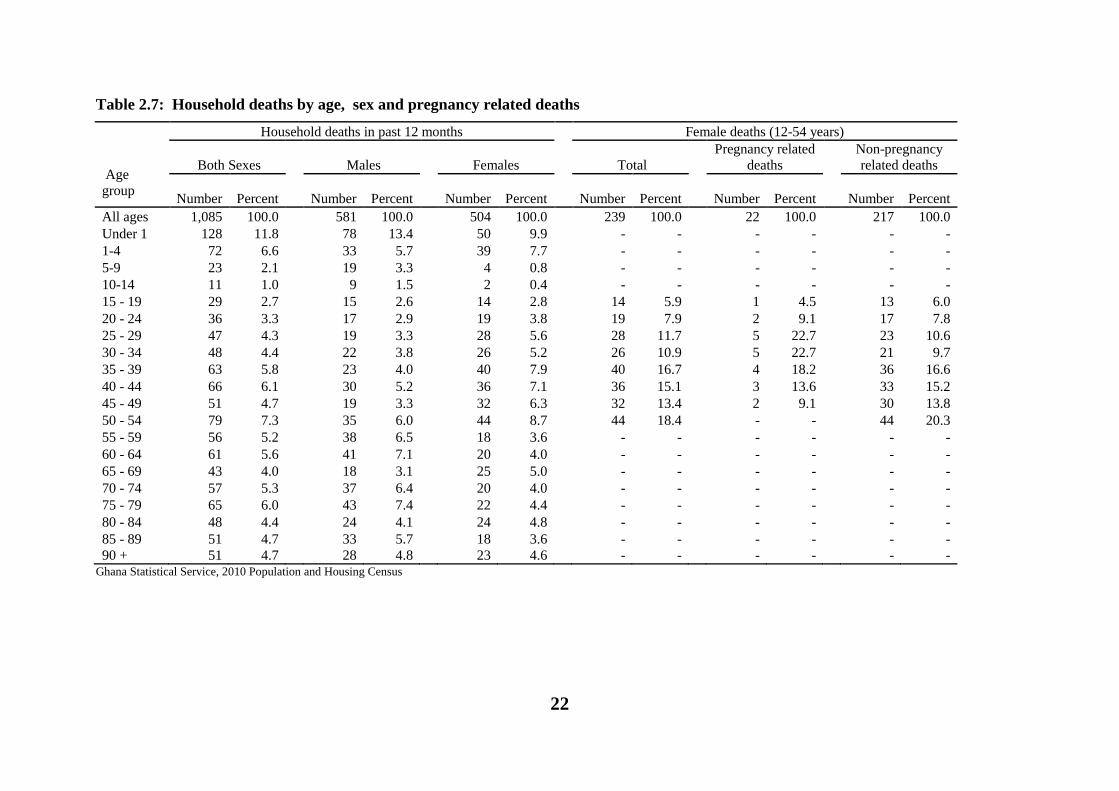
22
Table 2.7: Household deaths by age, sex and pregnancy related deaths
Household deaths in past 12 months Female deaths (12-54 years)
Age
group
Both Sexes
Males
Females
Total
Pregnancy related
deaths
Non-pregnancy
related deaths
Number
Percent
Number
Percent
Number
Percent
Number
Percent
Number
Percent
Number
Percent
All ages 1,085 100.0
581 100.0
504 100.0
239 100.0
22 100.0
217 100.0
Under 1 128 11.8
78 13.4
50 9.9
- -
- -
- -
1-4 72 6.6
33 5.7
39 7.7
- -
- -
- -
5-9 23 2.1
19 3.3
4 0.8
- -
- -
- -
10-14 11 1.0
9 1.5
2 0.4
- -
- -
- -
15 - 19 29 2.7
15 2.6
14 2.8
14 5.9
1 4.5
13 6.0
20 - 24 36 3.3
17 2.9
19 3.8
19 7.9
2 9.1
17 7.8
25 - 29 47 4.3
19 3.3
28 5.6
28 11.7
5 22.7
23 10.6
30 - 34 48 4.4
22 3.8
26 5.2
26 10.9
5 22.7
21 9.7
35 - 39 63 5.8
23 4.0
40 7.9
40 16.7
4 18.2
36 16.6
40 - 44 66 6.1
30 5.2
36 7.1
36 15.1
3 13.6
33 15.2
45 - 49 51 4.7
19 3.3
32 6.3
32 13.4
2 9.1
30 13.8
50 - 54 79 7.3
35 6.0
44 8.7
44 18.4
- -
44 20.3
55 - 59 56 5.2
38 6.5
18 3.6
- -
- -
- -
60 - 64 61 5.6
41 7.1
20 4.0
- -
- -
- -
65 - 69 43 4.0
18 3.1
25 5.0
- -
- -
- -
70 - 74 57 5.3
37 6.4
20 4.0
- -
- -
- -
75 - 79 65 6.0
43 7.4
22 4.4
- -
- -
- -
80 - 84 48 4.4
24 4.1
24 4.8
- -
- -
- -
85 - 89 51 4.7
33 5.7
18 3.6
- -
- -
- -
90 + 51 4.7 28 4.8 23 4.6 - - - - - - Ghana Statistical Service, 2010 Population and Housing Census
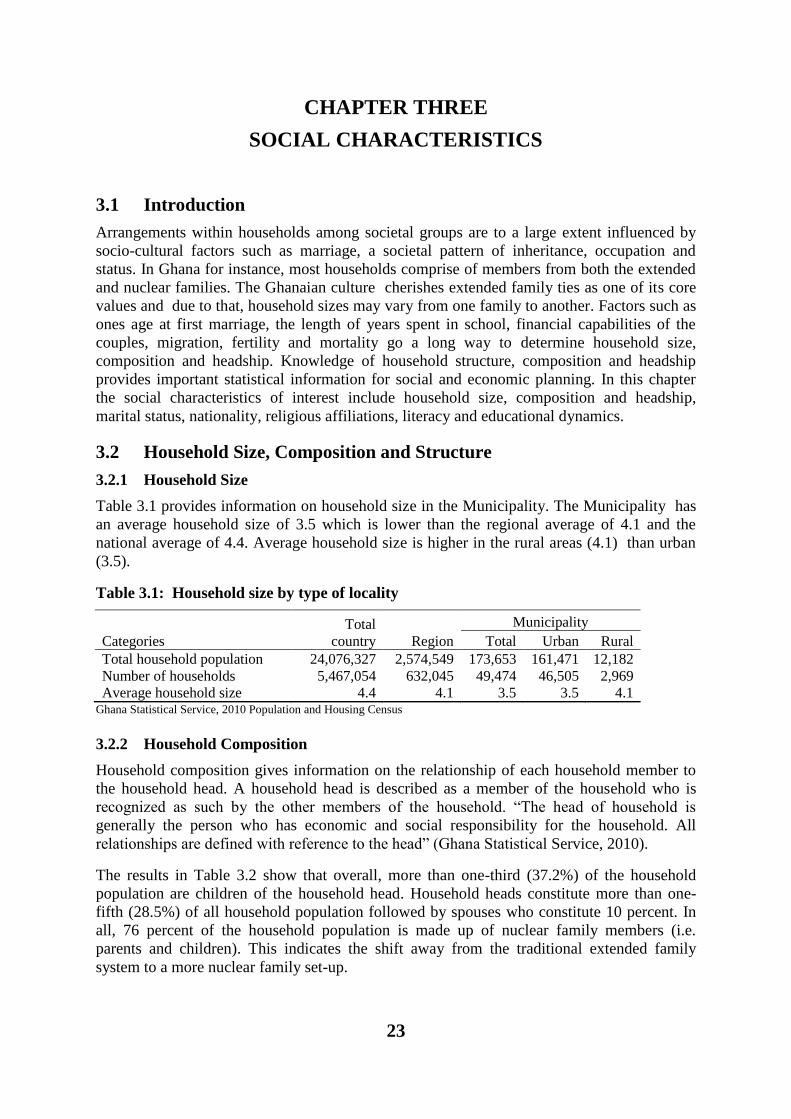
23
CHAPTER THREE
SOCIAL CHARACTERISTICS
3.1 Introduction
Arrangements within households among societal groups are to a large extent influenced by
socio-cultural factors such as marriage, a societal pattern of inheritance, occupation and
status. In Ghana for instance, most households comprise of members from both the extended
and nuclear families. The Ghanaian culture cherishes extended family ties as one of its core
values and due to that, household sizes may vary from one family to another. Factors such as
ones age at first marriage, the length of years spent in school, financial capabilities of the
couples, migration, fertility and mortality go a long way to determine household size,
composition and headship. Knowledge of household structure, composition and headship
provides important statistical information for social and economic planning. In this chapter
the social characteristics of interest include household size, composition and headship,
marital status, nationality, religious affiliations, literacy and educational dynamics.
3.2 Household Size, Composition and Structure
3.2.1 Household Size
Table 3.1 provides information on household size in the Municipality. The Municipality has
an average household size of 3.5 which is lower than the regional average of 4.1 and the
national average of 4.4. Average household size is higher in the rural areas (4.1) than urban
(3.5).
Table 3.1: Household size by type of locality
Total
country Region
Municipality
Categories Total Urban Rural
Total household population 24,076,327 2,574,549 173,653 161,471 12,182
Number of households 5,467,054 632,045 49,474 46,505 2,969
Average household size 4.4 4.1 3.5 3.5 4.1 Ghana Statistical Service, 2010 Population and Housing Census
3.2.2 Household Composition
Household composition gives information on the relationship of each household member to
the household head. A household head is described as a member of the household who is
recognized as such by the other members of the household. “The head of household is
generally the person who has economic and social responsibility for the household. All
relationships are defined with reference to the head” (Ghana Statistical Service, 2010).
The results in Table 3.2 show that overall, more than one-third (37.2%) of the household
population are children of the household head. Household heads constitute more than one-
fifth (28.5%) of all household population followed by spouses who constitute 10 percent. In
all, 76 percent of the household population is made up of nuclear family members (i.e.
parents and children). This indicates the shift away from the traditional extended family
system to a more nuclear family set-up.
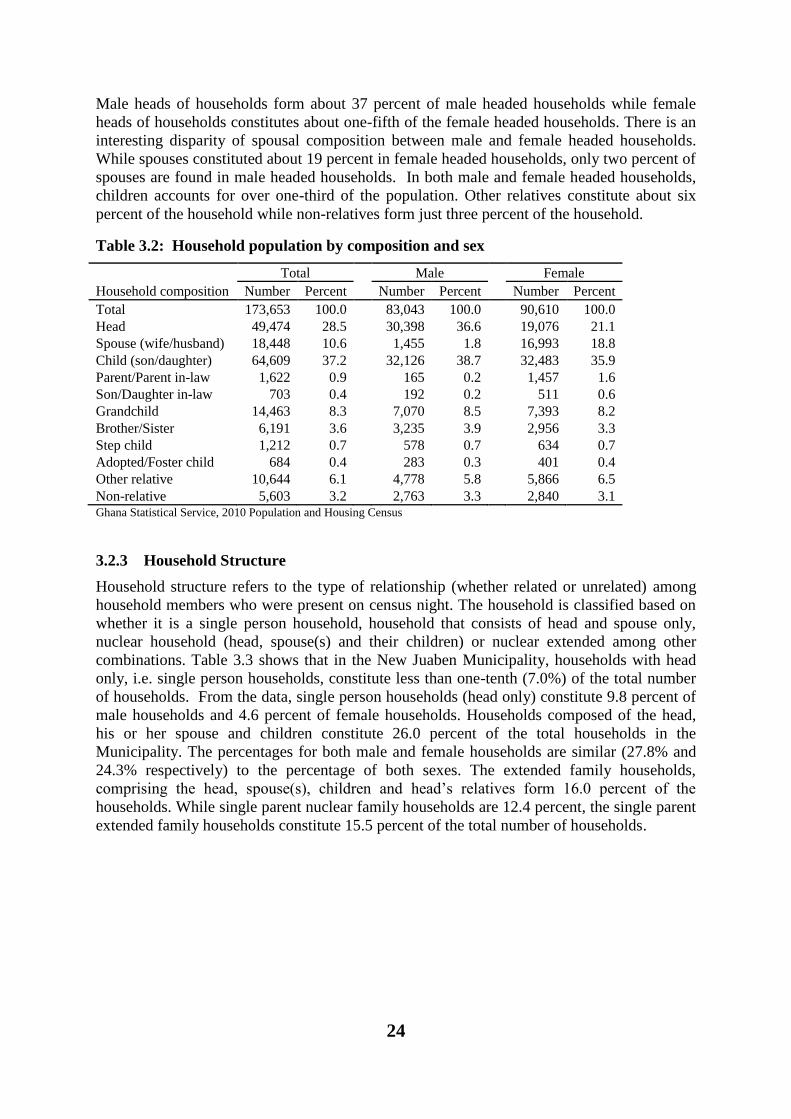
24
Male heads of households form about 37 percent of male headed households while female
heads of households constitutes about one-fifth of the female headed households. There is an
interesting disparity of spousal composition between male and female headed households.
While spouses constituted about 19 percent in female headed households, only two percent of
spouses are found in male headed households. In both male and female headed households,
children accounts for over one-third of the population. Other relatives constitute about six
percent of the household while non-relatives form just three percent of the household.
Table 3.2: Household population by composition and sex
Household composition
Total Male Female
Number Percent Number Percent Number Percent
Total 173,653 100.0
83,043 100.0
90,610 100.0
Head 49,474 28.5
30,398 36.6
19,076 21.1
Spouse (wife/husband) 18,448 10.6
1,455 1.8
16,993 18.8
Child (son/daughter) 64,609 37.2
32,126 38.7
32,483 35.9
Parent/Parent in-law 1,622 0.9
165 0.2
1,457 1.6
Son/Daughter in-law 703 0.4
192 0.2
511 0.6
Grandchild 14,463 8.3
7,070 8.5
7,393 8.2
Brother/Sister 6,191 3.6
3,235 3.9
2,956 3.3
Step child 1,212 0.7
578 0.7
634 0.7
Adopted/Foster child 684 0.4
283 0.3
401 0.4
Other relative 10,644 6.1
4,778 5.8
5,866 6.5
Non-relative 5,603 3.2 2,763 3.3 2,840 3.1 Ghana Statistical Service, 2010 Population and Housing Census
3.2.3 Household Structure
Household structure refers to the type of relationship (whether related or unrelated) among
household members who were present on census night. The household is classified based on
whether it is a single person household, household that consists of head and spouse only,
nuclear household (head, spouse(s) and their children) or nuclear extended among other
combinations. Table 3.3 shows that in the New Juaben Municipality, households with head
only, i.e. single person households, constitute less than one-tenth (7.0%) of the total number
of households. From the data, single person households (head only) constitute 9.8 percent of
male households and 4.6 percent of female households. Households composed of the head,
his or her spouse and children constitute 26.0 percent of the total households in the
Municipality. The percentages for both male and female households are similar (27.8% and
24.3% respectively) to the percentage of both sexes. The extended family households,
comprising the head, spouse(s), children and head’s relatives form 16.0 percent of the
households. While single parent nuclear family households are 12.4 percent, the single parent
extended family households constitute 15.5 percent of the total number of households.
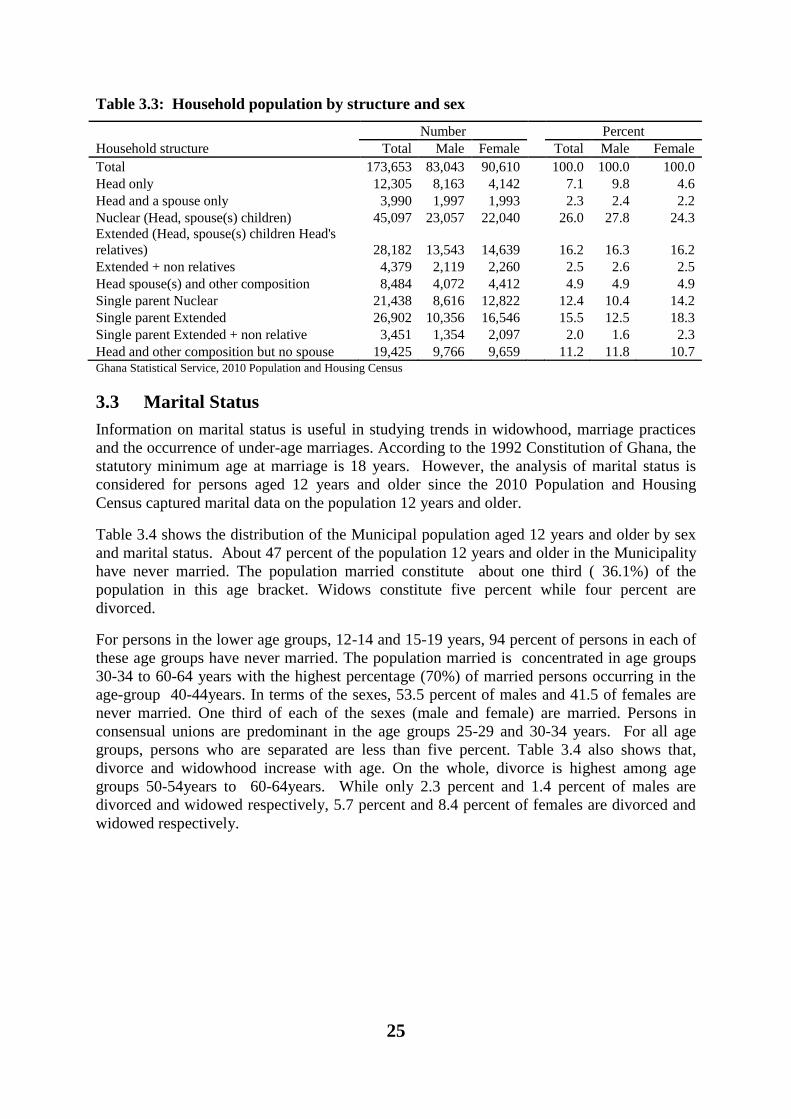
25
Table 3.3: Household population by structure and sex
Household structure
Number Percent
Total Male Female Total Male Female
Total 173,653 83,043 90,610
100.0 100.0 100.0
Head only 12,305 8,163 4,142
7.1 9.8 4.6
Head and a spouse only 3,990 1,997 1,993
2.3 2.4 2.2
Nuclear (Head, spouse(s) children) 45,097 23,057 22,040
26.0 27.8 24.3
Extended (Head, spouse(s) children Head's
relatives) 28,182 13,543 14,639
16.2 16.3 16.2
Extended + non relatives 4,379 2,119 2,260
2.5 2.6 2.5
Head spouse(s) and other composition 8,484 4,072 4,412
4.9 4.9 4.9
Single parent Nuclear 21,438 8,616 12,822
12.4 10.4 14.2
Single parent Extended 26,902 10,356 16,546
15.5 12.5 18.3
Single parent Extended + non relative 3,451 1,354 2,097
2.0 1.6 2.3
Head and other composition but no spouse 19,425 9,766 9,659 11.2 11.8 10.7 Ghana Statistical Service, 2010 Population and Housing Census
3.3 Marital Status
Information on marital status is useful in studying trends in widowhood, marriage practices
and the occurrence of under-age marriages. According to the 1992 Constitution of Ghana, the
statutory minimum age at marriage is 18 years. However, the analysis of marital status is
considered for persons aged 12 years and older since the 2010 Population and Housing
Census captured marital data on the population 12 years and older.
Table 3.4 shows the distribution of the Municipal population aged 12 years and older by sex
and marital status. About 47 percent of the population 12 years and older in the Municipality
have never married. The population married constitute about one third ( 36.1%) of the
population in this age bracket. Widows constitute five percent while four percent are
divorced.
For persons in the lower age groups, 12-14 and 15-19 years, 94 percent of persons in each of
these age groups have never married. The population married is concentrated in age groups
30-34 to 60-64 years with the highest percentage (70%) of married persons occurring in the
age-group 40-44years. In terms of the sexes, 53.5 percent of males and 41.5 of females are
never married. One third of each of the sexes (male and female) are married. Persons in
consensual unions are predominant in the age groups 25-29 and 30-34 years. For all age
groups, persons who are separated are less than five percent. Table 3.4 also shows that,
divorce and widowhood increase with age. On the whole, divorce is highest among age
groups 50-54years to 60-64years. While only 2.3 percent and 1.4 percent of males are
divorced and widowed respectively, 5.7 percent and 8.4 percent of females are divorced and
widowed respectively.
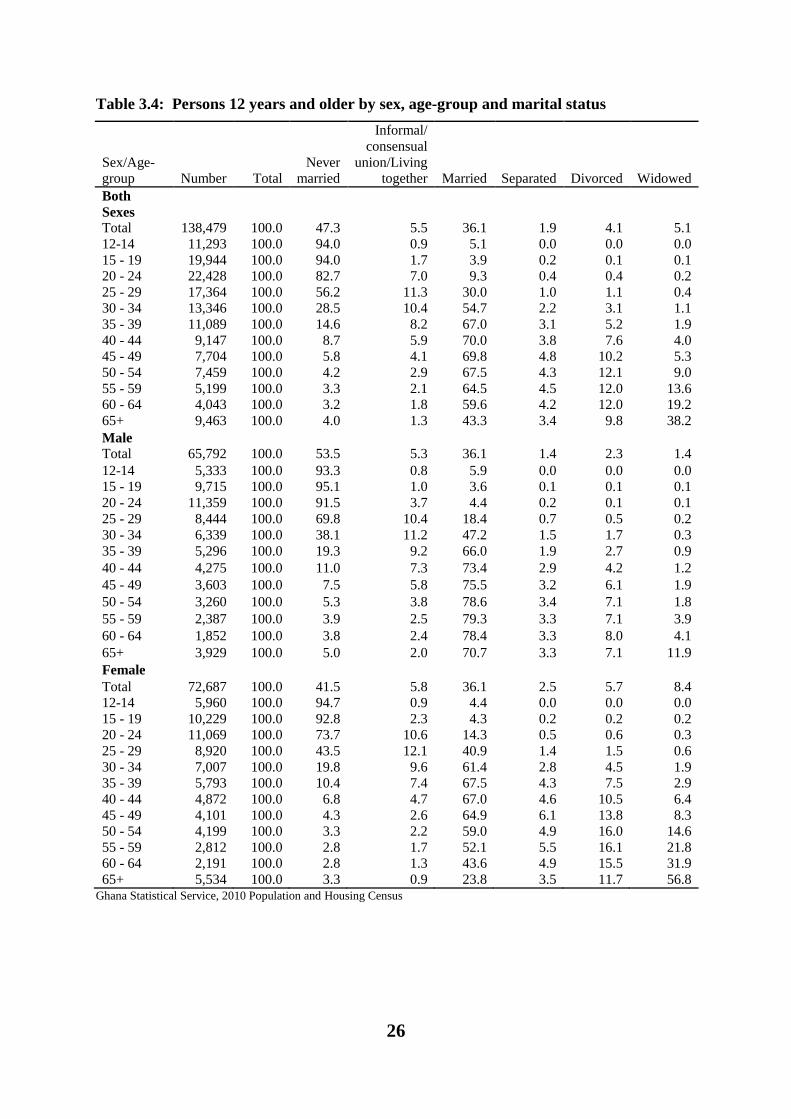
26
Table 3.4: Persons 12 years and older by sex, age-group and marital status
Sex/Age-
group Number Total
Never
married
Informal/
consensual
union/Living
together Married Separated Divorced Widowed
Both
Sexes
Total 138,479 100.0 47.3 5.5 36.1 1.9 4.1 5.1
12-14 11,293 100.0 94.0 0.9 5.1 0.0 0.0 0.0
15 - 19 19,944 100.0 94.0 1.7 3.9 0.2 0.1 0.1
20 - 24 22,428 100.0 82.7 7.0 9.3 0.4 0.4 0.2
25 - 29 17,364 100.0 56.2 11.3 30.0 1.0 1.1 0.4
30 - 34 13,346 100.0 28.5 10.4 54.7 2.2 3.1 1.1
35 - 39 11,089 100.0 14.6 8.2 67.0 3.1 5.2 1.9
40 - 44 9,147 100.0 8.7 5.9 70.0 3.8 7.6 4.0
45 - 49 7,704 100.0 5.8 4.1 69.8 4.8 10.2 5.3
50 - 54 7,459 100.0 4.2 2.9 67.5 4.3 12.1 9.0
55 - 59 5,199 100.0 3.3 2.1 64.5 4.5 12.0 13.6
60 - 64 4,043 100.0 3.2 1.8 59.6 4.2 12.0 19.2
65+ 9,463 100.0 4.0 1.3 43.3 3.4 9.8 38.2
Male
Total 65,792 100.0 53.5 5.3 36.1 1.4 2.3 1.4
12-14 5,333 100.0 93.3 0.8 5.9 0.0 0.0 0.0
15 - 19 9,715 100.0 95.1 1.0 3.6 0.1 0.1 0.1
20 - 24 11,359 100.0 91.5 3.7 4.4 0.2 0.1 0.1
25 - 29 8,444 100.0 69.8 10.4 18.4 0.7 0.5 0.2
30 - 34 6,339 100.0 38.1 11.2 47.2 1.5 1.7 0.3
35 - 39 5,296 100.0 19.3 9.2 66.0 1.9 2.7 0.9
40 - 44 4,275 100.0 11.0 7.3 73.4 2.9 4.2 1.2
45 - 49 3,603 100.0 7.5 5.8 75.5 3.2 6.1 1.9
50 - 54 3,260 100.0 5.3 3.8 78.6 3.4 7.1 1.8
55 - 59 2,387 100.0 3.9 2.5 79.3 3.3 7.1 3.9
60 - 64 1,852 100.0 3.8 2.4 78.4 3.3 8.0 4.1
65+ 3,929 100.0 5.0 2.0 70.7 3.3 7.1 11.9
Female
Total 72,687 100.0 41.5 5.8 36.1 2.5 5.7 8.4
12-14 5,960 100.0 94.7 0.9 4.4 0.0 0.0 0.0
15 - 19 10,229 100.0 92.8 2.3 4.3 0.2 0.2 0.2
20 - 24 11,069 100.0 73.7 10.6 14.3 0.5 0.6 0.3
25 - 29 8,920 100.0 43.5 12.1 40.9 1.4 1.5 0.6
30 - 34 7,007 100.0 19.8 9.6 61.4 2.8 4.5 1.9
35 - 39 5,793 100.0 10.4 7.4 67.5 4.3 7.5 2.9
40 - 44 4,872 100.0 6.8 4.7 67.0 4.6 10.5 6.4
45 - 49 4,101 100.0 4.3 2.6 64.9 6.1 13.8 8.3
50 - 54 4,199 100.0 3.3 2.2 59.0 4.9 16.0 14.6
55 - 59 2,812 100.0 2.8 1.7 52.1 5.5 16.1 21.8
60 - 64 2,191 100.0 2.8 1.3 43.6 4.9 15.5 31.9
65+ 5,534 100.0 3.3 0.9 23.8 3.5 11.7 56.8 Ghana Statistical Service, 2010 Population and Housing Census

27
3.3.1 Marital Status and Level of Education
This section looks at the relationship between marital status of persons aged 12 years and
above and education. As shown in Table 3.5, while 42.6 percent of widowed persons have
attained basic level of education, over half of the members of each of the other marital
categories have basic education. Twenty three percent of the never married population have
attained secondary education with only five percent attaining tertiary education. Compared to
all other marital categories, the married category has the highest proportion of its members
(6.4 %) with tertiary education. As high as 44.4 percent of the widowed population of have
no education.
For each of the male marital categories, half of the population have acquired basic education.
For instance, 52.4 percent of the married male population have basic education while just
about a tenth have attained tertiary level education. Males in informal /consensual union
have the highest proportion of those who have attained basic (64.1 %) and secondary (16.0
%) education. Among the married female population, about 68 percent have attained basic
education, but with less than four percent (3.4%) having tertiary education.
Table 3.5: Persons 12 years and older by sex, marital status and level of education
Sex/Marital status Number
All
levels
No
Education Basic1
Secon-
dary2
Voc/
Tech/
Comm
Post middle/
secondary
certificate/
diploma3 Tertiary4
Both Sexes
Total 138,479 100.0 9.1 54.6 16.9 4.2 10.1 5.1
Never married 65,344 100.0 3.1 52.7 23.4 3.1 12.6 5.2
Informal/Consensual
union/Living together 7,662 100.0 7.5 66.5 13.2 3.9 6.7 2.3
Married 50,034 100.0 10.8 55.8 12.4 5.6 8.9 6.4
Separated 2,698 100.0 15.0 62.4 9.1 5.0 6.2 2.3
Divorced 5,695 100.0 17.8 61.8 7.7 5.5 5.3 2.0
Widowed 7,046 100.0 44.4 42.6 3.7 3.3 4.9 1.2
Male Total 65,792 100.0 5.3 52.6 19.0 4.0 11.7 7.4
Never married 35,201 100.0 2.9 50.8 23.2 2.7 13.7 6.6
Informal/Consensual
union/Living together 3,467 100.0 4.5 64.1 16.0 4.0 7.9 3.5
Married 23,754 100.0 7.5 52.4 14.3 5.8 10.2 9.8
Separated 907 100.0 11.0 63.0 11.6 5.2 6.5 2.8
Divorced 1,540 100.0 11.9 63.4 10.6 5.5 4.7 3.8
Widowed 923 100.0 24.3 52.4 8.8 5.0 6.0 3.6
Female Total 72,687 100.0 12.5 56.5 15.1 4.3 8.7 3.0
Never married 30,143 100.0 3.2 54.8 23.6 3.5 11.3 3.6
Informal/Consensual
union/Living together 4,195 100.0 9.9 68.5 10.8 3.7 5.7 1.3
Married 26,280 100.0 13.9 58.9 10.7 5.4 7.9 3.4
Separated 1,791 100.0 17.0 62.1 7.8 5.0 6.0 2.0
Divorced 4,155 100.0 19.9 61.2 6.5 5.5 5.4 1.4
Widowed 6,123 100.0 47.4 41.1 2.9 3.0 4.8 0.8
Ghana Statistical Service, 2010 Population and Housing Census
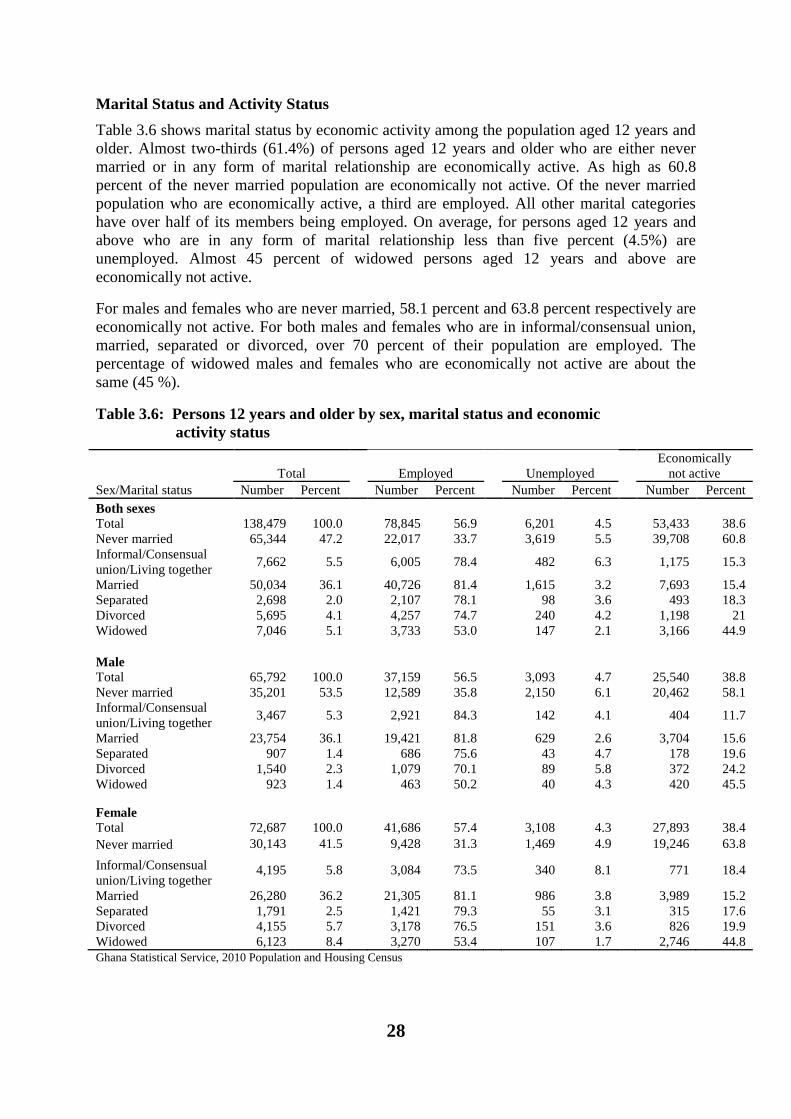
28
Marital Status and Activity Status
Table 3.6 shows marital status by economic activity among the population aged 12 years and
older. Almost two-thirds (61.4%) of persons aged 12 years and older who are either never
married or in any form of marital relationship are economically active. As high as 60.8
percent of the never married population are economically not active. Of the never married
population who are economically active, a third are employed. All other marital categories
have over half of its members being employed. On average, for persons aged 12 years and
above who are in any form of marital relationship less than five percent (4.5%) are
unemployed. Almost 45 percent of widowed persons aged 12 years and above are
economically not active.
For males and females who are never married, 58.1 percent and 63.8 percent respectively are
economically not active. For both males and females who are in informal/consensual union,
married, separated or divorced, over 70 percent of their population are employed. The
percentage of widowed males and females who are economically not active are about the
same (45 %).
Table 3.6: Persons 12 years and older by sex, marital status and economic
activity status
Total Employed Unemployed
Economically
not active
Sex/Marital status Number Percent Number Percent Number Percent Number Percent
Both sexes
Total 138,479 100.0
78,845 56.9
6,201 4.5
53,433 38.6
Never married 65,344 47.2
22,017 33.7
3,619 5.5
39,708 60.8
Informal/Consensual
union/Living together 7,662 5.5
6,005 78.4
482 6.3
1,175 15.3
Married 50,034 36.1
40,726 81.4
1,615 3.2
7,693 15.4
Separated 2,698 2.0
2,107 78.1
98 3.6
493 18.3
Divorced 5,695 4.1
4,257 74.7
240 4.2
1,198 21
Widowed 7,046 5.1
3,733 53.0
147 2.1
3,166 44.9
Male Total 65,792 100.0
37,159 56.5
3,093 4.7
25,540 38.8
Never married 35,201 53.5
12,589 35.8
2,150 6.1
20,462 58.1
Informal/Consensual
union/Living together 3,467 5.3
2,921 84.3
142 4.1
404 11.7
Married 23,754 36.1
19,421 81.8
629 2.6
3,704 15.6
Separated 907 1.4
686 75.6
43 4.7
178 19.6
Divorced 1,540 2.3
1,079 70.1
89 5.8
372 24.2
Widowed 923 1.4
463 50.2
40 4.3
420 45.5
Female Total 72,687 100.0
41,686 57.4
3,108 4.3
27,893 38.4
Never married 30,143 41.5
9,428 31.3
1,469 4.9
19,246 63.8
Informal/Consensual
union/Living together 4,195 5.8
3,084 73.5
340 8.1
771 18.4
Married 26,280 36.2
21,305 81.1
986 3.8
3,989 15.2
Separated 1,791 2.5
1,421 79.3
55 3.1
315 17.6
Divorced 4,155 5.7
3,178 76.5
151 3.6
826 19.9
Widowed 6,123 8.4 3,270 53.4 107 1.7 2,746 44.8
Ghana Statistical Service, 2010 Population and Housing Census
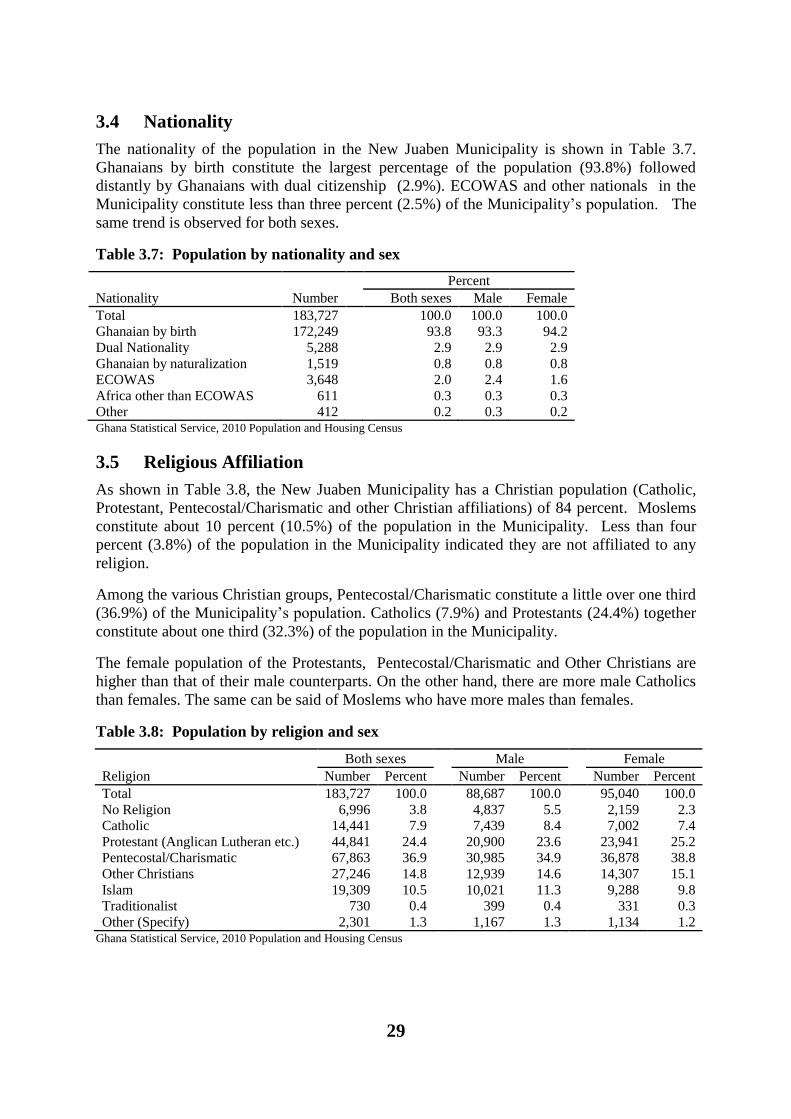
29
3.4 Nationality
The nationality of the population in the New Juaben Municipality is shown in Table 3.7.
Ghanaians by birth constitute the largest percentage of the population (93.8%) followed
distantly by Ghanaians with dual citizenship (2.9%). ECOWAS and other nationals in the
Municipality constitute less than three percent (2.5%) of the Municipality’s population. The
same trend is observed for both sexes.
Table 3.7: Population by nationality and sex
Nationality Number
Percent
Both sexes Male Female
Total 183,727
100.0 100.0 100.0
Ghanaian by birth 172,249
93.8 93.3 94.2
Dual Nationality 5,288
2.9 2.9 2.9
Ghanaian by naturalization 1,519
0.8 0.8 0.8
ECOWAS 3,648
2.0 2.4 1.6
Africa other than ECOWAS 611
0.3 0.3 0.3
Other 412 0.2 0.3 0.2 Ghana Statistical Service, 2010 Population and Housing Census
3.5 Religious Affiliation
As shown in Table 3.8, the New Juaben Municipality has a Christian population (Catholic,
Protestant, Pentecostal/Charismatic and other Christian affiliations) of 84 percent. Moslems
constitute about 10 percent (10.5%) of the population in the Municipality. Less than four
percent (3.8%) of the population in the Municipality indicated they are not affiliated to any
religion.
Among the various Christian groups, Pentecostal/Charismatic constitute a little over one third
(36.9%) of the Municipality’s population. Catholics (7.9%) and Protestants (24.4%) together
constitute about one third (32.3%) of the population in the Municipality.
The female population of the Protestants, Pentecostal/Charismatic and Other Christians are
higher than that of their male counterparts. On the other hand, there are more male Catholics
than females. The same can be said of Moslems who have more males than females.
Table 3.8: Population by religion and sex
Religion
Both sexes Male Female
Number Percent Number Percent Number Percent
Total 183,727 100.0
88,687 100.0
95,040 100.0
No Religion 6,996 3.8
4,837 5.5
2,159 2.3
Catholic 14,441 7.9
7,439 8.4
7,002 7.4
Protestant (Anglican Lutheran etc.) 44,841 24.4
20,900 23.6
23,941 25.2
Pentecostal/Charismatic 67,863 36.9
30,985 34.9
36,878 38.8
Other Christians 27,246 14.8
12,939 14.6
14,307 15.1
Islam 19,309 10.5
10,021 11.3
9,288 9.8
Traditionalist 730 0.4
399 0.4
331 0.3
Other (Specify) 2,301 1.3 1,167 1.3 1,134 1.2 Ghana Statistical Service, 2010 Population and Housing Census
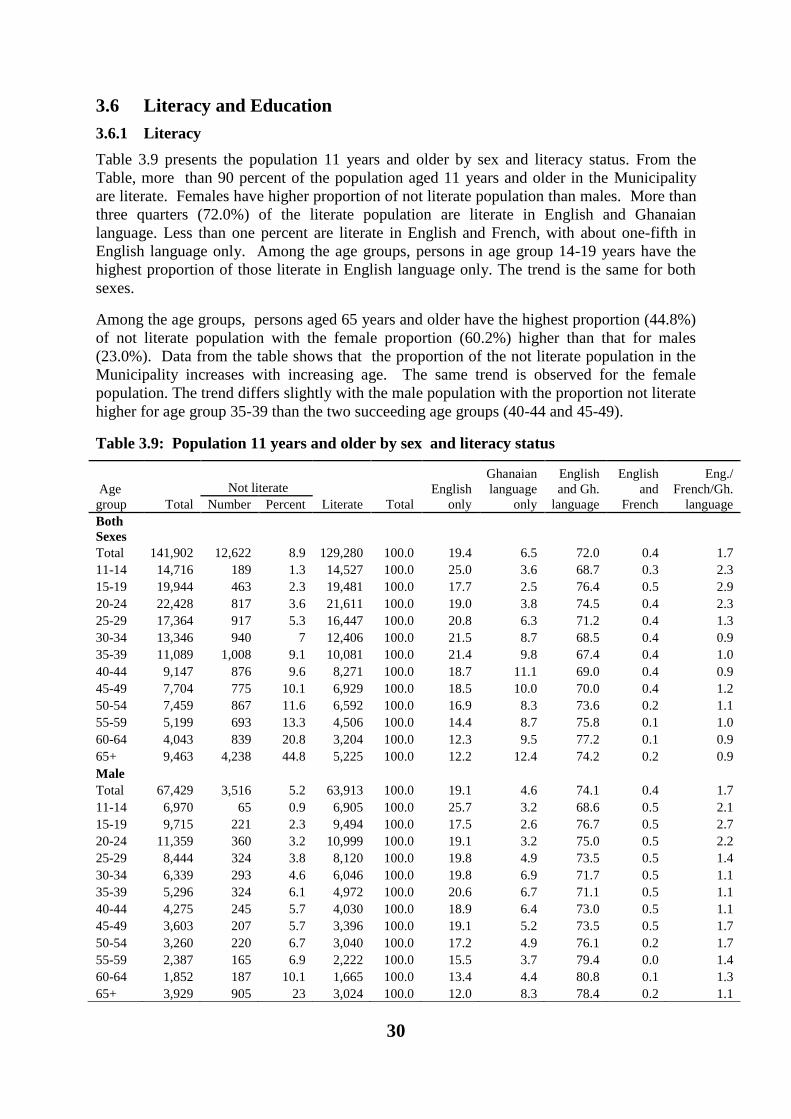
30
3.6 Literacy and Education
3.6.1 Literacy
Table 3.9 presents the population 11 years and older by sex and literacy status. From the
Table, more than 90 percent of the population aged 11 years and older in the Municipality
are literate. Females have higher proportion of not literate population than males. More than
three quarters (72.0%) of the literate population are literate in English and Ghanaian
language. Less than one percent are literate in English and French, with about one-fifth in
English language only. Among the age groups, persons in age group 14-19 years have the
highest proportion of those literate in English language only. The trend is the same for both
sexes.
Among the age groups, persons aged 65 years and older have the highest proportion (44.8%)
of not literate population with the female proportion (60.2%) higher than that for males
(23.0%). Data from the table shows that the proportion of the not literate population in the
Municipality increases with increasing age. The same trend is observed for the female
population. The trend differs slightly with the male population with the proportion not literate
higher for age group 35-39 than the two succeeding age groups (40-44 and 45-49).
Table 3.9: Population 11 years and older by sex and literacy status
Age
group Total
Not literate
Literate Total
English
only
Ghanaian
language
only
English
and Gh.
language
English
and
French
Eng./
French/Gh.
language Number Percent
Both
Sexes
Total 141,902 12,622 8.9 129,280 100.0 19.4 6.5 72.0 0.4 1.7
11-14 14,716 189 1.3 14,527 100.0 25.0 3.6 68.7 0.3 2.3
15-19 19,944 463 2.3 19,481 100.0 17.7 2.5 76.4 0.5 2.9
20-24 22,428 817 3.6 21,611 100.0 19.0 3.8 74.5 0.4 2.3
25-29 17,364 917 5.3 16,447 100.0 20.8 6.3 71.2 0.4 1.3
30-34 13,346 940 7 12,406 100.0 21.5 8.7 68.5 0.4 0.9
35-39 11,089 1,008 9.1 10,081 100.0 21.4 9.8 67.4 0.4 1.0
40-44 9,147 876 9.6 8,271 100.0 18.7 11.1 69.0 0.4 0.9
45-49 7,704 775 10.1 6,929 100.0 18.5 10.0 70.0 0.4 1.2
50-54 7,459 867 11.6 6,592 100.0 16.9 8.3 73.6 0.2 1.1
55-59 5,199 693 13.3 4,506 100.0 14.4 8.7 75.8 0.1 1.0
60-64 4,043 839 20.8 3,204 100.0 12.3 9.5 77.2 0.1 0.9
65+ 9,463 4,238 44.8 5,225 100.0 12.2 12.4 74.2 0.2 0.9
Male
Total 67,429 3,516 5.2 63,913 100.0 19.1 4.6 74.1 0.4 1.7
11-14 6,970 65 0.9 6,905 100.0 25.7 3.2 68.6 0.5 2.1
15-19 9,715 221 2.3 9,494 100.0 17.5 2.6 76.7 0.5 2.7
20-24 11,359 360 3.2 10,999 100.0 19.1 3.2 75.0 0.5 2.2
25-29 8,444 324 3.8 8,120 100.0 19.8 4.9 73.5 0.5 1.4
30-34 6,339 293 4.6 6,046 100.0 19.8 6.9 71.7 0.5 1.1
35-39 5,296 324 6.1 4,972 100.0 20.6 6.7 71.1 0.5 1.1
40-44 4,275 245 5.7 4,030 100.0 18.9 6.4 73.0 0.5 1.1
45-49 3,603 207 5.7 3,396 100.0 19.1 5.2 73.5 0.5 1.7
50-54 3,260 220 6.7 3,040 100.0 17.2 4.9 76.1 0.2 1.7
55-59 2,387 165 6.9 2,222 100.0 15.5 3.7 79.4 0.0 1.4
60-64 1,852 187 10.1 1,665 100.0 13.4 4.4 80.8 0.1 1.3
65+ 3,929 905 23 3,024 100.0 12.0 8.3 78.4 0.2 1.1
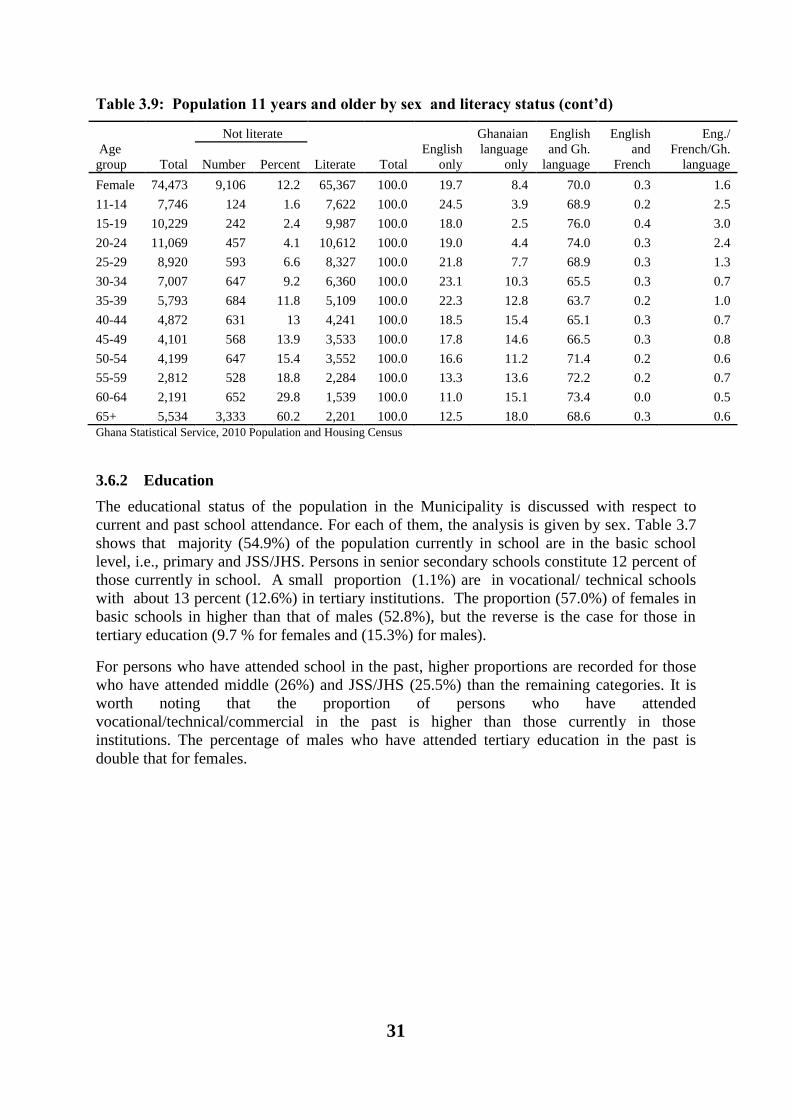
31
Table 3.9: Population 11 years and older by sex and literacy status (cont’d)
Age
group Total
Not literate
Literate Total
English
only
Ghanaian
language
only
English
and Gh.
language
English
and
French
Eng./
French/Gh.
language Number Percent
Female 74,473 9,106 12.2 65,367 100.0 19.7 8.4 70.0 0.3 1.6
11-14 7,746 124 1.6 7,622 100.0 24.5 3.9 68.9 0.2 2.5
15-19 10,229 242 2.4 9,987 100.0 18.0 2.5 76.0 0.4 3.0
20-24 11,069 457 4.1 10,612 100.0 19.0 4.4 74.0 0.3 2.4
25-29 8,920 593 6.6 8,327 100.0 21.8 7.7 68.9 0.3 1.3
30-34 7,007 647 9.2 6,360 100.0 23.1 10.3 65.5 0.3 0.7
35-39 5,793 684 11.8 5,109 100.0 22.3 12.8 63.7 0.2 1.0
40-44 4,872 631 13 4,241 100.0 18.5 15.4 65.1 0.3 0.7
45-49 4,101 568 13.9 3,533 100.0 17.8 14.6 66.5 0.3 0.8
50-54 4,199 647 15.4 3,552 100.0 16.6 11.2 71.4 0.2 0.6
55-59 2,812 528 18.8 2,284 100.0 13.3 13.6 72.2 0.2 0.7
60-64 2,191 652 29.8 1,539 100.0 11.0 15.1 73.4 0.0 0.5
65+ 5,534 3,333 60.2 2,201 100.0 12.5 18.0 68.6 0.3 0.6
Ghana Statistical Service, 2010 Population and Housing Census
3.6.2 Education
The educational status of the population in the Municipality is discussed with respect to
current and past school attendance. For each of them, the analysis is given by sex. Table 3.7
shows that majority (54.9%) of the population currently in school are in the basic school
level, i.e., primary and JSS/JHS. Persons in senior secondary schools constitute 12 percent of
those currently in school. A small proportion (1.1%) are in vocational/ technical schools
with about 13 percent (12.6%) in tertiary institutions. The proportion (57.0%) of females in
basic schools in higher than that of males (52.8%), but the reverse is the case for those in
tertiary education (9.7 % for females and (15.3%) for males).
For persons who have attended school in the past, higher proportions are recorded for those
who have attended middle (26%) and JSS/JHS (25.5%) than the remaining categories. It is
worth noting that the proportion of persons who have attended
vocational/technical/commercial in the past is higher than those currently in those
institutions. The percentage of males who have attended tertiary education in the past is
double that for females.
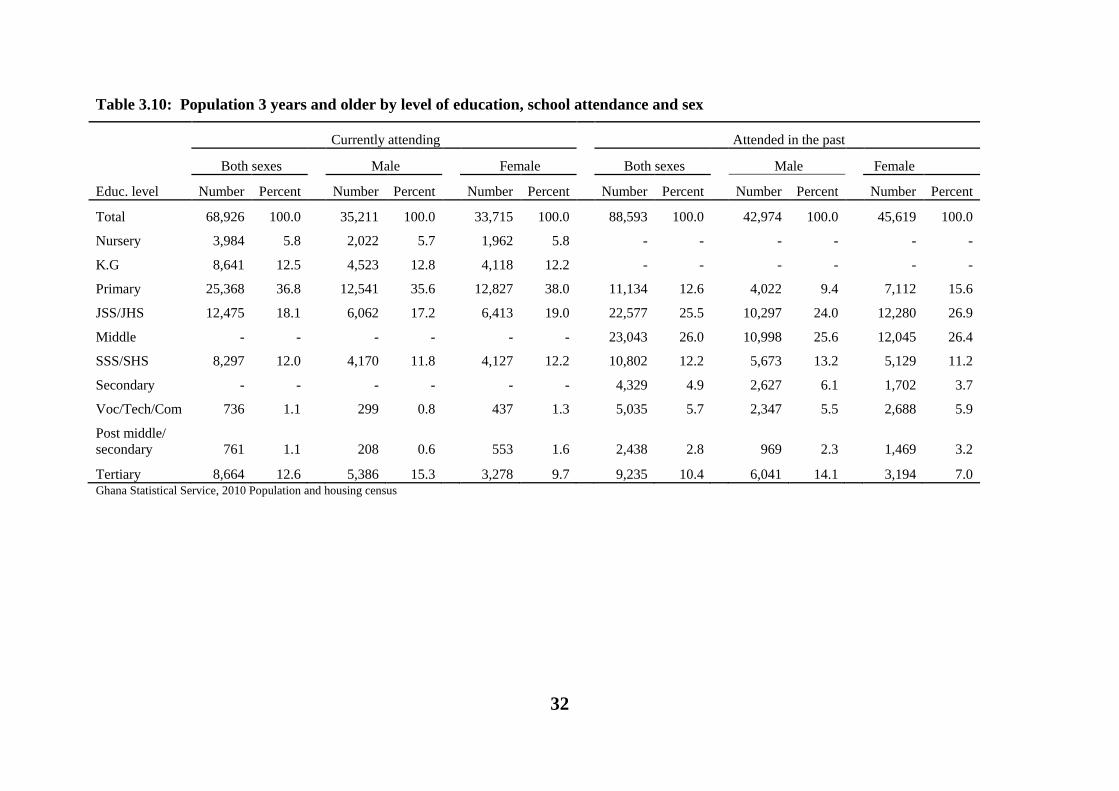
32
Table 3.10: Population 3 years and older by level of education, school attendance and sex
Educ. level
Currently attending Attended in the past
Both sexes Male Female
Both sexes
Male
Female
Number Percent Number Percent Number Percent Number Percent Number Percent Number Percent
Total 68,926 100.0
35,211 100.0
33,715 100.0
88,593 100.0
42,974 100.0
45,619 100.0
Nursery 3,984 5.8
2,022 5.7
1,962 5.8
- -
- -
- -
K.G 8,641 12.5
4,523 12.8
4,118 12.2
- -
- -
- -
Primary 25,368 36.8
12,541 35.6
12,827 38.0
11,134 12.6
4,022 9.4
7,112 15.6
JSS/JHS 12,475 18.1
6,062 17.2
6,413 19.0
22,577 25.5
10,297 24.0
12,280 26.9
Middle - -
- -
- -
23,043 26.0
10,998 25.6
12,045 26.4
SSS/SHS 8,297 12.0
4,170 11.8
4,127 12.2
10,802 12.2
5,673 13.2
5,129 11.2
Secondary - -
- -
- -
4,329 4.9
2,627 6.1
1,702 3.7
Voc/Tech/Com 736 1.1
299 0.8
437 1.3
5,035 5.7
2,347 5.5
2,688 5.9
Post middle/
secondary 761 1.1
208 0.6
553 1.6
2,438 2.8
969 2.3
1,469 3.2
Tertiary 8,664 12.6 5,386 15.3 3,278 9.7 9,235 10.4 6,041 14.1 3,194 7.0 Ghana Statistical Service, 2010 Population and housing census
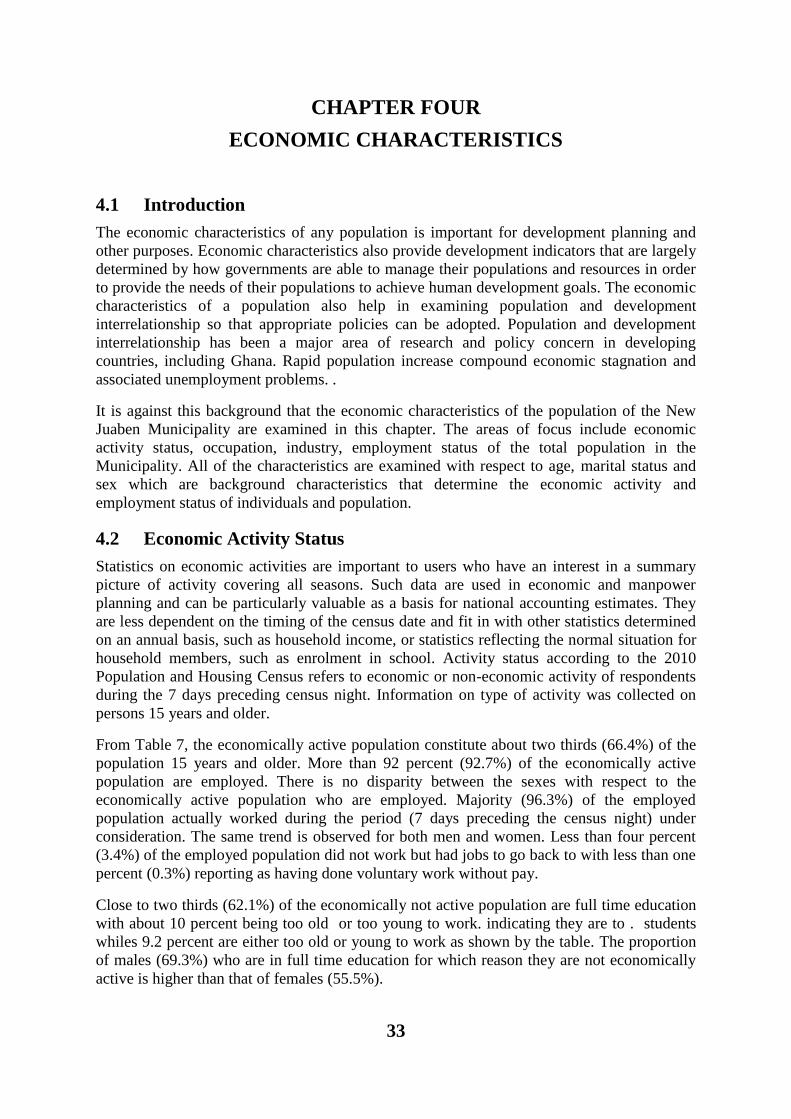
33
CHAPTER FOUR
ECONOMIC CHARACTERISTICS
4.1 Introduction
The economic characteristics of any population is important for development planning and
other purposes. Economic characteristics also provide development indicators that are largely
determined by how governments are able to manage their populations and resources in order
to provide the needs of their populations to achieve human development goals. The economic
characteristics of a population also help in examining population and development
interrelationship so that appropriate policies can be adopted. Population and development
interrelationship has been a major area of research and policy concern in developing
countries, including Ghana. Rapid population increase compound economic stagnation and
associated unemployment problems. .
It is against this background that the economic characteristics of the population of the New
Juaben Municipality are examined in this chapter. The areas of focus include economic
activity status, occupation, industry, employment status of the total population in the
Municipality. All of the characteristics are examined with respect to age, marital status and
sex which are background characteristics that determine the economic activity and
employment status of individuals and population.
4.2 Economic Activity Status
Statistics on economic activities are important to users who have an interest in a summary
picture of activity covering all seasons. Such data are used in economic and manpower
planning and can be particularly valuable as a basis for national accounting estimates. They
are less dependent on the timing of the census date and fit in with other statistics determined
on an annual basis, such as household income, or statistics reflecting the normal situation for
household members, such as enrolment in school. Activity status according to the 2010
Population and Housing Census refers to economic or non-economic activity of respondents
during the 7 days preceding census night. Information on type of activity was collected on
persons 15 years and older.
From Table 7, the economically active population constitute about two thirds (66.4%) of the
population 15 years and older. More than 92 percent (92.7%) of the economically active
population are employed. There is no disparity between the sexes with respect to the
economically active population who are employed. Majority (96.3%) of the employed
population actually worked during the period (7 days preceding the census night) under
consideration. The same trend is observed for both men and women. Less than four percent
(3.4%) of the employed population did not work but had jobs to go back to with less than one
percent (0.3%) reporting as having done voluntary work without pay.
Close to two thirds (62.1%) of the economically not active population are full time education
with about 10 percent being too old or too young to work. indicating they are to . students
whiles 9.2 percent are either too old or young to work as shown by the table. The proportion
of males (69.3%) who are in full time education for which reason they are not economically
active is higher than that of females (55.5%).
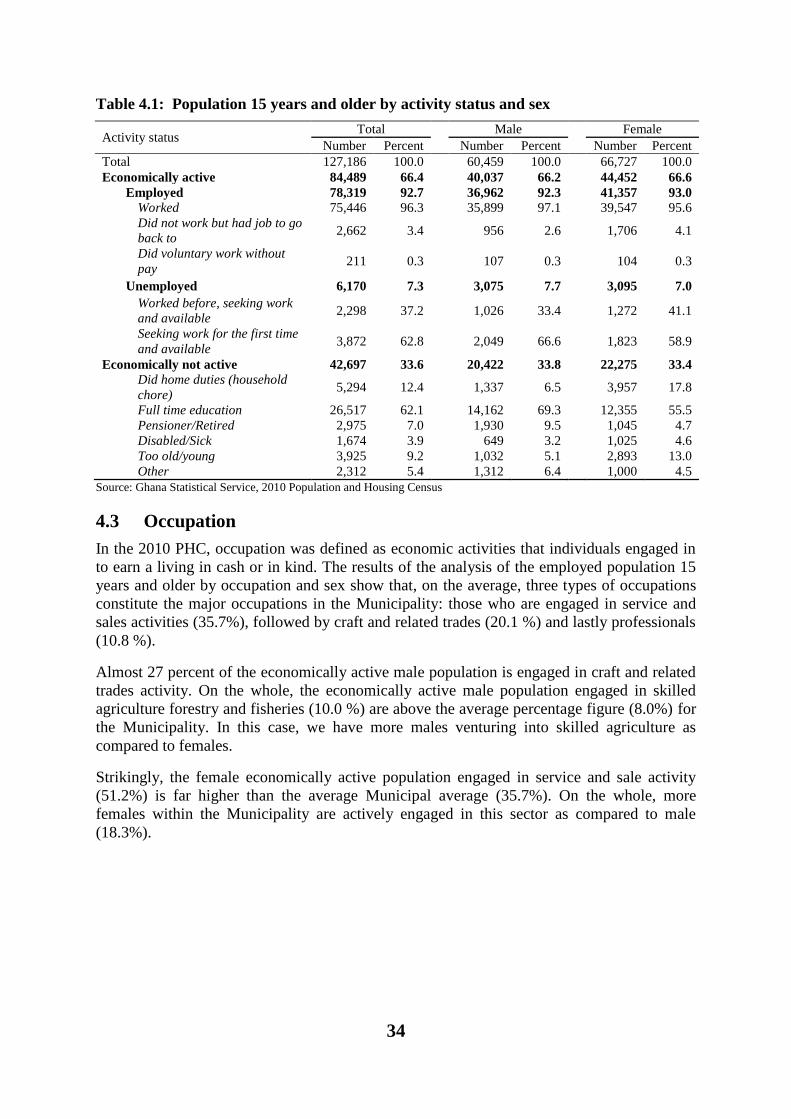
34
Table 4.1: Population 15 years and older by activity status and sex
Activity status Total
Male
Female
Number Percent Number Percent
Number Percent
Total 127,186 100.0
60,459 100.0
66,727 100.0
Economically active 84,489 66.4
40,037 66.2
44,452 66.6
Employed 78,319 92.7
36,962 92.3
41,357 93.0
Worked 75,446 96.3
35,899 97.1
39,547 95.6
Did not work but had job to go
back to 2,662 3.4
956 2.6
1,706 4.1
Did voluntary work without
pay 211 0.3
107 0.3
104 0.3
Unemployed 6,170 7.3
3,075 7.7
3,095 7.0
Worked before, seeking work
and available 2,298 37.2
1,026 33.4
1,272 41.1
Seeking work for the first time
and available 3,872 62.8
2,049 66.6
1,823 58.9
Economically not active 42,697 33.6
20,422 33.8
22,275 33.4
Did home duties (household
chore) 5,294 12.4
1,337 6.5
3,957 17.8
Full time education 26,517 62.1
14,162 69.3
12,355 55.5
Pensioner/Retired 2,975 7.0
1,930 9.5
1,045 4.7
Disabled/Sick 1,674 3.9
649 3.2
1,025 4.6
Too old/young 3,925 9.2
1,032 5.1
2,893 13.0
Other 2,312 5.4 1,312 6.4 1,000 4.5
Source: Ghana Statistical Service, 2010 Population and Housing Census
4.3 Occupation
In the 2010 PHC, occupation was defined as economic activities that individuals engaged in
to earn a living in cash or in kind. The results of the analysis of the employed population 15
years and older by occupation and sex show that, on the average, three types of occupations
constitute the major occupations in the Municipality: those who are engaged in service and
sales activities (35.7%), followed by craft and related trades (20.1 %) and lastly professionals
(10.8 %).
Almost 27 percent of the economically active male population is engaged in craft and related
trades activity. On the whole, the economically active male population engaged in skilled
agriculture forestry and fisheries (10.0 %) are above the average percentage figure (8.0%) for
the Municipality. In this case, we have more males venturing into skilled agriculture as
compared to females.
Strikingly, the female economically active population engaged in service and sale activity
(51.2%) is far higher than the average Municipal average (35.7%). On the whole, more
females within the Municipality are actively engaged in this sector as compared to male
(18.3%).

35
Table 4.2: Employed population 15 years and older by occupation and sex
Occupation Both sexes Male Female
Number Percent
Number Percent Number Percent
Total 78,319 100.0 36,962 100.0
41,357 100.0
Managers 2,802 3.6
1,526 4.1
1,276 3.1
Professionals 8,423 10.8
4,749 12.8
3,674 8.9
Technicians and associate
professionals 2,495 3.2
1,796 4.9
699 1.7
Clerical support workers 2,242 2.9
1,096 3.0
1,146 2.8
Service and sales workers 27,969 35.7
6,777 18.3
21,192 51.2
Skilled agricultural forestry and
fishery workers 6,233 8.0
3,737 10.1
2,496 6.0
Craft and related trades workers 15,775 20.1
9,974 27.0
5,801 14.0
Plant and machine operators and
assemblers 4,709 6.0
4,558 12.3
151 0.4
Elementary occupations 7,584 9.7
2,684 7.3
4,900 11.8
Other occupations 87 0.1 65 0.2 22 0.1 Source: Ghana Statistical Service, 2010 Population and Housing Census
4.4 Industry
Wholesale and retail; repair of motor vehicles and motorcycles constitute the largest industry
employing 31.6 percent of the workforce aged 15 years and above in 2010 in the
Municipality. Other major industries are manufacturing (9.5%) and Agriculture, including
forestry and fishing (8.8%) as recorded in Table 4.3. Forty-three percent of the employed
females are 42.5 percent for wholesale and retail; repair of motor vehicles, including 9.4
percent in manufacturing and 6.5 percent in Agriculture Forestry and fishing. For males, the
proportions were 19.6 percent in wholesale and retail, 9.7 percent in manufacturing and 11.5
percent in agriculture, forestry and fishing. Compared to males, higher proportions of the
female workforce are engaged in the wholesale and retail, repair of motor vehicles and
motorcycles, accommodation and food services sectors and food services.
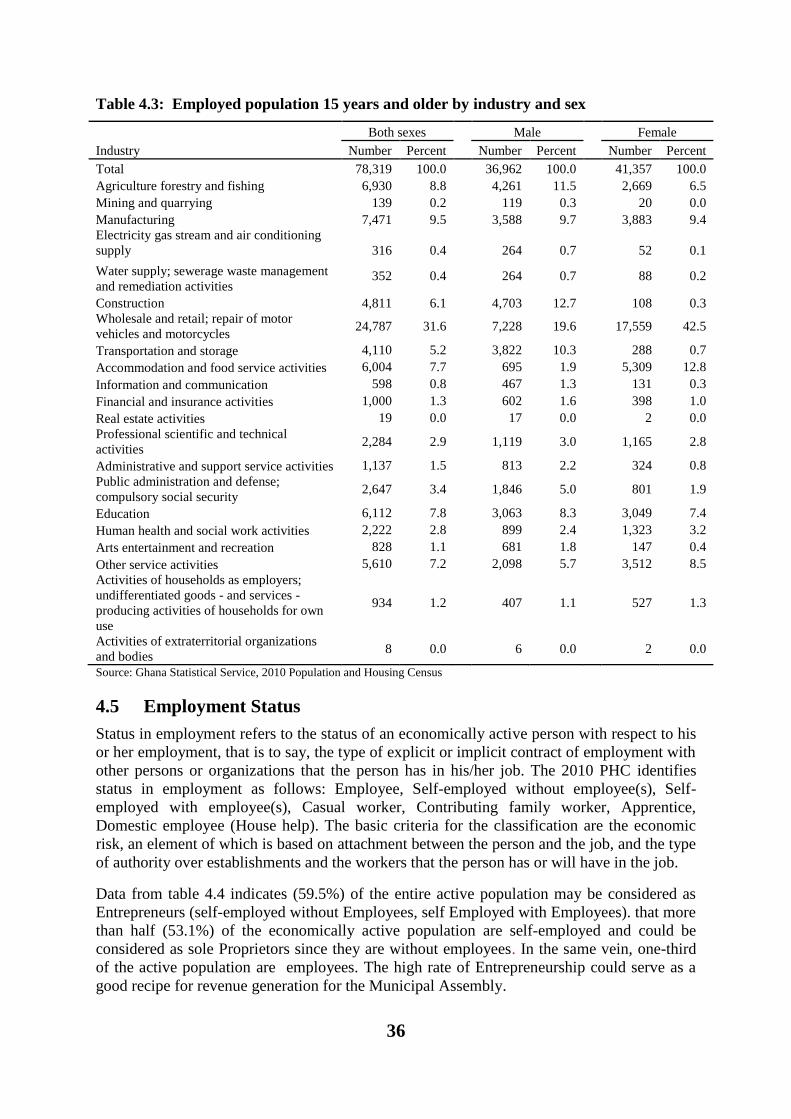
36
Table 4.3: Employed population 15 years and older by industry and sex
Industry
Both sexes Male Female
Number Percent Number Percent Number Percent
Total 78,319 100.0
36,962 100.0
41,357 100.0
Agriculture forestry and fishing 6,930 8.8
4,261 11.5
2,669 6.5
Mining and quarrying 139 0.2
119 0.3
20 0.0
Manufacturing 7,471 9.5
3,588 9.7
3,883 9.4
Electricity gas stream and air conditioning
supply 316 0.4
264 0.7
52 0.1
Water supply; sewerage waste management
and remediation activities 352 0.4
264 0.7
88 0.2
Construction 4,811 6.1
4,703 12.7
108 0.3
Wholesale and retail; repair of motor
vehicles and motorcycles 24,787 31.6
7,228 19.6
17,559 42.5
Transportation and storage 4,110 5.2
3,822 10.3
288 0.7
Accommodation and food service activities 6,004 7.7
695 1.9
5,309 12.8
Information and communication 598 0.8
467 1.3
131 0.3
Financial and insurance activities 1,000 1.3
602 1.6
398 1.0
Real estate activities 19 0.0
17 0.0
2 0.0
Professional scientific and technical
activities 2,284 2.9
1,119 3.0
1,165 2.8
Administrative and support service activities 1,137 1.5
813 2.2
324 0.8
Public administration and defense;
compulsory social security 2,647 3.4
1,846 5.0
801 1.9
Education 6,112 7.8
3,063 8.3
3,049 7.4
Human health and social work activities 2,222 2.8
899 2.4
1,323 3.2
Arts entertainment and recreation 828 1.1
681 1.8
147 0.4
Other service activities 5,610 7.2
2,098 5.7
3,512 8.5
Activities of households as employers;
undifferentiated goods - and services -
producing activities of households for own
use
934 1.2
407 1.1
527 1.3
Activities of extraterritorial organizations
and bodies 8 0.0 6 0.0 2 0.0
Source: Ghana Statistical Service, 2010 Population and Housing Census
4.5 Employment Status
Status in employment refers to the status of an economically active person with respect to his
or her employment, that is to say, the type of explicit or implicit contract of employment with
other persons or organizations that the person has in his/her job. The 2010 PHC identifies
status in employment as follows: Employee, Self-employed without employee(s), Self-
employed with employee(s), Casual worker, Contributing family worker, Apprentice,
Domestic employee (House help). The basic criteria for the classification are the economic
risk, an element of which is based on attachment between the person and the job, and the type
of authority over establishments and the workers that the person has or will have in the job.
Data from table 4.4 indicates (59.5%) of the entire active population may be considered as
Entrepreneurs (self-employed without Employees, self Employed with Employees). that more
than half (53.1%) of the economically active population are self-employed and could be
considered as sole Proprietors since they are without employees. In the same vein, one-third
of the active population are employees. The high rate of Entrepreneurship could serve as a
good recipe for revenue generation for the Municipal Assembly.
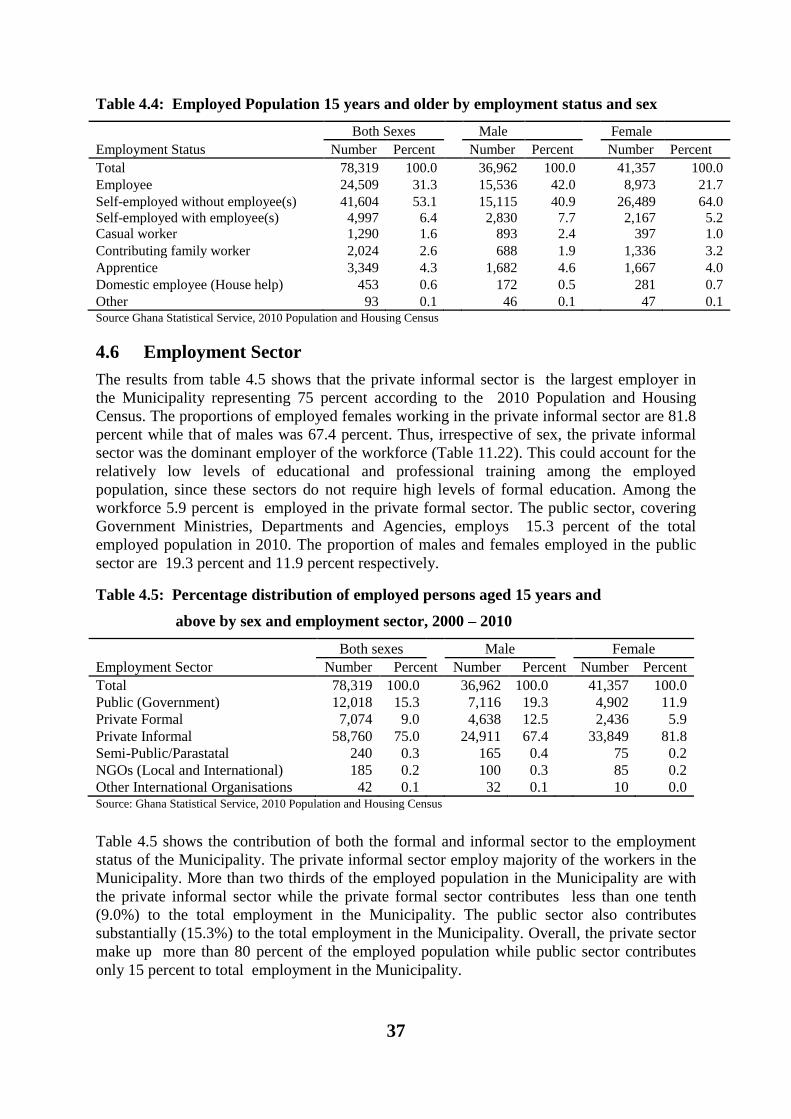
37
Table 4.4: Employed Population 15 years and older by employment status and sex
Employment Status
Both Sexes Male Female
Number Percent Number Percent Number Percent
Total 78,319 100.0
36,962 100.0
41,357 100.0
Employee 24,509 31.3
15,536 42.0
8,973 21.7
Self-employed without employee(s) 41,604 53.1
15,115 40.9
26,489 64.0
Self-employed with employee(s) 4,997 6.4
2,830 7.7
2,167 5.2
Casual worker 1,290 1.6
893 2.4
397 1.0
Contributing family worker 2,024 2.6
688 1.9
1,336 3.2
Apprentice 3,349 4.3
1,682 4.6
1,667 4.0
Domestic employee (House help) 453 0.6
172 0.5
281 0.7
Other 93 0.1 46 0.1 47 0.1 Source Ghana Statistical Service, 2010 Population and Housing Census
4.6 Employment Sector
The results from table 4.5 shows that the private informal sector is the largest employer in
the Municipality representing 75 percent according to the 2010 Population and Housing
Census. The proportions of employed females working in the private informal sector are 81.8
percent while that of males was 67.4 percent. Thus, irrespective of sex, the private informal
sector was the dominant employer of the workforce (Table 11.22). This could account for the
relatively low levels of educational and professional training among the employed
population, since these sectors do not require high levels of formal education. Among the
workforce 5.9 percent is employed in the private formal sector. The public sector, covering
Government Ministries, Departments and Agencies, employs 15.3 percent of the total
employed population in 2010. The proportion of males and females employed in the public
sector are 19.3 percent and 11.9 percent respectively.
Table 4.5: Percentage distribution of employed persons aged 15 years and
above by sex and employment sector, 2000 – 2010
Employment Sector
Both sexes Male Female
Number Percent Number Percent Number Percent
Total 78,319 100.0
36,962 100.0
41,357 100.0
Public (Government) 12,018 15.3
7,116 19.3
4,902 11.9
Private Formal 7,074 9.0
4,638 12.5
2,436 5.9
Private Informal 58,760 75.0
24,911 67.4
33,849 81.8
Semi-Public/Parastatal 240 0.3
165 0.4
75 0.2
NGOs (Local and International) 185 0.2
100 0.3
85 0.2
Other International Organisations 42 0.1 32 0.1 10 0.0 Source: Ghana Statistical Service, 2010 Population and Housing Census
Table 4.5 shows the contribution of both the formal and informal sector to the employment
status of the Municipality. The private informal sector employ majority of the workers in the
Municipality. More than two thirds of the employed population in the Municipality are with
the private informal sector while the private formal sector contributes less than one tenth
(9.0%) to the total employment in the Municipality. The public sector also contributes
substantially (15.3%) to the total employment in the Municipality. Overall, the private sector
make up more than 80 percent of the employed population while public sector contributes
only 15 percent to total employment in the Municipality.
38
CHAPTER FIVE
INFORMATION COMMUNICATION TECHNOLOGY
5.1 Introduction
Nations worldwide have recognized developmental opportunities in the challenges of the
emerging information age characterized by information and communication technologies
(ICT). These technologies are driving national development efforts worldwide and a number
of countries in both the developed and developing world are exploring ways of facilitating
their development process through the development, deployment and the exploitation of ICTs
within their economies and societies.
The Ghana ICT for accelerated development policies (ICT4AD) policy represents the vision
for Ghana in the information age. This policy fully takes into account the aspiration and the
provisions of key socio-economic development framework documents. It also sets up the
road map for the development of Ghana’s Information Society and economy and provides a
basis for facilitating the socio-economic development of the country in the emerging
information, knowledge and technological age to be dominated by information and
knowledge based economies.
The emergence of information age has brought to the fore the important role that information,
knowledge and technology can play in facilitating socio economic development. The
effective use of information and knowledge is becoming the most critical factor for rapid
economic growth and wealth creation, and for improving socio-economic well-being. (www.
ict.gov.gh Ghana ICT for Accelerated Development Policy, 2003)
During the 2010 PHC, ownership and usage of information communication technology
facilities and services are assessed by collecting data on both individuals/persons aged 12
years and older and households. Persons using internet facility refers to those who have
access to internet facility at home, internet café, and mobile phone or by other mobile device.
Internet access is assumed to be not only via computer but also by mobile phone, game
machine and digital televisions.
5.2 Ownership of Mobile Phones and use of Internet
There has been a tremendous growth in mobile phone ownership and use globally. Statistics
from the international communication union tend to suggest that mobile phone subscribers
currently constitute 60% of the world population. The report also suggests that there are now
more mobile phone users in the developing world than developed world. In countries like
Ghana, it is estimated that there are 50 mobile phone subscriptions per 100 inhabitants.
(Richard Boateng published in IFIP 9.4 Newsletter, Vol. 20, no.1, February 2010)
Ghana was amongst the first countries in Africa to achieve connections to the internet. The
rapid growth in this sector is set to continue. The use of internet has become prevalent in
transacting businesses globally across the world these days and has created interest for that
experience in Ghana. Many business ventures are set up solely for the provision of internet
services. Ghana’s internet users represent 14.1 percent of its total population. (Sonny
Yenibey Namouz, 2013). It is against this background that the 2010 PHC included questions
on the population having access to internet facilities and usage.
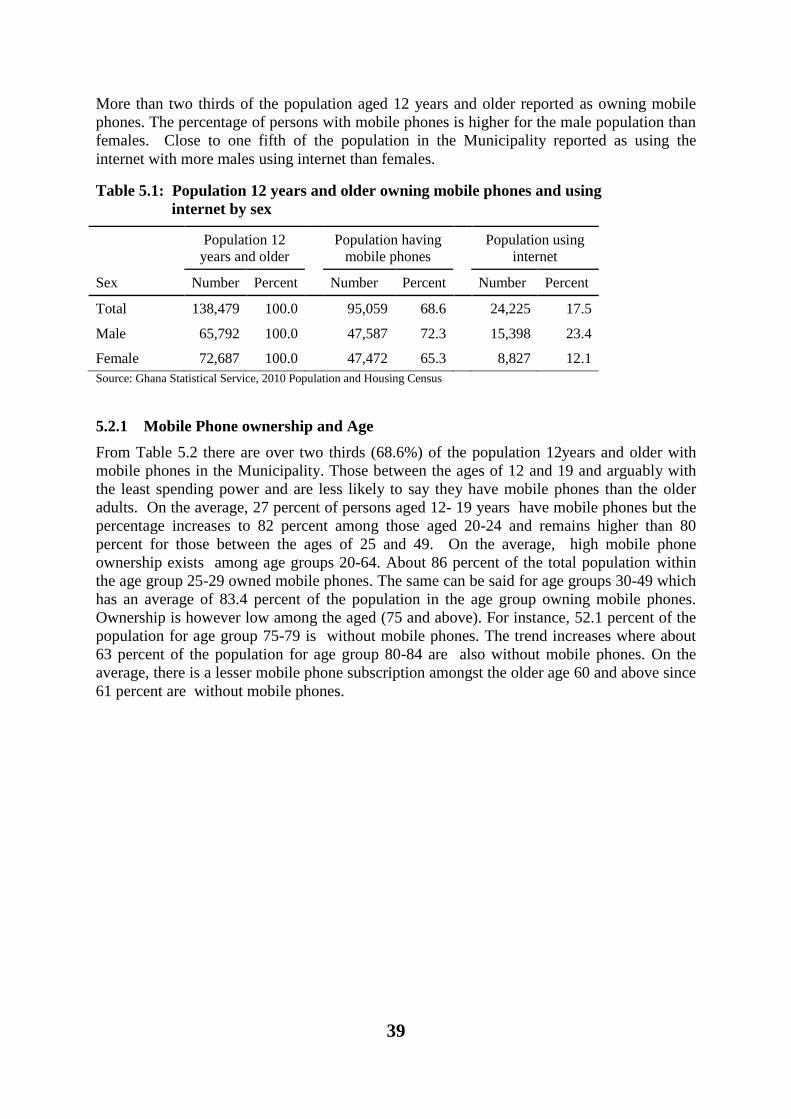
39
More than two thirds of the population aged 12 years and older reported as owning mobile
phones. The percentage of persons with mobile phones is higher for the male population than
females. Close to one fifth of the population in the Municipality reported as using the
internet with more males using internet than females.
Table 5.1: Population 12 years and older owning mobile phones and using
internet by sex
Population 12
years and older
Population having
mobile phones
Population using
internet
Sex Number Percent Number Percent Number Percent
Total 138,479 100.0 95,059 68.6 24,225 17.5
Male 65,792 100.0
47,587 72.3
15,398 23.4
Female 72,687 100.0 47,472 65.3 8,827 12.1
Source: Ghana Statistical Service, 2010 Population and Housing Census
5.2.1 Mobile Phone ownership and Age
From Table 5.2 there are over two thirds (68.6%) of the population 12years and older with
mobile phones in the Municipality. Those between the ages of 12 and 19 and arguably with
the least spending power and are less likely to say they have mobile phones than the older
adults. On the average, 27 percent of persons aged 12- 19 years have mobile phones but the
percentage increases to 82 percent among those aged 20-24 and remains higher than 80
percent for those between the ages of 25 and 49. On the average, high mobile phone
ownership exists among age groups 20-64. About 86 percent of the total population within
the age group 25-29 owned mobile phones. The same can be said for age groups 30-49 which
has an average of 83.4 percent of the population in the age group owning mobile phones.
Ownership is however low among the aged (75 and above). For instance, 52.1 percent of the
population for age group 75-79 is without mobile phones. The trend increases where about
63 percent of the population for age group 80-84 are also without mobile phones. On the
average, there is a lesser mobile phone subscription amongst the older age 60 and above since
61 percent are without mobile phones.
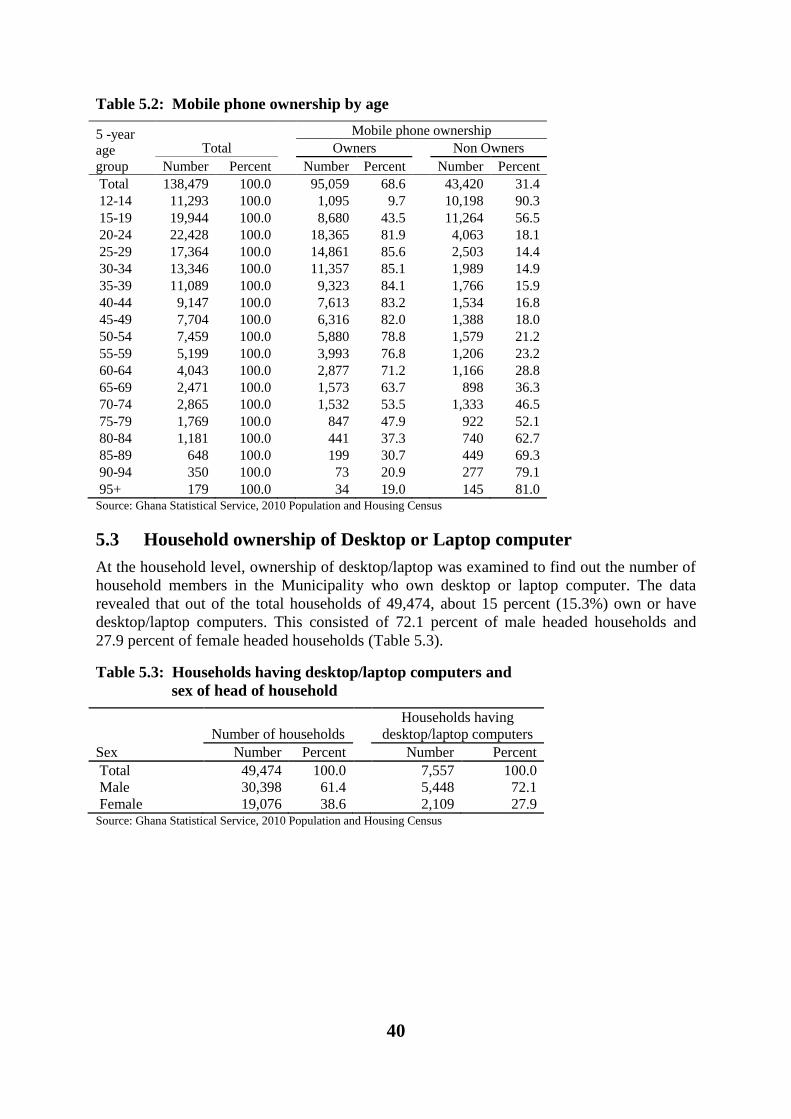
40
Table 5.2: Mobile phone ownership by age
5 -year
age
group
Total
Mobile phone ownership
Owners Non Owners
Number Percent Number Percent Number Percent
Total 138,479 100.0 95,059 68.6 43,420 31.4
12-14 11,293 100.0 1,095 9.7 10,198 90.3
15-19 19,944 100.0 8,680 43.5 11,264 56.5
20-24 22,428 100.0 18,365 81.9 4,063 18.1
25-29 17,364 100.0 14,861 85.6 2,503 14.4
30-34 13,346 100.0 11,357 85.1 1,989 14.9
35-39 11,089 100.0 9,323 84.1 1,766 15.9
40-44 9,147 100.0 7,613 83.2 1,534 16.8
45-49 7,704 100.0 6,316 82.0 1,388 18.0
50-54 7,459 100.0 5,880 78.8 1,579 21.2
55-59 5,199 100.0 3,993 76.8 1,206 23.2
60-64 4,043 100.0 2,877 71.2 1,166 28.8
65-69 2,471 100.0 1,573 63.7 898 36.3
70-74 2,865 100.0 1,532 53.5 1,333 46.5
75-79 1,769 100.0 847 47.9 922 52.1
80-84 1,181 100.0 441 37.3 740 62.7
85-89 648 100.0 199 30.7 449 69.3
90-94 350 100.0 73 20.9 277 79.1
95+ 179 100.0 34 19.0 145 81.0 Source: Ghana Statistical Service, 2010 Population and Housing Census
5.3 Household ownership of Desktop or Laptop computer
At the household level, ownership of desktop/laptop was examined to find out the number of
household members in the Municipality who own desktop or laptop computer. The data
revealed that out of the total households of 49,474, about 15 percent (15.3%) own or have
desktop/laptop computers. This consisted of 72.1 percent of male headed households and
27.9 percent of female headed households (Table 5.3).
Table 5.3: Households having desktop/laptop computers and
sex of head of household
Sex
Number of households Households having
desktop/laptop computers
Number Percent Number Percent
Total 49,474 100.0
7,557 100.0
Male 30,398 61.4
5,448 72.1
Female 19,076 38.6 2,109 27.9 Source: Ghana Statistical Service, 2010 Population and Housing Census
41
CHAPTER SIX
DISABILITY
6.1 Introduction
According to the WHO, there are more than 600 million disabled persons in the world, of
which approximately 80 percent live in low-income countries. In most developing countries,
including Ghana, disabled persons constitute an impoverished marginalized group,
characterized by lack of access to health, education, and other social services that would
ideally support and protect people with disabilities. Economically as well as in social terms,
disabled persons in developing countries are classified among the poorest of the poor.
People with Disabilities (PWDs) in Ghana are often regarded as unproductive and incapable
of contributing in a positive way to society, and rather seen as constituting an economic
burden on the family and the society at large, which leaves them in a vicious cycle of
poverty. In developing countries there are rarely strong disability movements actively
working to improve the living conditions for people living with disabilities. Disabled persons
are often only weakly represented in civil society and Ghana is no exception. This chapter
however seeks to examine the population with disability; the various types of disability, the
extent to which they are involved in economic activities and the levels of education of PWDs
in the New Juaben Municipality.
6.2 Population with Disability
Table 6.1 reveals that about four percent (4.3%) of the population in the New Juaben
Municipality have one type of disability or the other. There are slightly more females
(4.7%) with disability than males (3.9%). There are disparities in the proportion of PWDs
between the urban and rural localities. In the urban areas, 4.3 percent of the population are
disabled whilst the proportion is slightly higher (5.5%) in the rural areas. In the urban areas,
the proportion of females with disabilities is higher (4.7%) than that for males (3.8%). The
reverse is the case for the rural population.
6.2.1 Type of disability
Table 6.1 shows that majority of Persons with Disability (PWDs) are visually impaired
(48.9%) followed by physically challenge (24.2%) and emotional disorders (17.6%). There
are slightly more females with mobility impairment (physical) than males. However, males
are higher than females in the intellectual impairment category. Intellectual disability
(PWID) is the most stigmatized disability among several disabilities in Ghana. More than
other types of disabilities; strong social, religious and cultural stigma are associated with it
(Ghana National Disability Policy Document, 2000). It is recorded that PWID constitute the
fifth (5th) largest category of Persons with Disabilities in the Municipality. Hearing and
emotional impairment are almost the same for both sexes.
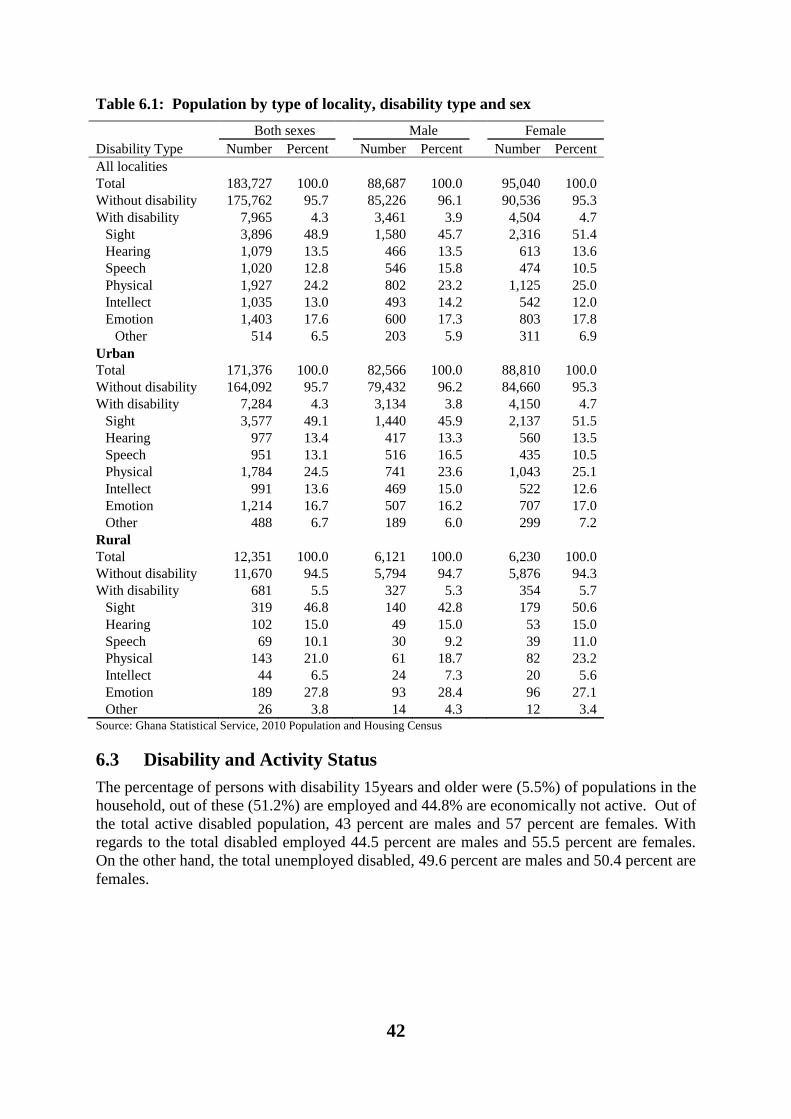
42
Table 6.1: Population by type of locality, disability type and sex
Disability Type
Both sexes Male Female
Number Percent Number Percent Number Percent
All localities
Total 183,727 100.0
88,687 100.0
95,040 100.0
Without disability 175,762 95.7
85,226 96.1
90,536 95.3
With disability 7,965 4.3
3,461 3.9
4,504 4.7
Sight 3,896 48.9
1,580 45.7
2,316 51.4
Hearing 1,079 13.5
466 13.5
613 13.6
Speech 1,020 12.8
546 15.8
474 10.5
Physical 1,927 24.2
802 23.2
1,125 25.0
Intellect 1,035 13.0
493 14.2
542 12.0
Emotion 1,403 17.6
600 17.3
803 17.8
Other 514 6.5
203 5.9
311 6.9
Urban
Total 171,376 100.0
82,566 100.0
88,810 100.0
Without disability 164,092 95.7
79,432 96.2
84,660 95.3
With disability 7,284 4.3
3,134 3.8
4,150 4.7
Sight 3,577 49.1
1,440 45.9
2,137 51.5
Hearing 977 13.4
417 13.3
560 13.5
Speech 951 13.1
516 16.5
435 10.5
Physical 1,784 24.5
741 23.6
1,043 25.1
Intellect 991 13.6
469 15.0
522 12.6
Emotion 1,214 16.7
507 16.2
707 17.0
Other 488 6.7
189 6.0
299 7.2
Rural
Total 12,351 100.0
6,121 100.0
6,230 100.0
Without disability 11,670 94.5
5,794 94.7
5,876 94.3
With disability 681 5.5
327 5.3
354 5.7
Sight 319 46.8
140 42.8
179 50.6
Hearing 102 15.0
49 15.0
53 15.0
Speech 69 10.1
30 9.2
39 11.0
Physical 143 21.0
61 18.7
82 23.2
Intellect 44 6.5
24 7.3
20 5.6
Emotion 189 27.8
93 28.4
96 27.1
Other 26 3.8 14 4.3 12 3.4 Source: Ghana Statistical Service, 2010 Population and Housing Census
6.3 Disability and Activity Status
The percentage of persons with disability 15years and older were (5.5%) of populations in the
household, out of these (51.2%) are employed and 44.8% are economically not active. Out of
the total active disabled population, 43 percent are males and 57 percent are females. With
regards to the total disabled employed 44.5 percent are males and 55.5 percent are females.
On the other hand, the total unemployed disabled, 49.6 percent are males and 50.4 percent are
females.
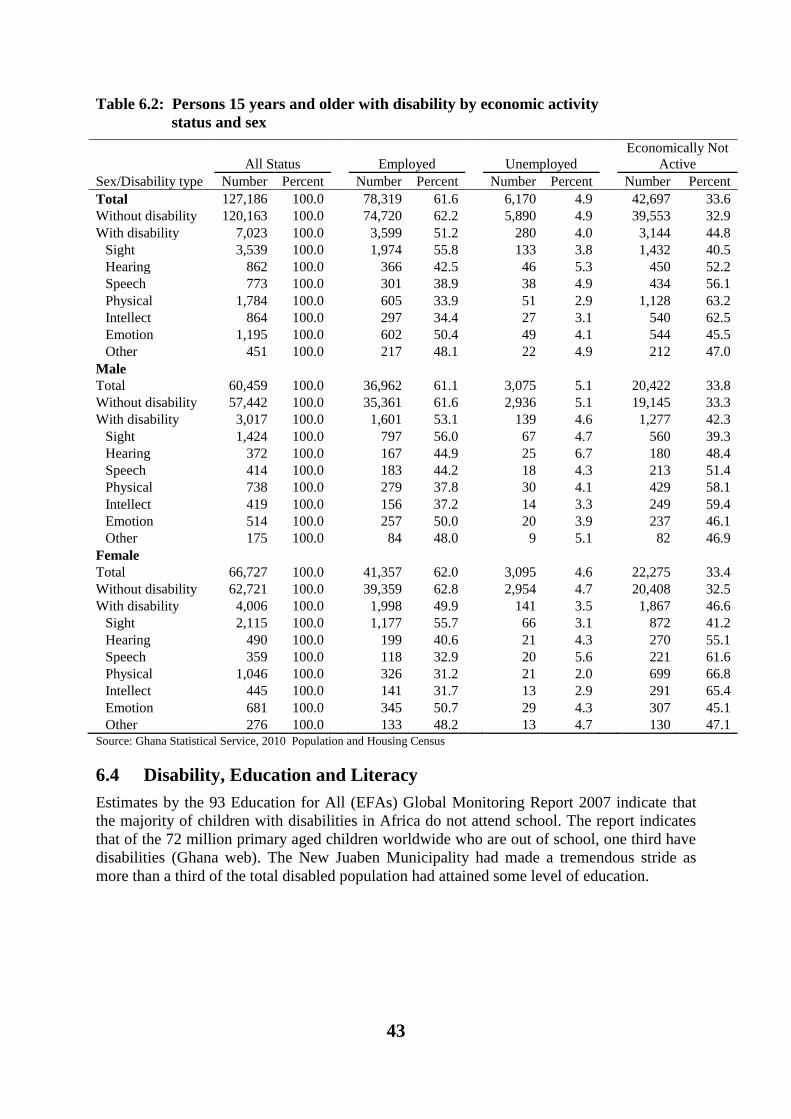
43
Table 6.2: Persons 15 years and older with disability by economic activity
status and sex
Sex/Disability type
All Status Employed Unemployed
Economically Not
Active
Number Percent Number Percent Number Percent Number Percent
Total 127,186 100.0
78,319 61.6
6,170 4.9
42,697 33.6
Without disability 120,163 100.0
74,720 62.2
5,890 4.9
39,553 32.9
With disability 7,023 100.0
3,599 51.2
280 4.0
3,144 44.8
Sight 3,539 100.0
1,974 55.8
133 3.8
1,432 40.5
Hearing 862 100.0
366 42.5
46 5.3
450 52.2
Speech 773 100.0
301 38.9
38 4.9
434 56.1
Physical 1,784 100.0
605 33.9
51 2.9
1,128 63.2
Intellect 864 100.0
297 34.4
27 3.1
540 62.5
Emotion 1,195 100.0
602 50.4
49 4.1
544 45.5
Other 451 100.0
217 48.1
22 4.9
212 47.0
Male
Total 60,459 100.0
36,962 61.1
3,075 5.1
20,422 33.8
Without disability 57,442 100.0
35,361 61.6
2,936 5.1
19,145 33.3
With disability 3,017 100.0
1,601 53.1
139 4.6
1,277 42.3
Sight 1,424 100.0
797 56.0
67 4.7
560 39.3
Hearing 372 100.0
167 44.9
25 6.7
180 48.4
Speech 414 100.0
183 44.2
18 4.3
213 51.4
Physical 738 100.0
279 37.8
30 4.1
429 58.1
Intellect 419 100.0
156 37.2
14 3.3
249 59.4
Emotion 514 100.0
257 50.0
20 3.9
237 46.1
Other 175 100.0
84 48.0
9 5.1
82 46.9
Female
Total 66,727 100.0
41,357 62.0
3,095 4.6
22,275 33.4
Without disability 62,721 100.0
39,359 62.8
2,954 4.7
20,408 32.5
With disability 4,006 100.0
1,998 49.9
141 3.5
1,867 46.6
Sight 2,115 100.0
1,177 55.7
66 3.1
872 41.2
Hearing 490 100.0
199 40.6
21 4.3
270 55.1
Speech 359 100.0
118 32.9
20 5.6
221 61.6
Physical 1,046 100.0
326 31.2
21 2.0
699 66.8
Intellect 445 100.0
141 31.7
13 2.9
291 65.4
Emotion 681 100.0
345 50.7
29 4.3
307 45.1
Other 276 100.0 133 48.2 13 4.7 130 47.1 Source: Ghana Statistical Service, 2010 Population and Housing Census
6.4 Disability, Education and Literacy
Estimates by the 93 Education for All (EFAs) Global Monitoring Report 2007 indicate that
the majority of children with disabilities in Africa do not attend school. The report indicates
that of the 72 million primary aged children worldwide who are out of school, one third have
disabilities (Ghana web). The New Juaben Municipality had made a tremendous stride as
more than a third of the total disabled population had attained some level of education.
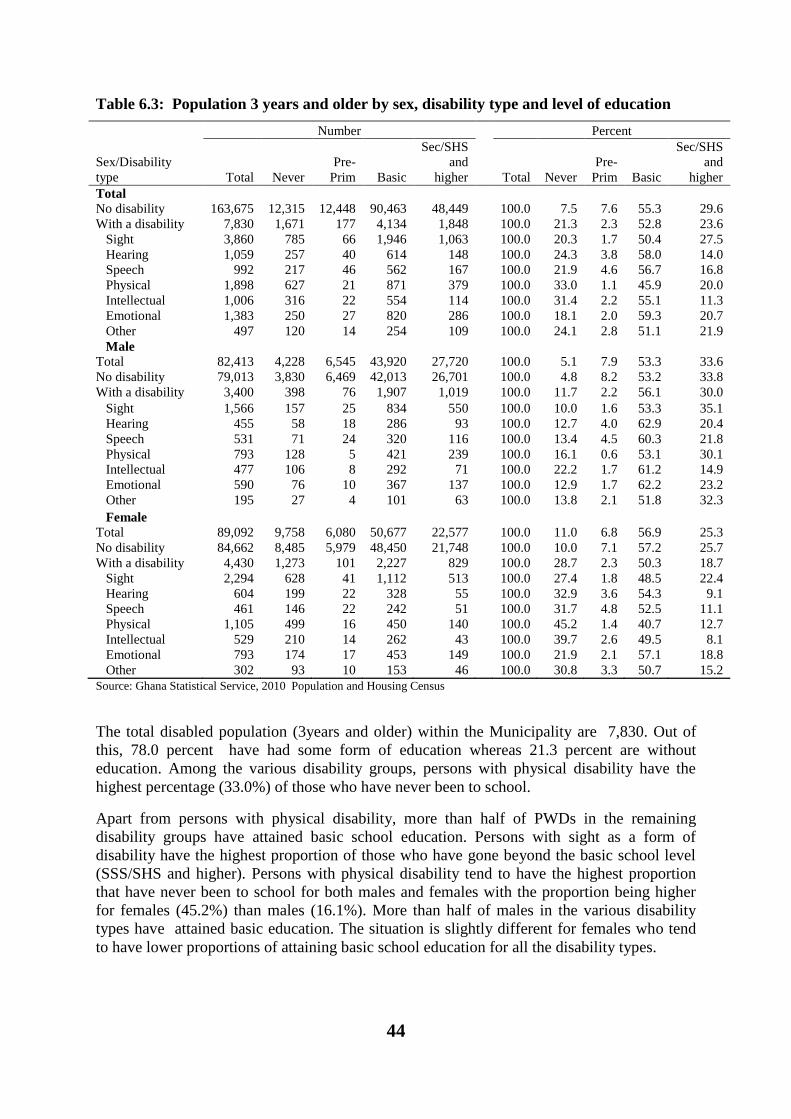
44
Table 6.3: Population 3 years and older by sex, disability type and level of education
Number Percent
Sex/Disability
type Total Never
Pre-
Prim Basic
Sec/SHS
and
higher Total Never
Pre-
Prim Basic
Sec/SHS
and
higher
Total
No disability 163,675 12,315 12,448 90,463 48,449
100.0 7.5 7.6 55.3 29.6
With a disability 7,830 1,671 177 4,134 1,848
100.0 21.3 2.3 52.8 23.6
Sight 3,860 785 66 1,946 1,063
100.0 20.3 1.7 50.4 27.5
Hearing 1,059 257 40 614 148
100.0 24.3 3.8 58.0 14.0
Speech 992 217 46 562 167
100.0 21.9 4.6 56.7 16.8
Physical 1,898 627 21 871 379
100.0 33.0 1.1 45.9 20.0
Intellectual 1,006 316 22 554 114
100.0 31.4 2.2 55.1 11.3
Emotional 1,383 250 27 820 286
100.0 18.1 2.0 59.3 20.7
Other 497 120 14 254 109
100.0 24.1 2.8 51.1 21.9
Male
Total 82,413 4,228 6,545 43,920 27,720
100.0 5.1 7.9 53.3 33.6
No disability 79,013 3,830 6,469 42,013 26,701
100.0 4.8 8.2 53.2 33.8
With a disability 3,400 398 76 1,907 1,019
100.0 11.7 2.2 56.1 30.0
Sight 1,566 157 25 834 550
100.0 10.0 1.6 53.3 35.1
Hearing 455 58 18 286 93
100.0 12.7 4.0 62.9 20.4
Speech 531 71 24 320 116
100.0 13.4 4.5 60.3 21.8
Physical 793 128 5 421 239
100.0 16.1 0.6 53.1 30.1
Intellectual 477 106 8 292 71
100.0 22.2 1.7 61.2 14.9
Emotional 590 76 10 367 137
100.0 12.9 1.7 62.2 23.2
Other 195 27 4 101 63
100.0 13.8 2.1 51.8 32.3
Female
Total 89,092 9,758 6,080 50,677 22,577
100.0 11.0 6.8 56.9 25.3
No disability 84,662 8,485 5,979 48,450 21,748
100.0 10.0 7.1 57.2 25.7
With a disability 4,430 1,273 101 2,227 829
100.0 28.7 2.3 50.3 18.7
Sight 2,294 628 41 1,112 513
100.0 27.4 1.8 48.5 22.4
Hearing 604 199 22 328 55
100.0 32.9 3.6 54.3 9.1
Speech 461 146 22 242 51
100.0 31.7 4.8 52.5 11.1
Physical 1,105 499 16 450 140
100.0 45.2 1.4 40.7 12.7
Intellectual 529 210 14 262 43
100.0 39.7 2.6 49.5 8.1
Emotional 793 174 17 453 149
100.0 21.9 2.1 57.1 18.8
Other 302 93 10 153 46 100.0 30.8 3.3 50.7 15.2
Source: Ghana Statistical Service, 2010 Population and Housing Census
The total disabled population (3years and older) within the Municipality are 7,830. Out of
this, 78.0 percent have had some form of education whereas 21.3 percent are without
education. Among the various disability groups, persons with physical disability have the
highest percentage (33.0%) of those who have never been to school.
Apart from persons with physical disability, more than half of PWDs in the remaining
disability groups have attained basic school education. Persons with sight as a form of
disability have the highest proportion of those who have gone beyond the basic school level
(SSS/SHS and higher). Persons with physical disability tend to have the highest proportion
that have never been to school for both males and females with the proportion being higher
for females (45.2%) than males (16.1%). More than half of males in the various disability
types have attained basic education. The situation is slightly different for females who tend
to have lower proportions of attaining basic school education for all the disability types.
45
CHAPTER SEVEN
AGRICULTURAL ACTIVITIES
7.1 Introduction
Ghana’s economy remains largely an agrarian one in spite of the recent discovery and
production of oil, and the fact that the services sector of the economy is fast dislodging
agriculture as the single largest contributor to the country’s annual Gross Domestic Product
(GDP). It is an undeniable fact that the Agriculture sector in Ghana’s economy employs over
60 percent of the working population and thus contributes significantly to the overall
economic output of the country. Agriculture is a dominant economic activity for the rural
household, particularly crop production.
Agricultural growth has played a key role in the country’s poverty reduction efforts, and this
has helped put the country on the path to becoming one of the few African countries that will
achieve the Millennium Development Goal 1 (MDG1) of halving poverty or reducing the
population with extreme hunger earlier than the targeted year of 2015. Studies based on the
last three runs of national representative household surveys show that, agricultural crop
production is the most important activity for majority of the rural households both as income-
generating activity and as a source of income.
Agriculture in New Juaben Municipality consists of a variety of agricultural products and is
an established economic sector and provides employment on a formal and informal basis. The
Municipality produces a variety of crops including yam, grains, cocoa, oil palm, kola nut, and
timber.
7.2 Households in Agriculture
Table 7.1 shows the distribution of households by agriculture and type of locality urban-rural
residence. Agricultural households constituted about one fifth (19.7%) of households in the
Municipality, with majority of the households engaged in crop farming (87.6 %) and
livestock rearing (26.9 %). From the data, rural dwellers tend to be more involved in
agriculture than their urban counterparts. While more than half (53.2%) of rural households
are involved in agriculture, less than 18 percent of urban households are engaged in
agriculture.
Crop farming and livestock rearing are common among both rural and urban households
recording higher percentages in crop farming with 92.3 percent and 86.7 percent respectively.
With reference to tree planting that could enhance climate change, the Municipality records
few households involved in it with 1.4 percent and 0.3 percent for urban and rural residence
respectively.

46
Table 7.1: Households by agricultural activities and locality
Agricultural activities
Total Urban Rural
Number Percent Number Percent Number Percent
Total Households 49,474 100.0
46,505 100.0
2,969 100.0
Households engages in Agriculture 9,771 19.7
8,191 17.6
1,580 53.2
Crop Farming 8,559 87.6
7,101 86.7
1,458 92.3
Tree Planting 119 1.2
115 1.4
4 0.3
Livestock Rearing 2,632 26.9
2,002 24.4
630 39.9
Fish Farming 28 0.3 26 0.3 2 0.1
Source: Ghana Statistical Service, 2010 Population and Housing Census
7.3 Types of Livestock and other Animals reared
Crop farming, tree planting, livestock rearing and fish farming are the various types of
farming in Ghana, (2010 PHC). Table 7.2 shows the distribution of livestock and keepers. It
is observed that there is a large concentration on poultry and livestock keeping. For instance
there are 2,007 and 1911keepers for poultry and livestock respectively. For the average
number per keeper it is observed that fish farming and snail rearing relatively are kept on
large scale as compared to the other livestock keeping. For instance, the average number of
fingerlings per keeper for fish farming is 477, whilst that of snail is 192. There were 5,065
cattle in the Municipality for 105 keepers. On the average, every keeper has 48 cattle. .
However, the keeping of bee, dove and silk for livestock is very low, only six keepers are
engaged in it averagely. The most common animal keeping found in the Municipality is
chicken. It shows that there are 1,748 keepers in the Municipality, this is expected and
could be due to the fact that chicken is one of the most consumed livestock.
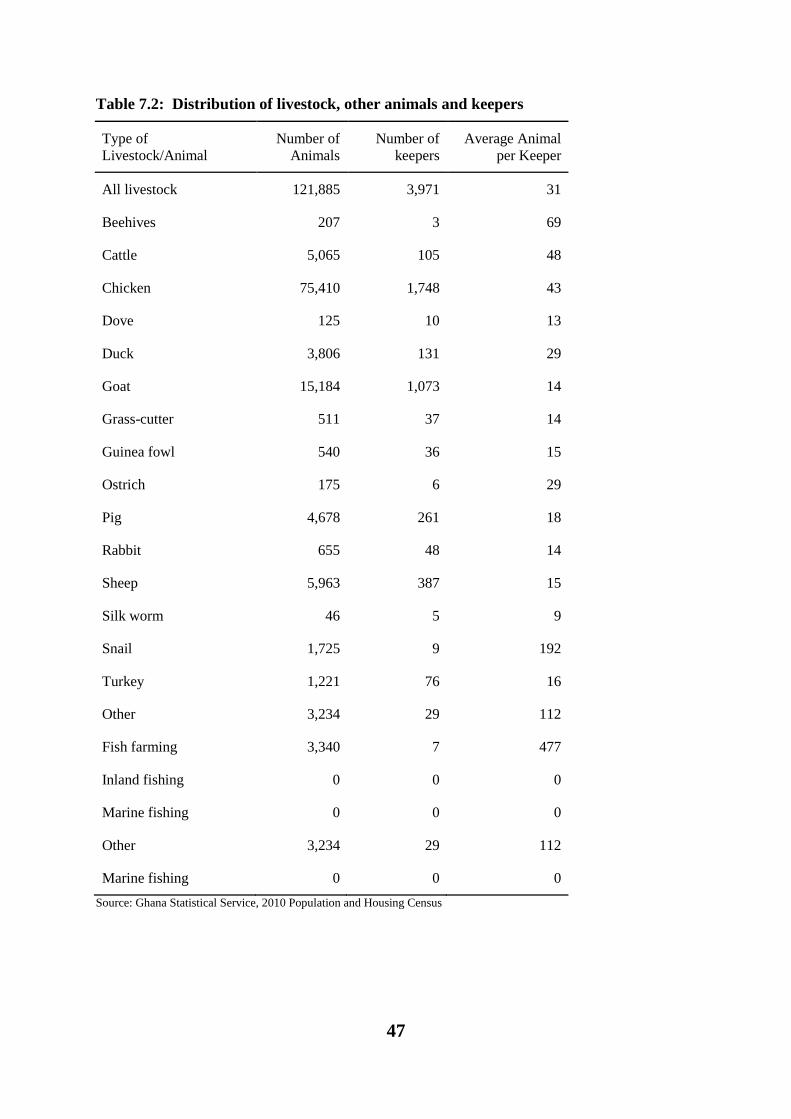
47
Table 7.2: Distribution of livestock, other animals and keepers
Type of
Livestock/Animal
Number of
Animals
Number of
keepers
Average Animal
per Keeper
All livestock 121,885 3,971 31
Beehives 207 3 69
Cattle 5,065 105 48
Chicken 75,410 1,748 43
Dove 125 10 13
Duck 3,806 131 29
Goat 15,184 1,073 14
Grass-cutter 511 37 14
Guinea fowl 540 36 15
Ostrich 175 6 29
Pig 4,678 261 18
Rabbit 655 48 14
Sheep 5,963 387 15
Silk worm 46 5 9
Snail 1,725 9 192
Turkey 1,221 76 16
Other 3,234 29 112
Fish farming 3,340 7 477
Inland fishing 0 0 0
Marine fishing 0 0 0
Other 3,234 29 112
Marine fishing 0 0 0
Source: Ghana Statistical Service, 2010 Population and Housing Census
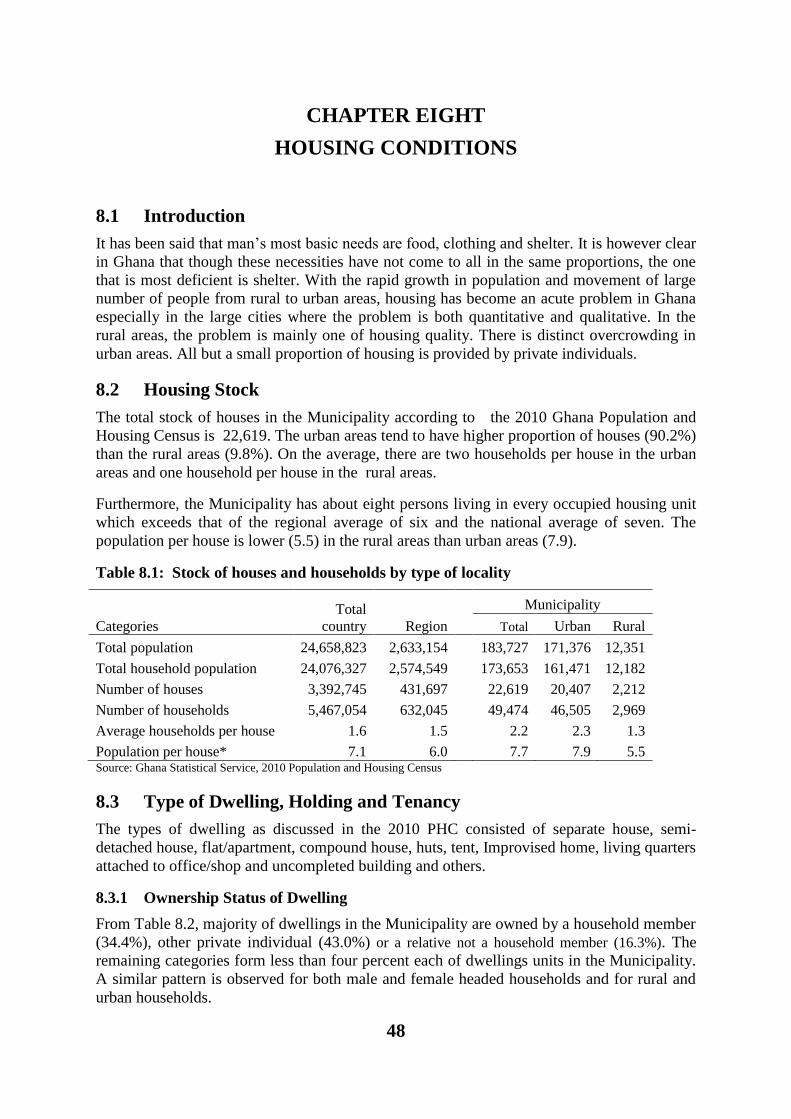
48
CHAPTER EIGHT
HOUSING CONDITIONS
8.1 Introduction
It has been said that man’s most basic needs are food, clothing and shelter. It is however clear
in Ghana that though these necessities have not come to all in the same proportions, the one
that is most deficient is shelter. With the rapid growth in population and movement of large
number of people from rural to urban areas, housing has become an acute problem in Ghana
especially in the large cities where the problem is both quantitative and qualitative. In the
rural areas, the problem is mainly one of housing quality. There is distinct overcrowding in
urban areas. All but a small proportion of housing is provided by private individuals.
8.2 Housing Stock
The total stock of houses in the Municipality according to the 2010 Ghana Population and
Housing Census is 22,619. The urban areas tend to have higher proportion of houses (90.2%)
than the rural areas (9.8%). On the average, there are two households per house in the urban
areas and one household per house in the rural areas.
Furthermore, the Municipality has about eight persons living in every occupied housing unit
which exceeds that of the regional average of six and the national average of seven. The
population per house is lower (5.5) in the rural areas than urban areas (7.9).
Table 8.1: Stock of houses and households by type of locality
Total
country Region
Municipality
Categories Total Urban Rural
Total population 24,658,823 2,633,154
183,727 171,376 12,351
Total household population 24,076,327 2,574,549
173,653 161,471 12,182
Number of houses 3,392,745 431,697
22,619 20,407 2,212
Number of households 5,467,054 632,045
49,474 46,505 2,969
Average households per house 1.6 1.5
2.2 2.3 1.3
Population per house* 7.1 6.0 7.7 7.9 5.5 Source: Ghana Statistical Service, 2010 Population and Housing Census
8.3 Type of Dwelling, Holding and Tenancy
The types of dwelling as discussed in the 2010 PHC consisted of separate house, semi-
detached house, flat/apartment, compound house, huts, tent, Improvised home, living quarters
attached to office/shop and uncompleted building and others.
8.3.1 Ownership Status of Dwelling
From Table 8.2, majority of dwellings in the Municipality are owned by a household member
(34.4%), other private individual (43.0%) or a relative not a household member (16.3%). The
remaining categories form less than four percent each of dwellings units in the Municipality.
A similar pattern is observed for both male and female headed households and for rural and
urban households.
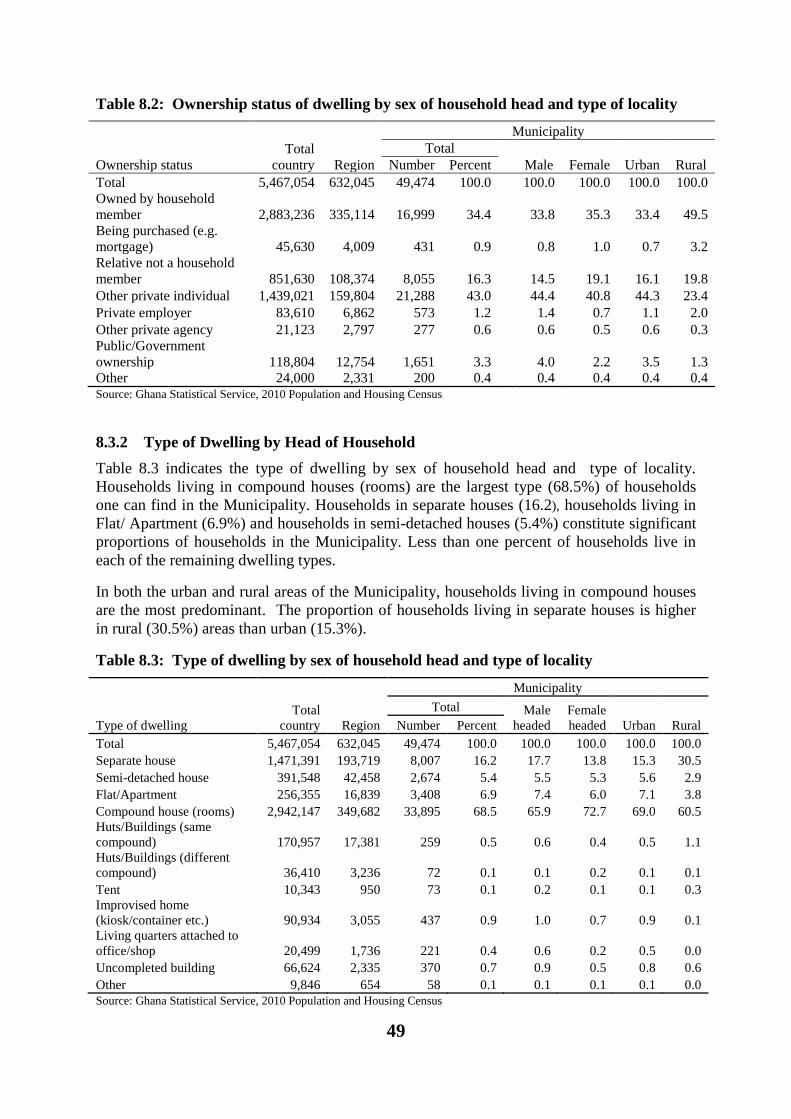
49
Table 8.2: Ownership status of dwelling by sex of household head and type of locality
Ownership status
Total
country Region
Municipality
Total
Male Female Urban Rural Number Percent
Total 5,467,054 632,045 49,474 100.0
100.0 100.0 100.0 100.0
Owned by household
member 2,883,236 335,114 16,999 34.4
33.8 35.3 33.4 49.5
Being purchased (e.g.
mortgage) 45,630 4,009 431 0.9
0.8 1.0 0.7 3.2
Relative not a household
member 851,630 108,374 8,055 16.3
14.5 19.1 16.1 19.8
Other private individual 1,439,021 159,804 21,288 43.0
44.4 40.8 44.3 23.4
Private employer 83,610 6,862 573 1.2
1.4 0.7 1.1 2.0
Other private agency 21,123 2,797 277 0.6
0.6 0.5 0.6 0.3
Public/Government
ownership 118,804 12,754 1,651 3.3
4.0 2.2 3.5 1.3
Other 24,000 2,331 200 0.4 0.4 0.4 0.4 0.4 Source: Ghana Statistical Service, 2010 Population and Housing Census
8.3.2 Type of Dwelling by Head of Household
Table 8.3 indicates the type of dwelling by sex of household head and type of locality.
Households living in compound houses (rooms) are the largest type (68.5%) of households
one can find in the Municipality. Households in separate houses (16.2), households living in
Flat/ Apartment (6.9%) and households in semi-detached houses (5.4%) constitute significant
proportions of households in the Municipality. Less than one percent of households live in
each of the remaining dwelling types.
In both the urban and rural areas of the Municipality, households living in compound houses
are the most predominant. The proportion of households living in separate houses is higher
in rural (30.5%) areas than urban (15.3%).
Table 8.3: Type of dwelling by sex of household head and type of locality
Type of dwelling
Total
country Region
Municipality
Total Male
headed
Female
headed Urban Rural Number Percent
Total 5,467,054 632,045 49,474 100.0 100.0 100.0 100.0 100.0
Separate house 1,471,391 193,719 8,007 16.2 17.7 13.8 15.3 30.5
Semi-detached house 391,548 42,458 2,674 5.4 5.5 5.3 5.6 2.9
Flat/Apartment 256,355 16,839 3,408 6.9 7.4 6.0 7.1 3.8
Compound house (rooms) 2,942,147 349,682 33,895 68.5 65.9 72.7 69.0 60.5
Huts/Buildings (same
compound) 170,957 17,381 259 0.5 0.6 0.4 0.5 1.1
Huts/Buildings (different
compound) 36,410 3,236 72 0.1 0.1 0.2 0.1 0.1
Tent 10,343 950 73 0.1 0.2 0.1 0.1 0.3
Improvised home
(kiosk/container etc.) 90,934 3,055 437 0.9 1.0 0.7 0.9 0.1
Living quarters attached to
office/shop 20,499 1,736 221 0.4 0.6 0.2 0.5 0.0
Uncompleted building 66,624 2,335 370 0.7 0.9 0.5 0.8 0.6
Other 9,846 654 58 0.1 0.1 0.1 0.1 0.0
Source: Ghana Statistical Service, 2010 Population and Housing Census
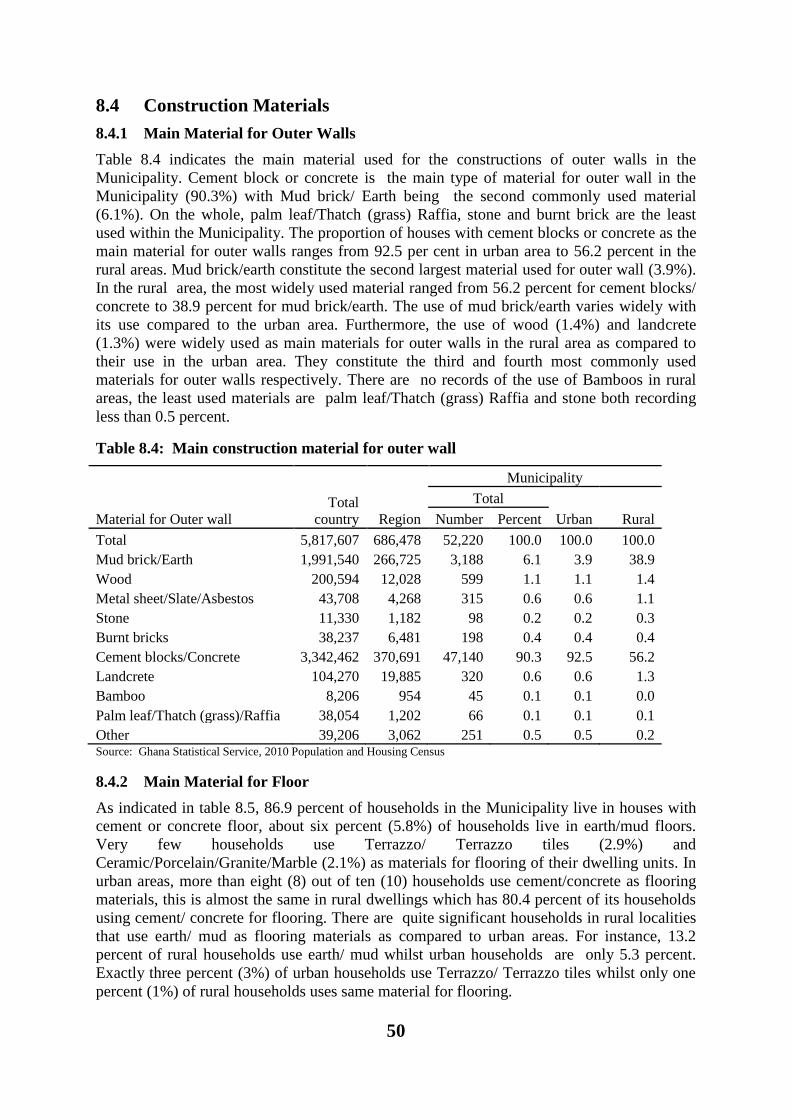
50
8.4 Construction Materials
8.4.1 Main Material for Outer Walls
Table 8.4 indicates the main material used for the constructions of outer walls in the
Municipality. Cement block or concrete is the main type of material for outer wall in the
Municipality (90.3%) with Mud brick/ Earth being the second commonly used material
(6.1%). On the whole, palm leaf/Thatch (grass) Raffia, stone and burnt brick are the least
used within the Municipality. The proportion of houses with cement blocks or concrete as the
main material for outer walls ranges from 92.5 per cent in urban area to 56.2 percent in the
rural areas. Mud brick/earth constitute the second largest material used for outer wall (3.9%).
In the rural area, the most widely used material ranged from 56.2 percent for cement blocks/
concrete to 38.9 percent for mud brick/earth. The use of mud brick/earth varies widely with
its use compared to the urban area. Furthermore, the use of wood (1.4%) and landcrete
(1.3%) were widely used as main materials for outer walls in the rural area as compared to
their use in the urban area. They constitute the third and fourth most commonly used
materials for outer walls respectively. There are no records of the use of Bamboos in rural
areas, the least used materials are palm leaf/Thatch (grass) Raffia and stone both recording
less than 0.5 percent.
Table 8.4: Main construction material for outer wall
Material for Outer wall
Total
country Region
Municipality
Total
Urban
Rural Number Percent
Total 5,817,607 686,478 52,220 100.0 100.0 100.0
Mud brick/Earth 1,991,540 266,725 3,188 6.1 3.9 38.9
Wood 200,594 12,028 599 1.1 1.1 1.4
Metal sheet/Slate/Asbestos 43,708 4,268 315 0.6 0.6 1.1
Stone 11,330 1,182 98 0.2 0.2 0.3
Burnt bricks 38,237 6,481 198 0.4 0.4 0.4
Cement blocks/Concrete 3,342,462 370,691 47,140 90.3 92.5 56.2
Landcrete 104,270 19,885 320 0.6 0.6 1.3
Bamboo 8,206 954 45 0.1 0.1 0.0
Palm leaf/Thatch (grass)/Raffia 38,054 1,202 66 0.1 0.1 0.1
Other 39,206 3,062 251 0.5 0.5 0.2 Source: Ghana Statistical Service, 2010 Population and Housing Census
8.4.2 Main Material for Floor
As indicated in table 8.5, 86.9 percent of households in the Municipality live in houses with
cement or concrete floor, about six percent (5.8%) of households live in earth/mud floors.
Very few households use Terrazzo/ Terrazzo tiles (2.9%) and
Ceramic/Porcelain/Granite/Marble (2.1%) as materials for flooring of their dwelling units. In
urban areas, more than eight (8) out of ten (10) households use cement/concrete as flooring
materials, this is almost the same in rural dwellings which has 80.4 percent of its households
using cement/ concrete for flooring. There are quite significant households in rural localities
that use earth/ mud as flooring materials as compared to urban areas. For instance, 13.2
percent of rural households use earth/ mud whilst urban households are only 5.3 percent.
Exactly three percent (3%) of urban households use Terrazzo/ Terrazzo tiles whilst only one
percent (1%) of rural households uses same material for flooring.
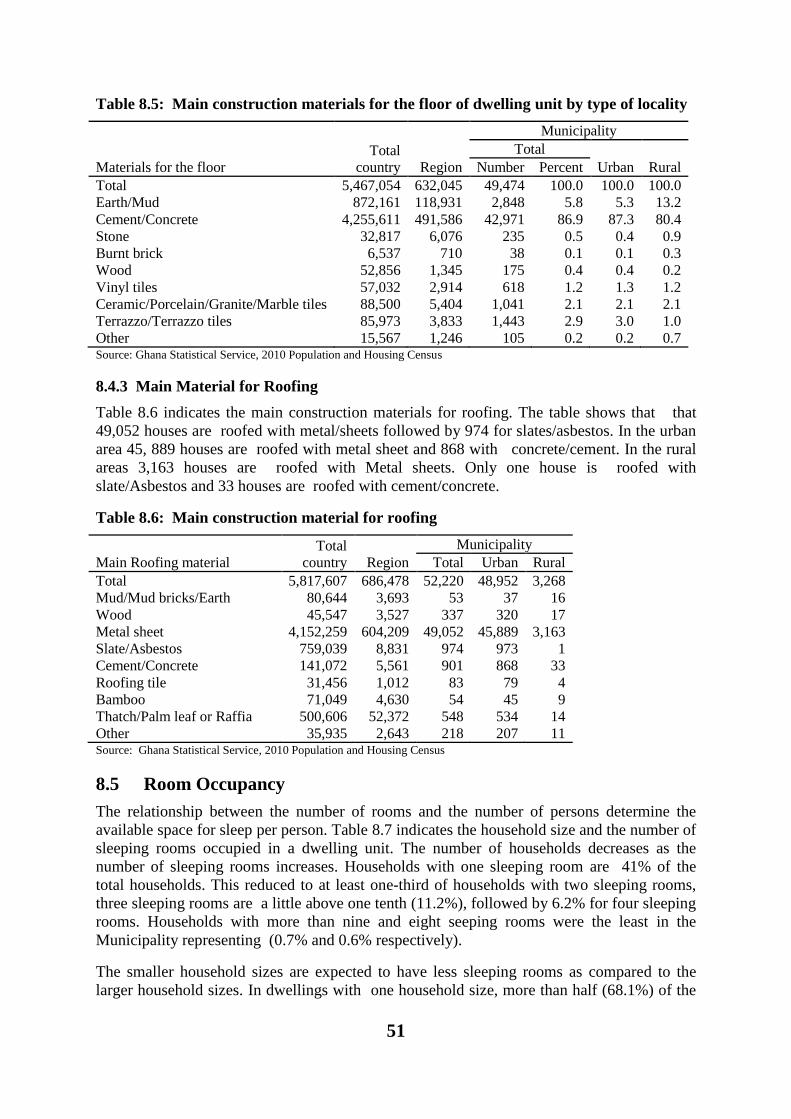
51
Table 8.5: Main construction materials for the floor of dwelling unit by type of locality
Materials for the floor
Total
country Region
Municipality
Total
Urban Rural Number Percent
Total 5,467,054 632,045 49,474 100.0 100.0 100.0
Earth/Mud 872,161 118,931 2,848 5.8 5.3 13.2
Cement/Concrete 4,255,611 491,586 42,971 86.9 87.3 80.4
Stone 32,817 6,076 235 0.5 0.4 0.9
Burnt brick 6,537 710 38 0.1 0.1 0.3
Wood 52,856 1,345 175 0.4 0.4 0.2
Vinyl tiles 57,032 2,914 618 1.2 1.3 1.2
Ceramic/Porcelain/Granite/Marble tiles 88,500 5,404 1,041 2.1 2.1 2.1
Terrazzo/Terrazzo tiles 85,973 3,833 1,443 2.9 3.0 1.0
Other 15,567 1,246 105 0.2 0.2 0.7 Source: Ghana Statistical Service, 2010 Population and Housing Census
8.4.3 Main Material for Roofing
Table 8.6 indicates the main construction materials for roofing. The table shows that that
49,052 houses are roofed with metal/sheets followed by 974 for slates/asbestos. In the urban
area 45, 889 houses are roofed with metal sheet and 868 with concrete/cement. In the rural
areas 3,163 houses are roofed with Metal sheets. Only one house is roofed with
slate/Asbestos and 33 houses are roofed with cement/concrete.
Table 8.6: Main construction material for roofing
Main Roofing material
Total
country Region
Municipality
Total Urban Rural
Total 5,817,607 686,478 52,220 48,952 3,268
Mud/Mud bricks/Earth 80,644 3,693 53 37 16
Wood 45,547 3,527 337 320 17
Metal sheet 4,152,259 604,209 49,052 45,889 3,163
Slate/Asbestos 759,039 8,831 974 973 1
Cement/Concrete 141,072 5,561 901 868 33
Roofing tile 31,456 1,012 83 79 4
Bamboo 71,049 4,630 54 45 9
Thatch/Palm leaf or Raffia 500,606 52,372 548 534 14
Other 35,935 2,643 218 207 11 Source: Ghana Statistical Service, 2010 Population and Housing Census
8.5 Room Occupancy
The relationship between the number of rooms and the number of persons determine the
available space for sleep per person. Table 8.7 indicates the household size and the number of
sleeping rooms occupied in a dwelling unit. The number of households decreases as the
number of sleeping rooms increases. Households with one sleeping room are 41% of the
total households. This reduced to at least one-third of households with two sleeping rooms,
three sleeping rooms are a little above one tenth (11.2%), followed by 6.2% for four sleeping
rooms. Households with more than nine and eight seeping rooms were the least in the
Municipality representing (0.7% and 0.6% respectively).
The smaller household sizes are expected to have less sleeping rooms as compared to the
larger household sizes. In dwellings with one household size, more than half (68.1%) of the
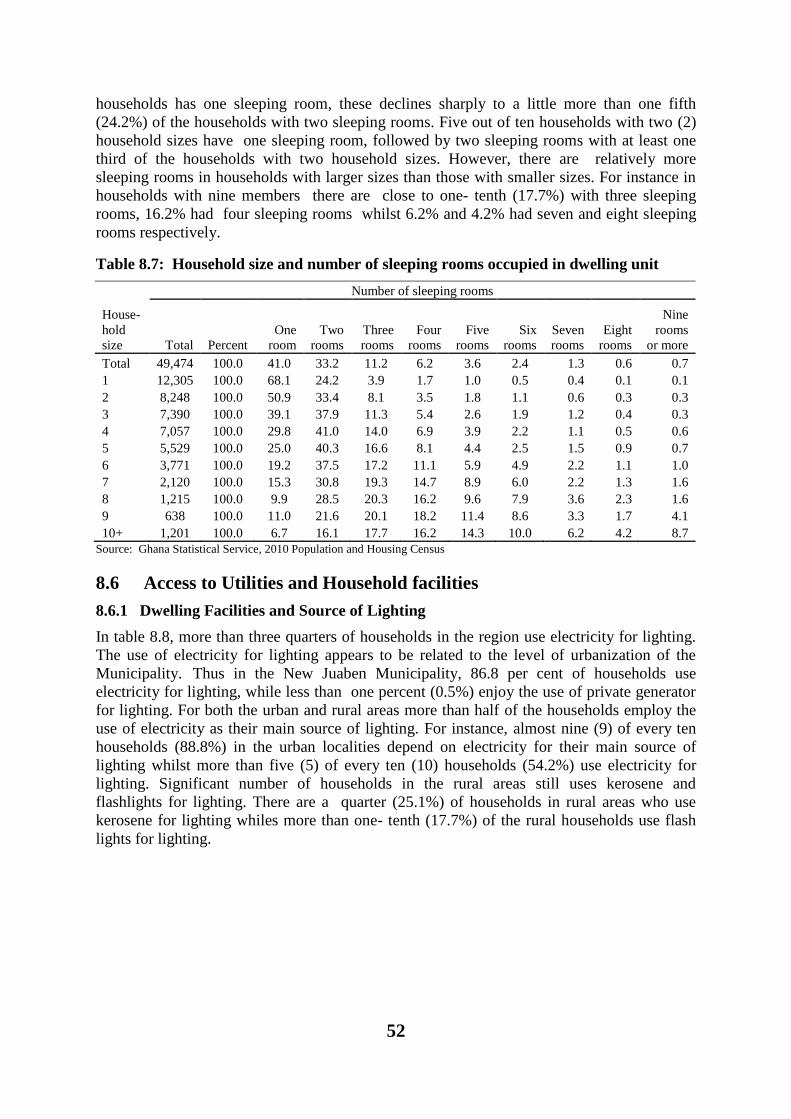
52
households has one sleeping room, these declines sharply to a little more than one fifth
(24.2%) of the households with two sleeping rooms. Five out of ten households with two (2)
household sizes have one sleeping room, followed by two sleeping rooms with at least one
third of the households with two household sizes. However, there are relatively more
sleeping rooms in households with larger sizes than those with smaller sizes. For instance in
households with nine members there are close to one- tenth (17.7%) with three sleeping
rooms, 16.2% had four sleeping rooms whilst 6.2% and 4.2% had seven and eight sleeping
rooms respectively.
Table 8.7: Household size and number of sleeping rooms occupied in dwelling unit
House-
hold
size
Number of sleeping rooms
Total Percent
One
room
Two
rooms
Three
rooms
Four
rooms
Five
rooms
Six
rooms
Seven
rooms
Eight
rooms
Nine
rooms
or more
Total 49,474 100.0 41.0 33.2 11.2 6.2 3.6 2.4 1.3 0.6 0.7
1 12,305 100.0 68.1 24.2 3.9 1.7 1.0 0.5 0.4 0.1 0.1
2 8,248 100.0 50.9 33.4 8.1 3.5 1.8 1.1 0.6 0.3 0.3
3 7,390 100.0 39.1 37.9 11.3 5.4 2.6 1.9 1.2 0.4 0.3
4 7,057 100.0 29.8 41.0 14.0 6.9 3.9 2.2 1.1 0.5 0.6
5 5,529 100.0 25.0 40.3 16.6 8.1 4.4 2.5 1.5 0.9 0.7
6 3,771 100.0 19.2 37.5 17.2 11.1 5.9 4.9 2.2 1.1 1.0
7 2,120 100.0 15.3 30.8 19.3 14.7 8.9 6.0 2.2 1.3 1.6
8 1,215 100.0 9.9 28.5 20.3 16.2 9.6 7.9 3.6 2.3 1.6
9 638 100.0 11.0 21.6 20.1 18.2 11.4 8.6 3.3 1.7 4.1
10+ 1,201 100.0 6.7 16.1 17.7 16.2 14.3 10.0 6.2 4.2 8.7
Source: Ghana Statistical Service, 2010 Population and Housing Census
8.6 Access to Utilities and Household facilities
8.6.1 Dwelling Facilities and Source of Lighting
In table 8.8, more than three quarters of households in the region use electricity for lighting.
The use of electricity for lighting appears to be related to the level of urbanization of the
Municipality. Thus in the New Juaben Municipality, 86.8 per cent of households use
electricity for lighting, while less than one percent (0.5%) enjoy the use of private generator
for lighting. For both the urban and rural areas more than half of the households employ the
use of electricity as their main source of lighting. For instance, almost nine (9) of every ten
households (88.8%) in the urban localities depend on electricity for their main source of
lighting whilst more than five (5) of every ten (10) households (54.2%) use electricity for
lighting. Significant number of households in the rural areas still uses kerosene and
flashlights for lighting. There are a quarter (25.1%) of households in rural areas who use
kerosene for lighting whiles more than one- tenth (17.7%) of the rural households use flash
lights for lighting.
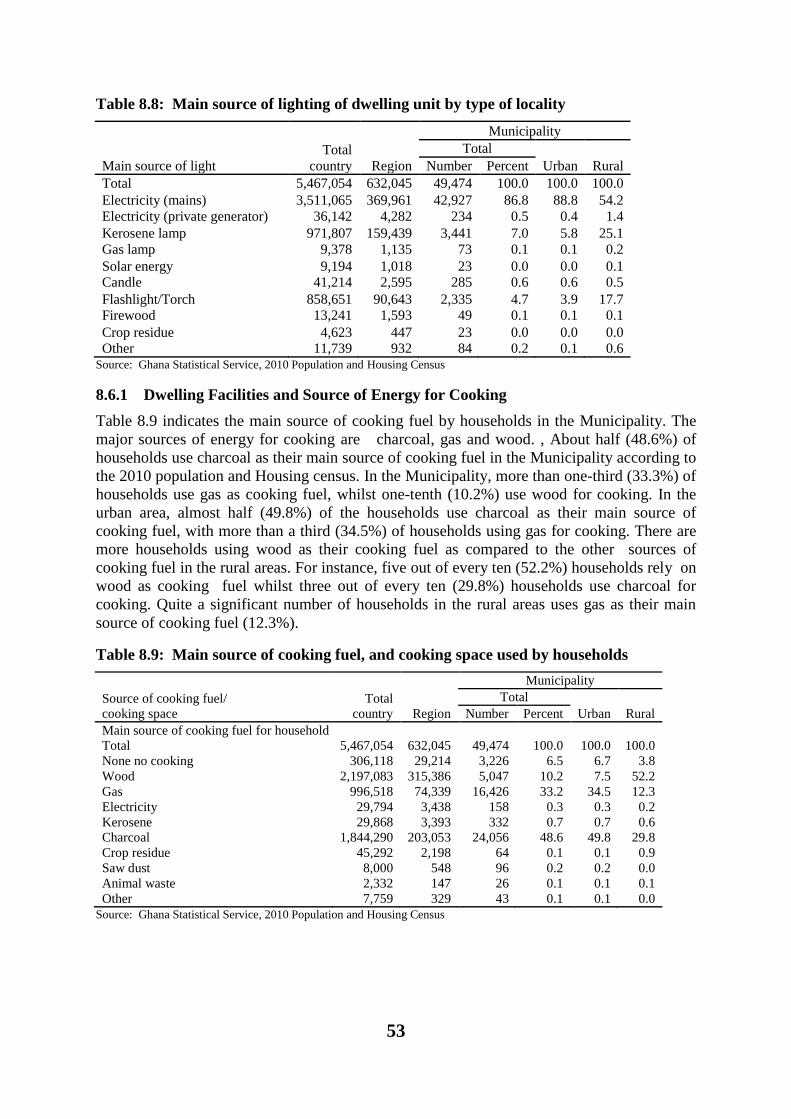
53
Table 8.8: Main source of lighting of dwelling unit by type of locality
Main source of light
Total
country Region
Municipality
Total
Urban Rural Number Percent
Total 5,467,054 632,045 49,474 100.0 100.0 100.0
Electricity (mains) 3,511,065 369,961 42,927 86.8 88.8 54.2
Electricity (private generator) 36,142 4,282 234 0.5 0.4 1.4
Kerosene lamp 971,807 159,439 3,441 7.0 5.8 25.1
Gas lamp 9,378 1,135 73 0.1 0.1 0.2
Solar energy 9,194 1,018 23 0.0 0.0 0.1
Candle 41,214 2,595 285 0.6 0.6 0.5
Flashlight/Torch 858,651 90,643 2,335 4.7 3.9 17.7
Firewood 13,241 1,593 49 0.1 0.1 0.1
Crop residue 4,623 447 23 0.0 0.0 0.0
Other 11,739 932 84 0.2 0.1 0.6 Source: Ghana Statistical Service, 2010 Population and Housing Census
8.6.1 Dwelling Facilities and Source of Energy for Cooking
Table 8.9 indicates the main source of cooking fuel by households in the Municipality. The
major sources of energy for cooking are charcoal, gas and wood. , About half (48.6%) of
households use charcoal as their main source of cooking fuel in the Municipality according to
the 2010 population and Housing census. In the Municipality, more than one-third (33.3%) of
households use gas as cooking fuel, whilst one-tenth (10.2%) use wood for cooking. In the
urban area, almost half (49.8%) of the households use charcoal as their main source of
cooking fuel, with more than a third (34.5%) of households using gas for cooking. There are
more households using wood as their cooking fuel as compared to the other sources of
cooking fuel in the rural areas. For instance, five out of every ten (52.2%) households rely on
wood as cooking fuel whilst three out of every ten (29.8%) households use charcoal for
cooking. Quite a significant number of households in the rural areas uses gas as their main
source of cooking fuel (12.3%).
Table 8.9: Main source of cooking fuel, and cooking space used by households
Source of cooking fuel/
cooking space
Total
country Region
Municipality
Total
Urban Rural Number Percent
Main source of cooking fuel for household
Total 5,467,054 632,045 49,474 100.0 100.0 100.0
None no cooking 306,118 29,214 3,226 6.5 6.7 3.8
Wood 2,197,083 315,386 5,047 10.2 7.5 52.2
Gas 996,518 74,339 16,426 33.2 34.5 12.3
Electricity 29,794 3,438 158 0.3 0.3 0.2
Kerosene 29,868 3,393 332 0.7 0.7 0.6
Charcoal 1,844,290 203,053 24,056 48.6 49.8 29.8
Crop residue 45,292 2,198 64 0.1 0.1 0.9
Saw dust 8,000 548 96 0.2 0.2 0.0
Animal waste 2,332 147 26 0.1 0.1 0.1
Other 7,759 329 43 0.1 0.1 0.0
Source: Ghana Statistical Service, 2010 Population and Housing Census
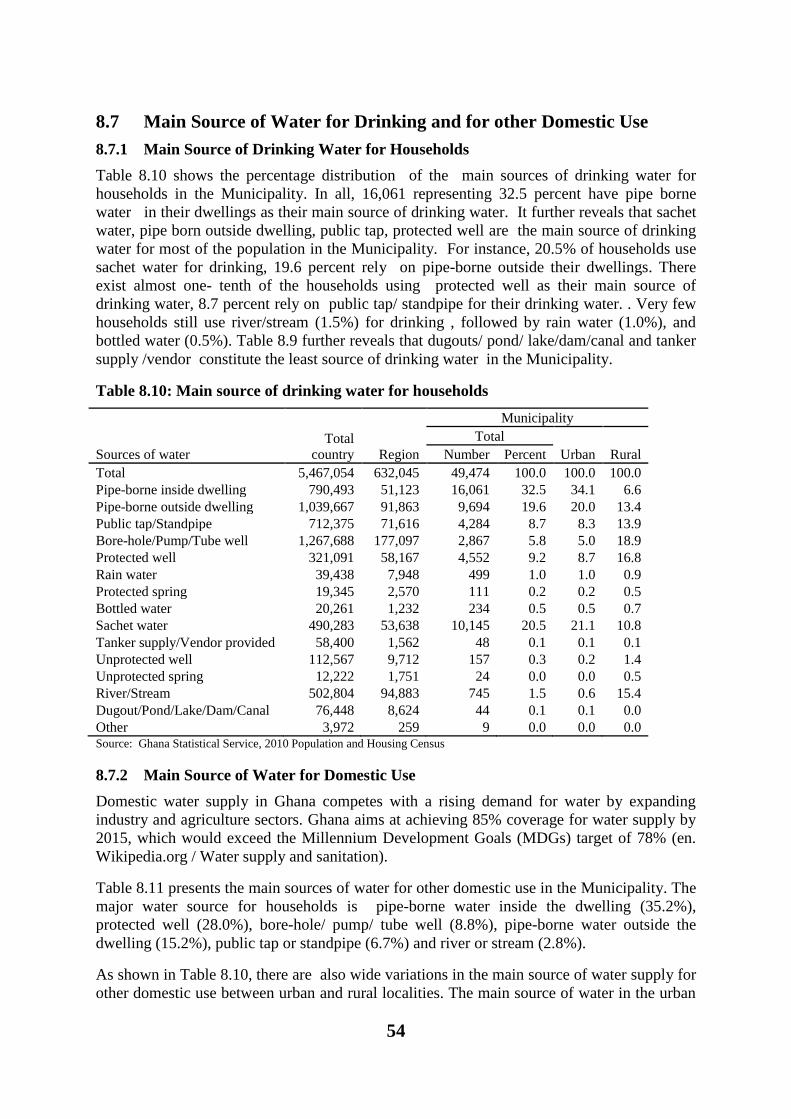
54
8.7 Main Source of Water for Drinking and for other Domestic Use
8.7.1 Main Source of Drinking Water for Households
Table 8.10 shows the percentage distribution of the main sources of drinking water for
households in the Municipality. In all, 16,061 representing 32.5 percent have pipe borne
water in their dwellings as their main source of drinking water. It further reveals that sachet
water, pipe born outside dwelling, public tap, protected well are the main source of drinking
water for most of the population in the Municipality. For instance, 20.5% of households use
sachet water for drinking, 19.6 percent rely on pipe-borne outside their dwellings. There
exist almost one- tenth of the households using protected well as their main source of
drinking water, 8.7 percent rely on public tap/ standpipe for their drinking water. . Very few
households still use river/stream (1.5%) for drinking , followed by rain water (1.0%), and
bottled water (0.5%). Table 8.9 further reveals that dugouts/ pond/ lake/dam/canal and tanker
supply /vendor constitute the least source of drinking water in the Municipality.
Table 8.10: Main source of drinking water for households
Sources of water
Total
country Region
Municipality
Total
Urban Rural Number Percent
Total 5,467,054 632,045 49,474 100.0 100.0 100.0
Pipe-borne inside dwelling 790,493 51,123 16,061 32.5 34.1 6.6
Pipe-borne outside dwelling 1,039,667 91,863 9,694 19.6 20.0 13.4
Public tap/Standpipe 712,375 71,616 4,284 8.7 8.3 13.9
Bore-hole/Pump/Tube well 1,267,688 177,097 2,867 5.8 5.0 18.9
Protected well 321,091 58,167 4,552 9.2 8.7 16.8
Rain water 39,438 7,948 499 1.0 1.0 0.9
Protected spring 19,345 2,570 111 0.2 0.2 0.5
Bottled water 20,261 1,232 234 0.5 0.5 0.7
Sachet water 490,283 53,638 10,145 20.5 21.1 10.8
Tanker supply/Vendor provided 58,400 1,562 48 0.1 0.1 0.1
Unprotected well 112,567 9,712 157 0.3 0.2 1.4
Unprotected spring 12,222 1,751 24 0.0 0.0 0.5
River/Stream 502,804 94,883 745 1.5 0.6 15.4
Dugout/Pond/Lake/Dam/Canal 76,448 8,624 44 0.1 0.1 0.0
Other 3,972 259 9 0.0 0.0 0.0 Source: Ghana Statistical Service, 2010 Population and Housing Census
8.7.2 Main Source of Water for Domestic Use
Domestic water supply in Ghana competes with a rising demand for water by expanding
industry and agriculture sectors. Ghana aims at achieving 85% coverage for water supply by
2015, which would exceed the Millennium Development Goals (MDGs) target of 78% (en.
Wikipedia.org / Water supply and sanitation).
Table 8.11 presents the main sources of water for other domestic use in the Municipality. The
major water source for households is pipe-borne water inside the dwelling (35.2%),
protected well (28.0%), bore-hole/ pump/ tube well (8.8%), pipe-borne water outside the
dwelling (15.2%), public tap or standpipe (6.7%) and river or stream (2.8%).
As shown in Table 8.10, there are also wide variations in the main source of water supply for
other domestic use between urban and rural localities. The main source of water in the urban

55
areas are pipe borne water inside dwelling and protected well whilst in rural areas it is water
from rivers/streams, protected well and borehole/pump/Tube wells. The proportion of urban
dwelling units that use pipe-borne inside dwelling is 37.1 percent as against 6.4 percent in
the rural areas. The proportion of households using protected wells in the urban areas are
28.2%.
Table 8.11: Main source of water for other domestic use of households
Sources of water
Total
country Region
Municipality
Total
Urban Rural Number Percent
Total 5,467,054 632,045 49,474 100.0 100.0 100.0
Pipe-borne inside dwelling 905,566 55,588 17,429 35.2 37.1 6.4
Pipe-borne outside dwelling 1,089,030 83,245 7,877 15.9 16.2 11.3
Public tap/Standpipe 704,293 65,772 3,310 6.7 6.6 8.5
Bore-hole/Pump/Tube well 1,280,465 180,604 4,344 8.8 8.0 21.5
Protected well 465,775 95,179 13,869 28.0 28.2 25.8
Rain water 39,916 7,577 385 0.8 0.8 0.4
Protected spring 18,854 2,760 146 0.3 0.3 0.4
Tanker supply/Vendor provided 100,048 1,975 85 0.2 0.2 0.0
Unprotected well 152,055 13,230 514 1.0 1.0 1.8
Unprotected spring 15,738 2,196 42 0.1 0.1 0.5
River/Stream 588,590 112,728 1,373 2.8 1.5 22.7
Dugout/Pond/Lake/Dam/Canal 96,422 9,850 59 0.1 0.1 0.0
Other 10,302 1,341 41 0.1 0.0 0.7 Source: Ghana Statistical Service, 2010 Population and Housing Census
Most rural settlements traditionally rely on raw surface water from such sources as streams,
rivers, springs among others for their domestic or household chores . Some of these surface
water sources are heavily polluted, resulting in water – borne diseases.
On the basis of the 2010 Population and Housing Census, it is observed in figure 8.1 that a
very significant proportion of rural households depend on surface water sources for their
domestic chores. It is also noted that whilst one fourth of the rural households depend on
bore-holes/pump/ tube water, and one fifth of them depend on protected wells, almost one-
tenth of them depend on public tap/standpipe for their water supply for domestic use. The
percentage of the households which depend on pipe-borne outside dwelling are more than
households using pipe –borne inside dwelling for domestic chores.
8.8 Bathing and Toilet facilities
8.8.1 Toilet facilities use by households
Table 8.12 presents the distribution of households by type of toilet facilities in the
Municipality. More than 35.9% households use the public toilet. Also, 30.3% of the
households use water closets (W.C) facilities. Whereas 16.9 percent use the KVIP, there are
13.1 percent of the households who still use Pit latrines. Despite the urbanized characteristic
of the Municipality, almost three percent (2.9%) of the households have no facilities hence
resort to the “free- range system”. There exist disparities in the use of toilet facilities in the
urban and rural localities. For instance, the main toilet facility used by rural households is the
Pit latrine (38.9%) whilst in urban households the use the Public toilet is represented by
(36.2%). There are more urban households who use the W.C (31.5%) as compared to rural
households (11.8%). With regards to the use of KVIP, 17.3% of households in urban areas
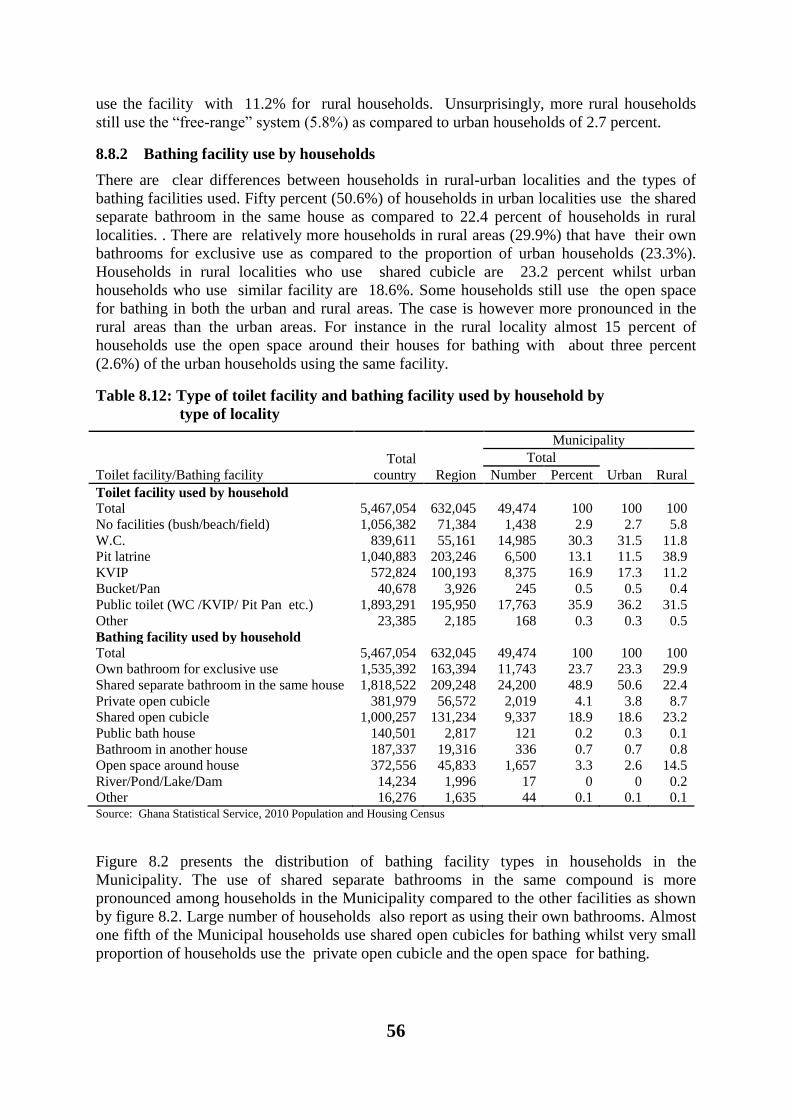
56
use the facility with 11.2% for rural households. Unsurprisingly, more rural households
still use the “free-range” system (5.8%) as compared to urban households of 2.7 percent.
8.8.2 Bathing facility use by households
There are clear differences between households in rural-urban localities and the types of
bathing facilities used. Fifty percent (50.6%) of households in urban localities use the shared
separate bathroom in the same house as compared to 22.4 percent of households in rural
localities. . There are relatively more households in rural areas (29.9%) that have their own
bathrooms for exclusive use as compared to the proportion of urban households (23.3%).
Households in rural localities who use shared cubicle are 23.2 percent whilst urban
households who use similar facility are 18.6%. Some households still use the open space
for bathing in both the urban and rural areas. The case is however more pronounced in the
rural areas than the urban areas. For instance in the rural locality almost 15 percent of
households use the open space around their houses for bathing with about three percent
(2.6%) of the urban households using the same facility.
Table 8.12: Type of toilet facility and bathing facility used by household by
type of locality
Toilet facility/Bathing facility
Total
country Region
Municipality
Total
Urban Rural Number Percent
Toilet facility used by household
Total 5,467,054 632,045 49,474 100 100 100
No facilities (bush/beach/field) 1,056,382 71,384 1,438 2.9 2.7 5.8
W.C. 839,611 55,161 14,985 30.3 31.5 11.8
Pit latrine 1,040,883 203,246 6,500 13.1 11.5 38.9
KVIP 572,824 100,193 8,375 16.9 17.3 11.2
Bucket/Pan 40,678 3,926 245 0.5 0.5 0.4
Public toilet (WC /KVIP/ Pit Pan etc.) 1,893,291 195,950 17,763 35.9 36.2 31.5
Other 23,385 2,185 168 0.3 0.3 0.5
Bathing facility used by household
Total 5,467,054 632,045 49,474 100 100 100
Own bathroom for exclusive use 1,535,392 163,394 11,743 23.7 23.3 29.9
Shared separate bathroom in the same house 1,818,522 209,248 24,200 48.9 50.6 22.4
Private open cubicle 381,979 56,572 2,019 4.1 3.8 8.7
Shared open cubicle 1,000,257 131,234 9,337 18.9 18.6 23.2
Public bath house 140,501 2,817 121 0.2 0.3 0.1
Bathroom in another house 187,337 19,316 336 0.7 0.7 0.8
Open space around house 372,556 45,833 1,657 3.3 2.6 14.5
River/Pond/Lake/Dam 14,234 1,996 17 0 0 0.2
Other 16,276 1,635 44 0.1 0.1 0.1 Source: Ghana Statistical Service, 2010 Population and Housing Census
Figure 8.2 presents the distribution of bathing facility types in households in the
Municipality. The use of shared separate bathrooms in the same compound is more
pronounced among households in the Municipality compared to the other facilities as shown
by figure 8.2. Large number of households also report as using their own bathrooms. Almost
one fifth of the Municipal households use shared open cubicles for bathing whilst very small
proportion of households use the private open cubicle and the open space for bathing.
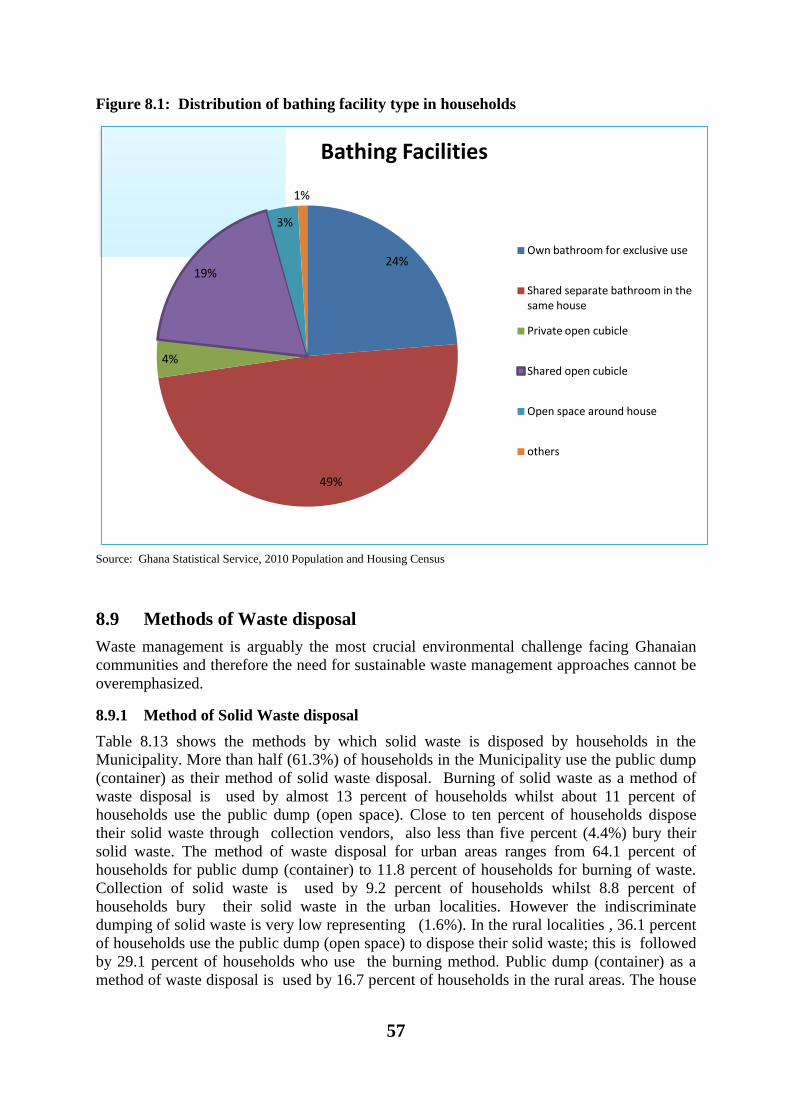
57
Figure 8.1: Distribution of bathing facility type in households
24%
49%
4%
19%
3%
1%
Bathing Facilities
Own bathroom for exclusive use
Shared separate bathroom in the same house
Private open cubicle
Shared open cubicle
Open space around house
others
Source: Ghana Statistical Service, 2010 Population and Housing Census
8.9 Methods of Waste disposal
Waste management is arguably the most crucial environmental challenge facing Ghanaian
communities and therefore the need for sustainable waste management approaches cannot be
overemphasized.
8.9.1 Method of Solid Waste disposal
Table 8.13 shows the methods by which solid waste is disposed by households in the
Municipality. More than half (61.3%) of households in the Municipality use the public dump
(container) as their method of solid waste disposal. Burning of solid waste as a method of
waste disposal is used by almost 13 percent of households whilst about 11 percent of
households use the public dump (open space). Close to ten percent of households dispose
their solid waste through collection vendors, also less than five percent (4.4%) bury their
solid waste. The method of waste disposal for urban areas ranges from 64.1 percent of
households for public dump (container) to 11.8 percent of households for burning of waste.
Collection of solid waste is used by 9.2 percent of households whilst 8.8 percent of
households bury their solid waste in the urban localities. However the indiscriminate
dumping of solid waste is very low representing (1.6%). In the rural localities , 36.1 percent
of households use the public dump (open space) to dispose their solid waste; this is followed
by 29.1 percent of households who use the burning method. Public dump (container) as a
method of waste disposal is used by 16.7 percent of households in the rural areas. The house
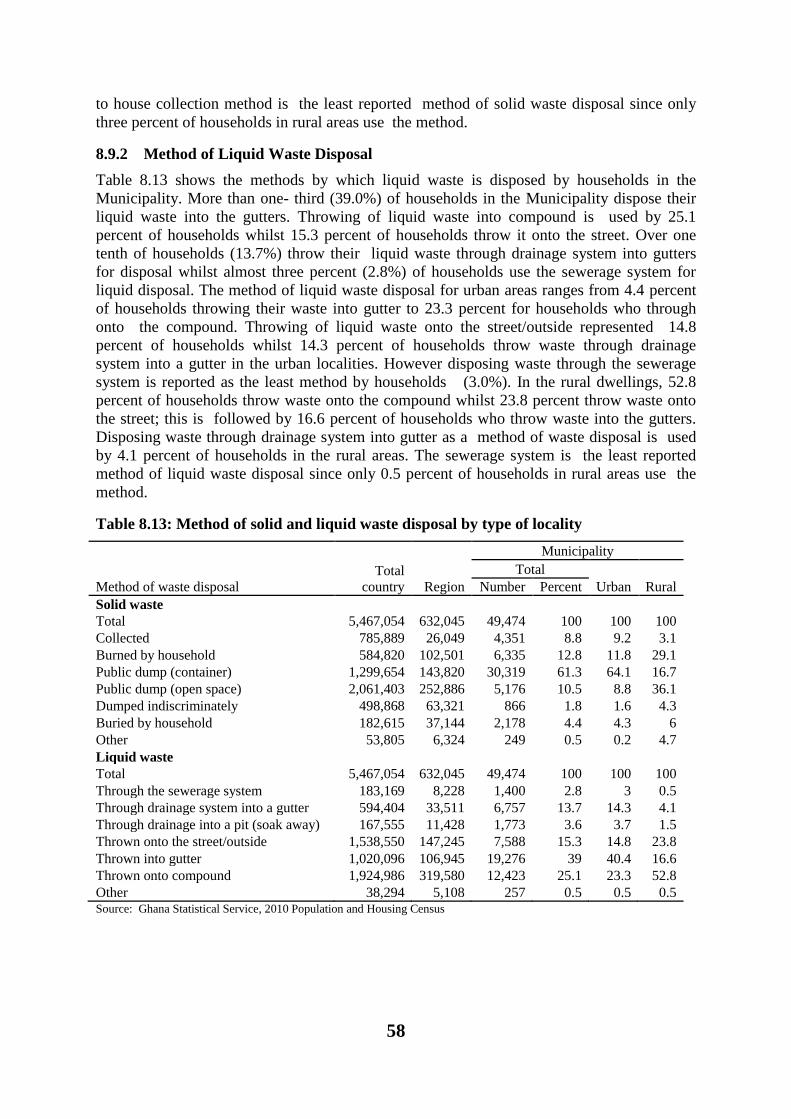
58
to house collection method is the least reported method of solid waste disposal since only
three percent of households in rural areas use the method.
8.9.2 Method of Liquid Waste Disposal
Table 8.13 shows the methods by which liquid waste is disposed by households in the
Municipality. More than one- third (39.0%) of households in the Municipality dispose their
liquid waste into the gutters. Throwing of liquid waste into compound is used by 25.1
percent of households whilst 15.3 percent of households throw it onto the street. Over one
tenth of households (13.7%) throw their liquid waste through drainage system into gutters
for disposal whilst almost three percent (2.8%) of households use the sewerage system for
liquid disposal. The method of liquid waste disposal for urban areas ranges from 4.4 percent
of households throwing their waste into gutter to 23.3 percent for households who through
onto the compound. Throwing of liquid waste onto the street/outside represented 14.8
percent of households whilst 14.3 percent of households throw waste through drainage
system into a gutter in the urban localities. However disposing waste through the sewerage
system is reported as the least method by households (3.0%). In the rural dwellings, 52.8
percent of households throw waste onto the compound whilst 23.8 percent throw waste onto
the street; this is followed by 16.6 percent of households who throw waste into the gutters.
Disposing waste through drainage system into gutter as a method of waste disposal is used
by 4.1 percent of households in the rural areas. The sewerage system is the least reported
method of liquid waste disposal since only 0.5 percent of households in rural areas use the
method.
Table 8.13: Method of solid and liquid waste disposal by type of locality
Method of waste disposal
Total
country Region
Municipality
Total
Urban Rural Number Percent
Solid waste
Total 5,467,054 632,045 49,474 100 100 100
Collected 785,889 26,049 4,351 8.8 9.2 3.1
Burned by household 584,820 102,501 6,335 12.8 11.8 29.1
Public dump (container) 1,299,654 143,820 30,319 61.3 64.1 16.7
Public dump (open space) 2,061,403 252,886 5,176 10.5 8.8 36.1
Dumped indiscriminately 498,868 63,321 866 1.8 1.6 4.3
Buried by household 182,615 37,144 2,178 4.4 4.3 6
Other 53,805 6,324 249 0.5 0.2 4.7
Liquid waste
Total 5,467,054 632,045 49,474 100 100 100
Through the sewerage system 183,169 8,228 1,400 2.8 3 0.5
Through drainage system into a gutter 594,404 33,511 6,757 13.7 14.3 4.1
Through drainage into a pit (soak away) 167,555 11,428 1,773 3.6 3.7 1.5
Thrown onto the street/outside 1,538,550 147,245 7,588 15.3 14.8 23.8
Thrown into gutter 1,020,096 106,945 19,276 39 40.4 16.6
Thrown onto compound 1,924,986 319,580 12,423 25.1 23.3 52.8
Other 38,294 5,108 257 0.5 0.5 0.5 Source: Ghana Statistical Service, 2010 Population and Housing Census
59
CHAPTER NINE
SUMMARY, CONCLUSION AND RECOMENDATIONS
9.1 Summary of findings
9.1.1 Population size, structure and composition
The population of New Juaben Municipality is 183,727 according to the 2010 PHC made up
of more females (51.7%) than males (48.3). The sex ratio of the Municipality is 93.0,
implying that for every 100 females there are 93 males. The New Juaben Municipality’s
population forms about seven percent (6.9%) of the population of the Eastern region.
The Municipality is endowed with a very high ( 66.4% of the population aged 15 years and
older) economically active population ( population 15-64 years). The dependency ratio is
56., which means that on the average two people in the working age population (15-64yrs)
have one person in the dependent population to cater for.
9.1.2 Fertility, mortality and migration
Total Fertility Rate (TFR) for the Municipality is 2.4 which is lower than the Eastern region
average of 3.5. General Fertility Rate (GFR) and Crude Birth Rate for the Municipality are
68.0 and 19.7 respectively. The Municipality has a Crude Death Rate (CDR) of 5.9 per 1,000
population. Migrants in the Municipality are mainly from the neighboring regions (Greater
Accra, Ashanti and Volta Region. Migrants from Volta region constitute 11.0 percent of the
migrant population, with those from the Greater Accra and Ashanti regions constituting 10
percent and 9.7 percent respectively.
9.1.3 Household size, structure and composition
The Municipality has a household population of 173,653 and 49,474 households. The average
household size in the Municipality is 3.5 which is lower than the Eastern region average of
4.1. More than one third (37.2%) of the household population are children of the head of
household. Nuclear families (i.e., parents and their children) account for more three quarters
(76%) of households in the Municipality.
9.1.4 Marital characteristics
Close to half (47.2%) of the population aged 12 years and older in the Municipality have
never been married. A little over one third (36.1%) of the population in the given age bracket
have ever been married. The population divorced (4.1%) and those widowed (5.1%)
constitute less than six percent of the population aged 12 years and older. About five percent
of the population 12 years and older are in informal unions.
9.1.5 Nationality
Majority of the population in the Municipality are Ghanaians. Non Ghanaians account for
only 2.5 percent of the Municipality’s Population.
9.1.6 Literacy and education
More than 90 percent of the population aged 11 years and older in the Municipality are
literate. Females have higher proportion of not literate population than males. Close to three
quarters (72.0%) of the literate population are literate in English and a Ghanaian language(s).
60
Less than one percent are literate in English and French, with about one-fifth in English
language only.
The majority (54.9%) of the population currently in school are in basic schools, i.e., primary
and JSS/JHS. Persons in senior secondary schools constitute 12 percent of the population
currently in school. The proportion (57.0%) of females in basic schools is higher than that of
males (52.8%), but the reverse is the case for those in tertiary education (9.7 % for females
and 15.3% for males).
9.1.7 Economic activities
About two thirds (66.4%) of the population aged 15 years and older in the New Juaben
Municipality are economically active. More than 90 percent (92.7%) of the economically
active population are in some for employment. Close to two thirds (62.1%) of the population
not economically active are in full time education with higher percentage for males (69.3%)
than females (55.5%). Majority (51.2%) of the working population are into service and sales,
followed by craft and related works. A higher percentage of females (35.7%) are into service
and sales than males (20.1%). Majority of male workers (27%) are rather into craft and
related works.
Wholesale and retail is the predominant industry for both male (19.6%) and female (42.5%)
workers in the Municipality. More than half (53.1%) of the employed population are self-
employed without employees. Females (64.0%) are more likely to be self-employed without
employees than males (40.9%). About one third (31.3%) of the working population are
employees, with higher percentage of males being employees (40.9%) than females (21.7%).
Three quarters (75%) of the employed population are in the private informal sector.
9.1.9 Information Communication Technology
More than two thirds of the population aged aged 12 years and older in the New Juaben
Municipality own owned mobile phones with about one fifth (17.5%) having access internet
facilities. With regards to owner of computer, 15.3 percent of households in the Municipality
own a computer (desktop/laptop) .
9.1.10 Disability
About four percent (4.3%) of the population in the New Juaben Municipality have one type
of disability or the other. The majority of Persons with Disability (PWDs) have visual
impairment followed by physically disability and emotional disorders. There are slightly
more females with mobility impairment (physical) than males. Slightly higher percentage of
females (4.7%) have disabilities than males (3.9%). There are disparities in the proportion of
PWDs between the urban and rural localities.
9.1.11 Households in Agriculture
Agricultural households constitute 19.7 percent of the total households in the Municipality,
with majority of the households engaged in crop farming (87.6 %). Rural households tend to
be more involved in agriculture (53.2%) as compared to their urban counterparts (17.6%).
9.1.12 Housing
The New Juaben Municipality has 22,619 houses constituting 5.2 of the total housing stock of
the Eastern region. On the average, there are two households per house with a population of
eight per house in the Municipality. The majority of dwelling units in the Municipality are
owned by other private individual with a little over one third (34.4%) by household members.

61
Compound houses constitute more than two thirds (68.5%) of houses in the Municipality with
separate houses making 16.2 percent. About 90 percent of the outer walls of dwelling units in
the Municipality are made of cement/concrete. More than three quarters of the floors of
dwelling units are made of cement/concrete. The majority of roofs in the Municipality (94%)
are roofed with metal sheets.
Close to seven percent of households with 10 or more members have one sleeping room.
Electricity is the main source of lighting for the majority (86.8%) of households in the
Municipality. Charcoal (48.6%). Gas (33%) and wood are the main sources of fuel for
cooking. The majority of households in the Municipality use pipe borne water (32.5% use
pipe borne inside dwelling and 15.9% pipe borne outside dwelling) for drinking. Water for
other domestic purposes is also mainly from pipe borne water (51.1%) with 28 percent from
protected wells. More than one third of households in the Municipality use public toilet with
close to one third using W.C. However, the majority of rural households use pit latrine while
majority of urban households use public toilet.
With regards to waste disposal, close to two thirds of households dispose of their solid waste
by dumping it onto public dump containers. More than one- third (39.0%) of households in
the Municipality dispose their liquid waste into gutters with 25 percent throwing into
compounds.
9.2 Conclusion
The New Juaben Municipality is one of the 26 districts in the Eastern region with diverse
physical, environment and topography that support diverse economic activities in the region.
These include agricultural production, fishing, forestry, mining and ecotourism.
Administratively, both political and social organizations of the Municipality are based on
modern and traditional institutions. The population characteristics of the Municipality are
also diverse in several respects.
Sex ratio for the Municipality has been relatively low falling below 100. The proportion of
children is low as compared to the youthful population. This means that fertility in the
Municipality is low, resulting in a drop in the dependency ratio. But the population is still
largely youthful, with a potential to continue to grow into the near future. Maternal mortality
in the Municipality is relatively low. The level of infant mortality rate is also relatively high
as compared to deaths occurring in other age groups.
The population dynamics of the Municipality may be determined largely by fertility and
mortality processes. Migration in the Municipality was mainly between the neighboring
regions such as Volta, Ashanti and Greater Accra regions. Persons of Ghanaian parentage
constitute a large percentage of the population in the Municipality. There is a presence of
Ghanaians with dual citizenship in the Municipality, though very small.
The majority of the population reside in urban areas. There are disparities among the socio
economic subgroups regarding all these characteristics. The residents of the Municipality are
also of diverse, socioeconomic, ethnic and other backgrounds. Levels of education and
literacy rate are lower among rural dwellers and women.
Households in the Municipality are predominantly male-headed. Relatives and siblings
constitute large proportion of both rural and urban households, indicating that extended
family living arrangements still exist in the Municipality.
62
The prevalence of disability is quite low and six major types are reported in the Municipality.
There are more females with disability than males.
There is a considerable proportion of the disabled population who have never attended
school. Almost about one third of the female disabled population does not have any
educational attainment. This is more than the male disabled population who are without any
form of education. Interestingly, there are more disabled population who have attended
school than those who have never attended school or without education. Almost nine out of
every ten (10) disabled males have at least attained a level of education
The contribution of both the formal and informal sector to the employment status of the
Municipality cannot be overemphasized. The private informal sector is said to have
contributed greatly in terms of employment the Municipality. More than two third of the total
employment in the Municipality are from the private informal sector while the private formal
sector contributed less than one tenth to the total employment in the Municipality. The public
sector also contributed substantially to the total employment. Overall, the private sector
contributes more than eighty percent while the government sector contributes only fifteen
percent to the employment status in the Municipality.
Less than one fifth of the total households in the Municipality are engaged in agriculture. The
non-agriculture households constitute more than three-fourth of the total households reported.
In the urban areas agriculture cannot be said to be the major economic activity since more
than 80 per cent households are non-agriculture households. The rural localities are
predominantly agrarian. More than half of the rural households are engaged in agricultural
activities. Overall, the entire Municipal population will largely rely on few households for the
production of agricultural products.
Most of the households in the Municipality with smaller sizes depend on one or two sleeping
rooms. On the average the majority of all dwellings in the Municipality are owned by private
individual. Access to ICT is predominantly higher among populations with some level of
education. On the whole the use of internet facility is very low in the Municipality.
9.3 Recommendations
General waste management in Ghana is the responsibility of the Ministry of Local
Government and Rural Development (MLGRD), which supervises the decentralized
Metropolitan, Municipal, and Municipality Assemblies (MMDAs). The MMDAs are
responsible for the collection and final disposal of solid waste through their waste
management Department (WMDs) and their Environmental Health and Sanitation
Departments (EHSD).
The poor sanitation in the Municipality could be curbed through the promotion of integrated
waste management strategies in the Municipality through the development of a
comprehensive Environmental Action Plans that are targeted towards sanitation
improvements. .
The Municipality is endowed with a larger youthful population and also the informal sector
contributes greatly to the employment status of the inhabitants hence the need to link the
informal sector Organizations to formal ones. The Municipality experiences a lot of in-
migrants from the neighboring regions, hence the need to invest in tourism.
63
Infant and maternal mortality are regarded as the major indicators of health and quality of life
in the Municipality. . To avert such a phenomenon there is the need for a proper and effective
Primary Health Care (PHC) delivery which should be made accessible to all especially to
rural dwellers.
64
REFERENCES
Ghana National Disability Document, 2000
Ghana Statistical Service, (2009), 2010 Population and Housing Census Enumerator’s
Manual
Global Monitoring Report, 2007
Richard Boateng, Published in IFIP, 4 Newsletter, Vol20, no.1, Feb. 2010
Sonny Yenibey Namouz, January, 2013. www. Isisghana.com
www.en.wikipedia.org/water supply and sanitation
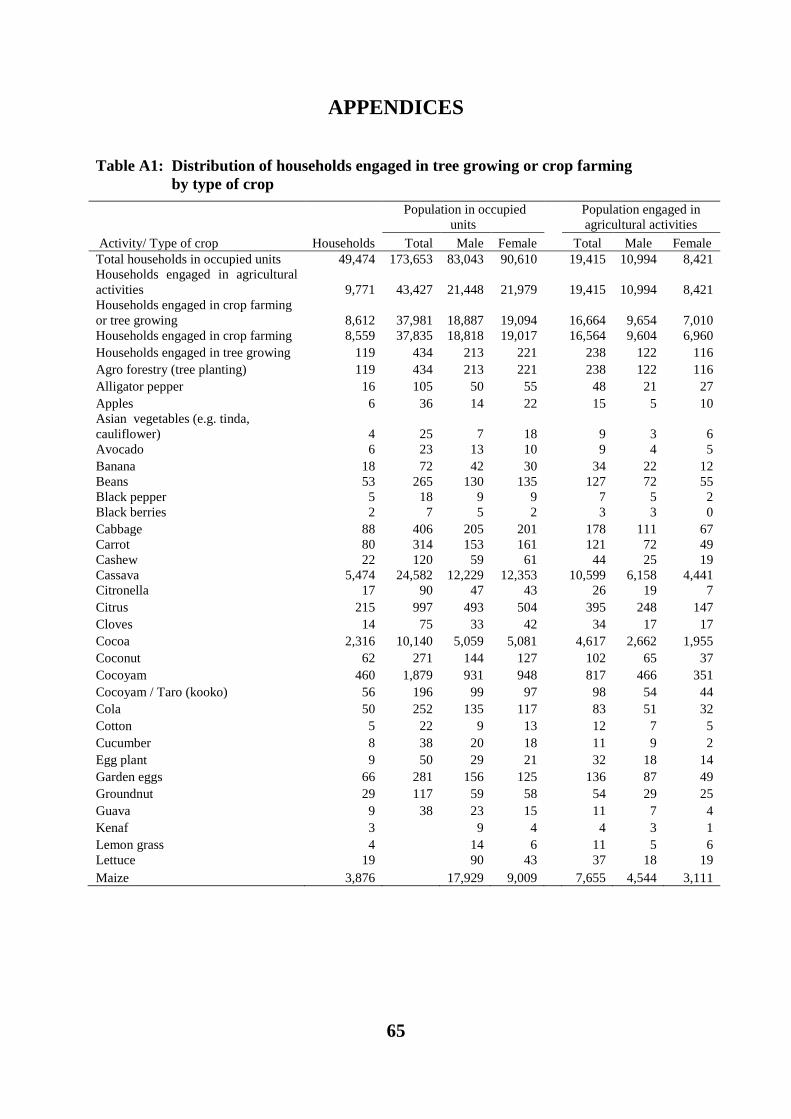
65
APPENDICES
Table A1: Distribution of households engaged in tree growing or crop farming
by type of crop
Activity/ Type of crop Households
Population in occupied
units Population engaged in
agricultural activities
Total Male Female Total Male Female
Total households in occupied units 49,474 173,653 83,043 90,610
19,415 10,994 8,421
Households engaged in agricultural
activities 9,771 43,427 21,448 21,979
19,415 10,994 8,421
Households engaged in crop farming
or tree growing 8,612 37,981 18,887 19,094
16,664 9,654 7,010
Households engaged in crop farming 8,559 37,835 18,818 19,017
16,564 9,604 6,960
Households engaged in tree growing 119 434 213 221
238 122 116
Agro forestry (tree planting) 119 434 213 221
238 122 116
Alligator pepper 16 105 50 55
48 21 27
Apples 6 36 14 22
15 5 10
Asian vegetables (e.g. tinda,
cauliflower) 4 25 7 18
9 3 6
Avocado 6 23 13 10
9 4 5
Banana 18 72 42 30
34 22 12
Beans 53 265 130 135
127 72 55
Black pepper 5 18 9 9
7 5 2
Black berries 2 7 5 2
3 3 0
Cabbage 88 406 205 201
178 111 67
Carrot 80 314 153 161
121 72 49
Cashew 22 120 59 61
44 25 19
Cassava 5,474 24,582 12,229 12,353
10,599 6,158 4,441
Citronella 17 90 47 43
26 19 7
Citrus 215 997 493 504
395 248 147
Cloves 14 75 33 42
34 17 17
Cocoa 2,316 10,140 5,059 5,081
4,617 2,662 1,955
Coconut 62 271 144 127
102 65 37
Cocoyam 460 1,879 931 948
817 466 351
Cocoyam / Taro (kooko) 56 196 99 97
98 54 44
Cola 50 252 135 117
83 51 32
Cotton 5 22 9 13
12 7 5
Cucumber 8 38 20 18
11 9 2
Egg plant 9 50 29 21
32 18 14
Garden eggs 66 281 156 125
136 87 49
Groundnut 29 117 59 58
54 29 25
Guava 9 38 23 15
11 7 4
Kenaf 3
9 4
4 3 1
Lemon grass 4
14 6
11 5 6
Lettuce 19
90 43
37 18 19
Maize 3,876 17,929 9,009 7,655 4,544 3,111
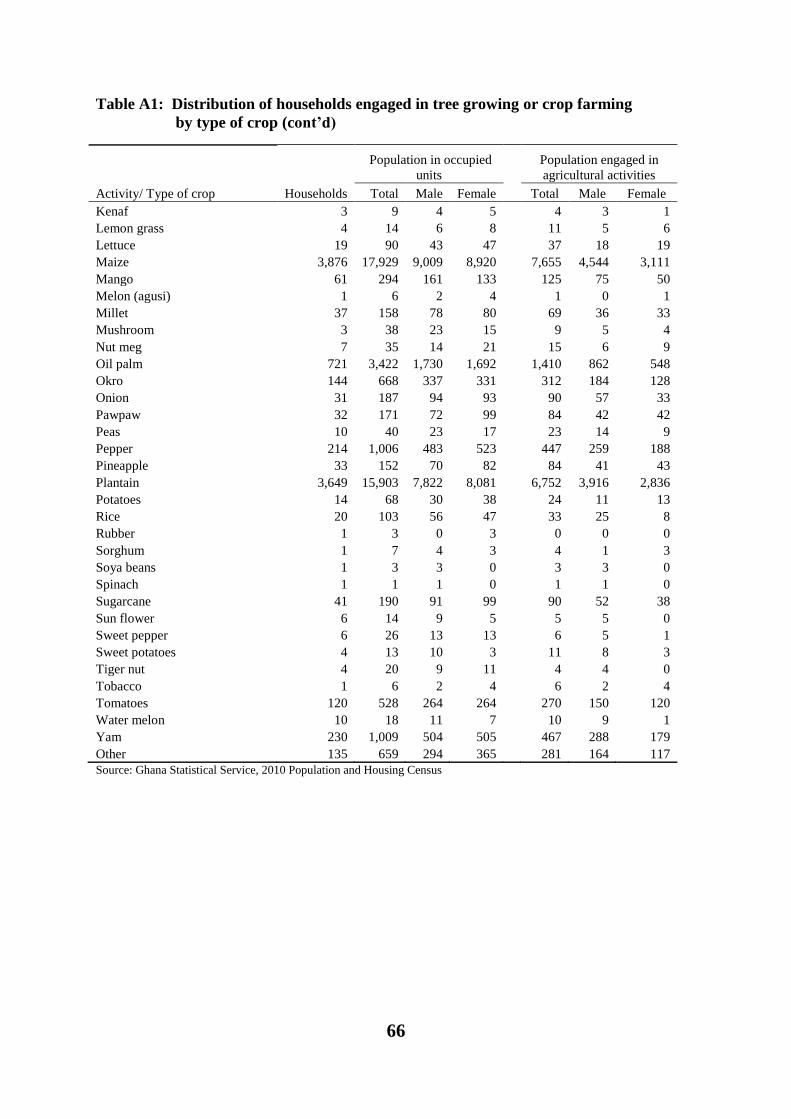
66
Table A1: Distribution of households engaged in tree growing or crop farming
by type of crop (cont’d)
Households
Population in occupied
units Population engaged in
agricultural activities
Activity/ Type of crop Total Male Female Total Male Female
Kenaf 3 9 4 5
4 3 1
Lemon grass 4 14 6 8
11 5 6
Lettuce 19 90 43 47
37 18 19
Maize 3,876 17,929 9,009 8,920
7,655 4,544 3,111
Mango 61 294 161 133
125 75 50
Melon (agusi) 1 6 2 4
1 0 1
Millet 37 158 78 80
69 36 33
Mushroom 3 38 23 15
9 5 4
Nut meg 7 35 14 21
15 6 9
Oil palm 721 3,422 1,730 1,692
1,410 862 548
Okro 144 668 337 331
312 184 128
Onion 31 187 94 93
90 57 33
Pawpaw 32 171 72 99
84 42 42
Peas 10 40 23 17
23 14 9
Pepper 214 1,006 483 523
447 259 188
Pineapple 33 152 70 82
84 41 43
Plantain 3,649 15,903 7,822 8,081
6,752 3,916 2,836
Potatoes 14 68 30 38
24 11 13
Rice 20 103 56 47
33 25 8
Rubber 1 3 0 3
0 0 0
Sorghum 1 7 4 3
4 1 3
Soya beans 1 3 3 0
3 3 0
Spinach 1 1 1 0
1 1 0
Sugarcane 41 190 91 99
90 52 38
Sun flower 6 14 9 5
5 5 0
Sweet pepper 6 26 13 13
6 5 1
Sweet potatoes 4 13 10 3
11 8 3
Tiger nut 4 20 9 11
4 4 0
Tobacco 1 6 2 4
6 2 4
Tomatoes 120 528 264 264
270 150 120
Water melon 10 18 11 7
10 9 1
Yam 230 1,009 504 505
467 288 179
Other 135 659 294 365 281 164 117
Source: Ghana Statistical Service, 2010 Population and Housing Census
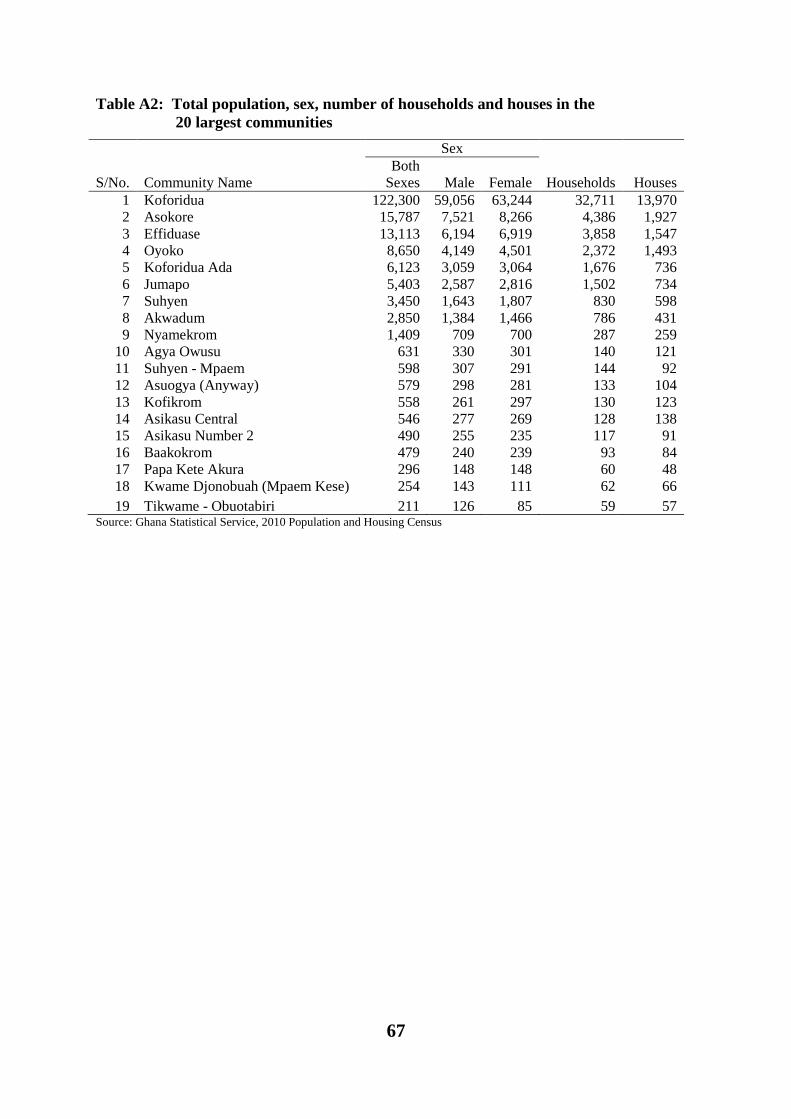
67
Table A2: Total population, sex, number of households and houses in the
20 largest communities
Sex
Households Houses S/No. Community Name
Both
Sexes Male Female
1 Koforidua 122,300 59,056 63,244 32,711 13,970
2 Asokore 15,787 7,521 8,266 4,386 1,927
3 Effiduase 13,113 6,194 6,919 3,858 1,547
4 Oyoko 8,650 4,149 4,501 2,372 1,493
5 Koforidua Ada 6,123 3,059 3,064 1,676 736
6 Jumapo 5,403 2,587 2,816 1,502 734
7 Suhyen 3,450 1,643 1,807 830 598
8 Akwadum 2,850 1,384 1,466 786 431
9 Nyamekrom 1,409 709 700 287 259
10 Agya Owusu 631 330 301 140 121
11 Suhyen - Mpaem 598 307 291 144 92
12 Asuogya (Anyway) 579 298 281 133 104
13 Kofikrom 558 261 297 130 123
14 Asikasu Central 546 277 269 128 138
15 Asikasu Number 2 490 255 235 117 91
16 Baakokrom 479 240 239 93 84
17 Papa Kete Akura 296 148 148 60 48
18 Kwame Djonobuah (Mpaem Kese) 254 143 111 62 66
19 Tikwame - Obuotabiri 211 126 85 59 57 Source: Ghana Statistical Service, 2010 Population and Housing Census
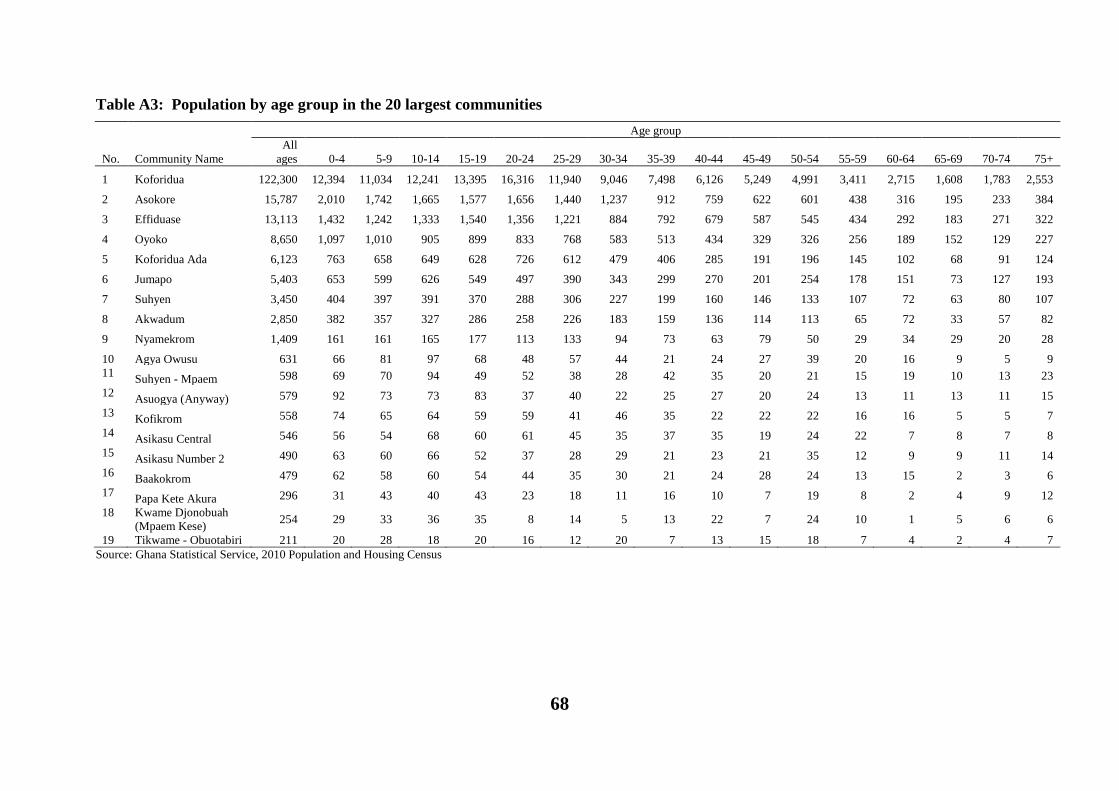
68
Table A3: Population by age group in the 20 largest communities
Community Name
Age group
No.
All
ages 0-4 5-9 10-14 15-19 20-24 25-29 30-34 35-39 40-44 45-49 50-54 55-59 60-64 65-69 70-74 75+
1 Koforidua 122,300 12,394 11,034 12,241 13,395 16,316 11,940 9,046 7,498 6,126 5,249 4,991 3,411 2,715 1,608 1,783 2,553
2 Asokore 15,787 2,010 1,742 1,665 1,577 1,656 1,440 1,237 912 759 622 601 438 316 195 233 384
3 Effiduase 13,113 1,432 1,242 1,333 1,540 1,356 1,221 884 792 679 587 545 434 292 183 271 322
4 Oyoko 8,650 1,097 1,010 905 899 833 768 583 513 434 329 326 256 189 152 129 227
5 Koforidua Ada 6,123 763 658 649 628 726 612 479 406 285 191 196 145 102 68 91 124
6 Jumapo 5,403 653 599 626 549 497 390 343 299 270 201 254 178 151 73 127 193
7 Suhyen 3,450 404 397 391 370 288 306 227 199 160 146 133 107 72 63 80 107
8 Akwadum 2,850 382 357 327 286 258 226 183 159 136 114 113 65 72 33 57 82
9 Nyamekrom 1,409 161 161 165 177 113 133 94 73 63 79 50 29 34 29 20 28
10 Agya Owusu 631 66 81 97 68 48 57 44 21 24 27 39 20 16 9 5 9
11 Suhyen - Mpaem 598 69 70 94 49 52 38 28 42 35 20 21 15 19 10 13 23
12 Asuogya (Anyway) 579 92 73 73 83 37 40 22 25 27 20 24 13 11 13 11 15
13 Kofikrom 558 74 65 64 59 59 41 46 35 22 22 22 16 16 5 5 7
14 Asikasu Central 546 56 54 68 60 61 45 35 37 35 19 24 22 7 8 7 8
15 Asikasu Number 2 490 63 60 66 52 37 28 29 21 23 21 35 12 9 9 11 14
16 Baakokrom 479 62 58 60 54 44 35 30 21 24 28 24 13 15 2 3 6
17 Papa Kete Akura 296 31 43 40 43 23 18 11 16 10 7 19 8 2 4 9 12
18 Kwame Djonobuah
(Mpaem Kese) 254 29 33 36 35 8 14 5 13 22 7 24 10 1 5 6 6
19 Tikwame - Obuotabiri 211 20 28 18 20 16 12 20 7 13 15 18 7 4 2 4 7
Source: Ghana Statistical Service, 2010 Population and Housing Census
69
LIST OF CONTRIBUTORS
Project Secretariat
Dr. Philomena Nyarko, Government Statistician
Mr. Baah Wadieh, Deputy Government Statistician
Mr. David Yenukwa Kombat, Acting Census Coordinator
Mr. Sylvester Gyamfi, DISDAP Project Coordinator
Mrs. Abena A. Osei-Akoto, Data Processing
Mr. Rochester Appiah Kubi Boateng, Data Processing
Mrs. Jacqueline Anum, Data Processing
Mrs. Samilia Mintah, Data Processing
Mr. Yaw Misefa, Data Processing
Mr. Ernest Enyan, Data Processing
Mr. Kobina Abaka Ansah, Regional Statistician
Ms. Hanna Frempong Konadu, Formatting/Typesetting
Mrs. Gifty Oppong, Formatting/Typesetting
Writers
Mrs. Roseline Attiogbey
Mr. Yakubu Bilal
Consultant
Dr. John Boateng
Editor/ Reviewers
Mr. Kwaku D. Kessey
Mr. David Yenukwa Kombat