Embed Size (px)
Citation preview
New Mexico School District
Professional Development Plans
Summary Report
Prepared for:New Mexico Partnership for Mathematics and Science Education
Regional Educational Technology Assistance ProgramLinking Leaders
April, 2000
Authors:Kirk F. Minnick and Kristen E. Wenzel
Minnick & Associates, Inc.2403 San Mateo NE, Suite P-4 Albuquerque, New Mexico 87110
505-889-9358 Fax: 505-889-9374
This document is supported by federal funds from the National Science Foundation (NSF), Office of Educational Systemic Reform, contract number 9554468. Its contents do notnecessarily reflect the views or policies of NSF, and no official endorsement of material should be inferred.
Professional Development Plans Summary Report
Acknowledgments
Minnick & Associates, Inc. would like to thank the New Mexico State Department of Educationfor their support in obtaining access and working space during the collection of these data. Special thanks to Steven Sanchez, Jean Podborny, Nancy Mandel, Paula McGee and others of theCurriculum, Instruction & Technology unit of the department. We also would like to thank theNM SDE for providing access to achievement level data for the schools districts, therebyallowing an analysis of student proficiency with respect to district goals.
We also want to thank those school districts who were able to respond to a last minute requestand provide an electronic copy of their plan which made compilation that much easier. All theschool districts have put in many hours of work and meeting with staff to put forth a DistrictProfessional Development Plan in response to Senate Bill 110.
1Professional Development Plans Summary Report
Introduction
The following report contains the summary and assessment of the NM District ProfessionalDevelopment Plans submitted to the State Department of Education in March, 2000 incompliance with Senate Bill 110 and Section 22-2.2.AA. Senate Bill 110: 1999 states that theState Board develop a systemic framework for professional development that provides training toensure quality teachers and principals and that improves and enhances student achievement. Thestate board shall work with public school educators, the commission on higher education andinstitutions of higher education to establish the framework. The framework shall include:
(1) the criteria for school districts to apply for professional development funds, including anevaluation component that will be used by the department of education in approving local school districtprofessional development plans; and
(2) guidelines for developing extensive professional development activities for school districts,including teaching strategies, curriculum materials, distance learning networks and web sites to ensure that thestate board's rules pertaining to content standards and benchmarks are used by New Mexico teachers.
Some of the plans are still being reviewed by the Department and others are being revised by thedistricts. Eight districts are still in the process of writing their plans and are not included in thisanalysis. This report will cover the professional development plans submitted by 77 (86%) of thedistricts that were available for review. The report will not identify the contents of individualdistrict plans but will attempt to provide a summary of the professional development needsexpressed by the 77 districts included in the analysis.
As stated in the materials provided to districts from the NM SDE, “the primary purpose ofprofessional development is school improvement as measured by the success of every student”. The department provided a framework for the plans (see Appendix A). This framework wasstructured around the Educational Plan for Student Success (EPSS) goals of the district andconsisted of 15 components for the district to respond to each EPSS goal. This report is intendedto support the professional development community in their work with districts.
2Professional Development Plans Summary Report
Methodology
The analysis of 77 professional development plans from districts of different sizes, representingdifferent school populations and communities, required a specific methodology to condense datato a meaningful and comparable format. The State Department of Education provided all thedistricts with a sample reporting matrix encompassing the 15 components of each EPSS goal,however, the districts were not required to utilize this matrix in their plans. As a result, the planswere submitted in a variety of styles, with different types of information and detail.
The first step in the process was to examine the plans on file at the State Department ofEducation and determine the plan components best suited to provide a summary of professionaldevelopment issues. Upon reviewing the plans submitted to the SDE in early March, a summarymatrix was created to utilize in collecting data from the district plans (see Appendix B). Fromthe larger and more detailed district plans, data on five components were collected:
1. EPSS Goals: The specific EPSS goals for each District.2. PDP Addressed: The type of Professional Development addressed by the EPSS goal.3. ACTIVITIES/STRATEGIES/FOLLOW-UP ACTIVITIES: Three separate components were
condensed into one category due to overlap in meaning and interpretation.4. RESOURCES AVAILABLE/SOURCES OF FUNDS: These two components were
collapsed to encompass the resources of a District for each specific EPSS goal.5. RESOURCES NEEDED: This component was included to identify the needs of districts
in relation to each goal.
The SDE had sent out a request towards the end of the process for computer discs of Districtplans, which 54 of the 77 districts provided. The SDE allowed access to these discs, whichfacilitated the data collection through direct cut and paste of plan components into the summarymatrix. For the remainder of districts, hardcopies of the reports were utilized to collect thenecessary data for the summary matrix.
It is important to bear in mind that the following report is based on summaries of the DistrictPlans. The summary matrices do not contain the level of detail present in the official planssubmitted to the SDE. Due to time and budget constraints, it was necessary to condense the largeamount of information provided in many plans into a manageable format for analysis. Also,while many plans provided detailed information on professional development plans at the schooland individual level, only district level data were recorded in the summary matrices (except whenplans only contained school level data, which was entered as district data).
After the District Professional Development Plans were condensed into the summary matrix, thedata was entered into a database file to allow for more efficient analysis. The SPSS StandardVersion 8.0.2 statistical program was utilized to analyze the data and provide summaries of thePD plan components. In addition, the database was linked to a database of New Mexico TerraNova Test results for additional analysis.

3Professional Development Plans Summary Report
Summary of District Goals
Educational Plans for Student Success Goals
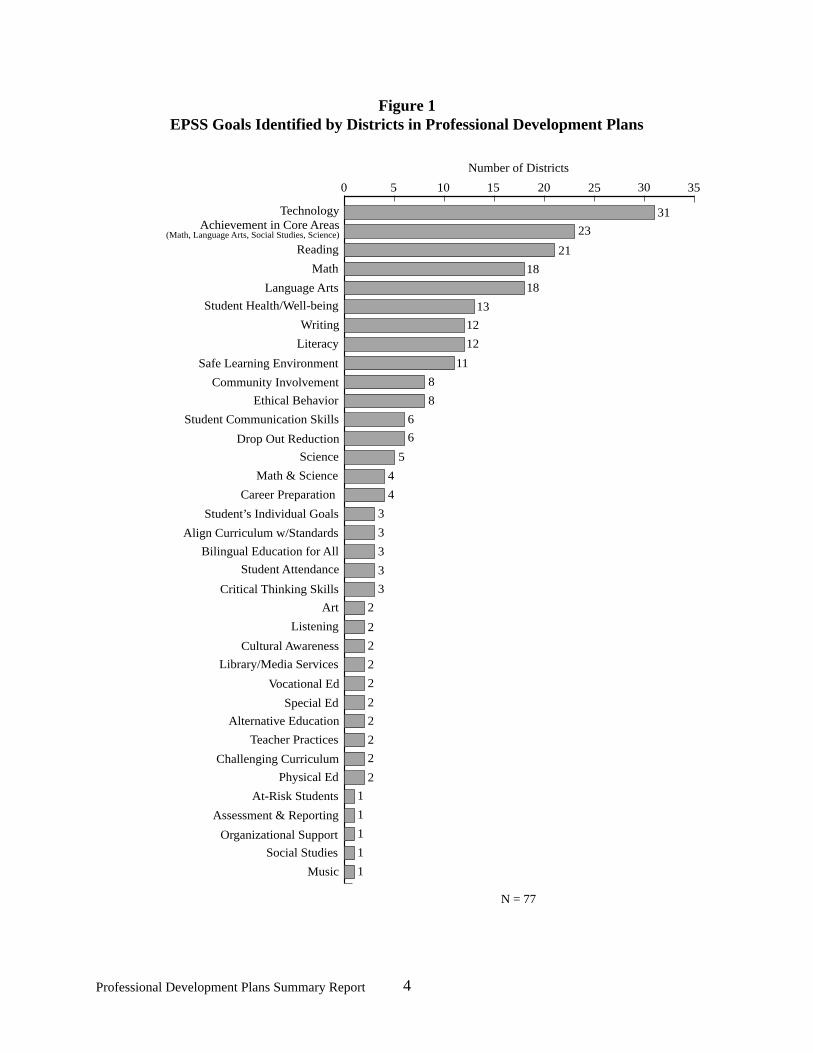
The EPSS goals for each district were compiled to produce a summary of all the EPSS goals forthe 77 District Plans submitted. There were a total of 240 goals for the 77 districts. As can beseen in Figure 1, there are a large number of unique goals (N=36) identified by the districts intheir Professional Development Plans. The goals range from topics related to traditionaleducational issues (Student Achievement, Curriculum Alignment) to more holistic issues such asCommunity Involvement and Ethical Behavior. Thirty-one districts identified Technology as agoal, which may reflect the greater need of schools to update their available technology resourcesand the increased emphasis on such skills in the modern world. Student Achievement in the fourcore areas of language arts, math, science, and social studies was identified as an EPSS goal by23 districts, indicating a need to improve the overall education of students.
A number of districts identified specific subject areas as EPSS Goals. The number of districtsthat identified Language Arts as a focus area was 18, while other districts specified specificaspects of Language Arts. A total of 21 districts specified Reading goals, while 12 districtsidentified Literacy and 12 Writing goals. A total of 18 districts identified Math as an EPSS goal,while 4 districts identified Math and Science as an EPSS goal. Five districts identified Scienceas an EPSS goal. Several districts focused on different electives as goals.
In addition, districts identified goals related to curriculum development and alignment in allareas, as well as goals related to teacher’s practices. Districts also addressed concerns aboutissues such as school safety, student well-being and development, cultural awareness, drop-outrates, and community involvement through their EPSS goals. The variety of the EPSS goalsreflect the unique needs of the diverse districts throughout the state. While many of these goalsare shared, reflecting common statewide needs in professional development, the less commongoals indicate areas of special need in districts.
0 5 10 15 20 25 30 35
Music
Social Studies
Organizational Support
Assessment & Reporting
At-Risk Students
Physical Ed
Challenging Curriculum
Teacher Practices
Alternative Education
Special Ed
Vocational Ed
Library/Media Services
Cultural Awareness
Listening
Art
Critical Thinking Skills
Student Attendance
Bilingual Education for All
Align Curriculum w/Standards
Student’s Individual Goals
Career Preparation
Math & Science
Science
Drop Out Reduction
Student Communication Skills
Ethical Behavior
Community Involvement
Safe Learning Environment
Literacy
Writing
Student Health/Well-being
Language Arts
Math
Reading
Achievement in Core Areas(Math, Language Arts, Social Studies, Science)
Technology 31
23
21
18
18
13
12
12
11
8
8
6
6
5
4
4
3
3
3
3
3
2
2
2
2
2
2
2
2
2
2
1
1
1
1
1
Number of Districts
N = 77
4Professional Development Plans Summary Report
Figure 1EPSS Goals Identified by Districts in Professional Development Plans
0 10 20 30 40 50
Math & Science
Science
Electives
Community Involvement
Curriculum Reform
Math
Supportive Learning Environment
Achievement in Core Areas
Technology
Student Health & Behavior
Humanities
Number of Districts
N = 77
46
37
31
20
23
18
13
8
5
5
4
5Professional Development Plans Summary Report
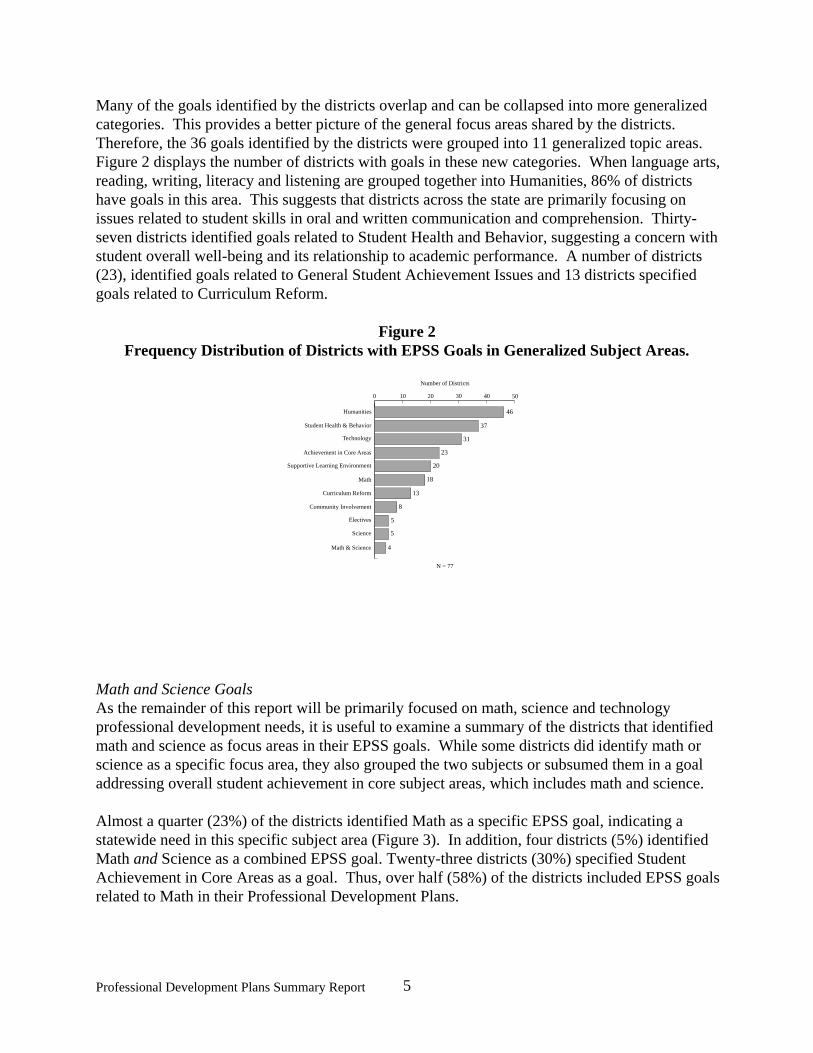
Many of the goals identified by the districts overlap and can be collapsed into more generalizedcategories. This provides a better picture of the general focus areas shared by the districts. Therefore, the 36 goals identified by the districts were grouped into 11 generalized topic areas. Figure 2 displays the number of districts with goals in these new categories. When language arts,reading, writing, literacy and listening are grouped together into Humanities, 86% of districtshave goals in this area. This suggests that districts across the state are primarily focusing onissues related to student skills in oral and written communication and comprehension. Thirty-seven districts identified goals related to Student Health and Behavior, suggesting a concern withstudent overall well-being and its relationship to academic performance. A number of districts(23), identified goals related to General Student Achievement Issues and 13 districts specifiedgoals related to Curriculum Reform.
Figure 2Frequency Distribution of Districts with EPSS Goals in Generalized Subject Areas.
Math and Science GoalsAs the remainder of this report will be primarily focused on math, science and technologyprofessional development needs, it is useful to examine a summary of the districts that identifiedmath and science as focus areas in their EPSS goals. While some districts did identify math orscience as a specific focus area, they also grouped the two subjects or subsumed them in a goaladdressing overall student achievement in core subject areas, which includes math and science.
Almost a quarter (23%) of the districts identified Math as a specific EPSS goal, indicating astatewide need in this specific subject area (Figure 3). In addition, four districts (5%) identifiedMath and Science as a combined EPSS goal. Twenty-three districts (30%) specified StudentAchievement in Core Areas as a goal. Thus, over half (58%) of the districts included EPSS goalsrelated to Math in their Professional Development Plans.

Math23%
Math & Science5%
Core Areas30%
None42%
N = 77
N = 77
Science6%
Math & Science5%
Core Areas30%
None59%
6Professional Development Plans Summary Report
Figure 3Percentage of Districts with EPSS Goals Related to Math
Only 6% of the districts included Science as a separate EPSS goal (Figure 4). When this iscombined with the districts identifying Math and Science and Core Area Achievement, theoverall percentage of districts including an EPSS goal related to Science is 41%. This issubstantially less than the number of districts reporting Math as an EPSS goal.
Figure 4Percentage of Districts with EPSS Goals related to Science
7Professional Development Plans Summary Report
Math, Science, and Technology Goals The following section will provide a summary of the strategies, as well as available and neededresources for math, science, and technology goals.
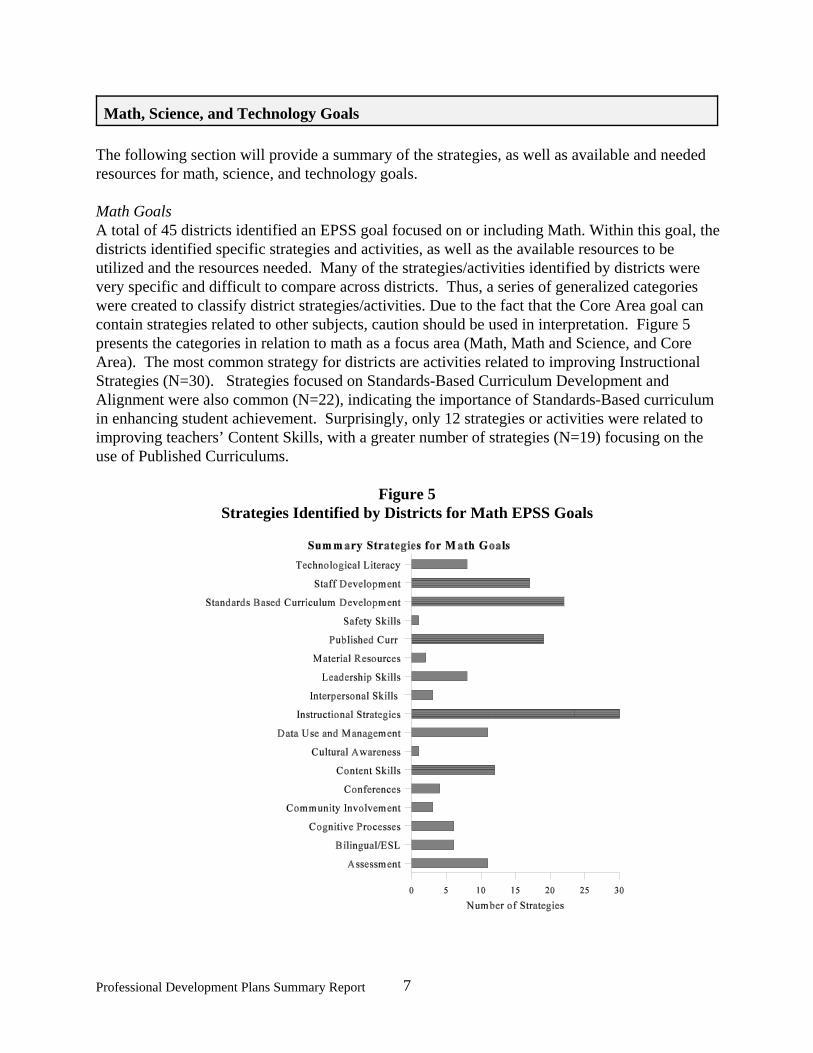
Math GoalsA total of 45 districts identified an EPSS goal focused on or including Math. Within this goal, thedistricts identified specific strategies and activities, as well as the available resources to beutilized and the resources needed. Many of the strategies/activities identified by districts werevery specific and difficult to compare across districts. Thus, a series of generalized categorieswere created to classify district strategies/activities. Due to the fact that the Core Area goal cancontain strategies related to other subjects, caution should be used in interpretation. Figure 5presents the categories in relation to math as a focus area (Math, Math and Science, and CoreArea). The most common strategy for districts are activities related to improving InstructionalStrategies (N=30). Strategies focused on Standards-Based Curriculum Development andAlignment were also common (N=22), indicating the importance of Standards-Based curriculumin enhancing student achievement. Surprisingly, only 12 strategies or activities were related toimproving teachers’ Content Skills, with a greater number of strategies (N=19) focusing on theuse of Published Curriculums.
Figure 5Strategies Identified by Districts for Math EPSS Goals

8Professional Development Plans Summary Report
*CSPD, Tech Funds**UCAN, Northern Network, ENMERC/SNMERC
Assessment activities in Math include Assessment Techniques and CTBS Workshops forTeachers. Strategies classified as Content Skills included Logical Reasoning and Everyday FactsTraining, and Teaching Problem Solving Strategies to Students. Data Use and ManagementStrategies include Training in Analysis of CTBS Test Results, and the Use of Assessment andClassroom Data. Instructional Strategies include workshops on Computerized Math Instruction,Standards-Based and Project Based Training, and Calculus and Applied Math Courses. A varietyof Published Curriculums are cited as strategies, including Josten’s Computer Lab, Saxon MathProgram, and Opening Eyes to Math. Many of these programs are computer-based and/or usemanipulatives in instruction. Leadership Skills strategies include activities such as ProfessionalCoaching, Trainer of Trainers workshops, and EPSS Team Planning. Standards BasedCurriculum Development and Alignment strategies include alignment activities, as well asCurriculum Revision and Developing District Curriculums. Technological Literacy refers tostrategies focused on developing teachers’ and staff’s ability to utilize computers, distancelearning and other technological resources.
Resources AvailableFigure 6 displays the most common resources available to districts identifying Math as an EPSSgoal. Districts often identified multiple resources for each EPSS goal. Operational (N=29) andTitle II (N=23) funds are the most commonly identified resources. In addition, Title I (N=13)and Title VI (N=10) are common. IDEA funds (N=13) are also providing a source for activitiesrelated to math. In addition, 10 districts identify available resources from ENMERC andSNMERC, while 7 districts identify RCCs and RECs as resources. A number of districts (11)identified Institutes of Higher Education and Junior/Community Colleges as providing resourcessuch as continuing education courses and workshop instructors. It is interesting to note that only2 districts identified Eisenhower Funds as an available resource, despite the potential for suchfunds to be used in activities related to math achievement. Districts also identified staff time(N=14) and materials (N=9) as resources.
Figure 6Available Resources and Funds for Math Goals
9Professional Development Plans Summary Report
Resources NeededDistricts did not provide a great deal of information on the needed resources for Math activities. In many cases, the districts identified the available resources as providing for all of their statedgoals. Twenty-seven districts specify the need for additional funding, while 19 districts indicate aneed for experts to provide training and 19 require professional materials, such as curriculumguides and books. Specific examples of resources include updated Accelerated Math Programs,Travel/Transportation, Consultants to Link EPSS to Curriculum and Manipulatives.
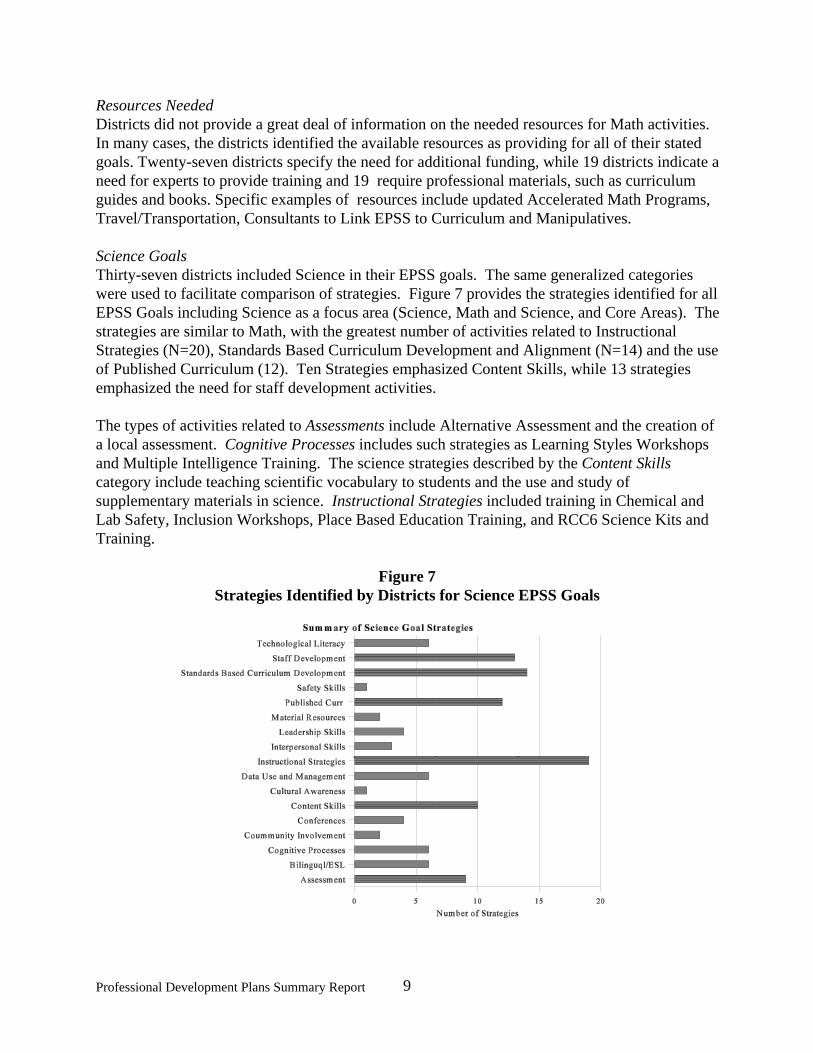
Science GoalsThirty-seven districts included Science in their EPSS goals. The same generalized categorieswere used to facilitate comparison of strategies. Figure 7 provides the strategies identified for allEPSS Goals including Science as a focus area (Science, Math and Science, and Core Areas). Thestrategies are similar to Math, with the greatest number of activities related to InstructionalStrategies (N=20), Standards Based Curriculum Development and Alignment (N=14) and the useof Published Curriculum (12). Ten Strategies emphasized Content Skills, while 13 strategiesemphasized the need for staff development activities.
The types of activities related to Assessments include Alternative Assessment and the creation ofa local assessment. Cognitive Processes includes such strategies as Learning Styles Workshopsand Multiple Intelligence Training. The science strategies described by the Content Skillscategory include teaching scientific vocabulary to students and the use and study ofsupplementary materials in science. Instructional Strategies included training in Chemical andLab Safety, Inclusion Workshops, Place Based Education Training, and RCC6 Science Kits andTraining.
Figure 7Strategies Identified by Districts for Science EPSS Goals

10Professional Development Plans Summary Report
*Re:Learning, Technology Funds, CSPD**UCAN, Northern Network, ENMERD/SNMERC
Resources AvailableThe resources available for science activities also parallel that of math activities, as can be seenin Figure 8. The most predominant source of funds is operational (24 districts), with Title I(N=12), Title II (N=15), and IDEA (N=14) funds also common. Resources from IHEs (N=8),RCC/RECs (N=5) and ENMERC/SNMERC (N=8) are also utilized for strategies related toScience goals. Districts also identified staff time (N=10) and materials (N=6) as resources.
Figure 8Available Resources and Funds for Science
Resources NeededThe resources needed for activities related to science are not provided in detail by the districts. Eighteen districts indicate a need for more funding and 16 describe the need for materials, suchas books, science kits, and professional literature. The additional resources needed for activitiesrange from software and hardware, to staff time and stipends. Specific examples of neededresources are Grant Writing Training, Resource Lists, and Parental/Community Involvement.
Technology GoalsThe strategies described for the 31 districts with Technology EPSS goals are much more specific,due to the specialized skills encompassed in this category. Once again, the strategies wereclassified into generalized categories to facilitate the analysis. Figure 9 presents the summarizedstrategies for the districts with Technology EPSS goals. Technological Literacy was by far themost common strategy (N=20). Activities addressing Instructional Strategies (N=12) and usingPublished Curriculum (N=8) were also common.

11Professional Development Plans Summary Report
Figure 9Strategies Identified by Districts for Technology EPSS Goals
Technological Literacy encompassed activities such as CD and Software training, ComputerCourses for Teachers, Computer Literacy Training, and use of Internet. Instructional Strategiesincluded workshops on Integrating Technology in the Classroom, Scholastic Network Training,and SPED Training. Published Curriculum identified as a strategy included the Math StarProgram, and CORD Curriculum.
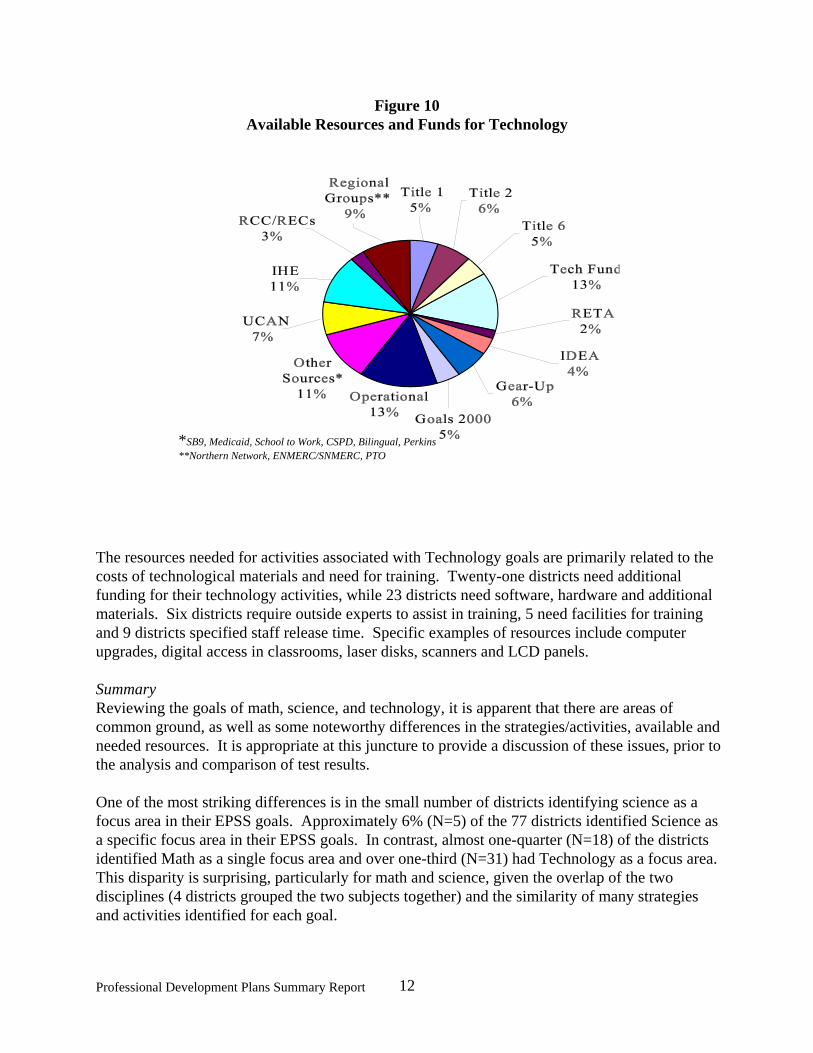
Sources of funding for Technology goals are less likely to come from Federal Title programs.Instead, a number of districts (N=14) identify Technology funding sources, such asTechnological Literacy Challenge Funds (TLCF) and other similar grants (Figure 10). The mostcommon resources were Operational Funds (N=16) and Institutes of Higher Education, which 12districts cited as providing training, facilities, and partnerships. Seven districts identified Gear-Up as a resource. Eight districts singled out the UCAN Rural Systemic Initiative as an availableresource, while 13 districts identified various regional groups, such as RCCs, Northern Network,and ENMERC/SNMERC. A variety of different sources were cited by a smaller number ofdistricts, including IDEA, Medicaid, School to Work, RETA, Bilingual, and Perkins.
12Professional Development Plans Summary Report
*SB9, Medicaid, School to Work, CSPD, Bilingual, Perkins**Northern Network, ENMERC/SNMERC, PTO
Figure 10Available Resources and Funds for Technology
The resources needed for activities associated with Technology goals are primarily related to thecosts of technological materials and need for training. Twenty-one districts need additionalfunding for their technology activities, while 23 districts need software, hardware and additionalmaterials. Six districts require outside experts to assist in training, 5 need facilities for trainingand 9 districts specified staff release time. Specific examples of resources include computerupgrades, digital access in classrooms, laser disks, scanners and LCD panels.
SummaryReviewing the goals of math, science, and technology, it is apparent that there are areas ofcommon ground, as well as some noteworthy differences in the strategies/activities, available andneeded resources. It is appropriate at this juncture to provide a discussion of these issues, prior tothe analysis and comparison of test results.
One of the most striking differences is in the small number of districts identifying science as afocus area in their EPSS goals. Approximately 6% (N=5) of the 77 districts identified Science asa specific focus area in their EPSS goals. In contrast, almost one-quarter (N=18) of the districtsidentified Math as a single focus area and over one-third (N=31) had Technology as a focus area. This disparity is surprising, particularly for math and science, given the overlap of the twodisciplines (4 districts grouped the two subjects together) and the similarity of many strategiesand activities identified for each goal.
13Professional Development Plans Summary Report
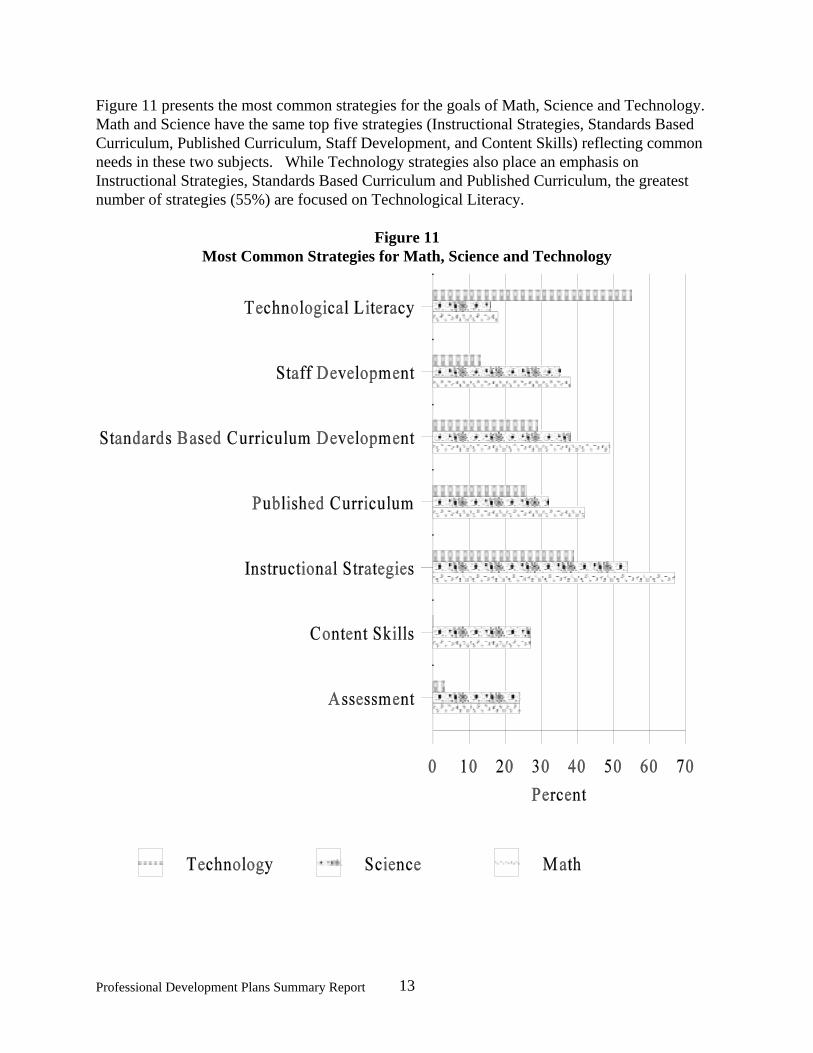
Figure 11 presents the most common strategies for the goals of Math, Science and Technology.Math and Science have the same top five strategies (Instructional Strategies, Standards BasedCurriculum, Published Curriculum, Staff Development, and Content Skills) reflecting commonneeds in these two subjects. While Technology strategies also place an emphasis onInstructional Strategies, Standards Based Curriculum and Published Curriculum, the greatestnumber of strategies (55%) are focused on Technological Literacy.
Figure 11Most Common Strategies for Math, Science and Technology
14Professional Development Plans Summary Report
Given that the strategies for math and science are alike, it is not surprising that the fundingsources are extremely similar (see Figures 6 and 8), with the most common sources of fundsOperational and Title I. In contrast, Technology resources primarily come from specificTechnology funds and Operational accounts, which is most likely a function of the restrictionsplaced on various funds for their use.
It is somewhat unusual that such a large gap exists in the number of districts with math goalsversus those with science. If funding sources and strategies are similar for math and science,then it seems reasonable that districts could address both subject areas, maximizing time, energyand resources. One explanation would be that math represents a greater area of need in terms ofstudent performance, thus the higher number of districts focusing on the subject. The nextchapter addresses possible explanations for differences through analysis of Terra Nova results.
The resources needed identified for the three goals were similar, with an emphasis on additionalfunding and materials. Staff time, substitutes, and stipends were common needs across the threegoals. Naturally, technology goals required more specific resources in terms of computermaterials, such as hardware, software, scanners, and internet access in classrooms. However,many math and science strategies required specific published software programs forimplementation, as well as training for teachers in their applications and integration intoinstructional practice. In general, districts did not provide a significant amount of detailregarding specific needs in professional development, a trend that was present across all theEPSS goals identified.

15Professional Development Plans Summary Report
Linking District Professional Development Plans & Terra Nova
The District Professional Development Plans are based on district EPSS goals which are aproduct of a comprehensive process of school and community examination of needs. Onecomponent of the guide to formulating EPSS goals is an examination of student attainment. Thissection examines the relationship between student achievement results on one assessment, theTerra Nova New Mexico Supplement, with the District Professional Development Plans. Thereader is cautioned that there are many factors examined by the district and community informulating their EPSS goals. Student achievement is only one aspect of the educational systemto be considered in developing district plans.
The NM Terra Nova was administered to students in the 4 , 6 and 8 grades during the 1998-99th th th
school year. “This criterion-reference assessment reports a student’s standing relative to the NewMexico’s Standards for Excellence. There are four performance levels for New Mexico students:Beginning Step, Nearing Proficiency, Proficient, and Advanced. These levels constitute a set ofperformance standards that have been established by a panel of teachers and educatorsrepresenting a number of school systems in the state.” (Guide to Test Interpretation, Spring 1999;NM Achievement Assessment Program). Proficiency levels are provided in each of thefollowing areas: Math, Science, Language, and Social Studies.
The assessment results for the 77 school districts were examined to determine the number ofdistricts where 25% or fewer students were judged Proficient or Advanced in each of the fourcontent areas assessed. Figure 12 presents these results for the 77 districts.
Figure 12Number of Districts with 25% or Fewer Students Proficient or Advanced
in Each Content Area as Measured by the New Mexico Terra Nova 1998-99
16Professional Development Plans Summary Report
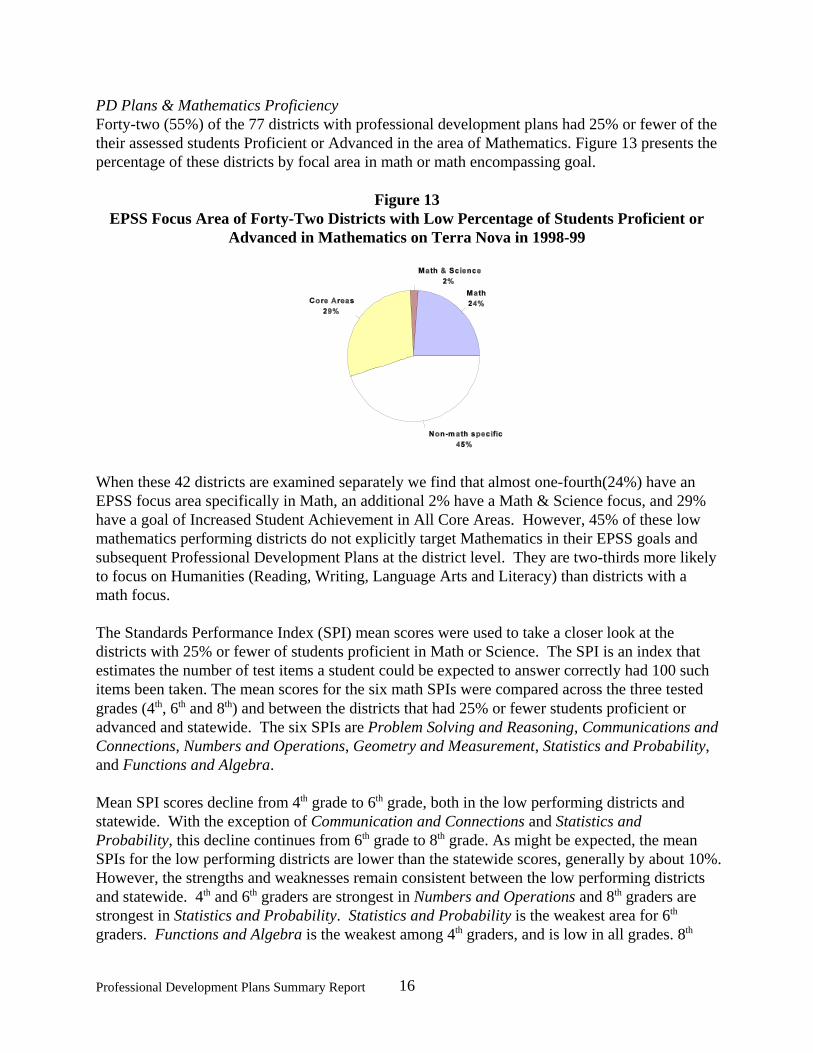
PD Plans & Mathematics ProficiencyForty-two (55%) of the 77 districts with professional development plans had 25% or fewer of thetheir assessed students Proficient or Advanced in the area of Mathematics. Figure 13 presents thepercentage of these districts by focal area in math or math encompassing goal.
Figure 13EPSS Focus Area of Forty-Two Districts with Low Percentage of Students Proficient or
Advanced in Mathematics on Terra Nova in 1998-99
When these 42 districts are examined separately we find that almost one-fourth(24%) have anEPSS focus area specifically in Math, an additional 2% have a Math & Science focus, and 29%have a goal of Increased Student Achievement in All Core Areas. However, 45% of these lowmathematics performing districts do not explicitly target Mathematics in their EPSS goals andsubsequent Professional Development Plans at the district level. They are two-thirds more likelyto focus on Humanities (Reading, Writing, Language Arts and Literacy) than districts with amath focus.
The Standards Performance Index (SPI) mean scores were used to take a closer look at thedistricts with 25% or fewer of students proficient in Math or Science. The SPI is an index thatestimates the number of test items a student could be expected to answer correctly had 100 suchitems been taken. The mean scores for the six math SPIs were compared across the three testedgrades (4 , 6 and 8 ) and between the districts that had 25% or fewer students proficient orth th th
advanced and statewide. The six SPIs are Problem Solving and Reasoning, Communications andConnections, Numbers and Operations, Geometry and Measurement, Statistics and Probability,and Functions and Algebra.
Mean SPI scores decline from 4 grade to 6 grade, both in the low performing districts andth th
statewide. With the exception of Communication and Connections and Statistics andProbability, this decline continues from 6 grade to 8 grade. As might be expected, the meanth th
SPIs for the low performing districts are lower than the statewide scores, generally by about 10%. However, the strengths and weaknesses remain consistent between the low performing districtsand statewide. 4 and 6 graders are strongest in Numbers and Operations and 8 graders areth th th
strongest in Statistics and Probability. Statistics and Probability is the weakest area for 6th
graders. Functions and Algebra is the weakest among 4 graders, and is low in all grades. 8th th
17Professional Development Plans Summary Report
graders are particularly weak in Geometry and Measurement, with scores more than 20% lowerthan the next lowest score (Functions and Algebra).
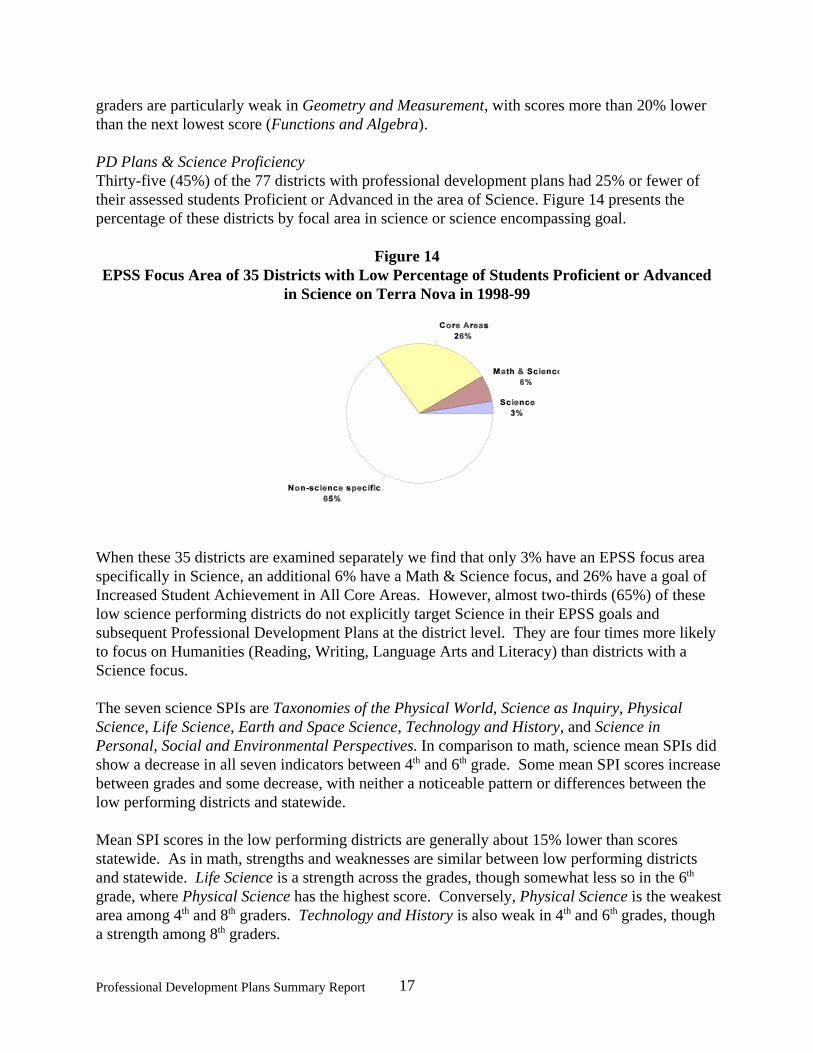
PD Plans & Science ProficiencyThirty-five (45%) of the 77 districts with professional development plans had 25% or fewer oftheir assessed students Proficient or Advanced in the area of Science. Figure 14 presents thepercentage of these districts by focal area in science or science encompassing goal.
Figure 14EPSS Focus Area of 35 Districts with Low Percentage of Students Proficient or Advanced
in Science on Terra Nova in 1998-99
When these 35 districts are examined separately we find that only 3% have an EPSS focus areaspecifically in Science, an additional 6% have a Math & Science focus, and 26% have a goal ofIncreased Student Achievement in All Core Areas. However, almost two-thirds (65%) of theselow science performing districts do not explicitly target Science in their EPSS goals andsubsequent Professional Development Plans at the district level. They are four times more likelyto focus on Humanities (Reading, Writing, Language Arts and Literacy) than districts with aScience focus.
The seven science SPIs are Taxonomies of the Physical World, Science as Inquiry, PhysicalScience, Life Science, Earth and Space Science, Technology and History, and Science inPersonal, Social and Environmental Perspectives. In comparison to math, science mean SPIs didshow a decrease in all seven indicators between 4 and 6 grade. Some mean SPI scores increaseth th
between grades and some decrease, with neither a noticeable pattern or differences between thelow performing districts and statewide.
Mean SPI scores in the low performing districts are generally about 15% lower than scoresstatewide. As in math, strengths and weaknesses are similar between low performing districtsand statewide. Life Science is a strength across the grades, though somewhat less so in the 6th
grade, where Physical Science has the highest score. Conversely, Physical Science is the weakestarea among 4 and 8 graders. Technology and History is also weak in 4 and 6 grades, thoughth th th th
a strength among 8 graders.th
18Professional Development Plans Summary Report
Recommendations
One of the goals of this summary report of District Professional Development Plans was toprovide a “Big Picture” overview of professional development needs in the state, to identifythose areas of common need, particularly in the areas of math, science, and technology. Based onthese findings, a number of recommendations can be made to assist the SDE, the Districts, andthe Professional Development Community in future endeavors.
Professional Development Planning RecommendationsIn the review and summary of the district plans, it was evident that there was some confusionregarding the required components and purpose of the plan, as well as the format to utilize inreporting. As this was the first year of the process, it is not unusual to find this confusion. Inaddition, the staff and time available for districts to complete the plans most likely impacted theprocess.
The SDE, Districts and educational system may benefit from the implementation of an integratedcomputer based strategic planning tool. Professional development plans could be tied directly toEPSS and the data that supports district goals would be embedded. The advantage of providingdistricts with common software would allow simple data entry through selection from pre-determined lists, limited descriptive fields, and check boxes would be two-fold. First, districtswould be able to reduce the amount of time and effort expended on plan preparation and developmore focused plans. Second, SDE would have all plans in a common, comparable format tofacilitate the review and approval process. An additional benefit of a database system would bethe opportunity to link together districts with common Professional Development needs, as manyPD plans described strategies involving visiting districts with successful programs or partneringwith districts for workshops and/or conferences. Software is already available to perform thesefunctions and could be evaluated to determine its appropriateness for New Mexico schools.
Comments and Recommendations on EPSS GoalsIn the initial analysis of plans, it was immediately evident that Science was not a popular focusarea for Districts in comparison to other subjects such as Language Arts and Math. Out of 77districts, only 5 had goals directed specifically towards science. The majority of districts hadgoals focused on Language Arts areas, such as reading, literacy, writing, and listening. A largenumber of districts recognized the importance of a student’s personal well-being and theprovision of a safe and comfortable learning environment. The emphasis on goals directedtowards these issues, as well as goals targeting greater parental and community involvement, willcontribute to a stronger program of student success.
However, evidence from the New Mexico Terra Nova 1998-99 assessment does not directlysupport this preponderance of goals focused on Language Arts. Only 9 districts of the 77 hadlow percentages of assessed students Proficient or Advanced in the Language Arts. On the otherhand, over half (N=42) of the districts had low percentages of students Proficient or Advanced inMath and 45% (N=35) in Science. On the basis of test data, Language Arts does not appear to be

19Professional Development Plans Summary Report
an area of urgent need. It is not clear why districts chose to address such a large number of goalson the subject. Terra Nova data indicated that only 2 of the 77 districts had low percentages ofProficient or Advanced students in Social Studies, which most likely explains the presence ofonly one EPSS goal addressing this subject.
As presented earlier, almost half of the low performing mathematics districts did not have anygoals targeting Math, whereas two-thirds (65%) of low performing districts in science did nothave goals addressing science. A closer examination of Terra Nova results through the meanscores for the six Math SPIs and seven Science SPIs did not provide any evidence to support thelack of math and/or science goals in low performing districts. The mean SPIs in Math for lowperforming districts are 10% lower than statewide SPIs, and the mean Science SPIs are 15%lower. The SPIs provide an indication of what students are able to know and do in the four majorcontent areas (Language Arts, Math, Science, Social Studies).
The presence of goals contradictory to Terra Nova Assessment results is not of concern, as muchas the absence of certain goals. It is unusual that many districts are selecting goals not focusedon areas of weakness in student performance. Senate Bill 110 directed districts to developframeworks to “improve and enhance student achievement.” The many diverse goals addressedby the districts are all devoted to the ultimate goal of improving student success, however, thelack of goals targeting specific, known weak subject areas does not contribute towards thisprocess.
Future plans need to have a stronger foundation in the application and integration of availabledata. Many districts did utilize data from alternative assessments and surveys to develop theirprofessional development plans and needs, it is this kind of data based decision making thatneeds to become a formal part of the planning process. A number of districts also requestedprofessional development in the area of data use and management, as well as strategic planning,acknowledging the need for skill in these areas. While certain EPSS goals may provide acomfort zone in terms of familiarity, the development of more challenging goals should not be adifficult process. In particular, districts should be aware of the opportunity to express theirresource needs, whether in the form of funding, materials or actual training and guidance. TheProfessional Development Community will be better able to serve districts through well-articulated, data driven EPSS goals.
The resources needed aspect of activities was not addressed in detail by many districts, whichwas unfortunate, as it did not allow a detailed analysis of the types of resources needed to addressdifferent EPSS goals. While many districts reported that the strategies and activities identifieddid not require additional resources, it is not clear whether the districts were aware of the widearray of potential resources. The implementation of a computer based planning tool would assistdistrict staff in the potential applications of the plans, particularly in providing assistance andresources for professional development within districts.
20P
rofessional Developm
ent Plans S
umm
ary Report
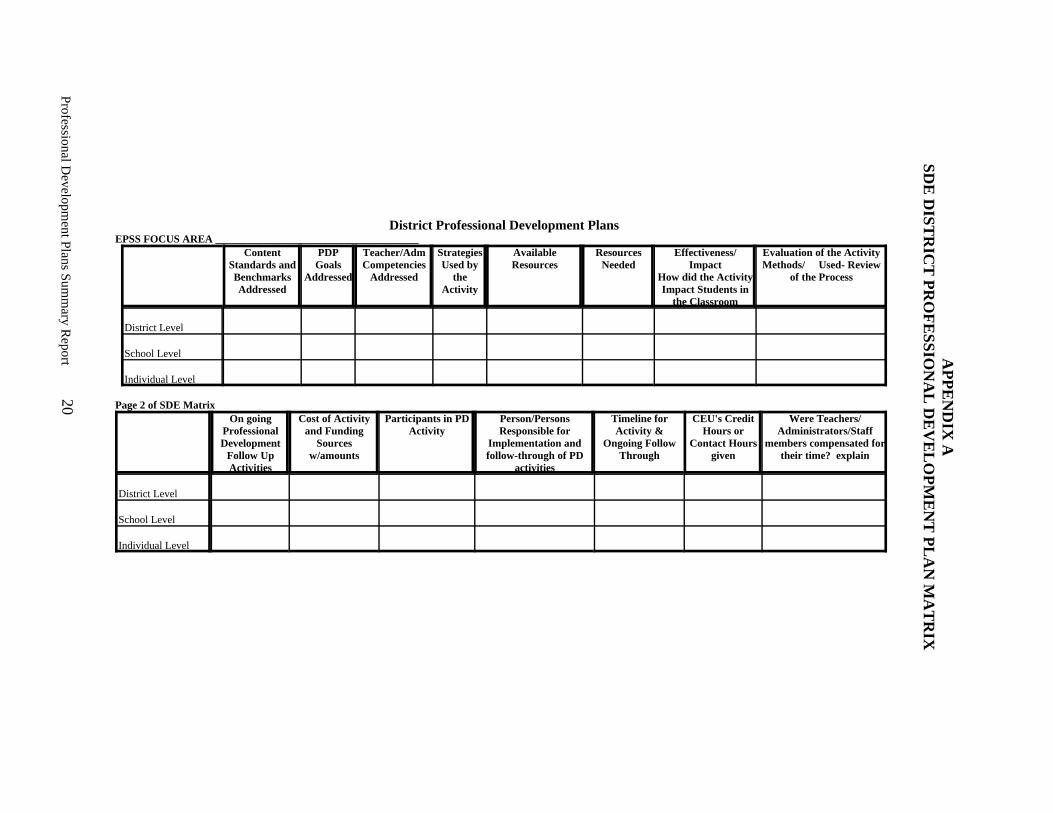
District Professional Development PlansEPSS FOCUS AREA ______________________________________
ContentStandards andBenchmarksAddressed
PDPGoals
Addressed
Teacher/AdmCompetencies
Addressed
StrategiesUsed by
theActivity
AvailableResources
ResourcesNeeded
Effectiveness/Impact
How did the ActivityImpact Students in
the Classroom
Evaluation of the ActivityMethods/ Used- Review
of the Process
District Level
School Level
Individual Level
Page 2 of SDE MatrixOn going
ProfessionalDevelopment
Follow UpActivities
Cost of Activityand Funding
Sourcesw/amounts
Participants in PDActivity
Person/PersonsResponsible for
Implementation andfollow-through of PD
activities
Timeline forActivity &
Ongoing FollowThrough
CEU's CreditHours or
Contact Hoursgiven
Were Teachers/Administrators/Staff
members compensated fortheir time? explain
District Level
School Level
Individual Level
AP
PE
ND
IX A
SD
E D
IST
RIC
T P
RO
FE
SS
ION
AL D
EV
ELO
PM
EN
T P
LAN
MA
TR
IX

21P
rofessional Developm
ent Plans S
umm
ary Report
New Mexico School District P.D. Plans
DISTRICT NAME:
DISTRICT CODE:
EPSS GOALSPDP
AddressedActivity/Strategy andFollow-Up Activities
ResourcesAvailable/Sources of Funds
ResourcesNeeded
AP
PE
ND
IX B
SU
MM
AR
Y M
AT
RIX