Embed Size (px)
Citation preview
NEW PENSION SYSTEM AND ITS IMPACT ONGOVERNMENT OF KERALA AND ITS EMPLOYEES
M. S. Ansar* and P. Arunachalam**
SOCIAL SECURITY AND CIVIL SERVICE PENSION SYSTEM
From time immemorial, societies have attempted in various ways to protect peoplefrom social and economic adversities. The arrangements a society makes to meetthe essential subsistence needs and contingencies of its members constitute itssocial security system. Historically people have looked to their families, clans,tribes, communities, religious groups and authorities – lords, chiefs and kings – tomeet their needs for social security. Social security has been recognised as aninstrument for social transformation and progress. It represents, basically a systemof protection of individuals who are in need of such protection by the State as anagent of the society. Such protection is relevant in contingencies such as retirement,resignation, retrenchment, death, disablement which are beyond the control ofthe individual members of the society. In 1958, Prof. Samuelson demonstratedthat social security could improve the lot of each person in society. The processesof industrialization and urbanisation, that have swept the world over the past twohundred years, have profoundly affected social security arrangements everywhere(Ghai, 2002).
The Civil Service Pension (CSP) is considered as an important component ofthe broader concept of social security (Rajan and Prasad, 2008). According to Blake(2006) pension is a stream of payments that starts when someone retires andcontinues until they die. So pension is an example of life annuity. Bodie (1990)pension provides life time income security in retirement for however long theretiree lives. Wise (1986) viewed pension as an important incentive device in labourcontracts, affecting employee turnover, work effort, and the timing of retirement.Friedberg and Webb (2005) defined pension as a form of compensation deferreduntil a worker leaves his or her job.
I J A B E R, Vol. 14, No. 6, (2016): 4973-4998
* Research Scholar.** Professor, Department of Applied Economics, Cochin University of Science and Technology, Kochi-
22.

4974 � M. S. Ansar and P. Arunachalam
As per Article 366 (17) of the Constitution of India; pension means a pension,whether contributory or not, includes retired pay, gratuity and any sum or sumspayable to a person (Bakshi, 1998). Honourable Supreme Court of India, in ajudgment in the case of D.S.Nakara and Others Vs. Union of India, defined pensionas “a term applied to periodic money payments to a person who retires at a certainage considered as age of disability; payments usually continue for the rest of thenatural life of the recipient” (AIR, 1983, SC, 130).
Honourable Supreme Court of India held that a pension scheme consistentwith available resources must provide that “the pensioner would be able to livefree from want, with decency, independence and self-respect and at a standardequivalent at the pre-retirement level” (AIR, 1983, SC, 130). The fundamentalobjective of any pension system is to provide income security in old age (Beattieand McGillivray, 1995). Palacios and Whitehouse (2006) state the objectives forproviding pension to government employees as securing the independence ofpublic servants, making a career in public service attractive, shifting the cost ofremunerating public servants in to the future and retiring older civil servants in apolitically and socially acceptable way.
In many countries CSP evolved much before the establishment of a formalsocial security system. United Kingdom is considered as one of the pioneers in theestablishment of formal pension system. But pension was initially considered asex-gratia in UK.In countries like Germany, France and Mexico pension was a legalright from the very inception of the system. In our country the CSP system wasstarted by the British and so it was considered initially as an ex-gratia as in the UKbut later it become a right of employees (RBI, 2003).
The CSP System in India covers the entire gamut of the salaried workforce inCentral and State governments and Union Territory Administrations. Within theCentral Government, pension schemes are organized by occupation, with separateschemes - which have somewhat different rules of eligibility – for railways,telecommunications, defense, and other employees. Central Government and allState Governments, till recently, followed Pay-as-You-go (PAYG) Defined Benefit(DB) pension scheme with no contribution from employees. No fund is set asidefor the payments of future retirement benefits and payment to retirees is financedby current income (GOI, 2002).
State Governments have its own pension rules which are more or less similarto the rules of Central Government. While all State Governments’ employees areentitled to pensionary benefits, most States also extend such benefits to employeesin grants-in-aid educational institutions; urban local bodies such as municipalities;panchayat raj institutions, etc. In the case of these institutions, there is, however,no uniformity among the States in respect of collections of contributions or in the

New Pension System and its Impact on Government of Kerala... � 4975
payment of the quantum of pension. In a few States, the Government collects somecontribution from these institutions, while in others no contribution is collected.The benefits also vary from State to State. Some States pay pension to the employeesof these institutions on par with the Government servants and others provide alower amount as pension (RBI, 2003).
Union Government adopted the New Pension Scheme (NPS) with effect from01-01-2004 which is applicable to all new entrants to Central Government Service,except to Armed Forces, joining Central Government Service on or after 01-01-2004 (RBI, 2003). The new scheme is Defined Contribution (DC) pension schemewhere contributions are defined in advance, but the benefits depend on the returnon investments. The NPS is implementedin majority of Indian states for the newentrants. Government of Kerala introduced NPS for new recruits from 01-04-2013.But for the existing employees DB pension scheme is continuing.
STATEMENT OF THE PROBLEM
In Kerala, except for the recruits from 01-04-2013, pensions are mandatory and re-distributive in principle and based on PAYG-DB pension system. Employees makeno contribution and entire pension expenditure is born by the state. As the pensionliabilities have not been backed by any funding arrangements, they, perforce, areto be met through budgetary resources, thereby causing heavy drag on the stateexchequer. So the DB pension system imposes relatively higher risks and fiscalliability on the State Government as compared to other schemes or theircombinations.
The pension crisis is a universal phenomenon and many countries face risingpension expenditure, often combined with significant pensioner poverty. Theproblem is attributed to various trends, notably a pincer movement between risinglife expectancy and lower birth rates (Barr, 2006b). Kerala is also facing the problemof lower birth rate and rising life expectancy. Crude Birth Rate in Kerala is lessthan 15 in 2013 compared to more than 21 at national level (SRS Tables, 2013). Lifeexpectancy on the other hand is 75 compared to 68 in India. People are livinglonger; this is a wonderful thing— longer healthy life. The problem is not thatpeople are living longer, but that they retire too early (Barr, 2006b).
Life Expectancy and retirement age of selected Countries and Southern statesare shown in the Table 1. The difference between the retirement age and lifeexpectancy is high in France followed by Japan. In India the difference is 8 and inKerala it is 19 years for the employees under DB pension system and 15 for theemployees under NPS. The difference is 10 in Tamil Nadu and 8 in Andhra Pradeshand Karnataka. The low retirement age and high life expectancy resulted in theincrease in the number of pensioners in the state. Tenth State Pay Commission

4976 � M. S. Ansar and P. Arunachalam
Table 1Life Expectancy and Retirement Age – Southern States and Selected Countries
Countries/States Life Expectancy in 2013 Retirement Age Difference
Japan 84 65 19USA 79 66 13UK* 81 65 16Germany 81 65.3 15.7France 82 62 20China# 75 60 15Pakistan 66 60 6Sri Lanka 75 60 15Bhutan 68 60 8Nepal 68 58 10India 68 60 8Kerala 75 56 19Tamil Nadu 70 60 10Andhra Pradesh 68 60 8Karnataka 68 60 8
* 62.4 for women, # 55 for womenSource:Palacios and White house (2006), GOK (2010), WHO (2015) and Life tables of Registrar
General of India
observed that pension burden was the most glaring in Kerala “as Kerala has oneof the lowest retirement ages among the Indian states and the longevity was thehighest” (GOK, 2015).
Pension for employees who joined before 01-04-2013 is indexed to both salariesand prices in Kerala. While price indexation occurs every six months, pay andpension revision takes place normally in five years. The pay revision increasespension of new pensioners and pension revision boost up pension of existingpensioners. The price and salary indexation along with pension revisions havebeen contributing to the gradual increase in pension payments. It is not surprisingthat expenditure for pension benefits has been growing since the formation of thestate. During 1957-58 pension expenditure was less than one crore. The pensionexpenditure expected during 2016-17 may be more than ‘15,000/-crore. As apercentage of Gross State Domestic Product (GSDP), revenue expenditure, revenuereceipts and own revenue, pension expenditure has been increasing in Kerala.
OBJECTIVE OF THE STUDY
This paper is based on the objective of studying the Civil Service Pension Systemin Kerala

New Pension System and its Impact on Government of Kerala... � 4977
SIGNIFICANCE OF THE STUDY
Growing CSP expenditure is a problem faced many states in India. Majority ofstates including Kerala, therefore, switched over to NPS where contribution notbenefit is defined in advance. Available literature shows that even though thereare some studies about the CSP benefits and expenditure of the CentralGovernment, there is no study about the CSP benefits and expenditure in Kerala.The present study is intended to fill this research gap.
METHODOLOGY OF THE STUDY
Various studies at the national level, Central Pay Commissions, State PayCommissions and Finance Commissions pointed out the inadequate data ofpensioners and pension payments in India. Thirteenth Finance Commission at itsreport noted that data on pensioners and their profiles are generally not availableand emphasised the need of maintaining proper records. Kerala State PayCommissions also confronted with the problem of inadequate pensioners’ data(GOK, 2006; 2010; 2015). So data for this study were collected cautiously.
The present study is based on both primary and secondary data.
SECONDARY DATA
After the approval of pension and related benefits, Accountant General sent onecopy of pension payment order to the pensioner and one copy to the treasurychosen by the pensioner. The first pension and pensionary benefits are paid fromthe chosen treasury. From the second month onwards the pensioner can get pensioneither through the bank opted by him/her or through the treasury itself. In case ofdeath of a pensioner who has been getting pension through bank the bank willinform the same to the treasury and Accountant General. So details of all pensionersare available in the treasuries. There are 227 treasuries in Kerala in addition tothree Regional Directorates and one Directorate. Pension was paid through 205treasuries (www.treasury.kerala.gov.in). Details of present service pensioners andfamily pensioners as on 31.03.2015 were collected form all the treasuries acrossKerala. The details, which were collected before the implementation of latestpension revision (wef 01.07.2014) in January 2016, include address of the pensioners,basic pension, date of retirement, date of birth, date of death etc. So the basic pensioncollected was pre-revised basic pension.
Publications of World Bank and Asian Development Bank, Union Budgets,State Budgets, Economic Surveys, Economic Reviews, Reports of Central and StatePay Commissions, Publications of Economic and Statistics Department of Keralaand Kerala Planning Board, Reports of Comptroller and Auditor General, Reports
4978 � M. S. Ansar and P. Arunachalam
and Publications of Planning Commission, Publications of Reserve Bank of Indiaand Publications of Central Statistical Organisation were the other main sourcesof secondary data.
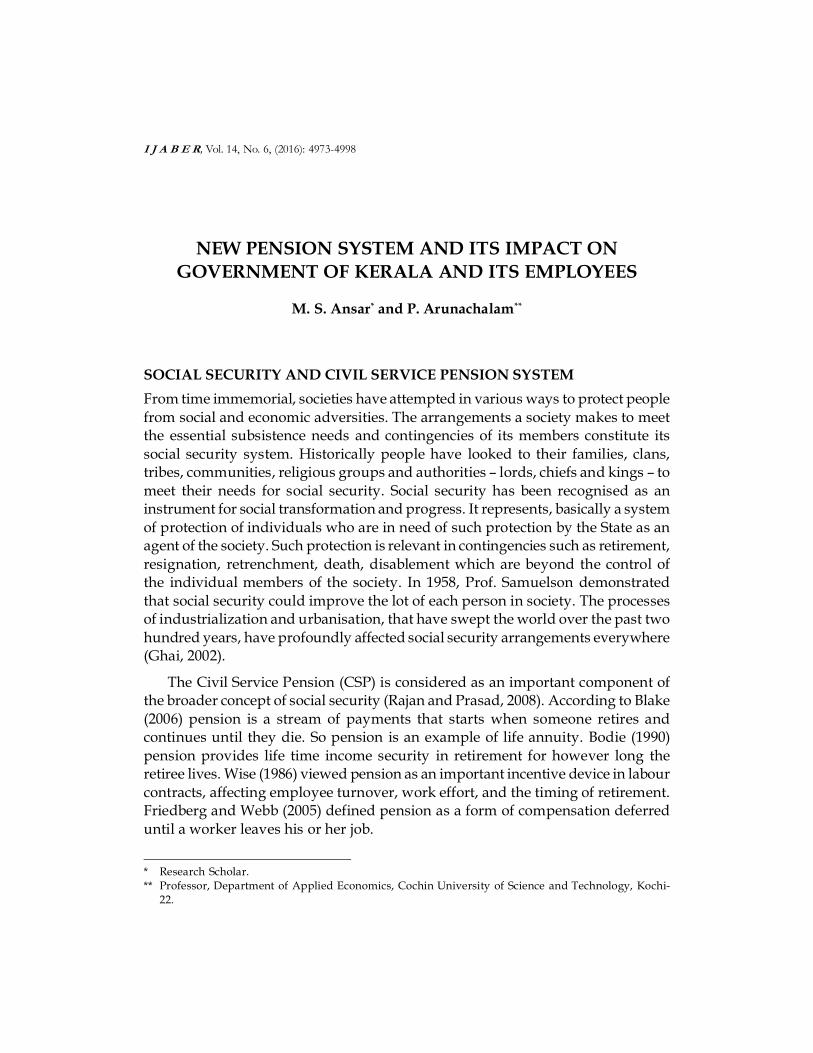
PRIMARY DATA
On the basis of basic pension, the service pensioners of the state were groupedinto four groups as presented in the Table 1.2. 700 pensioners were randomlyselected keeping the proportion to each group. Questionnaire was sent to somepensioners and data were collected personally from others. Some pensioners didnot respond and some did not provide answers to many questions. Among the700 pensioners, 500 pensioners who answered most of the questions were selectedwithout affecting the proportion.
Table 2Primary Data -Sample Size and Proportion to Total Pensioners
Basic Pension Groups Number % to Total Data Collected % to TotalSample Size
5000 or Less 85,406 26.03 130 26.00
5001-10000 1,17,585 35.83 179 35.80
10001-15000 1,02,143 31.13 156 31.20
15000+ 15,765 7.01 35 7.00
Total 3,28,152 100.00 500 100.00
Source:Data collected from Treasuries as on 31.03.2015
To supplement the primary data, discussions were held with the pensionershaving different basic pay and age .Discussions were also held with experts in thefield of finance, researchers in social security, leaders of state level serviceorganisations and pension organisations.
DATA ANALYSIS
Major statistical tools used in this study are Ratio analysis, ANOVA, Duncan test,Chi-Square test and Linear Regression.
PERIOD OF THE STUDY
The study is based on budgetary pension expenditure of Kerala for the twentyfive year period from 1990-91 to 2014-2015. Basic pension and age wise expenditureanalysis is done for the ten year period from 2004-05 to 2014-15, as basicpensiondetails are available for this period only.

New Pension System and its Impact on Government of Kerala... � 4979
During the last 25 years there are serious efforts around the World to reformthe CSP. Even though the pension system of countries differs the main reason forthe initiation of pension reform is more or less the same – increasing pensionexpenditure (RBI, 2003). Due to the same reason Union Government implementedNew Pension System (NPS) based on Defined Contribution (DC) system for thosewho join service wef 01.01.2004. Following the footsteps of Central Governmentall states except West Bengal and Tripura implemented the scheme. KeralaGovernment implemented the NPS wef 01/04/2013.
THE NPS
NPS consists of two tiers. The first tier is mandatory with 10% (of basic and DA)contribution by the new recruits with the matching contribution by theGovernment. The second tier is voluntary and there is no minimum or maximumlimit in the contribution of employees. But there is no contribution of Governmentin the second tier (GOI, 2003). The contribution of the employee along with thematching contribution of the Government has been transferring to individual nonwithdrawable pension account so as to invest the same as per the provisions ofGovernment of India / Pension Fund Regulatory and Development Authority(PFRDA), a statutory body constituted by the Government of India. The PFRDAwas established in 2003 to promote old age income security by establishing,developing and regulating pension funds and to protect the interests of thesubscribers (Sadhak, 2013).
Employees can normally exit at or after 60 years for tier I of NPS. At the time ofnormal exit it is mandatory for the employees to invest 40% of the pension wealthto purchase an annuity from an Insurance Regulatory and Development Authorityof India(IRDA) regulated Life Insurance Company. There is no restriction in theutilization of the remaining 60% of the pension amount. If an employee leave tierI before attaining 60 years the mandatory investment limit is 80% (GOI 2003).
GAIN/LOSS TO THE STATE GOVERNMENT
NPS is introduced to overcome the burgeoning pension burden but noassessment is made in Kerala whether it is beneficial to the state/employees.Thefollowing assumptions are made for estimating the impact of NPS on Governmentof Kerala:
1) The average basic pay of 11,174 employees joined during 2013-14 (datafrom Service and Payroll Administrative Repository for Kerala (SPARK))was Rs. 12,421/- So it is the average basic pay of employees joined during2013-14 under NPS is taken as Rs. 12,400/-.

4980 � M. S. Ansar and P. Arunachalam
2) The employees are eligible for annual increment and promotion. So,following Sanyal, Gayithri and Erappa (2011) who assumed 3% annualincrease in pay for estimating pension liability of Central Governmentfor the next 100 years, 3% annual increase in pay is assumed.
3) Government has been sanctioning DA twice in a year. A 10% annual DAis assumed for coming years.
4) Pay and pension revisions are implementing in Kerala once in every fiveyears. Last pay revision was wef 01/07/2014. Government sanctioned12% hike in the salary of employees after merging the DA as on 01/07/2014. It is assumed that there shall be pay revision for every five yearsand 12% hike shall be sanctioned after merging DA. Weightage given bythe pay revisions for length of service is ignored.
5) Last pension revision sanctioned 18% hike in the basic pension ofpensioners after merging the existing DR. So this percentage and mergingof DR is assumed for future pension revision which shall be implementedin every five years.
6) Even though there are pensioners aged more than 100 years, their numberis very less. Presently there are only 35 pensioners (0.01%) aged morethan 100 years. So, following Sanyal, Gayithri and Erappa (2011), it isassumed that pensioners may live only up to 100 years.
7) It is also assumed that Government will appoint fresh employees withinone year after the retirement of employees and that all vacancies due toretirement shall be filled. Tenth State Pay Commission (GOK, 2015)estimated that average service period of employees under DB system is23 years. So it is assumed that average service period of employees underDB pension system is 23 years and under NPS is 27 years.
8) Present contribution (10% of pay and DA) of employees and Governmentunder NPS shall continue.
9) Retirement age of employees under NPS (60 years) and under DB pensionsystem (56 years) shall continue.
10) Tenth State Pay Commission estimated that the number of retirement incoming years shall be 21,800 per year. This estimation is taken forestimation of pensioners for the coming years. It is also assumed that thepresent death rate of pensioner shall continue for the coming years
The number of pensioners up to March 2081 is estimated and presented in theFigure 1. The number of pensioners under the DB system may reach at its maximumin 2036 and may become zero in 2081. The first batch of pensioners under the NPSsystem may emerge from 2040 after the successful competition of 27 years of service.

New Pension System and its Impact on Government of Kerala... � 4981
The expenditure for pension for pensioners under the DB system and NPS up to2080-81 is estimated and presented in the table- 3. The pension expenditureassuming that NPS is not introduced is also given in the Table 3.
Table 3. Estimated Pension Expenditure With and Without NPS(Rs. Crores)
Pension Expenditure with NPS
Year Pension Expenditure Pension for Pensioners Contribution ofwithout NPS under DB system Govt. to NPS
2020-21 18,022 18,022 1,0712025-26 34,998 34,998 3,4702030-31 65,195 65,195 9,1942035-36 113,648 113,648 22,1822040-41 172,685 164,657 43,1932045-46 299,813 228,955 80,2132050-51 523,883 303,226 148,9632055-56 906,338 370,684 276,6372060-61 1,556,538 398,114 513,7402065-66 2,698,892 360,001 954,0612070-71 4,684,020 226,938 1,771,7772075-76 8,234,115 93,350 3,290,3492080-81 14,271,336 - 6,110,473
Source: Estimated values
Figure 1. Estimated Number of Pensioners from 2015-16 to 2080-81
Source:Estimated Figures

4982 � M. S. Ansar and P. Arunachalam
So even if the number of pensioners, who are under DB system, may decreaseafter 2036 (See Figure 1) the pension expenditure may increase further till 2058-59due to DR and pension revisions (See Figure 2). The pension expenditure due tothe present DB system may become zero only during 2080-81.
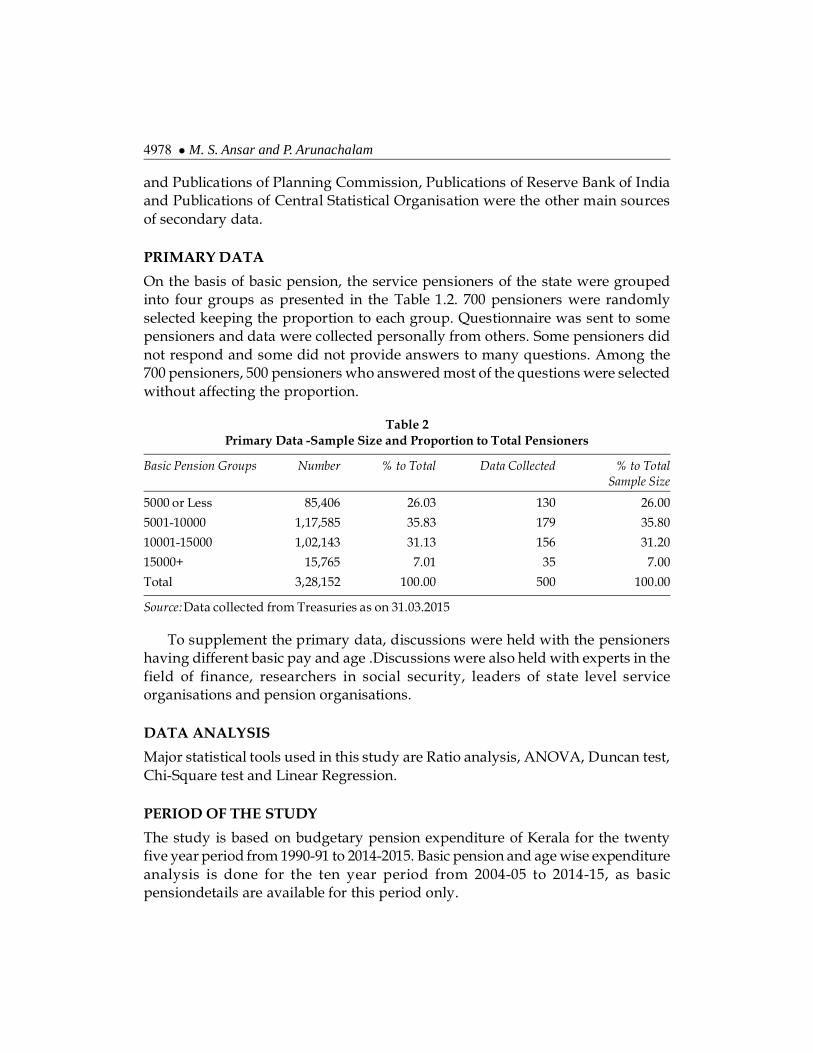
The real benefit to Government due to the introduction of NPS, which is thedifference between the pension expenditure with and without the introduction ofNPS (See Table 3) is presented in the Figure 3. Anand and Ahuja (2004) found thatthe pension reforms entail inter-generation planning for long-term fiscalconsolidation and may start yielding benefits only after 35 years or so. As per theestimates, Kerala Government may get benefit thirty three years after theimplementation of the NPS i.e. from 2047-48. The benefit may be as high as Rs.80.23 lakh crore during 2080-81. So NPS is beneficial to Government of Kerala inlong run.
GAIN/LOSS TO THE EMPLOYEES
As per the provisions of NPS, employees who retire at the age of 60 have to invest40% of pension assets in an annuity plan of IRDA regulated Life InsuranceCompany. But the annuity market in India is still small and underdeveloped whichmanifests itself in its small size relative to other insurance (James and Song, 2001).However some immediate annuity plans are presently available in India. LIC, SBI,
Figure 2: Estimated Pension Expenditure for Pensioners under DB System for thePeriod from 2015-16 to 2080-81
Source:Estimated values
(inRs. Crores)
New Pension System and its Impact on Government of Kerala... � 4983
Reliance, Shriram Life Insurance, Star Union Dai-Ichi, Tata AIA life group etc.have introduced immediate annuity plans.
IMMEDIATE ANNUITY PLAN OF LIC AND SBI
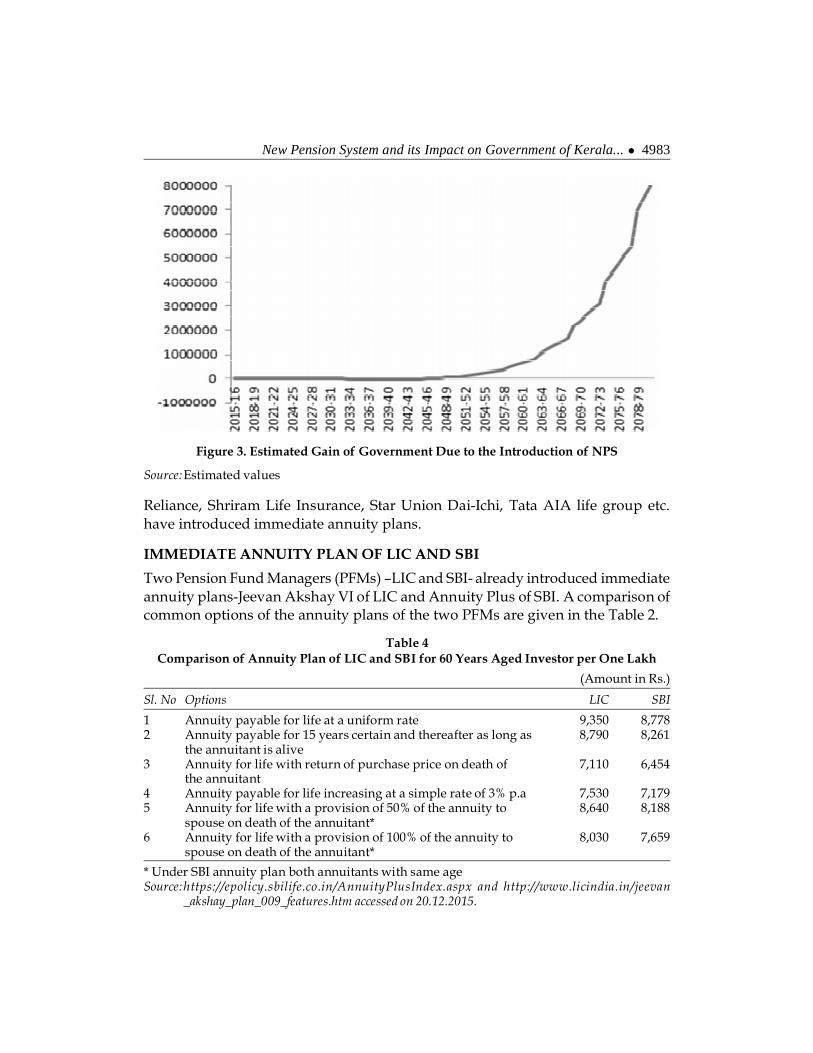
Two Pension Fund Managers (PFMs) –LIC and SBI- already introduced immediateannuity plans-Jeevan Akshay VI of LIC and Annuity Plus of SBI. A comparison ofcommon options of the annuity plans of the two PFMs are given in the Table 2.
Table 4Comparison of Annuity Plan of LIC and SBI for 60 Years Aged Investor per One Lakh
(Amount in Rs.)
Sl. No Options LIC SBI
1 Annuity payable for life at a uniform rate 9,350 8,7782 Annuity payable for 15 years certain and thereafter as long as 8,790 8,261
the annuitant is alive3 Annuity for life with return of purchase price on death of 7,110 6,454
the annuitant4 Annuity payable for life increasing at a simple rate of 3% p.a 7,530 7,1795 Annuity for life with a provision of 50% of the annuity to 8,640 8,188
spouse on death of the annuitant*6 Annuity for life with a provision of 100% of the annuity to 8,030 7,659
spouse on death of the annuitant*
* Under SBI annuity plan both annuitants with same ageSource:https://epolicy.sbilife.co.in/AnnuityPlusIndex.aspx and http://www.licindia.in/jeevan
_akshay_plan_009_features.htm accessed on 20.12.2015.
Figure 3. Estimated Gain of Government Due to the Introduction of NPS
Source:Estimated values

4984 � M. S. Ansar and P. Arunachalam
The annuity plan of LIC is found more attractive. It provides highest annuityunder all the options. Annuity plan of LIC is therefore used for assessing the lossor gain of employees.
CASE OF FOUR EMPLOYEES AND ASSUMPTIONS
In order to assess how much is the loss or gain to the employee due to theintroduction of NPS in Kerala, case of four employees who retired in 2015 afterthirty years of service were taken. The first employee joined as Assistant Engineerin Kerala Public Works Department and retired as Chief Engineer. So he joinedservice in the Gazetted Rank. The second employee joined as Assistant Grade II inthe Kerala Government Secretariat and retired as Special Secretary. The joiningpost of third employee was Lower Division Clerk in the Agricultural Departmentof Kerala Government and retired as Senior Superintendent in 2015. These twoemployees joined in the Non-Gazetted posts. The fourth employee was a class IVstaff who also joined service in 1985 in the Revenue Department of KeralaGovernment and retired in 2015. In order to make comparisons and calculationseasier the joining of the four real cases were considered as 01/07/1985 and theirretirement as 30/06/2015.
Taking these four real cases as models 20 other cases with different period ofservice (25 years, 20 years, 15 years, 10 years and 5 years) were developed. As perNPS there is no deduction from the pay and DA arrears. So in these cases also nodeduction of NPS subscription from arrears of salary is calculated. The followingassumptions are made:
1) Government of Kerala introduced the NPS wef 01/01/1985.2) All the employees in a cadre have same promotional avenues. So all
employees in the same cadre get promotion in the same time interval.3) All the employees join service on first July.4) Date of effect of all pay revisions and promotions are first July.5) As there is delay of more than five months in the declaration of DA in
Kerala, it is assumed that there is six month delay in the date of effect ofDA.
6) The Compound Annual Growth Rate of assets under each PFM as on31.03.2015 was higher than 10% . So CAGR for the thirty year period isassumed as 10%.
PAY REVISIONS
During the thirty year period between 1985 and 2015 there were five pay revisions.The details these pay revisions were shown in the Table 3

New Pension System and its Impact on Government of Kerala... � 4985
Table 5Pay Revisions During 1985-2015
Sl. No Pay Revision Year of Pay Fixation CriteriaImplementation
1 Fifth 1989 Pay +22% DA +1/3% weightage (minimumRs.60/-)for each year
2 Sixth 1993 Pay +7% of Pay3 Seventh 1998 Pay +148% DA +1% weightage for each year+10% of
Pay as Fitment (minimum Rs. 250/-)4 Eight 2006 Pay+59% DA + 6% of Pay as fitment (minimum 350)
+One increment for four years (maximum fourincrements)
5 Ninth 2011 Pay+64% DA+10% of Pay as Fitment (minimum1000)+1/2% for each year
Source:Various Government orders implementing Pay Revisions.
As there is no deduction of contribution from the arrears, the date of effect ofpay revisions is treated as first July of the Year of Government Order. Basic Pay oftwenty cases, which were developed from the four real cases, was calculated onthe basis of the pay fixation formula of each pay revision.
DEARNESS ALLOWANCE
The DA sanctioned by Government of Kerala during the thirty year period is givenin Table 6. Six month delay in the actual date of effect of DA revisions is assumed
Table 6Dearness Allowance During 1985-2015
Year January July Year January July
1985 13 18 2000 38 411986 22 26 2001 43 451987 30 35 2002 49 521988 40 45 2003 55 591989 29 34 2004 61 661990 38 43 2005 74 861991 51 60 2006 15 201992 71 62 2007 26 321993 69 73 2008 38 451994 78 85 2009 55 641995 94 102 2010 78 941996 111 119 2011 24 311997 128 140 2012 38 451998 16 22 2013 53 631999 32 37 2014 73 80
Source:Various Kerala Government orders implementing DA.

4986 � M. S. Ansar and P. Arunachalam
as there is delay in the declaration of DA. For example in the DA calculation forthe period from 01/07/1985 to 30/06/1986, DA for January 1985 and July 1985 areconsidered.
CASE OF GAZETTED OFFICERS
A real case of an Assistant Engineer who joined Public Works Department of Keralain 1985 and retired as Chief Engineer in 2015 was taken. He joined the service in thescale of pay of 1050-30-1200-40-2000. His basic pay was ‘1050/-. He got promotionsas Assistant Executive Engineer after 9 years of joining. His other promotions wereafter 14, 18 years, 22 year, 25 years and 28 years of joining. So this employee has totalsix promotions during his entire service period. As per the assumptions all thosewho join service as Assistant Engineer in Public Works Department of KeralaGovernment got promotions after 9,14,18,22,25 and 28 years of joining.
The contribution of the employee and matching contribution of the governmentadded together is 20% of basic pay and DA. The interest for first year is calculatedon the basis of interest calculation for the General Provident Fund ie; the employeeget interest from the date of credit to the end of the year. So employees get twelvemonth interest for first month investment, eleven month interest for second monthinvestment and so on. Final value of pension assets is calculated using the formula:
Value of Pension Assets = Pension Assets at the end of a year *(1+CAGR) number of years
In this analysis CAGR is assumed as 10%. Final value of pension assets is a functionof pay, DA, CAGR and service period. CAGR and DA% are constant for allemployees. Thus higher the pay and service period, higher is the final value ofpension assets.
CASE OF ASSISTANT GRADE II JOINED IN GOVERNMENT SECRETARIAT
A case of an employee who joined in Government Secretariat in 1985 and retiredafter thirty years of service in the rank of Special Secretary was taken. He joined inthe Non Gazetted post (Non-Gazetted A). His basic pay was ‘755/. He got elevenpromotions in his service period which is the highest in all cases. After joiningservice the employee got promotion on 4th, 10th, 12th, 15th, 18th, 21st, 22nd, 24th, 26th,28th and 30th year. As per the assumption, an Assistant Grade II in GovernmentSecretariat got promotions in the same time interval.
CASE OF A LOWER DIVISION CLERK IN GOVERNMENT DEPARTMENT
A case of Lower Division Clerk (Non-Gazetted B) joined in the AgriculturalDepartment of Kerala Government was the next case. He joined service in 1985

New Pension System and its Impact on Government of Kerala... � 4987
and retired in 2015. He got only five promotions during his service period in 8th,13th, 20th, 25thand 28thyears of service.
CASE OF A CLASS IV STAFF IN GOVERNMENT DEPARTMENT
The fourth case is that of a Class IV staff joined in Revenue Department and retiredafter 30 years of service as Class IV staff. He got four time bound higher grade oncompletion of 10, 18, 22 and 27 years of service. Unlike other three cases class IVstaff has the least number of promotions.
FINAL VALUE OF PENSION ASSETS
The final value of pension assets of four categories of employees having differentservice span is summarised in the Table 7. Value of pension assets depend onservice period and basic pay of the employee. Greater the service period greater isthe value of pension assets of an employee. The number of promotions availablein a category also influencing it, as number of promotions affects pay of theemployee. So value of the pension assets of different categories of employees withsame service period varies.
Table 7Value of Pension Assets of Different Categories of Employees with
Different Service Period
(in Rs.)
Period of Service Gazetted Officer Non-Gazetted- Non-Gazetted-B Class IV (C4)(GAZ) A (NGA) (NGB)
30 Years 3,236,889 2,760,974 1,783,210 1,207,17825 Years 2,718,809 2,204,836 1,415,902 1,034,62120 Years 2,202,315 1,471,211 1,071,328 821,78615 Years 1,502,468 915,119 699,372 582,39210 Years 920,171 633,855 4,38,917 358,2795 Years 519,817 318,704 220,125 188,429
Source:Estimated values
The ANOVA is used to work out whether the mean values among differentcategories of employees vary (See Table 8). The results are significant which pointstowards a difference between the mean values.
To identify which mean is different, Duncan’s test is used (See Table - 9). Theresults show that the means of the group are not homogenous subsets. Henceall the four categories are heterogeneous as resembled by the means. The meanannual pension assets are statistically different for employees under differentcategories.
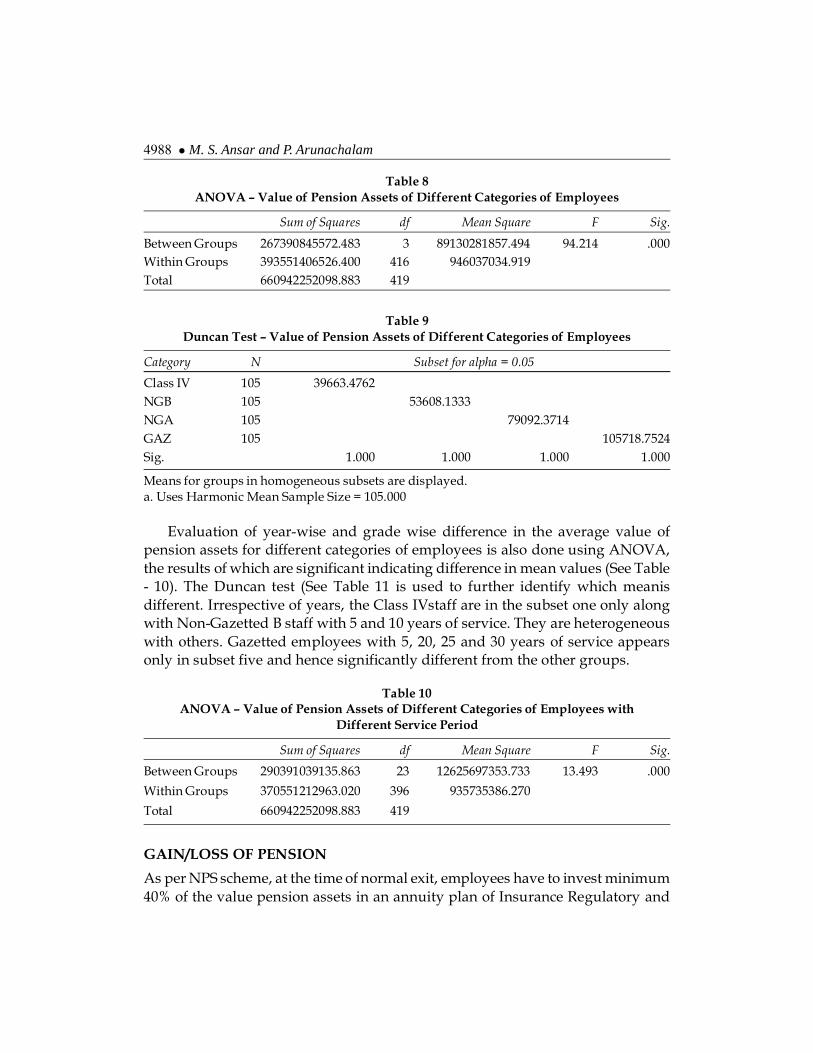
4988 � M. S. Ansar and P. Arunachalam
Table 8ANOVA – Value of Pension Assets of Different Categories of Employees
Sum of Squares df Mean Square F Sig.
Between Groups 267390845572.483 3 89130281857.494 94.214 .000Within Groups 393551406526.400 416 946037034.919Total 660942252098.883 419
Table 9Duncan Test – Value of Pension Assets of Different Categories of Employees
Category N Subset for alpha = 0.05
Class IV 105 39663.4762NGB 105 53608.1333NGA 105 79092.3714GAZ 105 105718.7524Sig. 1.000 1.000 1.000 1.000
Means for groups in homogeneous subsets are displayed.a. Uses Harmonic Mean Sample Size = 105.000
Evaluation of year-wise and grade wise difference in the average value ofpension assets for different categories of employees is also done using ANOVA,the results of which are significant indicating difference in mean values (See Table- 10). The Duncan test (See Table 11 is used to further identify which meanisdifferent. Irrespective of years, the Class IVstaff are in the subset one only alongwith Non-Gazetted B staff with 5 and 10 years of service. They are heterogeneouswith others. Gazetted employees with 5, 20, 25 and 30 years of service appearsonly in subset five and hence significantly different from the other groups.
Table 10ANOVA – Value of Pension Assets of Different Categories of Employees with
Different Service Period
Sum of Squares df Mean Square F Sig.
Between Groups 290391039135.863 23 12625697353.733 13.493 .000
Within Groups 370551212963.020 396 935735386.270
Total 660942252098.883 419
GAIN/LOSS OF PENSION
As per NPS scheme, at the time of normal exit, employees have to invest minimum40% of the value pension assets in an annuity plan of Insurance Regulatory and

New Pension System and its Impact on Government of Kerala... � 4989
Table 11Duncan Test – Value of Pension Assets of Different Categories of Employees with
Different Service Period
Service Period N Subset for alpha = 0.05
1 2 3 4 5
Class IV-10 10 35827.9000
Class IV-5 5 37685.8000
C4-15 15 38826.1333
C4-30 30 40580.4333
C4-20 20 41089.3000
C4-25 25 41384.8400
NGB10 10 43891.7000
NGB5 5 44025.0000
NGB15 15 46624.8000 46624.8000
NGB20 20 53566.4000 53566.4000
NGB25 25 56636.0800 56636.0800
NGB30 30 59440.3333 59440.3333
NGA15 15 61007.9333 61007.9333
NGA10 10 63385.5000 63385.5000 63385.5000
NGA5 5 63740.8000 63740.8000 63740.8000
NGA20 20 73560.5500 73560.5500 73560.5500
NGA25 25 88193.4400 88193.4400 88193.4400
GAZ10 10 92017.1000 92017.1000
NGA30 30 92032.4667 92032.4667
GAZ15 15 100164.5333 100164.5333
GAZ5 5 103963.4000
GAZ30 30 107896.3000
GAZ25 25 108752.3600
GAZ20 20 110115.7500
Sig. .072 .070 .057 .058 .141
Means for groups in homogeneous subsets are displayed.a. Uses Harmonic Mean Sample Size = 12.245.
Development Authority of India (IRDA) regulated Life Insurance Company. Ifthe employee invests 40% of their pension assets in Jeevan Akshay VI of LIC andopts for 100% of annuity for spouse, the pension from the annuity plan is shownin the Table 12 along with the basic pension under DB pension system.

4990 � M. S. Ansar and P. Arunachalam
Table 12Monthly Pensions of Three Categories of Employees Under DB and NPS
(Amount in Rs.)
Service Period Pension under DB system Annuity Under NPS
GAZ NG – A NG – B Class IV GAZ NG - A NG – B Class IV
30 Years 54,000 56,400 27,000 17,850 8,664 7,390 4,773 3,23125 Years 37,083 36,250 19,083 14,125 7,277 5,902 3,790 2,76920 Years 25,800 17,533 12,833 9,050 5,895 3,938 2,868 2,20015 Years 16,763 10,375 8,500 8,500 4,022 2,449 1,872 1,55910 Years 9,675 8,500 8,500 8,500 2,463 1,697 1,175 9595 Years 4,250 4,250 4,250 4,250 1,391 829 589 504
GAZ-Gazetted; NG-Non-GazettedSource: Calculated Values
The employees with thirty years’ service got full pension ie 50% of the averagepay of last ten months. As pension is related to pay and service period, basic pensionof employees having different period of service and different categories ofemployees differ. Class IV employees with 15 and 10 years of service get onlyminimum pension of ‘ 8, 500/-. Employees joined service as secretariat assistant(Non Gazetted A) with thirty years of service get more pension than the employeejoined service as Assistant Engineer because of the more promotion opportunitiesin Secretariat Service. But Non-Gazetted A officer with 25 or less years of serviceget pension less than that of Gazetted Officer with same period of service. Non-Gazetted A officer with 10 years of service and Non-Gazetted B officer with 15and 10 years of service get only minimum pension.
Employees with 9 or less years of service are eligible for ex gratia pension.Exgratia pension is related to only service period not pay or category of employees.So all pensioners with five years of service are eligible for exgratia pension of ‘4250/-. The ratio of minimum to maximum pension received under DB system isabout 1:13. All the employees irrespective of category and service get less pensionunder NPS. The ratio of minimum to maximum pension under NPS is 1:17. Socompared to the DB system, inequality among pensioners under NPS which basedon DC system is high. Williamson (2004) rightly observed that as benefits underDC system is closely linked to contributions, they are less redistributive andtherefore inequality among retirees is greater.
The loss percentage of pension due to the introduction under NPS is presentedin the Table 13. The loss % of pension due to NPS is decreasing as service period isincreasing up to 20 years and then is increasing for all categories of employees.Class IV staff with 10 year or less service are the highest losers. They are also thehighest losers in 15 year category. Loss percentage (with DR) of Class IV staff with

New Pension System and its Impact on Government of Kerala... � 4991
10 year service is as high as 89.65%. This is due to their lower pay compared toothers. Loss of Non-Gazetted Officer B with 30/ 25 years of service and of Class IVstaff with same service is almost same. The lowest loser in 5 year and 10 yearcategory is the employee joined service in gazetted post. Pension loss of employeeswith 20 years of service is more or less same irrespective of their class. The Assistant,who join in Secretariat service, with 30 years of service loss about 87% of basicpension and with 25 years of service loss 83.72%. They are the highest losers in the25 and 30 year category.
Table 13Pension Loss Due to NPS
(in%)
Service Period Basic Pension only Basic Pension With DR of9 % (as on 01.01.2016)
GAZ NG A NG B Class IV GAZ NG A NG B Class IV
30 Years 83.96 86.9 82.32 81.9 85.28 87.98 83.78 83.3925 Years 80.38 83.72 80.14 80.4 82.00 85.06 81.78 82.0220 Years 77.15 77.54 77.65 75.7 79.04 79.39 79.50 77.7015 Years 76.01 76.40 77.98 81.7 77.99 78.34 79.79 83.1710 Years 74.54 80.04 86.18 88.7 76.64 81.68 87.32 89.655 Years 67.27 79.93 86.14 88.1 69.97 81.59 87.29 89.12
GAZ-Gazetted; NG-Non-GazettedSource: Calculated Figures from Table 12
Of course employees under NPS get a lump sum at the time of retirement. Ofthis lump sum 50% is his/her contribution with returns. After investing 40% inannuity scheme the employee get 10% of the value of pension assets. If he invests10% more in annuity plan he get 25% more annuity than shown in the Table 6.10.It may reduce the loss by certain percentage. But in order to get at least the presentbasic pension under DB system the employee has to invest 122.21% to 354.54 % ofthe value of their pension assets as shown in the Table - 14. It is not possible for theemployees, especially the lower category employees to invest more than 100% oftheir pension assets Every increase in DR means increase in the loss percentage tothe pensioners under NPS. Further the pensioners get hike of pension in everyfive years. Tenth Pay commission recommended 18% hike in basic pension andKerala Government sanctioned the same. Since the pension from the annuity planis constant every hike in basic pension and DR increase the loss percentage ofemployees.
While the pensioners under DB system are protected against inflation, there isno such protection under NPS. Of course the pensioners can opt for annual increaseof 3% in annuity. But it will reduce their annuity by about 20% and there shall be

4992 � M. S. Ansar and P. Arunachalam
Table 14Minimum % of the Value of Pension Asset to be Invested to Get Present Basic
Pension Under DB System
Service Period Gazetted Officer Non-Gazetted A Non-Gazetted B Class IV
30 Years 249.31 305.28 226.27 220.9825 Years 203.84 245.68 201.40 204.0420 Years 175.06 178.09 178.98 164.5515 Years 166.71 169.46 181.62 218.0910 Years 157.13 200.35 289.36 354.545 Years 122.21 199.30 288.62 337.30
Source: Calculated from the Table 12.
no family pension. The 3% hike may not be enough to overcome the inflation.Further as discussed in the last chapter service pensioners in Kerala are ageing. Soin long run the real value of annuity may deplete and the aged pensioners underNPS may suffer. OECD (2009, 2013) observed that pension under the DC systemwill diminish across all earning range in long run.
GAIN/LOSS OF FAMILY PENSION
In addition to the pension family of the pensioners are eligible for family pensionunder DB system. Family pension is the 30% of the last pay drawn subject to theminimum of ‘ 8, 500/- and maximum of ‘ 36, 000/-. Family pensioners are eligiblefor DR. Family of exgratia pensioners are eligible family pensions at a fixed rate.Family pension at the higher rate which is half of the pay last drawn or twice theamount of family pension admissible, whichever is less is eligible for the familyfor a maximum period of seven years or till the age of 62 in the case ofsuperannuation at 55 or 67 years of age in case of superannuation at 60. Familypension at the higher rate is not considered for the comparative study.
Table 15Family Pension under DB System
Service Period Family Pension Under DB System (in Rs.)
GAZ NG A NG B Class IV
30 Years 32,400 33,840 16,200 10,71025 Years 26,700 26,100 13,740 10,17020 Years 23,220 15,780 11,550 8,50015 Years 20,115 12,450 9,450 8,50010 Years 17,415 11,250 8,500 8,5005 Years 1,275 1,275 1,275 1,275
GAZ-Gazetted; NG-Non-GazettedSource: Calculated as per Family Pension Rules

New Pension System and its Impact on Government of Kerala... � 4993
As family pension is a function of last pay drawn, it is different forthree different categories of employees and different for employees havingdifferent period of service. Class IV staff get the lowest family pension under DBsystem.
Table 16Family Pension Loss due to NPS
(in %)
Service Period Basic Pension only Basic Pension With DRof 9% (as on 01.01.2016)
GAZ NG A NG B Class IV GAZ NG A NG B Class IV
30 Years 73.26 78.16 70.54 69.83 75.47 79.97 72.97 72.3225 Years 72.75 77.39 72.42 72.77 75.00 79.25 74.69 75.0220 Years 74.61 75.04 75.17 74.12 76.71 77.10 77.22 76.2515 Years 80.00 80.33 80.19 81.66 81.66 81.95 81.83 83.1710 Years 85.86 84.92 86.18 88.72 87.02 86.16 87.32 89.655 Years -9.10 33.1 53.8 60.47 -0.09 38.62 57.62 63.73
GAZ-Gazetted; NG-Non-GazettedSource: Calculated from Table - 4 and Tale 15
The loss of family pension due to NPS is given in the Table - 16. Under NPS thefamily pension without DR of gazetted officer with five years of service may behigher by about 9%. But with DR, there is only negligible gain. Loss of familypension of employees with 20 years of service, irrespective of their category, withor without DR under DB system is almost same.
Thus NPS is beneficial to the Government, but not beneficial to the employees.Further employees may be exposed to the risks of financial market. Study ofSamwick and Skinner (1998) had revealed that DC plans appear to expose workersto more risk from stock and bond rates of return. The pension under NPS, asdiscussed above, may be very low compared to the pension under DB system. Inthe later part of the life it may be difficult for the pensioners to cope up withvagaries of old age and keep their standard of living. So many countries, whichimplemented pension reforms, protected the lowest earners from the pension cut(OECD, 2013).
CONCLUSIONS
This study leads to some major conclusions relating to the CSP system and pensionexpenditurein Kerala. The conclusions are summarised under five heading forbetter understanding of the issue.

4994 � M. S. Ansar and P. Arunachalam
CIVIL SERVICE PENSION SYSTEM
India has separate CSP scheme like other South Asian Countries. The CSP in Indiacovers the salaried workforce in Central and State Governments and UnionTerritory Administrations. State Governments have their own pension rules whichare more or less similar to the rules of Central Government. While all the StateGovernment employees are entitled to pensionary benefits, most States, like Keralaalso extend such benefits to employees in grants-in-aid educational institutions;urban local bodies such as municipalities; panchayat raj institutions, etc.
The rules of the CSP in Kerala are more or less similar to that of the CentralGovernment. Employees with less than ten years of qualifying service, who arenot eligible for statutory pension, are eligible for exgratia pension in Kerala.Pensioners in Kerala are eligible for a simplified version of one rank one pensionscheme. Even though the concept of one rank one pension scheme was notimplemented fully, the scheme removed wide disparity in the pension of pensionersretired during different period by ensuring at least a proportionate share of theminimum pay of the last post.
Taking cue from Central Government, Government of Kerala implementedthe NPS for the recruits from 01-04-2013. The rules of NPS are same in Kerala andat the Centre. As per this scheme there is a mandatory contribution of 10 per cent(of basic and DA) by the employees. The contribution along with the matchingcontribution of the Government has been transferring to individual nonwithdrawable pension account so as to invest the same as per the provisions ofGovernment of India / Pension Fund Regulatory and Development Authority(PFRDA). Employees can normally exit at or after 60 years. At the time of normalexit it is mandatory for the employees to invest 40per cent of the pension wealth topurchase an annuity from an Insurance Regulatory and Development Authorityof India (IRDA) regulated Life Insurance Company.
PENSION EXPENDITURE IN KERALA
Pension Expenditure in Kerala and Southern States has been growing. ANOVAshows no statistically significant difference in the mean pension expenditure ofthe Southern States during the period between 1990-91 and 2014—2015. But aspercentage to GDP, revenue expenditure, revenue receipts and own revenue itwas highest in Kerala compared to Central Government and Southern States duringthe twenty five year period.
The proportion of pensioners in the highest two pension categories (` 10,001-15,000 and ` 15,000+) had been increasing in Kerala compared to the lowest twopension categories (` 5,000 or less and ` 5,001- ` 10,000). Government had been

New Pension System and its Impact on Government of Kerala... � 4995
spending more for the pensioners in the highest pension bracket (` 15,000+ ) whichconstitute only about 7per cent of total pensioners than for pensioners in the lowestpension bracket (` 5,000 or less) which constitute about 26per cent of totalpensioners.
AGEING OF SERVICE PENSIONERS
Service pensioners in Kerala have been ageing. Number of pensioners aged 60+has been increasing. Presently more than 2.75 lakh pensioners are aged 60 years ormore. It is estimated that in 2036 the number may reach 4.62 lakh. As a proportionto total pensioners, oldest old (80 years or more aged) category of pensionersincreased from just 1 per cent in 1991 to13.5per cent in 2016. The old old (70-79years aged) category also witnessed increase in proportion during the period from15.69 per cent to 33.43 per cent. But the proportion of young old (60-69 years aged)pensioners decreased from 83.29per cent to 53.07per cent. The median age of servicepensioners increased from 60 to 67 in 2015. The proportion and median age offemale aged pensioners has been increasing at a faster rate than that of malepensioners.
The proportion of service pensioners aged 60 years or more in the respectiveage groups of population of Kerala has been increasing. Highest increase is seenin the oldest old category. Index of the oldest old to the youngest old servicepensioners has also been increasing. It is estimated that it is about 54 in 2016 anditmay reach as high as 113 in 2036. The index of general population in 2016 may beonly 40 and as per the estimates of Rajan and Aliyar (2009) it may reach 100 in2061. So the estimated index of oldest old of service pensioners is very highcompared to the index of general population. It is an indication that ageing ofservice pensioners is faster than ageing of general population in Kerala.
Due to ageing the number of pensioners has been increasing in Kerala. Increasein the number of pensioners means increase in pension expenditure. Based onthree assumptions-no increase in basic pension, no DR and no new retirement-itis found that ageing alone raised pension expenditure by 123per centduring theperiod between 2005-06 and 2014-15. The impact of ageing is more pronounced inthe case of 80 years or more aged pensioners. It is estimated that due to ageingpension expenditure for the oldest old category of pensioners increased by about275 per cent.
IMPACT OF NEW PENSION SYSTEM
The mounting pressure of increasing pension expenditure prompted Governmentof Kerala to introduce NPS, which is based on DC system, for the recruits from 01-04-2013. The returns of the pension assets of the employee depend on the

4996 � M. S. Ansar and P. Arunachalam
performance of investment made by the PFMs. It is found that the value ofpension assets of the employees depend on the service period and category ofemployees.
As per the provisions of NPS employees who retire at the age of 60 have toinvest minimum 40per cent of their pension assets in an annuity plan of IRDAregulated Life Insurance Company. But the annuity market in India is still smalland underdeveloped which manifests itself in its small size relative to otherinsurance (James and Song, 2001). It is estimated that employees may loss about67per cent to 89per cent of their basic pension due to the introduction of NPSdepending on their category and service. Compared to the DB system, inequalityamong pensioners under NPS which based on DC system may be high. TheGovernment may reap benefit from the NPS from the year 2047-48 and the pensionexpenditure for the pensioners under the DB system may become zero only during2080-81.
EXPENDITURE PATTERN OF PENSIONERS
The majority of pensioners have only one source of income- their pension.Dependency of even employed children on pensioners is found. It is also foundthat more percentage of pensioners retired 25 or more years ago (80 years or moreaged group) save more for their children or grandchildren. But number ofpensioners saves for self-use is increasing among recently retired pensioners. Mostof pensioners spent their pensionary benefits (DCRG, commuted value of pensionand terminal earned leave surrender value) for the welfare of the family.
Majority of pensioners are suffering from one or more than one disease. About63per cent of pensioners, as per this study, can keep the standard of living theyhad prior to retirement. More pensioners in the oldest old category of pensionerskeep the same standard of living before and after retirement. It is found that about70per cent pensioners in this category get pension more than equivalent to theirlast pay inflated to 2009 level.
While 48.04 per cent of pensioners have stated that the present pension helpthem to face uncertainties to a moderate extent, more than 22per centcan face it toa small or very small extent. More than 55 per cent of pensioners find it difficult alltime or some times to meet their monthly expenses with the present pensionamount. Lion share of expenditure of pensioners is for basic needs (food, clothingand electricity and water charges). This study found a positive relationship betweenmonthly pension and monthly expenditure of the pensioners. Linear regressionanalysis shows that with one unit increase in pension, the expenditure wouldincrease by 0.78 units.

New Pension System and its Impact on Government of Kerala... � 4997
POLICY OPTIONS
1) At present Government of Kerala is spending more for higher pension groupwhich constitute only 7per cent of total pensioners than the lowest pensiongroup. Steps may be taken to lower the upper limit of pension. The reductionmay affect only a small proportion of pensioners but it will reduce pensionexpenditure.
2) Government may initiate parametric changes like reducing replacement rateand increasing the average period of calculation of pension for reducing pensionexpenditure.
3) Compared to retirement age of 60 years in majority of states, it is only 56 yearsin Kerala except for few categories of employees. A hike of 4 years of retirementage of existing employees under DB system may reduce pension expenditureby 20.58per cent.
4) Government may provide a minimum pension for lower categories ofemployees who are under the NPS. This may ensure a minimum income forthe employees after retirement.
5) Government may also increase the retirement age of all employees under NPSto 65 so that they can save more for pension.
6) Employees under NPS may be encouraged to save more under Tier II so as toenable them to lead a descent life after retirement.
References
Anand, Mukesh, and Rajeev Ahuja, (2004), “Government Pensions: Liability Estimates andAssumptions”, Economic and Political Weekly, 2569-2576.
Ghai, Dharam, (2002), “Social Security Priorities and Patterns: A Global Perspective”, ILODiscussion Paper No, DP/141/2002 (www,ILO,org).
Rajan, S. Irudaya, and Syam Prasad, (2011), “Pensions and Social Security in India”,in Institutional Provisions and Care for the Aged (115-133), M/s Anthem Press, New Delhi.
Blake, David, (2006), ”Pension Economics”, John Wiley & Sons, USA.
Bodie, Zvi, (1990), Pensions as Retirement Income Insurance, Journal of Economic Literature,28(1), 28-49.
Wise, David,A., (1986), “Pensions, Labour, and Individual Behaviour”, University of ChicagoPress, Chicago.
Friedberg, Leora, and Anthony Webb, (2005), “Retirement and the Evolution of PensionStructure”, Journal of Human Resources, 40(2), 281-308.
Bakshi, P. M., (2013), The Constitution of India Universal Law Publishing, New Delhi.
Beattie, Roger, and Warren McGillivray,(1995), “A Risky Strategy: Reflections On The WorldBank Report Averting The Old Age Crisis”, International social security review, 48(3 4), 5-22.
4998 � M. S. Ansar and P. Arunachalam
Palacios, Robert, and Edward Whitehouse, (2006), “Civil-Service Pension Schemes Around TheWorld”, Social Protection Discussion Paper No 602, World Bank, Washington D.C.
RBI, (2003), “Report of the Group to Study the Pension Liabilities of the State Governments”,Reserve Bank of India.
GOI, (2002), “Report of High Level Expert Group on New Pension System Volume One:MainReport”, Ministry of Personnel, Public Grievances & Pensions, New Delhi.
Barr, Nicholas, (2006b), “Pensions: Overview of the Issues”, Oxford Review of Economic Policy,22(1), 1-14.
OECD (2013), ”Pensions at a Glance 2013: Retirement-income Systems in OECD and G20Indicators”, Organisation for Economic Co-operation and Development, Paris.
GOK, (2015), “Report of the Tenth Pay Revision Commission Report”, Finance Department,Kerala.
James, Estelle and XueSong(2001) “Annuities MarkesAround the World: Money’s Worth andRisk Intermediation”, Technical Report, working Paper 16/01, Center for Research onPensions and welfare Policies, Italy.
Samwick, Andrew A., and Jonathan Skinner, (1998), ”How Will Defined Contribution PensionPlans Affect Retirement Income?”, Working paper No. 6645, National Bureau of EconomicResearch, Cambridge, UK.
Williamson, John, (2004), “Assessing the Notional Defined Contribution Model”, Boston CollegeRetirement Research Center Issues In Brief, Massachusetts.