Embed Size (px)
Citation preview

IDEX Corporation
New products & new markets...
... just the beginning ofwhat sets us apart.
03 ANNUAL REPORT

Letter to Shareholders 02
Operational Excellence Sets the Foundation 04
- Lean Manufacturing/Kaizen
- Six Sigma
- Global Sourcing
- Presence in China
New Product Innovation Sets IDEX Apart 08
Innovation at:
- Pulsafeeder
- Hale Products
- FAST & Fluid Management
- BAND-IT
- Rheodyne
Acquisition Track Record Sets IDEX Apart 12
- Manfred Vetter GmbH
- Classic Engineering, Inc.
- Sponsler Co., Inc.
Business Profile 14
Historical Data 16
Management’s Discussion & Analysis 18
Consolidated FinancialStatements 26
Notes to ConsolidatedFinancial Statements 30
Reports 39
Business Units 40
Corporate Officers & Directors 43
Shareholder Information 44
I DEX Corporation is the world leader in fluid-
handling technologies for positive displacement
pumps, dispensing equipment for color formulation,
and other highly engineered products including
fire suppression equipment, rescue tools, and
stainless steel custom banding.
IDEX products are sold to a wide range
of customers for use in diverse applications
throughout the world.
IDEX is committed to creating sustainable,
profitable growth through:
Leveraging operational excellence tools like
Lean/Kaizen, Six Sigma and Global Sourcing;
Continually innovating new products
and applications; and
Complementing organic growth with high quality,
strategic acquisitions in expanding markets.
TABLE OF CONTENTS
2003 Markets Served 20% Paints & Coatings17% Fire & Rescue11% Machinery10% Chemical Processing7% Water Treatment7% Life Sciences / Medical6% Petroleum – LPG5% Food & Beverage5% Transportation Equipment3% Electronics 9% Other

Years ended December 31, 2003 Change 2002 Change 2001
Results of Operations
Net sales $ 797,920 8 % $ 742,014 2 % $ 726,947
Operating income 109,862 9 100,372 37 73,438
Net income 62,352 15 54,112 65 32,710
Goodwill and trademark
amortization – – – (100) 11,433
Net income excluding goodwill
and trademark amortization 62,352 15 54,112 23 44,143
Financial Position
Working capital $ 108,815 (4)% $ 112,928 (11)% $ 127,565
Total assets 960,739 3 931,050 11 838,804
Total debt 176,546 (27) 241,051 (17) 291,820
Shareholders’ equity 592,102 17 506,791 26 401,112
Performance Measures
Percent of net sales:
Operating income 13.8% 13.5% 10.1%
Net income 7.8 7.3 4.5
Return on average assets 6.6 6.1 4.1
Debt as a percent of
capitalization 23.0 32.2 42.1
Return on average
shareholders’ equity 11.3 11.9 8.4
Per Share Data – Diluted
Net income $ 1.87 12 % $ 1.67 59 % $ 1.05
Goodwill and trademark
amortization – – – (100) .37
Net income excluding goodwill
and trademark amortization 1.87 12 1.67 18 1.42
Cash dividends paid .56 – .56 – .56
Shareholders’ equity 17.95 15 15.60 20 13.05
Other Data
Employees at year end 3,689 (5)% 3,863 – % 3,873
Shareholders at year end 5,700 21 4,700 (15) 5,500
Diluted weighted average
shares outstanding (in 000s) 33,315 3 32,483 5 31,047
IDEX Corporation 2003 Annual Report 01
The company’s business model helped it outperformmajor indices again in 2003. IDEX’s total return on a$100 investment in 1992 was 362% versus 214% forthe S&P 500 and 195% for the Russell 2000.
100
200
300
400
$500
92 93 94 95 96 97 009998 030201
Total Shareholders’ Return
IDEX S&P 500 Index Russell 2000 Index
Since 1992, sales have grown at a compound annualrate of 12.6%. The 8% sales increase in 2003 resultedfrom the inclusion of acquisitions, favorable currencytranslation and a slight increase in base business activity.
100
200
300
400
500
600
700
$800
92 93 94 95 96 97 009998 030201
Net Sales
(in millions)
Economic weakness in recent years reduced IDEX’s 11-year compound annual growth rate to 10.1%. However,the operating leverage developed over the last three yearsshould strengthen the bottom line as the economic environ-ment improves.
.20
.40
.60
.80
1.00
1.20
1.40
1.60
1.80
2.00
$2.20
92 93 94 95 96 97 009998 030201
Diluted Earnings per Share
(continuing operations)
Financial Highlights
(DOLLARS IN THOUSANDS EXCEPT PER SHARE AMOUNTS)
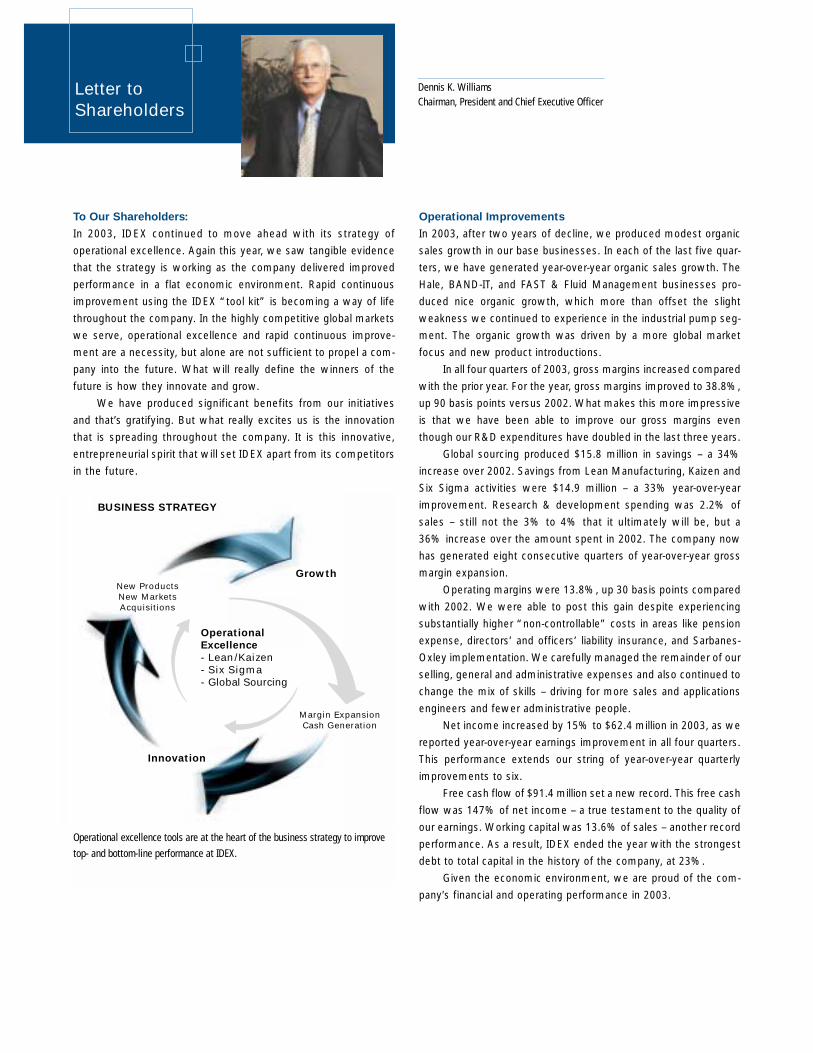
Growth
Margin ExpansionCash Generation
Innovation
New ProductsNew MarketsAcquisitions
BUSINESS STRATEGY
Operational
Excellence
- Lean/Kaizen - Six Sigma- Global Sourcing
To Our Shareholders:
In 2003, IDEX continued to move ahead with its strategy of
operational excellence. Again this year, we saw tangible evidence
that the strategy is working as the company delivered improved
performance in a flat economic environment. Rapid continuous
improvement using the IDEX “tool kit” is becoming a way of life
throughout the company. In the highly competitive global markets
we serve, operational excellence and rapid continuous improve-
ment are a necessity, but alone are not sufficient to propel a com-
pany into the future. What will really define the winners of the
future is how they innovate and grow.
We have produced significant benefits from our initiatives
and that’s gratifying. But what really excites us is the innovation
that is spreading throughout the company. It is this innovative,
entrepreneurial spirit that will set IDEX apart from its competitors
in the future.
Operational Improvements
In 2003, after two years of decline, we produced modest organic
sales growth in our base businesses. In each of the last five quar-
ters, we have generated year-over-year organic sales growth. The
Hale, BAND-IT, and FAST & Fluid Management businesses pro-
duced nice organic growth, which more than offset the slight
weakness we continued to experience in the industrial pump seg-
ment. The organic growth was driven by a more global market
focus and new product introductions.
In all four quarters of 2003, gross margins increased compared
with the prior year. For the year, gross margins improved to 38.8%,
up 90 basis points versus 2002. What makes this more impressive
is that we have been able to improve our gross margins even
though our R&D expenditures have doubled in the last three years.
Global sourcing produced $15.8 million in savings – a 34%
increase over 2002. Savings from Lean Manufacturing, Kaizen and
Six Sigma activities were $14.9 million – a 33% year-over-year
improvement. Research & development spending was 2.2% of
sales – still not the 3% to 4% that it ultimately will be, but a
36% increase over the amount spent in 2002. The company now
has generated eight consecutive quarters of year-over-year gross
margin expansion.
Operating margins were 13.8%, up 30 basis points compared
with 2002. We were able to post this gain despite experiencing
substantially higher “non-controllable” costs in areas like pension
expense, directors’ and officers’ liability insurance, and Sarbanes-
Oxley implementation. We carefully managed the remainder of our
selling, general and administrative expenses and also continued to
change the mix of skills – driving for more sales and applications
engineers and fewer administrative people.
Net income increased by 15% to $62.4 million in 2003, as we
reported year-over-year earnings improvement in all four quarters.
This performance extends our string of year-over-year quarterly
improvements to six.
Free cash flow of $91.4 million set a new record. This free cash
flow was 147% of net income – a true testament to the quality of
our earnings. Working capital was 13.6% of sales – another record
performance. As a result, IDEX ended the year with the strongest
debt to total capital in the history of the company, at 23%.
Given the economic environment, we are proud of the com-
pany’s financial and operating performance in 2003.
Dennis K. Williams Chairman, President and Chief Executive Officer
Letter to Shareholders
Operational excellence tools are at the heart of the business strategy to improvetop- and bottom-line performance at IDEX.

IDEX Corporation 2003 Annual Report 03
Innovation
Most people would agree that innovation and speed are two critical
factors for success in any competitive marketplace. The nagging
question is: How do you get the “innovation machine” cranked up?
This is a challenge, but we have seen growing momentum in 2003.
Is this the result of our focus on CTCs – what’s
“critical to the customer”?
Is it because we used a simple concept to redefine
markets to help us identify new opportunities?
Is it due to our implementation of a more disciplined
tollgate process for new product development?
Is it because we’ve trained our engineers in the Design
for Six Sigma methodology?
Is it, perhaps, the changes in leadership we’ve made at
many of our business units?
Does a new product success really energize business
teams and inspire them to higher levels of innovation?
Did the revision to our variable compensation
plan have an impact?
The answer to all of these questions is a resounding yes.
There is not a single, large lever to throw to get the machine
started – and the specific smaller levers are somewhat different in
every business – but it starts with well-trained, disciplined, highly
motivated people with a robust “tool kit” in every business unit.
For IDEX, the list of innovations is growing daily:
FAST & Fluid Management leveraging their technology and
driving to create a new market in personal care products.
BAND-IT finding exciting opportunities in the automotive
and recreational vehicle markets.
Hale creating new pump modules for the fire vehicle
original equipment manufacturers.
LUKAS’ innovations in rescue tools – speed, weight,
portability, power.
Rheodyne’s move into completely new markets, like hot
tubs and proteomics.
The list is substantial and getting longer. Real innovations –
many “first and only in the world” products. This innovation is
exciting and will differentiate this company in the years to come.
Acquisitions
Acquisitions always have been an important element in IDEX’s
growth strategy, and 2003 was no exception. Two acquisitions were
made in fiscal 2003 and another was completed in January of this year.
Sponsler’s turbine meters are an important addition to our
precision flow measurement product portfolio. With our global
reach and strong position in the refined petroleum market, we see
clear growth opportunities.
Classic Engineering adds important capability in our industrial
pump business. With this acquisition, we can provide complete
systems to our customers in chemical and municipal water treat-
ment, versus just supplying components.
Manfred Vetter, acquired in January 2004, adds exciting new
products to our fire and rescue business. Manfred Vetter is the
world leader in pneumatic lifting devices for vehicle and air rescue,
and its products will strengthen our presence in the global rescue
and recovery market and open new market opportunities.
Corporate Governance
In January 2004, Frank Hermance, chairman and chief executive
officer of AMETEK, Inc., joined the IDEX Board of Directors. Frank
brings a wealth of global operating experience and we are delight-
ed to have him as a new director.
Throughout 2003, we have been working hard to implement
various provisions of the Sarbanes-Oxley Act. We are using this
implementation as an opportunity to review and enhance our
processes. We are involving our Lean champions and Six Sigma
“Belts” at all of our business units. While the past governance
practices were solid across the company, the work underway will
help ensure that our key accounting and disclosure processes
remain contemporary and robust.
Before ending this letter, I’d like to recognize the contribu-
tions of our Senior Vice President – Finance and Chief Financial
Officer, Wayne Sayatovic. Wayne will retire in 2004 after 31 years
of terrific contributions to IDEX and its predecessor company,
Houdaille Industries. Wayne’s experience and leadership will be
missed, but we have a great replacement, Dominic Romeo. Dom is
joining us from Honeywell and brings excellent experience and skills
that will help propel our company forward in the years to come.
2004
In 2004, rapid process improvement and innovation will become more
pervasive throughout the company. We expect to be able to continue
the expansion of gross margins and operating margins. We believe
the flow of new products will have an increasing, favorable impact on
the organic growth rate of the company. Our strong balance sheet and
great cash flow will enable continued acquisitions. We are hopeful the
economy will improve in 2004, but remain confident we can deliver
improved results even in a flat economic environment.
We appreciate the support of our customers, channel partners,
employees and shareholders. Our commitment to all constituents
is to have a skilled, energized team that can truly set IDEX apart
and deliver improved results year after year.
Dennis K. Williams
Chairman, President and Chief Executive Officer
January 22, 2004

O urs is a culture focused on process and rapid
continuous improvement in all aspects of our
business. Through extensive training of our
employees and leveraging operational excellence
tools like Lean Manufacturing, Kaizen, Six Sigma
and Global Sourcing, IDEX as a company has
continued to perform well both financially and
operationally despite the challenging economic
conditions of the past few years.
This focus has enabled our company to
reduce costs, increase efficiencies, improve
operating margins, and enhance cash flow,
while at the same time developing our employees
and driving for metrics that are important to
our customers. We call these metrics “critical
to the customer”, or “CTCs”, and they involve
things like shortened cycle time, on-time deliv-
ery, reduced warranty claims, and improved
service response time, to name just a few.

IDEX Corporation 2003 Annual Report 05
Operational excellence is
important in its own right, but
more importantly, it is the
enabler for growth and inno-
vation throughout the company. The gross margin expansion
allows reinvestment in R & D while expanding operating margins.
Since 2001, R & D expenditures have more than doubled. This
cash generation allows us to drive organic growth and make
acquisitions. At the end of 2003, the company had the strongest
balance sheet in its history.
Lean Manufacturing/Kaizen
One cornerstone of operational excellence at IDEX is the use of
Lean Manufacturing and Kaizen tools to eliminate waste and con-
tinuously improve our processes both in manufacturing and other
areas of our business.
The focus of Lean Manufacturing is to create a one-piece flow
based on actual market needs, instead of a “batch” process based
on forecasted use. Lean events typically take about one week.
They are led by our trained Lean champions, who work with
employees to create an “as is” process map. Together, the group
determines a more efficient manufacturing flow using Lean
techniques and principles. A new process flow is then developed
that satisfies the actual customer demand.
A good example occurred in our Florida operations at
Pulsafeeder. Using Lean Manufacturing techniques to map and
take the non-value-added activities out of the manufacturing
process for its PULSAtron® electronic metering pump, Pulsafeeder
dramatically improved its production efficiency and on-time delivery
performance. Daily operator productivity was increased by 43%,
floor space was reduced by more than 70%, and cycle time
decreased by 29%. As a result, Pulsafeeder is able to consistently
deliver on its promise to build and ship the same day the customer
places an order, making it an industry leader in cycle time, while
also saving Pulsafeeder in excess of $60,000 annually.
Kaizen – which in Japanese means “continual improvement” –
is one of the tools of Lean Manufacturing. Most Kaizen events within
IDEX have been staged in manufacturing, where we have seen
significant reductions in distance traveled, floor space, inventory,
and cycle time. Increasingly, we also are utilizing Kaizen events to
improve the transactional processes in the office.
Kaizen projects usually
last from three to five days. An
internal Kaizen champion works
with employees to develop a
process map of how a given
job is done, and how materials
flow through this process. The
group then considers how to
use Kaizen principles to create a
more efficient flow and to elim-
inate non-value-added steps.
The process is changed, and
parts or components are pro-
duced in a new way by the end
of the week.
BAND-IT, IDEX’s stainless
steel banding and clamping
business, is a case in point.
BAND-IT has made Kaizen a
way of life, performing 24
separate Kaizen events in
2003 – one every two weeks. One such event improved the pro-
cedures used to process credit card payments from BAND-IT’s
customers. Prior to this project, when a customer paid with a cred-
it card, operating procedures were poorly documented and rarely
followed. Customers were frequently disappointed with either a
failed or delayed transaction – and BAND-IT typically heard about
the problems after the fact. Using Kaizen, BAND-IT mapped the cred-
it card payment process and succeeded in removing 25 steps — all
office waste. Customer satisfaction has improved dramatically and
BAND-IT, which continues to monitor credit card orders to ensure
they are meeting customer satisfaction, can focus on growing
other areas of their business.
Currently, we have at least one trained Kaizen champion at each
business location. This simple-but-powerful tool now is routinely
used within IDEX to improve operations and enhance customer
satisfaction. During 2003, Lean and Kaizen events saved
the company about $2.5 million, a 34%
increase over 2002. At the same time, our
customers experienced
the benefit of shorter
cycle times and better
on-time performance.
2
4
6
8
10
12
14
$16
030201
Lean, Kaizen, Six Sigma Savings
(in millions)
Total savings from operational excellence initiatives saved nearly $15 million in 2003, an increase of 33% over 2002. At the same time, our customers experienced shorter cycle times and better on-time performance.
Six Sigma Lean/Kaizen
Left: BAND-IT’s “IT” series pneumatic tools
Above: Testing pneumatic lifting bags at Manfred Vetter
Right: Versa-Matic’s Elima-Matic® series of 2” pumps

Operational excellence sets the foundation.
Six Sigma
Certainly the most powerful tool in our operational excellence
tool kit remains Six Sigma. The use of Six Sigma at IDEX
continues to be driven both by the voice of our customers and
the voice of our business.
In all cases, we identify the gap between what we, or our cus-
tomers, expect and our actual performance. We then use whatever
tools are necessary to close that gap. If simpler tools like Lean and
Kaizen are insufficient, we
use Six Sigma principles to
resolve the problem.
Our Six Sigma effort
helped IDEX continue to
make important progress
in 2003. We now have
more detailed data, a
sharper process orienta-
tion, and a greater number
of “belts” – employees
trained in Six Sigma tech-
niques – at our company,
who continue to lead or
assist with projects.
Through their efforts, our business units completed 342 Six
Sigma projects during 2003. These projects created hard savings
in excess of $12 million, an increase of $3 million compared to
2002. Just as important, our customers continue to feel the dif-
ference. Across the company, our on-time delivery performance
improved an average of four percentage points.
A good example of the power of Six Sigma occurred at Class 1,
one of Hale Products’
fire suppression busi-
nesses. Class 1 encoun-
tered a problem con-
cerning a feature of their
new specialty vehicle
mutiplex system, known
as the Es-Key® system.
Used to electronically
control fire and rescue
trucks and transit buses,
the Es-Key® system
enables OEM customers
the ability to connect
with the system for diag-
nostic purposes via a
modem using any analog
phone connection. Class 1
was receiving com-
plaints about its ability
to consistently connect to the system. Using Six Sigma methods,
Class 1 identified and resolved the root cause of the problem. The
solution involved coordinating timing between off-the-shelf hard-
ware and custom software. As a result, the customer can reliably
connect to the Es-Key® system from any location, while Class 1 has
dramatically reduced warranty expenses. The solution enabled
Class 1 to maintain $500,000 in Es-Key® sales with a particular cus-
tomer and its significant advantage over competing systems.
Throughout the company, our businesses are moving increas-
ingly from just using operational excellence tools, like Six Sigma,
to truly running their businesses differently. In 2004, our opera-
tional excellence focus is evolving to more fully utilize the Design
for Six Sigma methodology. This is expected to further enhance
our longer term operating performance by ensuring even greater
manufacturability and reliability in our new product designs.
Gross Margin
(includes R&D expenses)
The company has generated eight consecutive quarters of year-over-year gross margin expansion.
2003 2002 2001
Right: ISMATEC MCP Series® Pro-280
34
36
38
40%
Q1 Q4Q3Q2
Six Sigma Black Belts
From left to right: Mike Westbrook, Mike Deering, Dave Masterson, Tom Dalbec, Alex Sadulski, Joe Beyer, Susanne Schilderman, Bob Traettino
Free Cash Flow
(in millions)
Free cash flow in 2003 of $91.4 million set a new record, and exceeded net income by 47%. This cash generation allows IDEX to invest in new products, new markets and strategic acquisitions to drive future growth.
10
20
30
40
50
60
70
80
90
$100
92 93 94 95 96 97 009998 030201

Global Sourcing
An important aspect of our commit-
ment to operational excellence has
been to rethink the ways in which
we source materials used in our pro-
duction facilities.
Our sourcing strategy is sim-
ple: to invest in and retain control
over parts or processes that provide
us a competitive advantage, and to
outsource commodity items to sup-
pliers who can provide us with the best value proposition. In our
experience, global suppliers are able to achieve the high level of
quality we demand at significantly lower costs.
Our global sourcing initiative continued to build momentum
in 2003. Global sourcing savings totaled $15.8 million, a 34%
improvement over 2002 and four times the savings realized in
2001 when we started the program.
During 2003, we increased the collaboration and sourcing
leverage among many of our business units. This approach produced
significant savings on some of our lower volume components. In
one example, our Liquid Controls’ Corken business was able to
combine a number of its lower volume pump components in a
leveraged sourcing package with other IDEX businesses. This
saved Corken in excess of
40% over its prior sources.
In 2004, we expect the
savings to continue as we
identify additional compo-
nents for outsourcing. We
are also re-examining and
refining our current logistics
processes to meaningfully
lower our transportation
costs, especially important
given our growing global
presence.
In addition, we continue
to improve and standardize our
sourcing process, which short-
ens our cycle time for receiving
and qualifying components
from our new sources.
Presence in China
In view of the continued globaliza-
tion of our business, IDEX in 2003
established an initial base of manu-
facturing and sales operations in
China. Our wholly owned manufac-
turing operation is located within a
65,000-square foot facility in Suzhou,
just outside Shanghai, and provides
assembly and production capability
to serve our business units. We are
currently assembling several pump products, as well as BAND-IT
bands and buckles, in this facility. This facility builds on the
focused Asia Pacific sales team, known as APG, that we created
in 2002 to support our distributors and OEMs in nearly two dozen
Asian countries.
As we enter 2004, our presence in China is becoming a
springboard for our business units to produce and sell Chinese-
manufactured products in Asian markets, where the market potential
is clearly substantial. We also are using our base of operations in
China to assemble a growing number of our products for export
from China to North America and Europe. In the coming years, we
will develop engineering expertise in China to design new prod-
ucts for the global markets we serve.
IDEX Corporation 2003 Annual Report 07
Above: IDEX’s manufacturing operation in Suzhou, China
Right: Our presence in China is a springboard for ourbusiness units to produce and sell in Asian markets andexport to North America and Europe.
2
4
6
8
10
12
14
$16
030201
Global Sourcing Savings
(in millions)
Continuing to build momentum, global sourcing generated nearly $16 million in savings, a 34% improvement over 2002.

O perational excellence remains critical at IDEX.
In the larger scheme, however, operational
excellence is merely the foundation of any well-
run manufacturing organization. Said another
way, it’s the “ticket to the game”.
At IDEX, we believe the real differentiating
feature of a successful manufacturing company
is its ability to innovate new products – those
that really excite customers – and to bring them
quickly to market.
In 2003, our business units continued to
innovate a number of new products, applications
and markets to meet our customers’ needs and
propel our business forward. Highlighted here
are examples of innovation – and a growing
entrepreneurial spirit – throughout our company.
From the world’s most powerful cutter at
Hale Products’ LUKAS rescue tool business, to a
new hot tub chemical dosing unit at Rheodyne,
our emphasis on innovation is paying off – and
our customers are reaping the benefits.

IDEX Corporation 2003 Annual Report 09
Innovation at Pulsafeeder
Among IDEX’s industrial pump businesses,
Pulsafeeder is a provider of fluid metering, transfer
and control technologies to a wide variety of indus-
tries from swimming pools to nuclear power plants. Pulsafeeder
currently is getting great reviews for its new PULSAR HypoPump.®
The PULSAR HypoPump® is a sodium hypochlorite pump
used for municipal water treatment. Its patented design offers sig-
nificant advantages over the traditional hose-type and diaphragm
pumps common in the industry. Demand for this pump has
exceeded forecasts, and the PULSAR HypoPump® was recently
recognized with the Frost & Sullivan 2003 Product Innovation
Award for positive displacement pumps.
Operating as part of our Pulsafeeder business, newly acquired
Classic Engineering helps Pulsafeeder and our other pump business
units move from being component manufacturers to providers of
value-added system solutions to the water, wastewater, chemical
and industrial markets.
Innovation at Hale Products
Our Hale Products business, part of our Engineered Products
Group, has been actively evolving itself from four independent
businesses – Hale, Class 1, LUKAS and Hurst – into two powerful,
global growth platforms in fire suppression and hydraulic equip-
ment. The addition of Manfred Vetter in early 2004 will further
strengthen our rescue tool business.
Leveraging engineering, manufacturing, and geographic syn-
ergies with a keen focus on customer needs, Hale Products has
been among the most active IDEX business units in redefining its
markets, innovating new products, and expanding its global reach.
While introducing a number of “world’s first and only” prod-
ucts, Hale also is moving increasingly from being a component
manufacturer to a provider of value-added system solutions.
In fire suppression, Hale is setting a new standard with the
introduction in 2003 of the world’s only all stainless steel fire truck
pump package, known as the “Stainless Max”. This is the first of
a family of three stainless steel pump packages that will provide
unparalleled durability and corrosion resistance. Its new fire truck
pump modules and kits are changing the way OEMs produce their
vehicles. The breadth of products in fire suppression allows a com-
plete package that no other company can easily offer. The recent
introduction of smart programmable switches and the “Command
Master” display enhances our electronic offering for the fire and res-
cue market, while opening up new markets such as cutaway vans.
Similar to Hale’s fire
suppression businesses, its
hydraulic equipment business-
es, Hurst and LUKAS, are
focused on what’s critical to
the customer. When it comes
to rescue tool requirements,
what counts is speed, weight,
portability and power.
Building on a number of
rescue tool firsts, including the
original Hurst Jaws of Life®
spreader and LUKAS rescue
cutter introduced in 1972, Hurst
and LUKAS continue to offer a
steady stream of lighter, faster,
more powerful new products
to the rescue markets. All are
aimed at extricating accident victims more quickly and saving lives.
New “Mini Mate” and “Back Pack” power units address a
range of road, air, building collapse and other confined-space res-
cue challenges, supplying portable power to rescue workers under
all types of conditions. These units power Hurst’s and LUKAS’
increasingly advanced rescue tool offerings including the world’s
only telescoping spreader, the world’s only triple ram, and, new in
2003, the world’s most powerful cutter. Known as the “Mother of
All Cutters”, it has a cutting force of 70 tons, which is 40% more
powerful at the same weight than its predecessor. It is the only
rescue tool with sufficient force to cut the higher strength materi-
als in the structures of some of the latest model vehicles.
The LUKAS re-railing system offers a lighter weight, faster
set-up, safer-to-use means for operators to re-rail trains and sub-
way cars. Demand for this product continues to grow globally from
India to the Phillipines to the United States.
R&D Expenditures
(percent of sales)
Investment in research & development, which has doubled in the last three years, will continue to help to drive product innovation throughout the company.
0.5
1.0
1.5
2.0
2.5%
00 030201
Left: LUKAS’ “Mother of All Cutters”, theworld’s most powerful cutter
Above: The award-winning PULSAR HypoPump®
Right: Hale’s fire truck pump module

New product innovation sets IDEX apart.
Innovation at FAST & Fluid Management
IDEX’s FAST & Fluid Management business units, located in Italy,
The Netherlands, and the United States, are another shining exam-
ple of what can happen when a business gets the “innovation
machine” started.
Underlying all the innovation is a global approach to product
design and development – product families that make use of com-
mon hardware and software. This effort, started between the two
European units in 2002, has built momentum globally in 2003.
In paints and coatings, our FAST & Fluid Management busi-
nesses now provide a family of automatic dispensing solutions for
every size customer, from the large home centers to the small
independent paint retailer. All dispensers – from the Harbil®
200/400/600 series in Europe to the Accutinter® 7000 and 8000 in
North America – are aimed at providing our customers with better,
faster, more reliable tools to help them grow their businesses. Our
product family is the broadest in the marketplace.
Taking automatic paint dispensing to a new level, we recently
developed and shipped the first of what we call an “all-in-one”
machine. This machine, developed for and sold to a major paint
manufacturer, dispenses both the base paint and the colorants.
The base is dispensed from a large central tank, creating essen-
tially a paint factory within a store. This approach creates shelf
space, enhances productivity and results in fresher paints and
more accurate tints.
In the personal care industry, FAST & Fluid Management’s
technologies now are used to custom blend and dispense a grow-
ing range of products. We are seeing an expanded presence for
our Tintia® hair colorant machine within Europe and are working to
bring this concept to North America. At the same time, Fluid
Management’s personal care product line, under the brand name,
INFINA,® is offering new cosmetics manufacturers like Reflect
True Custom Beauty, as well as traditional off-the-shelf cosmetics
manufacturers, the ability to bring completely customized prod-
ucts to the retail store.
Currently in beta testing, the INFINA® system can formulate
and deliver any of more than 300 shades of liquid foundation in a
matter of minutes from a kiosk-style, touch-screen interface. The
same system can be applied to other products like lipstick, eye
shadow, nail polish, lotion, sunscreen and soaps. We are working
with a number of cosmetics providers and are optimistic that the
concept of mass customization at the point of sale will find wide
acceptance and create a new market for our products.
Right: The INFINA® cosmetic dispenser and mixer is helpingcosmetics manufacturers, like Reflect True Custom Beauty, bringcompletely customized products to the retail store.

Innovation at BAND-IT
BAND-IT, our stainless steel
custom banding business, is
another example of innovation
at IDEX. BAND-IT, part of our Engineered Products Group, manu-
factures a wide array of stainless steel band and buckle systems,
preformed clamps, cable ties, mounting hardware, and identification
products and tools used in many end markets, from the aerospace
industry to traffic signals to offshore oil rigs.
To drive innovation, BAND-IT developed a list of characteris-
tics for which its product would be the superior choice – things like
corrosive environment, permanent clamping, irregular shapes and
hard surfaces. When these needs were present, the best solution
generally would be BAND-IT.
Next, BAND-IT reassigned some of its key talent to applica-
tions engineering positions. These individuals went directly to
OEMs that had these kinds of applications – auto, marine, and
recreational vehicles – to test their ideas.
The result has been the discovery of several new applications
where the BAND-IT product provides the best solution. These
solutions will generate significant savings for the OEM and an
expanding business for BAND-IT.
Innovation at Rheodyne
Rheodyne is another IDEX pump unit with an entrepreneurial
mindset. The largest of our life sciences businesses, theirs is a
story of how to take a single, core technology in two radically dif-
ferent market directions.
Rheodyne’s historical leadership has been in the area of injec-
tors, valves, fittings and accessories to the analytical instrument
market. Rheodyne’s products are used by the manufacturers of
high performance liquid chromatography (HPLC) equipment that
serve the pharmaceutical, biotechnology, life science, food and
beverage, and chemical markets.
With a cultural mindset to
obsolete its own products,
Rheodyne developed the
TitanEX® valve, a new low-
pressure valve platform.
Conceived initially to serve the
traditional HPLC market within
analytical instrumentation, this
platform, in another example
of breakthrough thinking, has
recently found an additional
and radically different area of
interest in recreational water
(or hot tubs).
Rheodyne now is bringing to market its new chemical dosing
unit for hot tubs. This unit, centered around the TitanEX® valve
platform, is a system used to automatically dose chemicals into
the hot tub. This virtually eliminates the problem of manually
adding or forgetting to add chemicals – chief factors behind the
low incidence of repeat purchase in the hot tub industry. We are
partnering with a leading manufacturer of premium hot tubs, and
expect this new dosing unit and its companion chemical reagent
package to significantly alter the way consumers maintain – and
ultimately enjoy – their hot tub experience.
IDEX Corporation 2003 Annual Report 11
Above: BAND-IT’s “IT1000” industrial tool applying Tie-Lok® band to a front-wheel drive CV joint
Right: Rheodyne’s new chemical reagent suitcase, usedwith its new dosing unit for hot tubs
2003 Sales from New Products
Sales from new products introduced since January 2001 represented 17% of total 2003 sales

I DEX has established a solid acquisition track
record, purchasing 25 companies since going
public in 1989. All have been strategic in nature.
In evaluating acquisition candidates, we
look for companies with leading, proprietary,
highly engineered, brand name products. Target
companies must be profitable and are expected
to contribute to IDEX’s earnings in the first year.
Market positioning is also critical. Acquisition
candidates generally have strong, adjacent market
positions or complement current product lines.
They typically reach a diverse customer base
and have an experienced management team.
In short, our goal is to buy good businesses and
make them better. We then focus on rapid inte-
gration using our operational excellence model
to improve the operating margins of acquired
companies and drive organic growth.

IDEX Corporation 2003 Annual Report 13
In 2003, two such companies met our
acquisition criteria, resulting in the acquisi-
tions of Sponsler Co., Inc. and Classic
Engineering, Inc. In early 2004, we added
Manfred Vetter GmbH to the IDEX portfolio
of businesses. All three companies have good performance today
and offer excellent long-term growth opportunities for IDEX.
With the lowest debt to capital ratio in company history at
year-end 2003, IDEX is poised to continue its successful track
record of acquisitions to complement organic growth.
Manfred Vetter GmbH
The newest addition to IDEX in January 2004, Manfred Vetter has
sales of approximately $15 million and is the world leader in the
design and manufacture of pneumatic lifting and sealing bags for
vehicle and aircraft rescue.
Vetter, based in Zülpich, Germany, currently holds an estimated
30% share of the worldwide lifting and sealing bag market. Vetter
also manufactures inflatable mobile decontamination tents, jump bags
for building rescue, and oil and water aspirators for spill cleanup.
The addition of Vetter to our Hale Products’ hydraulic equipment
business meaningfully expands our rescue tool product portfolio,
while opening up significant new avenues for IDEX in the environ-
mental protection, disaster
recovery and control, mili-
tary, construction, and
industrial maintenance mar-
kets. We see an opportuni-
ty to take the Vetter prod-
ucts to a more global mar-
ket due to our worldwide
presence, plus the poten-
tial to leverage the new
markets on a global basis.
Classic Engineering, Inc.
The addition of Classic Engineering in the fall of 2003 has become
a catalyst for moving IDEX’s Pulsafeeder business from a compo-
nent manufacturer to a total solutions provider within the water,
wastewater, chemical and industrial markets.
With sales of approximately $4 million, Classic designs, engi-
neers and manufactures standard and custom chemical-feed sys-
tems, a new offering for IDEX. A typical chemical-feed and control
system consists of pumps, motors, tank and mixer, valves, piping,
process instrumentation and controls, all combined and assem-
bled on a stainless steel or non-metallic frame.
Combining Classic’s process and systems design know-how
with our Pulsafeeder metering pump business, we are able to meet
growing market demand, as resource-constrained industrial and
municipal customers have shifted from buying individual compo-
nents to purchasing complete, value-added systems. Building on
this concept, we foresee additional systems solution opportunities
for Classic Engineering with IDEX’s other pump business units.
Sponsler Co., Inc.
The addition of Sponsler in mid-2003 is enabling us to offer
a range of alternative precision-metering technologies to
our customers worldwide.
A turbine flow meter manufacturer with annual sales
of about $6 million, Sponsler is a leader in the custody
transfer of cryogenic gases used in many end markets. In
fact, Liquid Controls, a company we acquired in 2001, had
been associated with Sponsler for several years through a
private labeling agreement.
We’ve now formally linked Sponsler with Liquid Controls with
the aim of globalizing the cryogenic application and providing pump,
meter and register packages as we’ve done in the LP gas mar-
ket. In addition, we foresee meaningful opportunities for precision
metering in the general industrial and refined petroleum markets,
especially in load-rack applications, the world over.
Acquisitions Complement Organic Growth
(aggregate purchase prices in millions)
IDEX has a solid acquisition track record, purchasing 25 companies since going public in 1989, including the addition of Manfred Vetter in January 2004.
50
100
$150
95MICROPUMP
LUKAS
96FLUID
MGMT
97BLAGDON
KNIGHT
00ISMATEC
TREBOR
99FAST
98GAST
03SPONSLER
CLASSIC
02HALOX
RHEODYNE
WRIGHTECH
01CLASS 1
LIQUIDCONTROLS
VERSA-MATIC
2003 Sales from Acquisitions
18% of 2003 sales came from acqui-sitions made since January 2001
Lower left: Vetter’s Pneumatic Rescue Set
Above left: Vetter’s Rescue Walkway
Above: Classic Engineering’s Chemical-Feed System
Right: Sponsler’s Turbine Flow Meter
PUMP PRODUCTSGast Manufacturing
Liquid Controls
Micropump
Pulsafeeder
Rheodyne
Viking Pump
Warren Rupp
DISPENSING EQUIPMENTFAST & Fluid Management
Fluid Management
Lubriquip
OTHER ENGINEERED
PRODUCTSBAND-IT
Hale Products
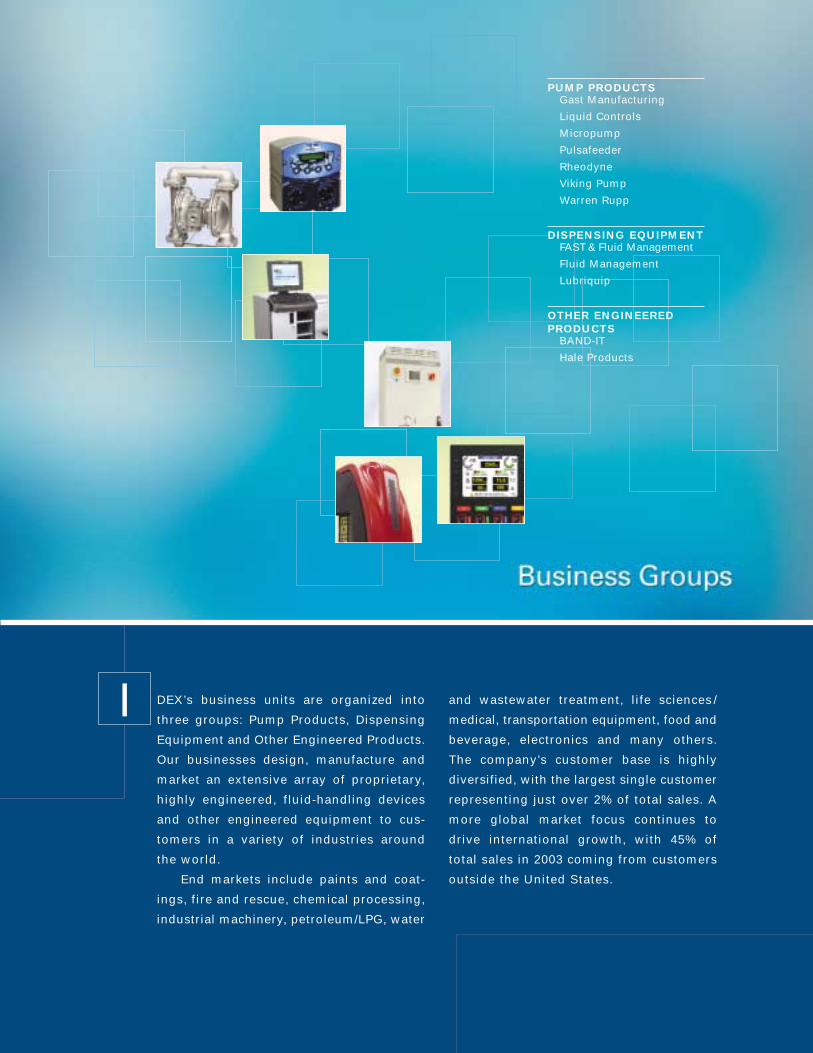
I DEX’s business units are organized into
three groups: Pump Products, Dispensing
Equipment and Other Engineered Products.
Our businesses design, manufacture and
market an extensive array of proprietary,
highly engineered, fluid-handling devices
and other engineered equipment to cus-
tomers in a variety of industries around
the world.
End markets include paints and coat-
ings, fire and rescue, chemical processing,
industrial machinery, petroleum/LPG, water
and wastewater treatment, life sciences /
medical, transportation equipment, food and
beverage, electronics and many others.
The company’s customer base is highly
diversified, with the largest single customer
representing just over 2% of total sales. A
more global market focus continues to
drive international growth, with 45% of
total sales in 2003 coming from customers
outside the United States.

Pump Products
Gast Manufacturing Liquid Controls Micropump
Pulsafeeder Rheodyne Viking Pump Warren Rupp
These seven business units design, produce and distribute
some of the most recognized names in industrial pumps,
compressors, flow meters, injectors and valves, and related
controls. Applications range from pumping and metering
chemicals, gas and lubricants, and food and beverages; to
moving paints, inks and fuels; to providing clean, quiet
sources of air in medical and industrial applications. The
group’s complementary lines of specialized positive dis-
placement pumps and related products include rotary gear,
vane, circumferential piston, and lobe pumps; air-operated
diaphragm pumps; miniature
gear pumps; peristaltic
metering pumps and vacu-
um pumps; precision injec-
tors, valves and fittings; air
motors and compressors;
and flow meters. These pre-
cision-engineered devices
give customers an unparal-
leled range of choices to
meet their needs.
The Pump Products Group
accounted for 57% of our
sales and 55% of our profits
in 2003, with 39% of sales to
customers outside the U.S.
Dispensing Equipment
FAST & Fluid Management
Fluid Management Lubriquip
This group consists of three business units that produce
highly engineered equipment for dispensing, metering and
mixing colorants, paints, inks and dyes, hair colorants, and
other personal care products; refinishing equipment; and
centralized lubrication systems. This proprietary equipment
is used in a variety of retail and commercial industries
around the world. These business units provide engineered
equipment and systems as well as service for applications
such as tinting paints and coatings, providing industrial and
automotive refinishing equipment, and
the precise lubrication of machinery
and transportation equipment. Trade
names within this group include
Harbil,® Miller,® Skandex,® Tintia,® Tint-
master,,® Accutinter,® INFINA,® Road
Warrior,® Trabon,® and others.
The Dispensing Equipment
Group contributed 20% of our sales
and profits in 2003, and 62% of the
group’s sales were to international
customers.
Other Engineered Products
BAND-IT Hale Products
The two business units in this group manufacture engi-
neered stainless steel banding and clamping devices, and
pumps, rescue tools and other components and systems for
the fire and rescue industry. Our high-quality stainless steel
bands, buckles and preformed clamps and related installa-
tion tools are used worldwide in industrial and commercial
markets. They are used to secure exhaust system heat
and sound shields, industrial hose fittings, traffic signs and
signals, electrical cable shielding, identification and bundling,
and many other “hold-together” applications. The group also
includes the world’s leading manufac-
turer of truck-mounted fire pumps,
rescue and recovery tools, and control
devices and systems. These prod-
ucts are sold under the Hale,® Hurst®,
Jaws of Life,® LUKAS,® CENTAUR,®
Class 1® and, as of January 2004,
Vetter® trade names.
This group represented 23%
of our sales and 25% of our profits
in 2003. Sales to non-U.S. cus-
tomers accounted for 43% of total
group sales.
2003 Profits
55% Pump Products
20% Dispensing Equipment
25% Other Engineered Products
2003 Sales by Region
55% United States
27% Europe
11% Asia /Rest of World
7% Canada and LatinAmerica
2003 Sales
57% Pump Products
20% Dispensing Equipment
23% Other Engineered Products

MA
NU
FAC
TU
RIN
GLO
CA
TIO
NS
WE
BS
ITE
SE
XA
MP
LES
OF
NE
W P
RO
DU
CT
S*
CO
MP
ET
ITIV
E S
TR
EN
GT
HS
PR
OD
UC
T A
PP
LIC
AT
ION
SM
AR
KE
TS
SE
RV
ED
BR
AN
D N
AM
ES
*P
RO
DU
CT
OFF
ER
ING
S
GAST MANUFACTURING
Vacuum pumps, air motors, vacuum generators,regenerative blowers and fractional horsepower compressors.
Gast, Regenair, Smart-Air, Roc-R, DDL, PerformanceLE (Life Extending) Service Plan Plus
Medical equipment, environmental equipment, com-puters and electronics, printing machinery, paint mixingmachinery, packaging machinery, telecommunicationequipment, fire protection equipment, graphic artsand industrial manufacturing.
20% of sales outside the U.S.
Air motors for industrial equipment applications, andvacuum pumps and fractional horsepower compres-sors for specialty pneumatic applications requiring aquiet, clean source of moderate vacuum or pressure.
A leading manufacturer of air-moving products withan estimated one-third U.S. market share in air motors,low- and medium-range vacuum pumps, vacuumgenerators, regenerative blowers and fractionalhorsepower compressors.
1/3-hp rocking-piston compressor for oxygen-concentrator market. Complete new DDL linear pump featuring a more robust design where higherperformance is required. Sound-reduced, energy-efficient, rotary-vane compressors for wastewatertreatment applications. 5-hp air motors with integrated controls.
www.gastmfg.com, www.gasthk.com,www.gastltd.com
Benton Harbor, Michigan » High Wycombe, England
LIQUID CONTROLS / CORKEN /
SPONSLER
Positive displacement, turbine, electromagnetic andcoriolis mass flow meters. Electronic registration andcontrol systems. Hose reels and heavy-duty dispensers.Positive displacement rotary vane pumps, side-chan-nel pumps, regenerative turbine pumps, and smallhorsepower reciprocating piston compressors.
LC, LCMAG, LCMASS, LectroCount, LCR, LCR- II,Corken, Coro-Flo, Coro-Vane, Coro-Vac, Sabre,SAMPI, Sponsler
Refined fuels, aviation fuels, liquefied petroleum gas(LPG), cryogenics, chemicals, pharmaceuticals, oiland gas, petrochemical, food and beverage, pulp andpaper, paints and coatings, transportation, nitric oxidereduction, refrigerants and general industrial.
50% of sales outside the U.S.
Flow meter and registration systems for custodytransfer, process control, metering into storage andhigh-speed diesel dispensing applications. Turbinemeters for cryogenics and other industrial liquids.Pumps and compressors for transfer and recovery ofnon-viscous, toxic, and hazardous fluids, includingLPG, chlorine, fluorocarbons, carbon dioxide, solvents,ammonia, natural gas and nitrogen.
Market leader for high accuracy, custody transfer liquid measurement and control, including aircraftrefueling, fuel oil delivery, lube oil packaging andblending, LPG transport and delivery. Market leader in metering cryogenic liquids with turbine meters,and pumps and compressors used in LPG distributionfacilities. Estimated one-third U.S. market share.
LectroCount LCR-II electronic register for use withmeters on fuel-delivery vehicles. Positive displace-ment meters for LPG automotive fuel dispensers. Anew low-flow positive displacement meter for LPGdelivery vehicles. Digital control valves. Electronicremote display.
www.lcmeter.com, www.corken.com, www.sampi.it,www.sponsler.com
Lake Bluff, Illinois » Oklahoma City, Oklahoma »Westminster, South Carolina » Vadodara, India »Lucca, Italy
MICROPUMP / ISMATEC /
TREBOR
Small, precision-engineered, magnetically driven seal-less rotary gear, piston, sliding vane, micro- annular gear and centrifugal pumps. Precision peristaltic pumps, drives and fluid processing systems. High-purity double-diaphragm pumps, surge suppressors and deionized water heaters.
Micropump, Delta, Integral Series » ISMATEC,Flowmaster, Cellmaster, MCP Series, Ecoline, MS-CA, IP Series, ASA Aroma » Trebor, Maxim,Champion, Magnum, Quantum, IQ, Quasar, Purus
Paints and inks, medical equipment, chemical, energyand fuels, biotechnology and pharmaceutical, life sci-ence, cosmetics, clinical and diagnostic laboratory,electronics, food and beverage, pulp and paper, watertreatment, aerospace and aircraft, textiles, semiconduc-tor, microelectronics, precision heating and cooling.
65% of sales outside the U.S.
Pumps and fluid management systems for low-flowapplications such as sampling or delivery of inks,dyes, solvents, colorants, flavors, slurries, pigments,and other corrosive or abrasive fluids. Pumps andsystems for electronic cooling, analytical laboratories,drug and therapy development, fluid and cell suspen-sion handling for life science laboratory research andanalysis as well as biopharmaceutical liquid handlingand in-process QC testing. High purity acid anddeionized water heating for production and cleaningof semiconductors and microelectronics.
Leader in corrosion-resistant, aggressive-duty,magnetic and electromagnetic miniature pumps anddrives. IP 65 rated, UL listed, ATEX and CE compliant.Estimated 40% U.S. market share. Precision andsterile fluid dispensing equipment and Class 1000cleanroom products. Estimated 25% U.S. marketshare. Patented technologies include peristalticpump-based cell suspension delivery and quartzheating for ultra pure water.
Ultra quiet pump and drive options for low noise andvibration sensitive applications. New micro-annulargear pump family for low-flow and analytical applica-tions. New dual and valve-less piston pumps and elec-tromagnetic drives. Integral Series gear pumps andminiature multi-channel peristaltic cassette pumps foruse in confined-space applications. Innovative quartzchemical and water heaters for semiconductor andLCD cleaning. Air-powered drum mixers for chemicalblending and slurry particle dispersion.
www.micropump.com, www.micropump.com.uk,www.ismatec.com, www.treborintl.com
Vancouver, Washington » St. Neots, England »Glattbrugg-Zürich, Switzerland » Wertheim-Mondfeld,Germany » West Jordan, Utah
*Brand names shown are registered trademarks of IDEX and/or its subsidiaries.
Business Profile

PULSAFEEDER / KNIGHT /
HALOX / CLASSIC ENGINEERING
Metering pumps, special purpose rotary pumps, peristalticpumps, engineered system solutions, electronic controls, dispensing equipment, and on-site chlorine dioxide generators.
Pulsafeeder, Knight, Halox Technologies, Classic Engineering,PULSA Series, PULSAR, PULSAtron, PULSAtrol, Chem-Tech,Chem-Trak, Isochem, Mec-O-Matic, ECO, EASTERN, Foster,Cruise Control, Reporter, Halox 1000 and 2000, KP Pumps,Pro Series, Knight-Trak, HypoPump, Nutralizer, Unitech
Municipal water and wastewater treatment, power genera-tion, pulp and paper, chemical and hydrocarbon processing,swimming pool, commercial laundry, dishwashing, food andbeverage, cooling towers, boilers, potable water and health-care facilities.
30% of sales outside the U.S.
Wide range of pumps, controls, custom systems and otherdispensing equipment for metering precise amounts of chemicals into a variety of process applications, including sanitation, purification, water hygiene, polymer applicationsand general cleaning. Point-of-use chlorine dioxide generatorsfor controlling water-borne pathogens.
A leading manufacturer of metering pumps, controls, engi-neered chemical systems and dispensing equipment usedfor chemical injection in water treatment, process applicationsand warewash, laundry, and the food and beverage market.Estimated one-third U.S. market share. Patented on-site,non-acid chlorine dioxide generators for controlling water-borne pathogens.
The award winning HypoPump with its patented, built-indegassing valve for pumping sodium hypochlorite. Innovative,low-cost Nutralizer pump for swimming pools and homemarkets. Chem-Trak, a central chemical processing system,for handling multiple-point dispensing in commercial laundrywashing applications. A controller working in conjunctionwith the Halox generator to accurately dose chlorine dioxide.A complete line of standardized, highly engineered, platform-mounted chemical feed systems.
www.pulsa.com, www.pulsatron.com,www.knightequip.com, www.haloxtech.com, www.classicengineering.us
Rochester, New York » Punta Gorda, Florida » Lake Forest, California » Bridgeport, Connecticut » Enschede, The Netherlands » Jacksonville, Florida » London, England »Sydney, Australia
RHEODYNE
Precision, multi-position, electrically actuated, high- and low-pressure fluid injectors, switching valves, and accessories formanufacturers of laboratory instrumentation. Product breadthranges from nano, micro, and analytical, to preparative-scaleapplications. Automated device for maintaining chemicalbalance of large volume aqueous solutions.
RheFlex, RheBuild, MRA, TitanEX, LabPRO, TeleFLO, DuraLife,RPC-7, RPC-8, MBB, DryLab, ChromTRAC, Column Match,Method Match
Pharmaceutical drug discovery, genomics, proteomics, and chemical processing. Techniques employed are HPLC(High Performance Liquid Chromatography), CE (CapillaryElectrophoresis), and LC-MS (Liquid Chromatography-MassSpectroscopy). Recreational water and health and beauty aids.
40% of sales outside the U.S.
Industry standard for ultra high-duty cycle applications; man-agement of nanoliter range volumes and related applicationsrequiring ultra low-dispersion characteristics. Worldwideleader in automated sample injection and fluid switching sub-assemblies for manufacturers of analytical instrumentsincluding high performance liquid chromatographs, proteinand DNA sequencers, and mass spectrometers. Maintenanceof healthy chemical balance in portable spas.
Partnering in early product development stages to acceleratecustomers’ product-to-market timeline. Worldwide reputationas an innovative designer and manufacturer of high-quality fluidic solutions, including the smallest (coffee cup-size) high-pressure valves available. Market leader in high-pressuresample injection, fluid switching, and fluid management systems. Award-winning customer service and technical support. Estimated 50% U.S. market share.
Nano-scale, high pressure, automated multi-port valvesincluding sample injector and switching valves. Dosing engineand reagent suitcase to automatically maintain consistentchemical balance of water in portable spas.
www.rheodyne.com, www.rheodyne.jp.com, www.titanexgroup.com, www.chromforum.com
Rohnert Park, California
VIKING PUMP / JOHNSON PUMP /
WRIGHTECH
Rotary internal gear, external gear, lobe and circumferentialpiston pumps; strainers; gear reducers; pump systems andrelated electronic controls.
Viking, Viking Mag Drive, Magnum, Viking Flow Manager,Vi-Corr, Vican, Lid Ease, DuraLobe, SteriLobe, AccuLobe,Classic, On-Line, Concept SQ, RTP, Wright Pump
Chemical, petroleum, pulp and paper, polymer, paint, ink,steel, construction, electric power, water and wastewatertreatment, oil seeds, corn processing, sugar, food and bever-age, personal care, pharmaceutical, biotechnology, tankertrucks, transportation, automotive, machinery lubrication,commercial cooking equipment, injection molding, compressors,dispensing machinery, and boiler systems.
35% of sales outside U.S.
Virtually all industries for process, transfer and metering ofthin and viscous liquids from initial manufacturing throughend-use. Typical liquids include: chemicals, petroleum products, paints, inks, coatings, adhesives, asphalt, foods,pharmaceuticals, soaps, beverages, and shampoos.
Largest internal gear pump producer with highly respectedbrand and estimated 40% share of U.S. internal gear pumpmarket. The Wright Pump brand offers pumps and parts thatare drop-in replacements for the leading brand of sanitarypositive displacement pumps.
Viking Mag Drive Magnum series of seal-less magneticdrive pumps with reversible direction of flow and short-termrun-dry capabilities for toxic, hazardous or hard-to-seal fluids.Industrial lobe series of timed, bi-wing rotor pumps withpatented rotor support system and choice of packing, compo-nent or cartridge seals, for shear-sensitive industrial liquidsand high-pressure chemical applications. SteriLobe seriessanitary lobe pumps with front-loading single, double, o-ringor DIN seals. Wright Pump Universal 1 series circumferentialpistons pumps. New line of compact Viking In-Line GearReducers. Viking Power Load Monitor protects pumpingsystems from underload or overload conditions.
www.vikingpump.com, www.johnsonpump.com,www.wrightpump.com, www.vikingpumpeurope.com,www.vikingpumpcanada.com, www.pumpschool.com
Cedar Falls, Iowa » Waukesha, Wisconsin » Windsor, Ontario,Canada » Eastbourne, England » Shannon, Ireland
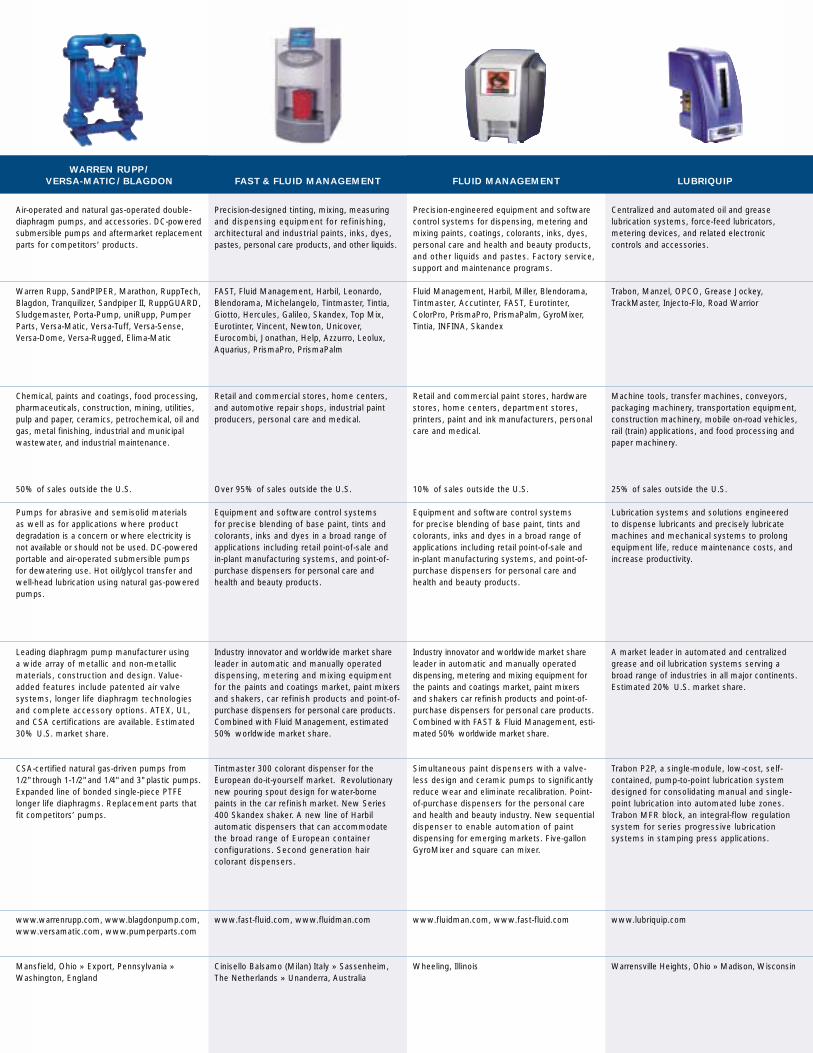
WARREN RUPP /
VERSA-MATIC / BLAGDON
Air-operated and natural gas-operated double-diaphragm pumps, and accessories. DC-poweredsubmersible pumps and aftermarket replacementparts for competitors’ products.
Warren Rupp, SandPIPER, Marathon, RuppTech,Blagdon, Tranquilizer, Sandpiper II, RuppGUARD,Sludgemaster, Porta-Pump, uniRupp, PumperParts, Versa-Matic, Versa-Tuff, Versa-Sense,Versa-Dome, Versa-Rugged, Elima-Matic
Chemical, paints and coatings, food processing,pharmaceuticals, construction, mining, utilities,pulp and paper, ceramics, petrochemical, oil andgas, metal finishing, industrial and municipalwastewater, and industrial maintenance.
50% of sales outside the U.S.
Pumps for abrasive and semisolid materials as well as for applications where product degradation is a concern or where electricity isnot available or should not be used. DC-poweredportable and air-operated submersible pumpsfor dewatering use. Hot oil/glycol transfer andwell-head lubrication using natural gas-poweredpumps.
Leading diaphragm pump manufacturer using a wide array of metallic and non-metallic materials, construction and design. Value-added features include patented air valve systems, longer life diaphragm technologies and complete accessory options. ATEX, UL, and CSA certifications are available. Estimated 30% U.S. market share.
CSA-certified natural gas-driven pumps from1/2" through 1-1/2" and 1/4" and 3" plastic pumps.Expanded line of bonded single-piece PTFElonger life diaphragms. Replacement parts thatfit competitors’ pumps.
www.warrenrupp.com, www.blagdonpump.com,www.versamatic.com, www.pumperparts.com
Mansfield, Ohio » Export, Pennsylvania »Washington, England
FAST & FLUID MANAGEMENT
Precision-designed tinting, mixing, measuringand dispensing equipment for refinishing,architectural and industrial paints, inks, dyes,pastes, personal care products, and other liquids.
FAST, Fluid Management, Harbil, Leonardo,Blendorama, Michelangelo, Tintmaster, Tintia,Giotto, Hercules, Galileo, Skandex, Top Mix,Eurotinter, Vincent, Newton, Unicover,Eurocombi, Jonathan, Help, Azzurro, Leolux,Aquarius, PrismaPro, PrismaPalm
Retail and commercial stores, home centers,and automotive repair shops, industrial paintproducers, personal care and medical.
Over 95% of sales outside the U.S.
Equipment and software control systems for precise blending of base paint, tints and colorants, inks and dyes in a broad range of applications including retail point-of-sale and in-plant manufacturing systems, and point-of-purchase dispensers for personal care and health and beauty products.
Industry innovator and worldwide market shareleader in automatic and manually operated dispensing, metering and mixing equipmentfor the paints and coatings market, paint mixersand shakers, car refinish products and point-of-purchase dispensers for personal care products.Combined with Fluid Management, estimated50% worldwide market share.
Tintmaster 300 colorant dispenser for theEuropean do-it-yourself market. Revolutionarynew pouring spout design for water-bornepaints in the car refinish market. New Series400 Skandex shaker. A new line of Harbil automatic dispensers that can accommodatethe broad range of European container configurations. Second generation hair colorant dispensers.
www.fast-fluid.com, www.fluidman.com
Cinisello Balsamo (Milan) Italy » Sassenheim,The Netherlands » Unanderra, Australia
FLUID MANAGEMENT
Precision-engineered equipment and softwarecontrol systems for dispensing, metering andmixing paints, coatings, colorants, inks, dyes,personal care and health and beauty products,and other liquids and pastes. Factory service,support and maintenance programs.
Fluid Management, Harbil, Miller, Blendorama,Tintmaster, Accutinter, FAST, Eurotinter,ColorPro, PrismaPro, PrismaPalm, GyroMixer,Tintia, INFINA, Skandex
Retail and commercial paint stores, hardwarestores, home centers, department stores, printers, paint and ink manufacturers, personalcare and medical.
10% of sales outside the U.S.
Equipment and software control systems for precise blending of base paint, tints and colorants, inks and dyes in a broad range of applications including retail point-of-sale and in-plant manufacturing systems, and point-of-purchase dispensers for personal care andhealth and beauty products.
Industry innovator and worldwide market shareleader in automatic and manually operated dispensing, metering and mixing equipment forthe paints and coatings market, paint mixers and shakers car refinish products and point-of-purchase dispensers for personal care products.Combined with FAST & Fluid Management, esti-mated 50% worldwide market share.
Simultaneous paint dispensers with a valve-less design and ceramic pumps to significantlyreduce wear and eliminate recalibration. Point-of-purchase dispensers for the personal careand health and beauty industry. New sequentialdispenser to enable automation of paint dispensing for emerging markets. Five-gallonGyroMixer and square can mixer.
www.fluidman.com, www.fast-fluid.com
Wheeling, Illinois
LUBRIQUIP
Centralized and automated oil and grease lubrication systems, force-feed lubricators, metering devices, and related electronic controls and accessories.
Trabon, Manzel, OPCO, Grease Jockey,TrackMaster, Injecto-Flo, Road Warrior
Machine tools, transfer machines, conveyors,packaging machinery, transportation equipment,construction machinery, mobile on-road vehicles,rail (train) applications, and food processing andpaper machinery.
25% of sales outside the U.S.
Lubrication systems and solutions engineeredto dispense lubricants and precisely lubricatemachines and mechanical systems to prolongequipment life, reduce maintenance costs, andincrease productivity.
A market leader in automated and centralizedgrease and oil lubrication systems serving abroad range of industries in all major continents.Estimated 20% U.S. market share.
Trabon P2P, a single-module, low-cost, self-contained, pump-to-point lubrication systemdesigned for consolidating manual and single-point lubrication into automated lube zones.Trabon MFR block, an integral-flow regulationsystem for series progressive lubrication systems in stamping press applications.
www.lubriquip.com
Warrensville Heights, Ohio » Madison, Wisconsin

BAND-IT
Stainless steel clamping systems, band and buckle, preformed clamps, power and hand application tools,hose fittings, clamping kits, cable ties and identificationsystems. Mounting systems for traffic signs, signals,and banners including brackets, hardware and stainlesssteel band.
BAND-IT, Ultra-Lok, BAND-IT Jr., Junior, Thriftool, Tie-Dex,Tri-Lokt, Tie-Lok, Self-Lok, Band-Lok, SIGNFIX
Automotive, industrial hose assembly, MRO, municipal,shipbuilding, military and commercial aerospace,telecommunications, transportation, mining, oil and gas exploration and processing, electrical transmissionand distribution, paper processing, underwater, coolingtowers, security, bridge and tunnel construction for both original equipment and replacement markets.
45% of sales outside the U.S.
Clamping hose fittings, protective boots, canisters,sound and heat shields. Fastening signs, traffic signals,cameras, enclosures, antennas, electronic equipment,identification tags, wiring harnesses, lighting, and electri-cal distribution hardware. Bundling electrical cables,hoses, and pipes. Identifying hoses, electrical andmechanical equipment, pipes and cabling.
Highly recognized and respected global brand name.Leading provider of high-quality, innovative, stainlesssteel band clamping, fastening, bundling and identifi-cation systems and solutions. Extensive applicationengineering experience. Specialists in manual, pneu-matic and electrical application tools. Worldwide manufacturing, sales, and distribution. Estimatedworldwide market share at 45%.
The “IT” series pneumatic tools (shown above) provide a fast, easy, high-speed, uniform application of stainless steel ties and clamps with extended servicelife and low maintenance. Features include heavy-dutycut-off and tensioning components, a long-life valvingsystem, easy access to maintenance components andlow line pressure requirements.
www.band-it-idex.com, www.band-it.co.uk, www.band-it-clamps.com, www.bandit.edx.co.za
Denver, Colorado » Staveley, England » Singapore »Edenglen, South Africa
HALE PRODUCTS – FIRE SUPPRESSION
(HALE/CLASS 1 )
Truck-mounted and portable fire pumps, stainless steelvalves, foam and compressed-air foam systems, pumpmodules and pump kits, electronic controls and informationsystems, conventional and networked electrical systems,and mechanical components for the global fire and rescueand specialty vehicle markets.
Hale, Godiva, Class 1, FoamLogix, CAFSPro, Es-Key, Qflo,Qmax, Qpak, CAFSMaster, Typhoon, MaxStream, Torrent
Public and private fire and rescue agencies, police, transit bus, mining and specialty vehicle applications.
30% of sales outside the U.S.
Water and foam pumps for fire suppression; valves andplumbing components for emergency vehicles; electricalsystems and advanced electronic control systems forfire, rescue, and specialty vehicles.
World’s leading manufacturer of truck-mounted firepumps, with an estimated 50% worldwide marketshare, and a complete line of plumbing, electrical, andelectronic components and systems making Hale a single-source integrated solutions provider.
The Stainless Max family of stainless steel vehicle-mounted pumps. The Command Master information/control module. The SPS Smart Programmable Switchpanels and peer-to-peer multiplexing system.
www.haleproducts.com, www.haleeurope.com,www.class1.com
Ocala, Florida » Conshohocken, Pennsylvania »Warwick, England
HALE PRODUCTS – HYDRAULIC EQUIPMENT
(HURST/LUKAS )
Hydraulic, battery, gas and electric operated rescueequipment. Hydraulic re-railing equipment. Hydraulictools for industrial applications. Cutters for recyclingapplications. Pneumatic lifting and sealing bags forvehicle and aircraft rescue, environmental protectionand disaster control.
Hale, Jaws of Life, Hurst, LUKAS, CENTAUR, VEPRO, Vetter
Public and private fire and rescue agencies, police, mining, specialty vehicles, industrial recycling, and railtransport including subway.
65% of sales outside the U.S.
Rescue equipment and lifting bags for extricating victimsfrom car, train, aircraft, or naval accidents; sealing bagsfor environmental protection and disaster control; forcibleentry equipment for law enforcement and disasterrecovery; positioning tools for use in structural collapse;industrial recycling; re-railing of trains; and, a variety ofindustrial lifting and positioning applications.
World leader in the manufacture of rescue tools, lifting and sealing bags, and hydraulic rerailing equipment. Estimated worldwide market share of 50% for rescue tools, 30% for lifting bags, and 60% for rerailing equipment.
A new generation of rescue cutters with more than 70-ton cutting force; spreader with telescopic arms combining high force with low weight and compactdimensions; “Octoflow” multi-circuit hydraulic powerunit integrated into fire and rescue vehicles for simulta-neous operation of up to eight rescue tools. Vetter pneumatic lifting and sealing bags for vehicle rescue,environmental protection, disaster recovery and control.
www.haleproducts.com, www.hurstjaws.com,www.lukas.de, www.vetter.de
Shelby, North Carolina » Erlangen, Germany » Zülpich, Germany
IDEX Corporation 2003 Annual Report 15

2003 2002 2001 2000 1999 1998
Results of Operations
Net sales $ 797,920 $ 742,014 $ 726,947 $ 704,276 $ 655,041 $ 640,131Gross profit 309,320 281,438 263,722 277,952 256,484 252,846SG&A expenses 199,458 181,269 164,893 149,639 140,495 132,627Goodwill amortization – – 14,165 11,797 11,312 10,676Restructuring activity – (203) 11,226 – – –Operating income 109,862 100,372 73,438 116,516 104,677 109,543Other income (expense) – net 899 (123) 731 1,031 568 479Interest expense 14,091 16,354 20,738 16,521 18,020 22,359Provision for income taxes 34,318 29,783 20,721 37,581 32,797 33,267Income from continuing operations 62,352 54,112 32,710 63,445 54,428 54,396Income from discontinued operations – – – – – 10,182Extraordinary items – – – – – (2,514)Net income 62,352 54,112 32,710 63,445 54,428 62,064
Financial Position
Current assets $ 224,496 $ 221,260 $ 214,903 $ 232,089 $ 213,715 $ 195,900Current liabilities 115,681 108,332 87,338 177,811 (2) 91,634 80,265Working capital 108,815 112,928 127,565 54,278 (2) 122,081 115,635Current ratio 1.9 2.0 2.5 1.3 (2) 2.3 2.4Capital expenditures 20,318 19,335 21,639 20,739 18,338 20,763Depreciation and amortization 30,055 30,105 44,297 36,704 34,835 33,575Total assets 960,739 931,050 838,804 758,854 738,567 695,811Total debt 176,546 241,051 291,820 241,886 268,589 283,410Shareholders’ equity 592,102 506,791 401,112 374,502 329,024 286,037
Performance Measures
Percent of net salesGross profit 38.8 % 37.9 % 36.3 % 39.5 % 39.2 % 39.5 %SG&A expenses 25.0 24.4 22.7 21.2 21.4 20.7Goodwill amortization – – 1.9 1.7 1.7 1.7Restructuring activity – – 1.5 – – –Operating income 13.8 13.5 10.1 16.5 16.0 17.1Income before income taxes 12.1 11.3 7.4 14.3 13.3 13.7Income from continuing operations 7.8 7.3 4.5 9.0 8.3 8.5
Effective tax rate 35.5 35.5 38.8 37.2 37.6 37.9Net income return on average assets 6.6 6.1 4.1 8.5 7.6 9.6Debt as a percent of capitalization 23.0 32.2 42.1 39.2 44.9 49.8Net income return on average shareholders’ equity 11.3 11.9 8.4 18.0 17.7 23.7
Per Share Data (3)
Basic – income from continuing operations $ 1.92 $ 1.71 $ 1.08 $ 2.13 $ 1.84 $ 1.85– net income 1.92 1.71 1.08 2.13 1.84 2.12
Diluted – income from continuing operations 1.87 1.67 1.05 2.07 1.81 1.81– net income 1.87 1.67 1.05 2.07 1.81 2.07
Cash dividends declared .56 .56 .56 .56 .56 .545Shareholders’ equity 17.95 15.60 13.05 12.38 11.10 9.71Stock price – high 42.37 39.66 37.20 36.00 34.13 38.75
– low 26.02 25.70 24.90 22.75 21.63 19.50– close 41.59 32.70 34.50 33.13 30.38 24.50
Price/earnings ratio at year end 22 20 33 16 17 14
Other Data (3)
Employees at year end 3,689 3,863 3,873 3,880 3,773 3,803Shareholders at year end 5,700 4,700 5,500 5,200 5,600 7,000Shares outstanding (in 000s):
Weighted average – basic 32,530 31,669 30,222 29,726 29,544 29,332– diluted 33,315 32,483 31,047 30,632 30,085 30,052
At year end (net of treasury) 32,986 32,477 30,734 30,258 29,636 29,466
(1) See Notes to Consolidated Financial Statements for additional detail.(2) Excluding short-term debt of $88,077, current liabilities were $89,734, working capital was $142,355 and the current ratio was 2.6.(3) All share and per share data have been restated to reflect the three-for-two stock splits effected in the form of 50% stock dividends in January 1995 and 1997.
Historical Data(1)
(DOLLARS IN THOUSANDS EXCEPT PER SHARE AMOUNTS)

1997 1996 1995 1994 1993 1992
$ 552,163 $ 474,699 $ 395,480 $ 319,231 $ 239,704 $ 215,778222,357 187,074 157,677 126,951 96,903 88,312110,588 93,217 78,712 66,743 52,950 49,326
8,174 6,241 4,196 3,025 1,889 1,422– – – – – –
103,595 87,616 74,769 57,183 42,064 37,564(693) (696) 524 281 728 602
18,398 17,476 14,301 11,939 9,168 9,80931,029 25,020 21,845 16,181 11,187 9,76353,475 44,424 39,147 29,344 22,437 18,5945,151 5,774 6,178 4,266 2,889 1,552
– – – – – (3,441)58,626 50,198 45,325 33,610 25,326 16,705
$ 197,267 $ 191,599 $ 173,889 $ 140,450 $ 106,864 $ 107,95877,801 83,286 70,798 58,443 34,038 31,276
119,466 108,313 103,091 82,007 72,826 76,6822.5 2.3 2.5 2.4 3.1 3.5
13,562 11,634 8,181 6,818 6,120 5,65724,943 21,312 15,277 12,515 10,092 8,758
599,193 569,745 450,077 357,980 245,291 240,175258,417 271,709 206,184 168,166 117,464 139,827238,671 195,509 150,945 116,305 83,686 58,731
40.3 % 39.4 % 39.9 % 39.8 % 40.4 % 40.9 %20.0 19.6 19.9 20.9 22.1 22.91.5 1.3 1.1 1.0 .8 .7
– – – – – –18.8 18.5 18.9 17.9 17.5 17.415.3 14.6 15.4 14.3 14.0 13.19.7 9.4 9.9 9.2 9.4 8.6
36.7 36.0 35.8 35.5 33.3 34.410.0 9.8 11.2 11.1 10.4 8.952.0 58.2 57.7 59.1 58.4 70.427.0 29.0 33.9 33.6 35.6 34.9
$ 1.83 $ 1.54 $ 1.37 $ 1.03 $ .79 $ .662.01 1.74 1.58 1.18 .89 .591.78 1.49 1.32 1.00 .77 .651.95 1.69 1.53 1.15 .87 .59.495 .44 .387 .093 – –8.16 6.76 5.26 4.06 2.93 2.07
36.69 27.63 29.50 19.50 16.00 10.6323.25 19.88 18.38 15.13 9.75 7.3834.88 26.63 27.13 18.75 15.88 10.63
20 16 18 16 18 18
3,326 3,093 2,680 2,305 1,828 1,8647,000 6,100 5,300 4,400 4,300 4,200
29,184 28,818 28,662 28,600 28,396 28,35329,999 29,779 29,609 29,331 28,976 28,38929,250 28,926 28,695 28,619 28,580 28,353
IDEX Corporation 2003 Annual Report 17
Sales have grown at a 12.6% compound annual rate since 1992.
100
200
300
400
500
600
700
$800
92 93 94 95 96 97 009998 030201
Net Sales
(in millions)
While IDEX’s strong operating margins have been negatively affected by weak economic conditions since 2001, advances in operational excellence initiatives helped improve them in 2002 and 2003.
5
10
15
20
25%
92 93 94 95 96 97 009998 030201
Operating Margins
(continuing operations)
IDEX Value Line Industrial Composite Index
Weak economic conditions since 2001 reduced the compound annual growth rate since 1992 to 10.1%. The growth initiatives under way will improve IDEX’s long-term profitability.
.20
.40
.60
.80
1.00
1.20
1.40
1.60
1.80
2.00
$2.20
92 93 94 95 96 97 009998 030201
Diluted Earnings per Share
(continuing operations)

Management’s Discussion andAnalysis of Financial Condition and Results of Operations
Historical Overview and Outlook
IDEX sells a broad range of pump products, dispensing equipmentand other engineered products to a diverse customer base in theUnited States and other countries around the world. Accordingly, ourbusinesses are affected by levels of industrial activity and economicconditions in the U.S. and in other countries where our products aresold and by the relationship of the U.S. dollar to other currencies.Levels of capacity utilization and capital spending in certain industriesand overall industrial activity are among the factors that influence thedemand for our products.
IDEX has a history of achieving above-average operating mar-gins. Our operating margins have exceeded the average operatingmargin of the companies that comprise the Value Line CompositeIndex (VLCI) every year since 1988. We view the VLCI operating per-formance statistics as a proxy for an average industrial company. Ouroperating margins are influenced by, among other things, utilization offacilities as sales volumes change and inclusion of newly acquiredbusinesses. Newly acquired businesses may have lower operatingmargins than the Company’s operating margins and, prior to 2002,those margins were further reduced by amortization of goodwill andintangible assets. Beginning in 2002, we were no longer required toamortize to earnings these assets with indefinite lives in accordancewith new accounting rules. Instead, these assets are reviewed peri-odically for impairment.
For 2003, we reported higher orders, sales, operating income,net income and earnings per share compared with the prior year. Neworders in 2003 totaled $797.8 million, 6% higher than 2002. Excludingthe impact of the Halox (April 2002), Rheodyne (July 2002), Wrightech(October 2002), Sponsler (June 2003) and Classic Engineering(September 2003) acquisitions and foreign currency translation, orderswere essentially unchanged from 2002. At December 31, 2003, theCompany had a typical unfilled order backlog of slightly over onemonth’s sales.
Given the economic environment, we are proud of our financialand operating performance in 2003. Together, our business units deliv-ered record orders, sales and cash flows, while earnings improved. Forthe year, earnings per share were up 12%, and we reported our 6th con-secutive quarter of year-over-year improvement in the fourth quarter.Organic revenue growth in our dispensing equipment and engineeredproducts businesses more than offset the slight weakness in the indus-trial pump segment of the business. In addition, we continued to driveour operational excellence initiatives, established a strategic base ofoperations in China, and completed two acquisitions in 2003 and anoth-er in early January 2004. We continue to use all the tools at our disposalto drive growth, profitability and cash generation, positioning IDEX todeliver even stronger performance as the economy improves.
The following forward-looking statements are qualified by thecautionary statement under the Private Securities Litigation ReformAct set forth below. While economic conditions in 2003 improvedmodestly from 2002, it is clear that we have not as yet seen a broad-based economic recovery. As a short-cycle business, our 2004 finan-cial performance depends on the current pace of incoming orders, andwe have limited visibility on future business conditions. We believeIDEX is well positioned for earnings improvement as the economy improves. This is based on our lower cost levels resulting from our
restructuring actions in previous years; our operational excellence ini-tiatives of Global Sourcing, Six Sigma, Kaizen and Lean Manufacturing;eBusiness; and our use of strong cash flow to cut debt and interestexpense. With the belief that innovation will define the winning com-panies of the future, we are increasing our emphasis on new productsand global markets, while pursuing strategic acquisitions to help driveour longer term profitable growth.
Cautionary Statement Under the Private
Securities Litigation Reform Act
The “Historical Overview and Outlook” and the “Liquidity and CapitalResources” sections of this management’s discussion and analysis ofour operations contain forward-looking statements within the mean-ing of Section 27A of the Securities Act of 1933, as amended, andSection 21E of the Exchange Act of 1934, as amended. These state-ments may relate to, among other things, capital expenditures, costreductions, cash flow, and operating improvements and are indicatedby words or phrases such as “anticipate,” “estimate,” “plans,”“expects,” “projects,” “should,” “will,” “management believes,”“the company believes,” “we believe,” “the company intends” andsimilar words or phrases. These statements are subject to inherentuncertainties and risks that could cause actual results to differ materi-ally from those anticipated at the date of this filing. The risks anduncertainties include, but are not limited to, the following: economicand political consequences resulting from terrorist attacks and wars;levels of industrial activity and economic conditions in the U.S. andother countries around the world; pricing pressures and other com-petitive factors, and levels of capital spending in certain industries – all
From left to right, seated: Susan Fisher (Director – Investor Relations), Wayne Sayatovic (Senior Vice President – Finance and Chief Financial Officer),Clint Kooman (Vice President – Controller)
From left to right, standing: Doug Lennox (Vice President – Treasurer), Dom Romeo (Vice President and Chief Financial Officer-elect)

IDEX Corporation 2003 Annual Report 19
In 2003, acquisitions helped increase Pump Products’ sales, while new products were largely responsible for Other Engineered Products growth.
100
200
300
400
500
600
700
$800
92 93 94 95 96 97 009998 030201
Net Sales by Group
(in millions)
Pump ProductsDispensing EquipmentOther Engineered Products
Although newly acquired companies generally have lower operating margins, our rapid integration programhelps raise them over time to the IDEX average.
A more global market focus continues with 45% of 2003sales coming from customers outside the United States.
20
40
60
80
100
120
$140
92 93 94 95 96 97 009998 030201
Operating Income by Group
(in millions)
Pump ProductsDispensing EquipmentOther Engineered Products
2003 Sales by Region
55% United States27% Europe11% Asia/Rest of World7% Canada/Latin America
of which could have a material impact on our order rates and results, particularly in light of the lowlevels of order backlogs we typically maintain; our ability to make acquisitions and to integrate andoperate acquired businesses on a profitable basis; the relationship of the U.S. dollar to other cur-rencies and its impact on pricing and cost competitiveness; political and economic conditions in for-eign countries in which we operate; interest rates; capacity utilization and the effect this has oncosts; labor markets; market conditions and material costs; and developments with respect to con-tingencies, such as litigation and environmental matters. The forward-looking statements includedhere are only made as of the date of this report, and we undertake no obligation to publicly updatethem to reflect subsequent events or circumstances. Investors are cautioned not to rely unduly onforward-looking statements when evaluating the information presented here.
Results of Operations
For purposes of this discussion and analysis section, reference is made to the table on page 20 andthe Consolidated Statements of Operations on page 27.
IDEX consists of three reporting groups: Pump Products, Dispensing Equipment and OtherEngineered Products.
The Pump Products Group produces a wide variety of pumps, compressors, flow meters,injectors and valves and related controls for the movement of liquids, air and gases. The DispensingEquipment Group produces highly engineered equipment for dispensing, metering and mixing col-orants, paints, inks and dyes, hair colorants and other personal care products; refinishing equip-ment; and centralized lubrication systems. The Other Engineered Products Group produces fire-fighting pumps, rescue tools and other components and systems for the fire and rescue industry,and engineered stainless steel banding and clamping devices used in a variety of industrial andcommercial applications.
Performance in 2003 Compared with 2002
Orders, sales, net income and earnings per share were higher in 2003 compared with 2002. Neworders in 2003 totaled $797.8 million and were 6% higher than the prior year. Excluding the impactof the five acquisitions made since the beginning of 2002 and foreign currency translation, orderswere essentially unchanged from last year.
Sales in 2003 of $797.9 million were 8% higher than the $742.0 million recorded a year ago.Acquisitions and foreign currency translation accounted for an improvement of 2% and 5%, respec-tively, while base business sales rose by 1%. Domestic sales increased by 1%, while internationalsales, net of foreign currency translation, were 8% higher. For the year, international sales were45% of total sales, up from 41% in 2002.
In 2003, the Pump Products Group contributed 57% of sales and 55% of operating income,the Dispensing Equipment Group accounted for 20% of both sales and operating income, and theOther Engineered Products Group represented 23% of sales and 25% of operating income.
Pump Products Group sales of $456.5 million in 2003 increased by $19.9 million, or 5%, com-pared with 2002. Acquisitions and foreign currency translation accounted for a 5% and 2% salesimprovement, respectively, but this was offset by a 2% decline in base business activity. In 2003,domestic sales increased slightly and international sales increased by 12% compared with last year.Excluding acquisitions, base U.S. sales volume decreased by 4%, while base international salesincreased by 7%. Sales to customers outside the U.S. were 39% of total group sales in 2003, upfrom 37% in 2002.
Dispensing Equipment Group sales of $159.2 million increased by $20.5 million, or 15%, in2003 compared with the prior year, mainly due to favorable foreign currency translation of 13% anda 2% increase in base business activity. Domestic sales decreased by 5% compared with 2002,while international sales increased by 32%. Sales to customers outside the U.S. were 62% of totalgroup sales in 2003, up from 54% in 2002.
Other Engineered Products Group sales of $185.0 million increased by $15.3 million, or 9%, in2003 compared with 2002. Foreign currency translation and increased base business activity providedan improvement of 5% and 10%, respectively, but this was partially offset by a 6% decline due to thesale of a product line. In 2003, domestic sales increased by 7% and international sales increased by29%. Sales to customers outside the U.S. were 43% of total group sales in 2003, up from 38% in 2002.
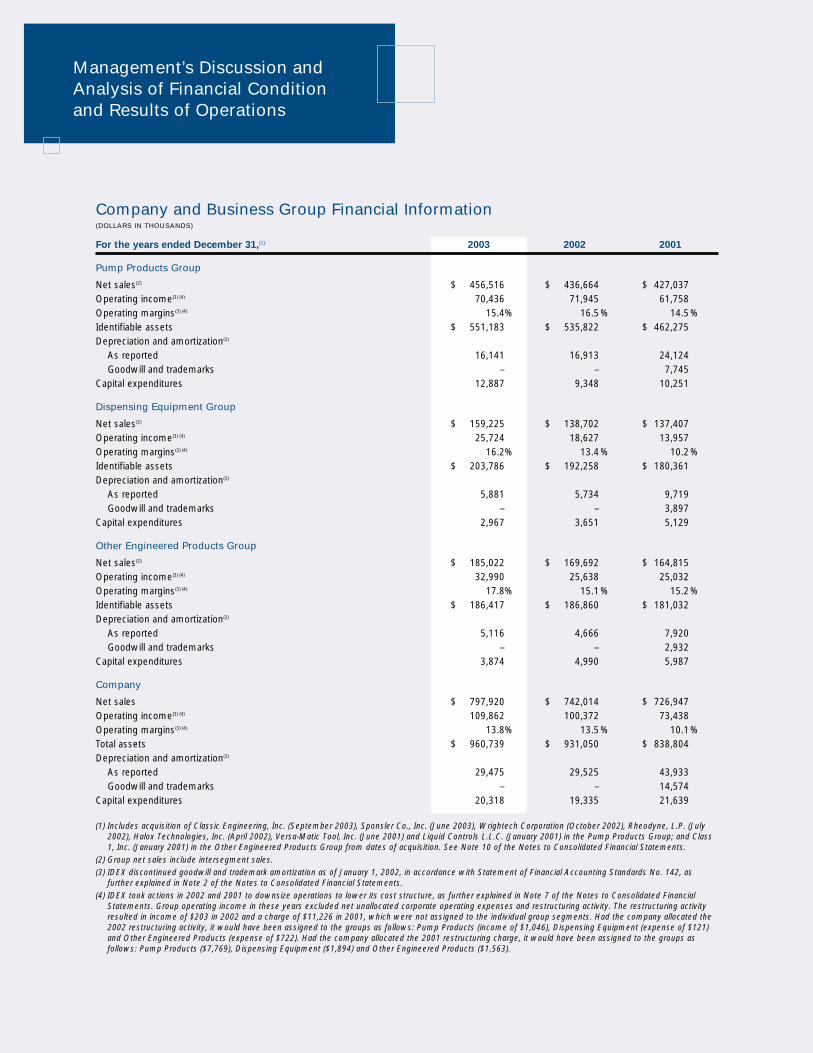
Company and Business Group Financial Information(DOLLARS IN THOUSANDS)
For the years ended December 31,(1) 2003 2002 2001
Pump Products Group
Net sales(2) $ 456,516 $ 436,664 $ 427,037Operating income(3) (4) 70,436 71,945 61,758Operating margins(3) (4) 15.4% 16.5% 14.5%Identifiable assets $ 551,183 $ 535,822 $ 462,275Depreciation and amortization(3)
As reported 16,141 16,913 24,124Goodwill and trademarks – – 7,745
Capital expenditures 12,887 9,348 10,251
Dispensing Equipment Group
Net sales(2) $ 159,225 $ 138,702 $ 137,407Operating income(3) (4) 25,724 18,627 13,957Operating margins(3) (4) 16.2% 13.4% 10.2%Identifiable assets $ 203,786 $ 192,258 $ 180,361Depreciation and amortization(3)
As reported 5,881 5,734 9,719Goodwill and trademarks – – 3,897
Capital expenditures 2,967 3,651 5,129
Other Engineered Products Group
Net sales(2) $ 185,022 $ 169,692 $ 164,815Operating income(3) (4) 32,990 25,638 25,032Operating margins(3) (4) 17.8% 15.1% 15.2%Identifiable assets $ 186,417 $ 186,860 $ 181,032Depreciation and amortization(3)
As reported 5,116 4,666 7,920Goodwill and trademarks – – 2,932
Capital expenditures 3,874 4,990 5,987
Company
Net sales $ 797,920 $ 742,014 $ 726,947Operating income(3) (4) 109,862 100,372 73,438Operating margins(3) (4) 13.8% 13.5% 10.1%Total assets $ 960,739 $ 931,050 $ 838,804Depreciation and amortization(3)
As reported 29,475 29,525 43,933Goodwill and trademarks – – 14,574
Capital expenditures 20,318 19,335 21,639
(1) Includes acquisition of Classic Engineering, Inc. (September 2003), Sponsler Co., Inc. (June 2003), Wrightech Corporation (October 2002), Rheodyne, L.P. (July2002), Halox Technologies, Inc. (April 2002), Versa-Matic Tool, Inc. (June 2001) and Liquid Controls L.L.C. (January 2001) in the Pump Products Group; and Class1, Inc. (January 2001) in the Other Engineered Products Group from dates of acquisition. See Note 10 of the Notes to Consolidated Financial Statements.
(2) Group net sales include intersegment sales.(3) IDEX discontinued goodwill and trademark amortization as of January 1, 2002, in accordance with Statement of Financial Accounting Standards No. 142, as
further explained in Note 2 of the Notes to Consolidated Financial Statements. (4) IDEX took actions in 2002 and 2001 to downsize operations to lower its cost structure, as further explained in Note 7 of the Notes to Consolidated Financial
Statements. Group operating income in these years excluded net unallocated corporate operating expenses and restructuring activity. The restructuring activityresulted in income of $203 in 2002 and a charge of $11,226 in 2001, which were not assigned to the individual group segments. Had the company allocated the2002 restructuring activity, it would have been assigned to the groups as follows: Pump Products (income of $1,046), Dispensing Equipment (expense of $121)and Other Engineered Products (expense of $722). Had the company allocated the 2001 restructuring charge, it would have been assigned to the groups as follows: Pump Products ($7,769), Dispensing Equipment ($1,894) and Other Engineered Products ($1,563).
Management’s Discussion andAnalysis of Financial Condition and Results of Operations

IDEX Corporation 2003 Annual Report 21
Gross profit of $309.3 million in 2003 was $27.9 million higherthan 2002. As a percent of sales, gross profit was 38.8% in 2003,which represented an increase from 37.9% in 2002. The higher grossprofit margin primarily reflects reduced material costs from ourincreased global sourcing activities and savings from Six Sigma,Kaizen and Lean Manufacturing initiatives, which more than offsetincreased research and development expenses.
Selling, general and administrative (SG&A) expenses increased to$199.5 million in 2003 from $181.3 million in 2002. This increase was partly due to the inclusion of five acquisitions that incrementally added $4.4million of cost. This increase also reflects the deliberate reinvestment inthe business to drive organic growth, as well as certain cost increasesincluding pension, insurance, audit and legal expenses. As a percent of netsales, SG&A expenses were 25.0%, up from 24.4% in 2002. While 2003SG&A expenses are up for the reasons noted, we do not believe this isindicative of a significant negative trend.
We also generated income related to restructuring activity of $.2million in 2002. For more details on our restructuring programs, see“Restructuring Actions” on page 24.
Operating income increased by $9.5 million, or 9%, to $109.9million in 2003 from $100.4 million in 2002, primarily due to higher2003 gross profit, offset by increased SG&A expenses. Operatingmargins in 2003 were 13.8% of sales, compared with 13.5% in 2002.
As described in footnote 4 of the “Company and BusinessGroup Financial Information” table on page 20, each group’s operatingincome and margins exclude restructuring activity in 2002 and 2001.In the Pump Products Group, operating income of $70.4 million andoperating margin of 15.4% decreased in 2003 compared with $71.9million and 16.5% recorded in 2002. The decline in operating marginwas due to a number of factors including new product development,additional sales/marketing resources, ERP implementation andreduced volume in some of our more profitable base businesses.Operating income for the Dispensing Equipment Group increased to$25.7 million from $18.6 million last year, and operating marginsimproved to 16.2% from 13.4% recorded in 2002. The marginincrease was mainly due to increased volumes. Operating income inthe Other Engineered Products Group of $33.0 million and operatingmargin of 17.8% increased from $25.6 million and 15.1% achieved in2002. The improvement in margins was mostly attributable toimproved sales volumes.
Other income of $.9 million in 2003 was $1.0 million higher thanthe $.1 million of expense in 2002. In 2003, we benefitted from a foreigncurrency exchange gain associated with the anticipated funding of theManfred Vetter acquisition in early January 2004.
Interest expense decreased to $14.1 million in 2003 from $16.4million in 2002. The decrease was principally due to lower debt levelsresulting from debt paydowns from operating cash flow and a lowerinterest rate environment.
The provision for income taxes increased to $34.3 million in 2003 from$29.8 million in 2002. The effective tax rate was 35.5% for both periods.
Net income was $62.4 million, or $1.87 per share, comparedwith $54.1 million, or $1.67 per share, in 2002.
Performance in 2002 Compared with 2001
Orders, sales, net income and earnings per share were higher in 2002compared with 2001. New orders in 2002 totaled $749.8 million andwere 5% higher than the prior year. Excluding the impact of the fouracquisitions made since mid-2001 and foreign currency translation,orders were 1% higher than in 2001.
Sales in 2002 of $742.0 million were 2% higher than the $726.9million recorded in the prior year. Acquisitions and foreign currencytranslation accounted for an improvement of 3% and 1%, respective-ly, but this was offset by a 2% decline in the base businesses.Domestic sales increased by 3%, while international sales, net of for-eign currency translation, decreased by 2%. For the year, internation-al sales were 41% of total sales, down slightly from 42% in 2001.
In 2002, the Pump Products Group contributed 58% of sales and62% of operating income, the Dispensing Equipment Group account-ed for 19% of sales and 16% of operating income, and the OtherEngineered Products Group represented 23% of sales and 22% ofoperating income.
Pump Products Group sales of $436.7 million in 2002 increasedby $9.6 million, or 2%, compared with 2001. Acquisitions accountedfor a 5% sales improvement, but this was partially offset by a 3%decline in base business activity. In 2002, domestic and internationalsales increased by 3% and 1%, respectively, compared with last year.Excluding acquisitions, base business sales volume in both the U.S.and internationally decreased by 3%. Sales to customers outside theU.S. were 37% of total group sales in 2002, unchanged from 2001.
Dispensing Equipment Group sales of $138.7 million increasedby $1.3 million, or 1%, in 2002 compared with the prior year.Domestic by sales increased by 7% compared with 2001, while inter-national sales decreased by 4%. Sales to customers outside the U.S.were 54% of total group sales in 2002, down from 57% in 2001.
Other Engineered Products Group sales of $169.7 millionincreased by $4.9 million, or 3%, in 2002 compared with 2001. In2002, domestic sales increased by 1%, while international sales grewby 6%. Sales to customers outside the U.S. were 42% of total groupsales in 2002, up slightly from 41% in 2001.
Gross profit of $281.4 million in 2002 was $17.7 million higherthan in 2001. As a percent of sales, gross profit was 37.9% in 2002,compared with 36.3% in 2001. The higher gross profit margin prima-rily reflected reduced material costs from our increased GlobalSourcing activities, benefits from our Kaizen, Lean and Six Sigmaactivities plus savings from actions to consolidate certain productionfacilities.

Management’s Discussion andAnalysis of Financial Condition and Results of Operations
From left to right, seated: Chuck Hemann (Director – eBusiness), DennisMetcalf (Vice President – Corporate Development), Kim Bors (VicePresident – Human Resources)
From left to right, standing: Frank Notaro (Vice President – GeneralCounsel and Secretary), Dave Kamath (Chief Information Officer)
SG&A expenses increased to $181.3 million in 2002 from $164.9million in 2001. This increase was due primarily to including four acqui-sitions that incrementally added $5.2 million of cost, and increasedspending on corporate initiatives and new product/market develop-ment. The increased corporate initiative costs included both imple-mentation and training expenses for programs such as Six Sigma,Lean, Kaizen and Global Sourcing, as well as eBusiness. The goal ofthese efforts is to increase the company’s organic sales and profitgrowth. As a percent of net sales, SG&A expenses were 24.4%, upfrom 22.7% in 2001.
In accordance with the new accounting rules, we discontinuedamortization of goodwill and trademarks as of January 1, 2002. As aresult, we did not record any goodwill and trademark amortizationexpense in 2002 compared with $14.6 million in 2001.
We also generated income related to restructuring activity of $.2million in 2002 compared with a restructuring charge in 2001 of $11.2million. For more details on our restructuring programs, see“Restructuring Actions” on page 24.
Operating income increased by $26.9 million, or 37%, to $100.4million in 2002 from $73.4 million in 2001. This was due primarily to theabsence of goodwill and trademark amortization in 2002, the restruc-turing charge recorded in 2001 and higher 2002 gross profit. Thisincrease was partially offset by increased SG&A expenses in 2002.Operating margins in 2002 were 13.5% compared with 10.1% in 2001.
As described in footnote 4 of the “Company and Business GroupFinancial Information” table on page 20, each group’s operating incomeand margins exclude restructuring activity. In the Pump Products Group,operating income of $71.9 million and operating margins of 16.5% in2002, compared with $61.8 million and 14.5% in 2001. Operatingincome for the Dispensing Equipment Group increased to $18.6 millionfrom $14.0 million last year, and operating margins improved to 13.4%from 10.2% in 2001. Operating income in the Other EngineeredProducts Group of $25.6 million and operating margins of 15.1% com-pared with the $25.0 million and 15.2% achieved in 2001.
In the Pump Products Group, 2001 operating income and mar-gins excluding goodwill and trademark amortization of $7.7 million, or1.8% of sales, were $69.5 million and 16.3%, respectively. In theDispensing Equipment Group, operating income and margins in 2001were $17.9 million and 13.0%, respectively, excluding goodwill andtrademark amortization of $3.9 million, or 2.8% of sales. Operatingincome and margins in the Other Engineered Products Group in 2001were $27.9 million and 17.0%, respectively, excluding goodwill andtrademark amortization of $2.9 million, or 1.8% of sales.
The expenses related to the corporate initiatives of eBusiness(including ERP implementation), Six Sigma, Lean, Kaizen, and GlobalSourcing are allocated to the reporting units in each segment basedon expected usage. The businesses in the Pump Products andDispensing Equipment segments have been more successful thanthose in the Other Engineered Products segment at offsetting theSG&A cost increases resulting from the corporate initiatives, newproduct/market development, and other cost increases, with efficien-cies related to the initiatives as well as other operational improve-ments. The Other Engineered Products Group also was affected byhigher than normal costs associated primarily with ERP implementa-tions and a reserve established for a patent infringement suit.
Interest expense decreased to $16.4 million in 2002 from $20.7million in 2001. The decrease was due principally to lower debt levelsas a result of debt paydowns from operating cash flow and proceedsfrom a common stock offering, and a lower interest rate environment.
The provision for income taxes increased to $29.8 million in2002 from $20.7 million in 2001. The effective tax rate decreased to35.5% in 2002 from 38.8% in 2001. This was due primarily to the discontinuation of goodwill and trademark amortization in 2002, a portion of which was nondeductible for tax purposes.
Net income was $54.1 million, or $1.67 per share, comparedwith $32.7 million, or $1.05 per share, in 2001. When adjusted toexclude goodwill and trademark amortization of $11.4 million, or $.37per share, net income and earnings per share in 2001 were $44.1 million and $1.42 per share, respectively.
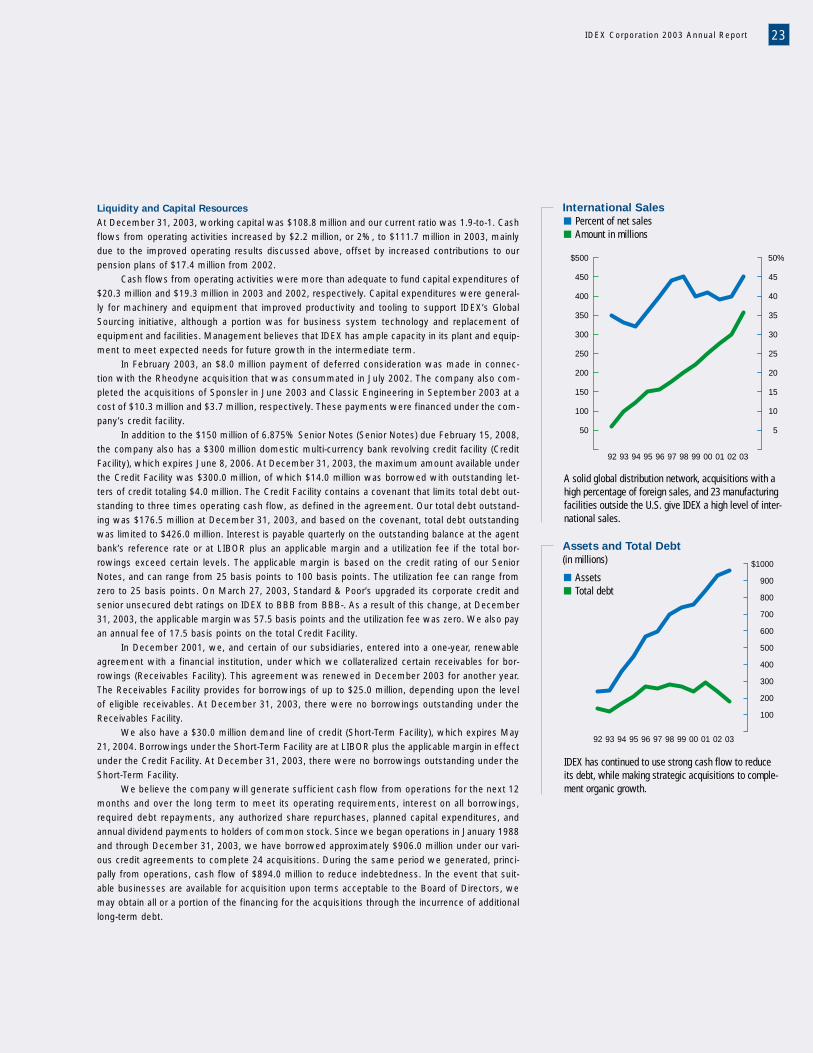
IDEX Corporation 2003 Annual Report 23
Liquidity and Capital Resources
At December 31, 2003, working capital was $108.8 million and our current ratio was 1.9-to-1. Cashflows from operating activities increased by $2.2 million, or 2%, to $111.7 million in 2003, mainlydue to the improved operating results discussed above, offset by increased contributions to ourpension plans of $17.4 million from 2002.
Cash flows from operating activities were more than adequate to fund capital expenditures of$20.3 million and $19.3 million in 2003 and 2002, respectively. Capital expenditures were general-ly for machinery and equipment that improved productivity and tooling to support IDEX’s GlobalSourcing initiative, although a portion was for business system technology and replacement ofequipment and facilities. Management believes that IDEX has ample capacity in its plant and equip-ment to meet expected needs for future growth in the intermediate term.
In February 2003, an $8.0 million payment of deferred consideration was made in connec-tion with the Rheodyne acquisition that was consummated in July 2002. The company also com-pleted the acquisitions of Sponsler in June 2003 and Classic Engineering in September 2003 at acost of $10.3 million and $3.7 million, respectively. These payments were financed under the com-pany’s credit facility.
In addition to the $150 million of 6.875% Senior Notes (Senior Notes) due February 15, 2008,the company also has a $300 million domestic multi-currency bank revolving credit facility (CreditFacility), which expires June 8, 2006. At December 31, 2003, the maximum amount available underthe Credit Facility was $300.0 million, of which $14.0 million was borrowed with outstanding let-ters of credit totaling $4.0 million. The Credit Facility contains a covenant that limits total debt out-standing to three times operating cash flow, as defined in the agreement. Our total debt outstand-ing was $176.5 million at December 31, 2003, and based on the covenant, total debt outstandingwas limited to $426.0 million. Interest is payable quarterly on the outstanding balance at the agentbank’s reference rate or at LIBOR plus an applicable margin and a utilization fee if the total bor-rowings exceed certain levels. The applicable margin is based on the credit rating of our SeniorNotes, and can range from 25 basis points to 100 basis points. The utilization fee can range fromzero to 25 basis points. On March 27, 2003, Standard & Poor’s upgraded its corporate credit andsenior unsecured debt ratings on IDEX to BBB from BBB-. As a result of this change, at December31, 2003, the applicable margin was 57.5 basis points and the utilization fee was zero. We also payan annual fee of 17.5 basis points on the total Credit Facility.
In December 2001, we, and certain of our subsidiaries, entered into a one-year, renewableagreement with a financial institution, under which we collateralized certain receivables for bor-rowings (Receivables Facility). This agreement was renewed in December 2003 for another year.The Receivables Facility provides for borrowings of up to $25.0 million, depending upon the levelof eligible receivables. At December 31, 2003, there were no borrowings outstanding under theReceivables Facility.
We also have a $30.0 million demand line of credit (Short-Term Facility), which expires May21, 2004. Borrowings under the Short-Term Facility are at LIBOR plus the applicable margin in effectunder the Credit Facility. At December 31, 2003, there were no borrowings outstanding under theShort-Term Facility.
We believe the company will generate sufficient cash flow from operations for the next 12months and over the long term to meet its operating requirements, interest on all borrowings,required debt repayments, any authorized share repurchases, planned capital expenditures, andannual dividend payments to holders of common stock. Since we began operations in January 1988and through December 31, 2003, we have borrowed approximately $906.0 million under our vari-ous credit agreements to complete 24 acquisitions. During the same period we generated, princi-pally from operations, cash flow of $894.0 million to reduce indebtedness. In the event that suit-able businesses are available for acquisition upon terms acceptable to the Board of Directors, wemay obtain all or a portion of the financing for the acquisitions through the incurrence of additionallong-term debt.
A solid global distribution network, acquisitions with ahigh percentage of foreign sales, and 23 manufacturingfacilities outside the U.S. give IDEX a high level of inter-national sales.
50
100
150
200
250
300
350
400
450
$500
5
10
15
20
25
30
35
40
45
50%
92 93 94 95 96 97 009998 030201
International Sales
Percent of net sales Amount in millions
IDEX has continued to use strong cash flow to reduce its debt, while making strategic acquisitions to comple-ment organic growth.
100
200
300
400
500
600
700
800
900
$1000
92 93 94 95 96 97 009998 030201
Assets and Total Debt
(in millions)
AssetsTotal debt
Management’s Discussion andAnalysis of Financial Condition and Results of Operations
Contractual Obligations, Commitments
and Off-Balance Sheet Arrangements
Our contractual obligations and commercial commitments include rentalpayments under operating leases, payments under capital leases, andother long-term obligations arising in the ordinary course of business.We have no off-balance sheet arrangements or material long-termpurchase obligations. There are no identifiable events or uncertainties,including the lowering of our credit rating, that would accelerate pay-ment or maturity of any of these commitments or obligations.
The following table summarizes our significant contractual obli-gations and commercial commitments at December 31, 2003, and thefuture periods in which such obligations are expected to be settled incash. In addition, the table reflects the timing of principal payments onoutstanding borrowings. Additional detail regarding these obligationsare provided in the Notes to Consolidated Financial Statements, asreferenced in the table:
Payments Less More
Due by Period than 1-3 3-5 than(IN THOUSANDS) Total 1 Year Years Years 5 Years
Borrowings(Note 9) $176,546 $ 12,546 $ 14,000 $ 150,000 $ –
Operating lease commitments (Note 5) 23,631 6,869 8,769 4,036 3,957
Capital lease obligations(1) 3,183 3,180 3 – –
Purchase obligations(2) 29,101 25,690 3,253 158 –
Total contractual obligations(3) $232,461 $ 48,285 $ 26,025 $ 154,194 $ 3,957
(1) Comprised primarily of property leases(2) Comprised primarily of inventory commitments(3) Comprised of liabilities recorded on the balance sheet of $203,360, andobligations not recorded on the balance sheet $29,101
The company also has obligations with respect to its pensionand postretirement medical benefit plans. See Note 14 of the Notesto Consolidated Financial Statements.
Restructuring Actions
IDEX took actions in 2002 and 2001 to downsize operations to lowerits cost structure. The restructuring affected all three business groupsand reduced the workforce, lowered costs, improved efficiencies andaddressed excess capacity that resulted from lower demand andmore efficient processes. These steps were necessary to appropri-ately size the company’s production capacity to match the declininglevels of demand for a broad range of products. The restructuringactions affected multiple employee groups in approximately 20 loca-tions across 11 of our business units. No business activities or prod-uct lines were abandoned. The restructuring actions included the lay-off of 508 employees with 250 terminations resulting from the firstquarter 2001 plan, 231 from the fourth quarter 2001 plan, and 27 fromthe second quarter 2002 plan. All costs of the restructuring activitieswere charged to expense and included in the single caption“Restructuring activity” in the Consolidated Statements of Operations.The restructuring charges included employee severance, fringe benefits,
outplacement fees, idle facility carrying costs, lease termination costs,the loss on sale of equipment and the loss on disposal of two manu-facturing facilities owned by the company. Determination of therestructuring charges was based on the estimated severance benefitspaid to terminated employees, the net book value of surplus assetsless expected proceeds, and estimated other costs. The restructuringplans have been executed substantially as originally planned.
The restructuring activity resulted in income of $.2 million in2002. This related to a reversal of $1.5 million of restructuring expens-es initially recorded, which more than offset the 2002 charges of $1.3million. Of the $1.5 million reversal, $1.1 million was attributed to thesale of a manufacturing facility for more than the value estimated atthe time the restructuring plan was adopted. For additional detailrelated to restructuring activity, see Note 7 of Notes to ConsolidatedFinancial Statements.
Critical Accounting Estimates
We believe that the application of the following accounting policies,which are important to our financial position and results of operations,requires significant judgments and estimates on the part of manage-ment. For a summary of all of our accounting policies, including theaccounting policies discussed below, see Note 1 of the Notes toConsolidated Financial Statements.
Revenue recognition - We recognize revenue from product saleswhen title passes and the risks of ownership have passed to the cus-tomer, based on the terms of the sale. Our customary terms are FOBshipping point. We estimate and record provisions for sales returns,sales allowances and original warranties in the period the related prod-ucts are sold, in each case based on our historical experience. To theextent actual results differ from these estimated amounts, resultscould be adversely affected.
Noncurrent assets – The company evaluates the recoverabilityof certain noncurrent assets utilizing various estimation processes.In particular, the recoverability of December 31, 2003 balances forgoodwill and intangible assets of $559.0 million and $19.4 million,respectively, are subject to estimation processes, which depend onthe accuracy of underlying assumptions, including future operatingresults. The company evaluates the recoverability of each of theseassets based on estimated business values and estimated future cashflows (derived from estimated earnings and cash flow multiples). Therecoverability of these assets depends on the reasonableness ofthese assumptions and how they compare with the eventual operat-ing performance of the specific businesses to which the assets areattributed. To the extent actual business values or cash flows differfrom those estimated amounts, the recoverability of these noncurrentassets could be affected.
Income taxes – Deferred taxes are recognized for the future taxeffects of temporary differences between financial and income taxreporting using tax rates in effect for the years in which the differencesare expected to reverse. Federal income taxes are provided on that portion of the income of foreign subsidiaries that is expected to beremitted to the United States and be taxable. The management of thecompany, along with third-party advisors, periodically estimates the com-pany’s probable tax obligations using historical experience in tax jurisdictions and informed judgments. To the extent actual results differfrom these estimated amounts, results could be adversely affected.

IDEX Corporation 2003 Annual Report 25
Contingencies and litigation – We are currently involved in certain legaland regulatory proceedings and, as required and where it is reason-ably possible to do so, have accrued our estimates of the probablecosts for the resolution of these matters. These estimates have beendeveloped in consultation with outside counsel and are based upon ananalysis of potential results, assuming a combination of litigation andsettlement strategies. It is possible, however, that future operatingresults for any particular quarterly or annual period could be materiallyaffected by changes in our assumptions or the effectiveness of ourstrategies related to these proceedings.
Defined benefit retirement plans – The plan obligations and relat-ed assets of defined benefit retirement plans are presented in Note14 of the Notes to Consolidated Financial Statements. Plan assets,which consist primarily of marketable equity and debt instruments,are valued using market quotations. Plan obligations and the annualpension expense are determined by consulting actuaries using a num-ber of assumptions. Key assumptions in measuring the plan obliga-tions include the discount rate at which the obligation could be effec-tively settled and the anticipated rate of future salary increases. Keyassumptions in the determination of the annual pension expenseinclude the discount rate, the rate of salary increases, and the esti-mated future return on plan assets. To the extent actual amounts dif-fer from these assumptions and estimated amounts, results could beadversely affected.
Registration Statement Filings for Common Stock Offerings
In March 2002, we filed a registration statement on Form S-3 with theSecurities and Exchange Commission (SEC) covering the secondaryoffering of 2,939,199 shares of common stock owned by IDEXAssociates, L.P. In April 2002, that registration statement was amend-ed to also include the secondary offering of 560,801 shares of IDEXcommon stock owned by KKR Associates, L.P., and the primary offer-ing of 1,500,000 shares of IDEX common stock. Also in April 2002, weannounced the pricing of this public offering at $36 per commonshare. Subsequently, the overallotment option was exercised by theunderwriter for the sale of an additional 750,000 secondary sharesowned by KKR Associates, L.P., bringing the total offering to5,750,000 shares. The $50.8 million of net proceeds we received wasused to repay debt under the Credit Facility. This increased theamount available for borrowing under the facility, which we will con-tinue to use for general corporate purposes, including acquisitions.
In September 2002, we filed a registration statement on FormS-3 with the SEC covering the secondary offering of 1,350,000 sharesof IDEX common stock owned by KKR Associates, L.P. This offering,completed in January 2003, did not increase the number of IDEXshares outstanding, and the company did not receive any proceedsfrom the offering.
The secondary shares covered by both of these registrationstatements had been owned by KKR Associates, L.P. and IDEXAssociates, L.P. since IDEX was formed in January 1988.
New Accounting Pronouncements
In November 2002, the Financial Accounting Standards Board (FASB)issued Interpretation No. 45 (FIN 45), “Guarantor’s Accounting andDisclosure Requirements for Guarantees, Including Indirect Guaranteesof Indebtedness of Others”. FIN 45 elaborates on the disclosures tobe made by a guarantor in its interim and annual financial statementsregarding its obligations under certain guarantees that it has issued. It
also requires a guarantor to recognize, at inception of a guarantee, a lia-bility for the fair value of the obligation undertaken in issuing the guaran-tee. The company adopted this interpretation effective January 1, 2003.
In January 2003, the FASB issued Interpretation No. 46,“Consolidation of Variable Interest Entities”, which was revised inDecember 2003. This interpretation addresses consolidation requirements of variable interest entities. The effective date for thecompany will be March 31, 2004. The company does not expect thisinterpretation to have a material impact on its results of operations,financial condition, or cash flows.
In May 2003, the FASB issued Statement of Financial AccountingStandards (SFAS) No. 150, “Accounting for Certain FinancialInstruments with Characteristics of both Liabilities and Equity”, whichestablishes standards for how an issuer classifies and measures cer-tain financial instruments with characteristics of both liabilities andequity. The company adopted this SFAS effective September 30,2003. This SFAS had no impact on the company’s results of opera-tions, financial condition, or cash flows.
In December 2003, the FASB issued SFAS No. 132 (Revised),“Employers’ Disclosures about Pensions and Other PostretirementBenefits”. This revised SFAS modifies the financial statement disclo-sures for defined benefit plans. These modifications increase disclosureof plan assets, benefit obligations, cash flows, benefit costs and otherrelated information. The implementation of SFAS No. 132 (Revised)was effective for the company on December 31, 2003. The companyhas included SFAS No. 132 (Revised) disclosures in Note 14 of theNotes to Consolidated Financial Statements.
Market Risk
We are subject to market risk associated with changes in interestrates and foreign currency exchange rates. Interest rate exposure islimited to the $176.5 million of total debt outstanding at December 31,2003. Approximately 13% of the debt is priced at interest rates thatfloat with the market. A 50 basis point movement in the interest rateon the floating rate debt would result in an approximate $.1 millionannualized increase or decrease in interest expense and cash flows.The remaining debt is fixed rate debt. We will, from time to time,enter into interest rate swaps on our debt when we believe there is afinancial advantage for doing so. A treasury risk management policy,adopted by the Board of Directors, describes the procedures and con-trols over derivative financial and commodity instruments, includinginterest rate swaps. Under the policy, we do not use derivative finan-cial or commodity instruments for trading purposes, and the use ofthese instruments is subject to strict approvals by senior officers.Typically, the use of derivative instruments is limited to interest rateswaps on the company’s outstanding long-term debt.
Our foreign currency exchange rate risk is limited principally tothe euro and British pound. We manage our foreign exchange riskprincipally through invoicing our customers in the same currency asthe source of our products. As a result, the company’s exposure toany movement in foreign currency exchange rates is immaterial to theConsolidated Statements of Operations.
At December 31, 2003, the company had a foreign currency con-tract that it entered into in anticipation of the funding of the January2004 purchase of Manfred Vetter. The increase in fair market value ofthis contract resulted in income of $.5 million at December 31, 2003,and was included in “Other income (expense) – net” in theConsolidated Statements of Operations.

As of December 31, 2003 2002
Assets
Current assetsCash and cash equivalents $ 8,552 $ 6,952Receivables – net 101,859 101,494Inventories 105,304 105,580Other current assets 8,781 7,234
Total current assets 224,496 221,260Property, plant and equipment – net 147,095 148,246Goodwill – net 559,008 530,663Intangible assets – net 19,401 19,377Other noncurrent assets 10,739 11,504
Total assets $ 960,739 $ 931,050
Liabilities and Shareholders’ Equity
Current liabilitiesTrade accounts payable $ 56,252 $ 61,153Dividends payable 4,622 4,548Accrued expenses 54,807 42,631
Total current liabilities 115,681 108,332Long-term debt 176,546 241,051Other noncurrent liabilities 76,410 74,876
Total liabilities 368,637 424,259
Commitments and Contingencies (Note 5)
Shareholders’ equity Common stock, par value $.01 per share
Shares issued and outstanding: 2003 – 33,075,552; 2002 – 32,536,166 331 325Additional paid-in capital 198,165 182,538Retained earnings 375,629 331,635Minimum pension liability adjustment (12,481) (10,571)Accumulated translation adjustment 35,892 9,240Treasury stock, at cost: 2003 – 89,485 shares; 2002 - 59,350 shares (2,903) (1,946)Unearned compensation on restricted stock (2,531) (4,430)
Total shareholders’ equity 592,102 506,791Total liabilities and shareholders’ equity $ 960,739 $ 931,050
See Notes to Consolidated Financial Statements.
Consolidated Balance Sheets
(DOLLARS IN THOUSANDS EXCEPT PER SHARE AMOUNTS)

For the years ended December 31, 2003 2002 2001
Net sales $ 797,920 $ 742,014 $ 726,947Cost of sales 488,600 460,576 463,225
Gross profit 309,320 281,438 263,722Selling, general and administrative expenses 199,458 181,269 164,893Goodwill amortization – – 14,165Restructuring activity – (203) 11,226
Operating income 109,862 100,372 73,438Other income (expense) – net 899 (123) 731
Income before interest expense and income taxes 110,761 100,249 74,169Interest expense 14,091 16,354 20,738
Income before income taxes 96,670 83,895 53,431Provision for income taxes 34,318 29,783 20,721
Net income $ 62,352 $ 54,112 $ 32,710
Earnings Per Common Share
Basic earnings per common share $ 1.92 $ 1.71 $ 1.08
Diluted earnings per common share $ 1.87 $ 1.67 $ 1.05
Share Data
Basic weighted average common shares outstanding 32,530 31,669 30,222
Diluted weighted average common shares outstanding 33,315 32,483 31,047
See Notes to Consolidated Financial Statements.
Consolidated Statements of Operations
(IN THOUSANDS EXCEPT PER SHARE AMOUNTS)
IDEX Corporation 2003 Annual Report 27

Consolidated Shareholders’ Equity
(DOLLARS IN THOUSANDS EXCEPT PER SHARE AMOUNTS)
Minimum Unrealized Unearned
Common stock pension Accumulated gains compensation Total
and additional Retained liability translation (losses) on Treasury on restricted shareholders’
paid-in capital earnings adjustment adjustment derivatives stock stock equity
Balance, December 31, 2000 $ 115,583 $ 279,907 $ (2,127) $ (10,489) $ – $ (144) $ (8,228) $ 374,502
Net income 32,710 32,710Other comprehensive income, net of tax
Unrealized translation adjustment 263 263Cumulative effect of change in
accounting principle 204 204Unrealized derivative losses (344) (344)Minimum pension adjustment 344 344
Other comprehensive income 344 263 (140) 467Comprehensive income 32,710 344 263 (140) 33,177
Issuance of 498,462 shares of common stock from exercise of stock options, and deferred compensation plans 9,383 9,383
Amortization of restrictedcommon stock award 1,899 1,899
Restricted shares surrendered for tax withholdings (721) (721)
Cash dividends declared – $.56 percommon share outstanding (17,128) (17,128)
Balance, December 31, 2001 124,966 295,489 (1,783) (10,226) (140) (865) (6,329) 401,112
Net income 54,112 54,112Other comprehensive income, net of tax
Unrealized translation adjustment 19,466 19,466Reversal of unrealized derivative losses 140 140Minimum pension adjustment (8,788) (8,788)
Other comprehensive income (8,788) 19,466 140 10,818Comprehensive income 54,112 (8,788) 19,466 140 64,930
Issuance of 272,973 shares of common stock from exercise of stock options, and deferred compensation plans 7,061 7,061
Issuance of 1,500,000 shares of common stock 50,836 50,836
Amortization of restrictedcommon stock award 1,899 1,899
Restricted shares surrendered for tax withholdings (1,081) (1,081)
Cash dividends declared – $.56 percommon share outstanding (17,966) (17,966)
Balance, December 31, 2002 182,863 331,635 (10,571) 9,240 – (1,946) (4,430) 506,791
Net income 62,352 62,352Other comprehensive income, net of tax
Unrealized translation adjustment 26,652 26,652Minimum pension adjustment (1,910) (1,910)
Other comprehensive income (1,910) 26,652 24,742Comprehensive income 62,352 (1,910) 26,652 87,094
Issuance of 539,386 shares of common stock from exercise of stock options, and deferred compensation plans 15,633 15,633
Amortization of restrictedcommon stock award 1,899 1,899
Restricted shares surrendered for tax withholdings (957) (957)
Cash dividends declared – $.56 percommon share outstanding (18,358) (18,358)
Balance, December 31, 2003 $198,496 $ 375,629 $ (12,481) $ 35,892 $ – $ (2,903) $ (2,531) $ 592,102
See Notes to Consolidated Financial Statements.

Consolidated Cash Flows
(IN THOUSANDS)
IDEX Corporation 2003 Annual Report 29
For the years ended December 31, 2003 2002 2001
Cash flows from operating activities
Net income $ 62,352 $ 54,112 $ 32,710
Adjustments to reconcile to net cash provided by operating activities:
Depreciation and amortization 27,146 27,103 26,354
Amortization of goodwill and other intangible assets 430 523 15,680
Amortization of unearned compensation on restricted stock 1,899 1,899 1,899
Amortization of debt issuance expenses 580 580 364
Deferred income taxes 10,487 9,592 (152)
Changes in:
Receivables - net 6,867 1,006 24,008
Inventories 4,624 6,246 22,232
Trade accounts payable 211 7,025 (7,207)
Accrued expenses 2,508 (310) (4,356)
Other – net (5,418) 1,709 (5,319)
Net cash flows from operating activities 111,686 109,485 106,213
Cash flows from investing activities
Additions to property, plant and equipment (20,318) (19,335) (21,639)
Acquisition of businesses (net of cash acquired) (21,954) (74,928) (132,295)
Proceeds from fixed asset disposals 3,436 3,934 1,808
Net cash flows from investing activities (38,836) (90,329) (152,126)
Cash flows from financing activities
Borrowings under credit facilities for acquisitions 21,954 74,928 132,295
Net repayments under credit facilities (85,387) (132,195) (77,858)
Net (repayments) borrowings of other long-term debt (1,686) 2,759 (3,470)
Proceeds from issuance of common stock – 50,836 –
Dividends paid (18,284) (17,721) (17,061)
Proceeds from stock option exercises 13,176 5,755 9,001
Other – net (1,023) (1,538) (437)
Net cash flows from financing activities (71,250) (17,176) 42,470
Net increase (decrease) in cash 1,600 1,980 (3,443)
Cash and cash equivalents at beginning of year 6,952 4,972 8,415
Cash and cash equivalents at end of year $ 8,552 $ 6,952 $ 4,972
Supplemental cash flow information
Cash paid for:
Interest $ 13,576 $ 16,232 $ 20,818
Income taxes 18,774 21,022 23,482
Significant non-cash activities
Debt acquired with acquisition of businesses – 2,136 2,931
See Notes to Consolidated Financial Statements.

Notes to Consolidated Financial Statements
(IN THOUSANDS EXCEPT PER SHARE AMOUNTS)
1. Significant Accounting Policies
BusinessIDEX Corporation (“IDEX” or the “Company”) is a manufacturer of abroad range of pumps, metering products, dispensing equipment, andother engineered products sold to a diverse customer base in a varietyof industries in the U.S. and internationally. Its products include indus-trial pumps, compressors, flow meters, injectors and valves, and related controls for use in a wide variety of process applications; precision-engineered equipment for dispensing, metering and mixingpaints, hair colorants and other personal care products; refinishingequipment; centralized lubrication systems; and engineered productsfor industrial and commercial markets, including fire and rescue, trans-portation equipment, oil and gas, electronics, and communications.These activities are grouped into three business segments: PumpProducts, Dispensing Equipment and Other Engineered Products.
Principles of ConsolidationThe consolidated financial statements include the Company and its subsidiaries. Significant intercompany transactions and accounts have been eliminated.
Use of EstimatesThe preparation of financial statements in conformity with accountingprinciples generally accepted in the United States requires manage-ment to make estimates and judgments that affect the reportedamounts of assets and liabilities, disclosure of contingent assets andliabilities, and reported amounts of revenue and expenses during thereporting period. Actual results could differ from those estimates. Theprincipal areas of estimation reflected in the financial statements arerevenue recognition noncurrent assets, income taxes, contingenciesand litigation, and defined benefit retirement plans.
Revenue RecognitionIDEX recognizes revenue from product sales when title passes andthe risks of ownership have passed to the customer, based on theterms of the sale. Customary terms are FOB shipping point. TheCompany estimates and records provisions for sales returns, salesallowances and original warranties in the period the related productsare sold, in each case based on its historical experience.
Cash EquivalentsThe Company considers all highly liquid debt instruments purchased with a maturity of three or fewer months to be cash equivalents.
InventoriesInventories are stated at the lower of cost or market. Cost – whichincludes labor, material and factory overhead – is determined on the first-in, first-out (FIFO) basis or the last-in, first-out (LIFO) basis.Generally, for other than newly introduced products, a reserve forexcess inventory is recorded for inventory on hand in excess of oneyear of historical usage. An obsolescence reserve is recorded for inven-tory made obsolete by marketplace, product or engineering changes.
Debt ExpensesExpenses incurred in securing and issuing debt are amortized over thelife of the related debt.
Earnings Per Common ShareEarnings per common share (EPS) are computed by dividing netincome by the weighted average number of shares of common stock(basic) plus common stock equivalents and unvested restricted shares(diluted) outstanding during the year. Common stock equivalents consist of stock options and deferred compensation equivalent units (DCUs)and have been included in the calculation of weighted average sharesoutstanding using the treasury stock method.
Basic weighted average shares outstanding reconciles to dilutedweighted average shares outstanding as follows:
2003 2002 2001
Basic weighted averagecommon shares outstanding 32,530 31,669 30,222
Dilutive effect ofstock options, DCUs and unvested restricted shares 785 814 825
Diluted weighted average common shares outstanding 33,315 32,483 31,047
Options to purchase approximately $.9 million shares of com-mon stock as of December 31, 2003, were not included in the com-putation of diluted EPS because the exercise price was greater thanthe average market price of the Company’s common stock and, there-fore, the effect of their inclusion would be antidilutive.
Stock OptionsThe Company uses the intrinsic-value method of accounting for stockoption awards as prescribed by Accounting Principles Bulletin No. 25and, accordingly, does not recognize compensation expense for itsstock option awards in the Consolidated Statements of Operations.
The following table reflects pro forma net income and netincome per share had the Company elected to adopt the fair valueapproach of Statement of Financial Accounting Standards (SFAS) No.123, “Accounting for Stock-Based Compensation”.
2003 2002 2001
Net incomeAs reported $ 62,352 $ 54,112 $ 32,710Pro forma 57,563 49,682 28,904
Basic EPSAs reported 1.92 1.71 1.08Pro forma 1.77 1.57 .96
Diluted EPSAs reported 1.87 1.67 1.05Pro forma 1.73 1.53 .93
The fair value of each option grant was estimated on the date ofgrant using the Black-Scholes option pricing model with the followingassumptions for 2003, 2002 and 2001, respectively: dividend yield of1.84%, 1.54% and 1.98%; volatility of 32.6%, 34.1% and 34.2%; risk-freeinterest rates of 3.2%, 4.5% and 4.9%; and expected lives of 5.5 years.
Depreciation and AmortizationDepreciation is recorded using the straight-line method. The estimat-ed useful lives used in the computation of depreciation of tangibleassets are as follows:
Land improvements . . . . . . . . . . . . . . . . . . . . . 10 to 12 yearsBuildings and improvements . . . . . . . . . . . . . . . 3 to 30 yearsMachinery and equipment
and engineering drawings . . . . . . . . . . . . . . . . 3 to 12 yearsOffice and transportation equipment . . . . . . . . . 3 to 10 years
Certain identifiable intangible assets are amortized over theirestimated useful lives using the straight-line method. Cost in excessof net assets acquired was amortized over a period of 30 to 40 yearsfor periods prior to 2002 (see Note 2).
The carrying amount of all long-lived assets is evaluated period-ically to determine if adjustment to the depreciation or amortizationperiod or to the unamortized balance is warranted. This evaluation isbased on the expected utilization of the long-lived assets and the pro-jected, undiscounted cash flows of the operations in which the long-lived assets are used.

IDEX Corporation 2003 Annual Report 31
Research and Development ExpendituresCosts associated with research and development are expensed in theyear incurred and included in “Cost of sales”. Research and develop-ment expenses – which include costs associated with developingnew products and major improvements to existing products – were$17,261, $12,738 and $10,127 in 2003, 2002 and 2001, respectively.
Foreign Currency TranslationThe functional currency of all operations outside the United States isthe respective local currency. All foreign currency balance sheetaccounts have been translated using the exchange rates in effect asof the balance sheet date. Income statement amounts have beentranslated using the average exchange rate for the year. The gains andlosses resulting from changes in exchange rates from year to yearhave been reported in “Accumulated translation adjustment” in theConsolidated Balance Sheet. The effect on the ConsolidatedStatements of Operations of transaction gains and losses is insignifi-cant for all years presented.
Fair Value of Financial InstrumentsThe carrying amounts of the Company’s financial instruments, includ-ing cash and trade receivables and payables, approximate their fairvalues.
Concentration of Credit RiskIDEX is not overly dependent on a single customer, the largest ofwhich accounted for about 2% of the Company’s net sales for allyears presented.
ReclassificationsCertain amounts in the prior years’ financial statements have beenreclassified to conform to the current year presentation.
New Accounting PronouncementsIn November 2002, the Financial Accounting Standards Board (FASB)issued Interpretation No. 45 (FIN 45), “Guarantor’s Accounting andDisclosure Requirements for Guarantees, Including IndirectGuarantees of Indebtedness of Others”. FIN 45 elaborates on the dis-closures to be made by a guarantor in its interim and annual financialstatements regarding its obligations under certain guarantees that ithas issued. It also requires a guarantor to recognize, at inception of aguarantee, a liability for the fair value of the obligation undertaken inissuing the guarantee. The Company adopted this interpretation effec-tive January 1, 2003.
In January 2003, the FASB issued Interpretation No. 46,“Consolidation of Variable Interest Entities”, which was revised inDecember 2003. This interpretation addresses consolidation require-ments of variable interest entities. The effective date for the Companywill be March 31, 2004. The Company does not expect that this inter-pretation will have a material impact on its results of operations, financialcondition, or cash flows.
In May 2003, the FASB issued SFAS No. 150, “Accounting forCertain Financial Instruments with Characteristics of both Liabilitiesand Equity”, which establishes standards for how an issuer classifiesand measures certain financial instruments with characteristics ofboth liabilities and equity. The Company adopted this SFAS effectiveSeptember 30, 2003. This SFAS had no impact on the Company’sresults of operations, financial condition, or cash flows.
In December 2003, the FASB issued SFAS No. 132 (Revised),“Employers’ Disclosures about Pensions and Other PostretirementBenefits”. This revised SFAS modifies the financial statement disclo-sures for defined benefit plans. These modifications increase disclosureof plan assets, benefit obligations, cash flows, benefit costs and otherrelated information. The implementation of SFAS No. 132 (Revised)was effective for the Company on December 31, 2003. The Companyhas included SFAS No. 132 (Revised) disclosures in Note 14 of theNotes to Consolidated Financial Statements.
2. Goodwill and Intangible AssetsThe changes in the carrying amount of goodwill for the year endedDecember 31, 2003, by business group, were as follows:
OtherPump Dispensing Engineered
Products Equipment Products Total
Balance as of December 31, 2002 $323,881 $ 113,504 $93,278 $530,663Goodwill acquired
during the year 11,484 – – 11,484Goodwill related to
sale of business – – (383) (383)Foreign currency
translation 2,927 11,783 2,534 17,244Balance as of December 31, 2003 $338,292 $ 125,287 $ 95,429 $559,008
The carrying value of indentifiable intangible assets as ofDecember 31, 2003, was $19,401, which was split between amortiz-able and unamortizable assets as follows:
Gross NetCarrying Accumulated CarryingAmount Amortization Amount
Amortized intangible assets Patents $ 8,080 $ 4,078 $ 4,002Other 993 353 640Total amortized intangible assets 9,073 4,431 4,642
Unamortized trademark assets 14,759 – 14,759Total intangible assets $23,832 $ 4,431 $19,401
Amortization expense in 2003 for the items listed above was$430, which is consistent with the estimated amortization expensefor the next five years.
In June 2001, the FASB issued SFAS No. 142, “Goodwill andOther Intangible Assets”, which establishes the accounting andreporting standards for goodwill and intangible assets. SFAS No. 142also eliminated the amortization of goodwill and certain intangibleassets to earnings, but instead required these assets be reviewedperiodically for impairment. IDEX adopted SFAS No. 142 on January 1,2002. After reviewing the estimated fair market values, both in theaggregate and at each individual reporting unit, no impairment togoodwill and other intangible assets was recorded as of December31, 2003. Had the new pronouncement been adopted on January 1,2001, IDEX’s pro forma net income and EPS for 2001, compared with2002 and 2003, would have been as follows:
2003 2002 2001
Net incomeReported net income $ 62,352 $ 54,112 $ 32,710Goodwill amortization – – 11,175Trademark amortization – – 258Adjusted net income $ 62,352 $ 54,112 $ 44,143
Basic EPSReported net income $ 1.92 $ 1.71 $ 1.08Goodwill amortization – – .37Trademark amortization – – .01Adjusted net income $ 1.92 $ 1.71 $ 1.46
Diluted EPSReported net income $ 1.87 $ 1.67 $ 1.05Goodwill amortization – – .36Trademark amortization – – .01Adjusted net income $ 1.87 $ 1.67 $ 1.42
Weighted average shares outstandingBasic 32,530 31,669 30,222Diluted 33,315 32,483 31,047

Notes to Consolidated Financial Statements
(IN THOUSANDS EXCEPT PER SHARE AMOUNTS)
3. Balance Sheet Components
The components of certain balance sheet accounts at December 31,2003 and 2002, were as follows:
2003 2002
ReceivablesCustomers $ 101,961 $ 101,861Other 3,692 2,722
Total 105,653 104,583Less allowance for doubtful accounts 3,794 3,089
Total receivables – net $ 101,859 $ 101,494
InventoriesRaw materials $ 38,998 $ 41,985Work in process 13,651 11,960Finished goods 52,655 51,635
Total inventories $ 105,304 $ 105,580
Inventories that were carried on a LIFO basis amounted to$90,812 and $91,743 at December 31, 2003 and 2002, respectively. The excess of current cost over LIFO inventory value and the impact of using the LIFO method on earnings were not material.
2003 2002
Property, plant and equipment, at costLand and improvements $ 14,904 $ 12,772Buildings and improvements 82,007 77,830Machinery and equipment 194,181 185,288Office and transportation equipment 76,088 65,450Engineering drawings 3,919 4,011Construction in progress 5,887 4,202
Total 376,986 349,553Less accumulated depreciation
and amortization 229,891 201,307Total property, plant and equipment – net $ 147,095 $ 148,246
GoodwillCost in excess of net assets acquired $ 642,856 $ 612,146Less accumulated amortization 83,848 81,483
Total goodwill – net $ 559,008 $ 530,663
Intangible assetsCost (at fair market value
on acquisition date) $ 25,897 $ 25,415Less accumulated amortization 6,496 6,038
Total intangible assets – net $ 19,401 $ 19,377
Accrued expensesPayroll and related items $ 30,528 $ 27,802Taxes 11,072 657Insurance 2,308 3,447Other 10,899 10,725
Total accrued expenses $ 54,807 $ 42,631
Other noncurrent liabilitiesPension and retiree medical reserves $ 41,888 $ 47,495Deferred income taxes 31,345 24,228Other 3,177 3,153
Total other noncurrent liabilities $ 76,410 $ 74,876
4. Common and Preferred Stock
In January 2004, the Company issued 20,000 shares of restrictedstock as compensation to a key employee. These shares carry divi-dend and voting rights. Sales of these shares are restricted prior to thedate of vesting, with half vesting four years and the remaining halfvesting five years after the grant date. The restricted shares wererecorded at their fair market value on the date of the grant, with a cor-responding charge to shareholders’ equity. The unearned portion isbeing amortized as compensation expense on a straight-line basis overthe related vesting period.
During 2000, the Company issued 350,000 shares of restrictedstock as compensation to a key employee. These shares carry divi-dend and voting rights. Sales of these shares are restricted prior to thedate of vesting, occurring annually from one to five years after thegrant date. The restricted shares were recorded at their fair marketvalue on the date of the grant, with a corresponding charge to share-holders’ equity. The unearned portion is being amortized as compen-sation expense on a straight-line basis over the related vesting period.
On October 20, 1998, IDEX’s Board of Directors authorized therepurchase of up to 1.5 million shares of its common stock, either atmarket prices or on a negotiated basis as market conditions warrant.At December 31, 2003, IDEX had purchased a total of 6,500 sharesunder the program at a cost of approximately $144.
At December 31, 2003 and 2002, the Company had 75 millionshares of authorized common stock with a par value of $.01 per shareand 5 million shares of preferred stock with a par value of $.01 pershare authorized but unissued.
5. Commitments and Contingencies
At December 31, 2003, total future minimum rental payments undernoncancelable operating leases, primarily for office facilities, warehouses and data processing equipment, were $23,631. Thefuture minimum rental commitments for each of the next five yearsand thereafter are as follows: 2004 – $6,869; 2005 – $5,360; 2006 –$3,409; 2007 – $2,073; 2008 – $1,963; thereafter – $3,957.
Rental expense totaled $9,238, $9,510 and $8,500 for the yearsended December 31, 2003, 2002 and 2001, respectively.
IDEX is a party to various legal proceedings involving employ-ment, contractual, product liability and other matters, none of which isexpected to have a material adverse effect on its results of operations,financial condition, or cash flows.
6. Business Segments and Geographic Information
IDEX’s operations have been aggregated (primarily on the basis of products, production processes, distribution methods and manage-ment organizations) into three reportable segments: Pump Products,Dispensing Equipment and Other Engineered Products. The PumpProducts Group designs, produces and distributes a wide range ofengineered industrial pumps, flow meters, compressors, injectors andvalves, and related controls for process applications. The DispensingEquipment Group designs, manufactures and markets precision-engi-neered equipment for dispensing, metering and mixing paints, haircolorants and other personal care products; refinishing equipment;and centralized lubrication systems. The Other Engineered ProductsGroup designs, produces and distributes engineered equipment forindustrial and commercial markets, including fire and rescue, trans-portation equipment, oil and gas, electronics, and communications.IDEX is not overly dependent on a single customer, the largest ofwhich accounted for just over 2% of net sales in 2003.
Information on IDEX’s business segments is presented below, based on the nature of products and services offered. IDEX evaluatesperformance based on several factors, of which operating income isthe primary financial measure. The accounting policies of the business segments are described in Note 1. Intersegment sales are accounted for at fair value as if the sales were to third parties.

IDEX Corporation 2003 Annual Report 33
2003 2002 2001
Net salesPump Products
External customers $ 453,703 $433,623 $ 424,727Intersegment sales 2,813 3,041 2,310
Total group sales 456,516 436,664 427,037Dispensing Equipment
External customers 159,224 138,701 137,406Intersegment sales 1 1 1
Total group sales 159,225 138,702 137,407Other Engineered Products
External customers 184,994 169,690 164,814Intersegment sales 28 2 1
Total group sales 185,022 169,692 164,815Intersegment elimination (2,843) (3,044) (2,312)
Total net sales $ 797,920 $742,014 $ 726,947
Operating income(1)(2)
Pump Products $ 70,436 $ 71,945 $ 61,758Dispensing Equipment 25,724 18,627 13,957Other Engineered Products 32,990 25,638 25,032Restructuring activity – 203 (11,226)Corporate office and other (19,288) (16,041) (16,083)
Total operating income $ 109,862 $100,372 $ 73,438
AssetsPump Products $ 551,183 $535,822 $ 462,275Dispensing Equipment 203,786 192,258 180,361Other Engineered Products 186,417 186,860 181,032Corporate office and other 19,353 16,110 15,136
Total assets $ 960,739 $931,050 $ 838,804
Depreciation and amortization(1)
Pump Products $ 16,141 $ 16,913 $ 24,124Dispensing Equipment 5,881 5,734 9,719Other Engineered Products 5,116 4,666 7,920Corporate office and other(3) 2,337 2,212 2,170
Total depreciation and amortization $ 29,475 $ 29,525 $ 43,933
Capital expendituresPump Products $ 12,887 $ 9,348 $ 10,251Dispensing Equipment 2,967 3,651 5,129Other Engineered Products 3,874 4,990 5,987Corporate office and other 590 1,346 272
Total capital expenditures $ 20,318 $ 19,335 $ 21,639
(1) IDEX discontinued goodwill and trademark amortization as of January 1,2002, in accordance with SFAS No. 142, as further explained in Note 2.
(2) IDEX took actions in 2002 and 2001 to downsize operations to lower itscost structure, as further explained in Note 7. Group operating income inthese years excluded net unallocated corporate operating expenses andrestructuring activity. The restructuring activity resulted in income of $203in 2002 and a charge of $11,226 in 2001 and were not assigned to the indi-vidual group segments. Had the Company allocated the 2002 restructuringactivity, it would have been assigned to the groups as follows: PumpProducts (income of $1,046), Dispensing Equipment (expense of $121) andOther Engineered Products (expense of $722). Had the Company allocatedthe 2001 restructuring charge, it would have been assigned to the groupsas follows: Pump Products ($7,769), Dispensing Equipment ($1,894) andOther Engineered Products ($1,563).
(3) Excludes amortization of debt issuance expenses.
Information about the Company’s operations in different geograph-ical regions for the years ended December 31, 2003, 2002 and 2001 isshown below. Net sales were attributed to geographic areas based onlocation of the customer, and no country outside the U.S. was greaterthan 10% of total revenues.
2003 2002 2001
Net salesU.S. $441,427 $434,791 $422,084Europe 213,905 186,466 173,747Other countries 142,588 120,757 131,116
Total net sales $797,920 $742,014 $726,947
Long-lived assetsU.S. $523,633 $528,942 $489,734Europe 207,308 176,948 130,280Other countries 5,206 3,900 3,887
Total long-lived assets $736,147 $709,790 $623,901
7. Restructuring Activity
IDEX took actions in 2002 and 2001 to downsize operations to lowerits cost structure. These steps were necessary to appropriately sizethe Company’s production capacity to match the declining levels ofdemand for a broad range of products. The restructuring actionsaffected multiple employee groups in approximately 20 locationsacross 11 of our operating business units. No business activities orproduct lines were abandoned. All costs of the restructuring actions were charged to expense and included in “Restructuring activity” inthe Consolidated Statements of Operations. The restructuring charges included employee severance, fringe benefits, outplacementfees, idle facility carrying costs, lease termination costs, the loss onsale of equipment, and the loss on disposal of two manufacturingfacilities owned by the Company. Determination of the restructuringcharges was based on the estimated severance benefits paid to ter-minated employees, the net book value of surplus assets less expect-ed proceeds, and estimated other costs.
In 2002, IDEX reversed $1,531 of accrued restructuring expensespreviously recorded. Of this reversal, $1,090 was attributable to the factthat the Company was able to sell one manufacturing facility for morethan the value estimated at the time the restructuring plan was adopted.
The restructuring activity was separately identified in theConsolidated Statements of Operations and resulted in the followingactivity for 2002 and 2001:
2002 2001
Pretax charge $ 1,328 $ 11,226 Reversal of previously recorded charges (1,531) – Total pretax (income) charge (203) 11,226 Provision (benefit) for income taxes 72 (4,154) Total (income) charge after taxes $ (131) $ 7,072
The Consolidated Balance Sheets at December 31, 2002 and2001, included accrued restructuring costs of $480 and $5,479,respectively, in “Accrued expenses”.
The cash requirements for the restructuring plans did not have asignificant impact on the Company’s liquidity. The restructuringactions resulted in the layoff of 508 employees, both hourly andsalaried, across 11 business units, representing approximately 12% ofour labor force. The restructurings led to 27 and 481 employee termi-nations in 2002 and 2001, respectively. As of December 31, 2003, allplanned employee terminations have been completed.

Notes to Consolidated Financial Statements
(IN THOUSANDS EXCEPT PER SHARE AMOUNTS)
8. Stock Options
Under various plans, the Company may grant stock options to employ-ees and non-employee directors at exercise prices equal to or exceed-ing the market price at the date of grant. Therefore, no compensationcost has been recognized in the Consolidated Statements ofOperations for these plans. Substantially all of the options become exercisable in five equal installments, beginning one year from thedate of grant, and generally expire 10 years from the date of grant.The Company may grant additional options for up to 1.3 million shares.
The following table summarizes option activity under the plans:
Weighted
Number Average
of Shares Option Price
Under Option Per Share
Outstanding at December 31, 2000 3,253,459 $ 25.10Granted 796,650 28.33Exercised (886,367) 21.09Forfeited (169,900) 29.08
Outstanding at December 31, 2001 2,993,842 26.92Granted 866,440 36.72Exercised (345,945) 24.71Forfeited (184,775) 30.95
Outstanding at December 31, 2002 3,329,562 29.48Granted 1,007,325 30.54Exercised (542,600) 25.41Forfeited (189,454) 32.20
Outstanding at December 31, 2003 3,604,833 $ 30.24
Exercisable at December 31, 2001 1,256,382 $ 25.27Exercisable at December 31, 2002 1,428,916 $ 26.49Exercisable at December 31, 2003 1,539,935 $ 28.71
Weighted-average fair value of options granted
during the year ended:
December 31, 2001 $ 9.30December 31, 2002 $ 12.49December 31, 2003 $ 8.85
The following table summarizes information about options outstanding at December 31, 2003:
Options Options
Outstanding Exercisable
Weighted
Average Weighted Weighted
Range of Remaining Average Average
Exercise Number Life of Exercise Number Exercise
Prices Outstanding Contract Price Exercisable Price
$15.50 - 25.00 409,246 3.7 years $23.18 371,338 $23.0225.01 - 30.00 2,206,872 7.6 years 28.50 766,069 27.7330.01 - 39.45 988,715 7.5 years 37.06 402,528 35.82
TOTAL 3,604,833 7.1 years $30.24 1,539,935 $28.71
9. Debt
Debt at December 31, 2003 and 2002 consisted of the following:
2003 2002
Long-term debtSenior Notes $ 150,000 $150,000Bank credit facilities,
including accrued interest 18,009 81,507Other long-term debt 8,537 9,544
Total long-term debt $ 176,546 $ 241,051
In February 1998, the Company sold $150 million of SeniorNotes due February 15, 2008 (Senior Notes), with a coupon interestrate of 6.875% and an effective rate of 6.919% to maturity. Interest ispayable semiannually. The Senior Notes are redeemable at any timeat the option of the Company in whole or in part. At December 31,2003, the fair market value of the Senior Notes was approximately$228 million, based on the quoted market price.
The Company has a $300 million domestic multi-currency bankrevolving credit facility (Credit Facility), which expires June 8, 2006. AtDecember 31, 2003, the Company had a total of $14 million drawn underthe Credit Facility and outstanding letters of credit totaling $4 million. Thenet available borrowings under the Credit Facility as of December 31,2003, were approximately $282 million.
Interest on the outstanding borrowings under the Credit Facilityis payable quarterly at a rate based on the bank agent’s reference rateor, at the Company’s election, at a rate based on LIBOR plus 57.5basis points per annum. A utilization fee is added to the interest rate.The weighted average interest rate on borrowings outstanding underthe Credit Facility was 3.2% per annum at December 31, 2003. A facil-ity fee equal to 17.5 basis points per annum is payable quarterly on thetotal amount available under the Credit Facility.
The Company and certain of its subsidiaries entered into arenewable, one-year agreement in December 2001 (ReceivablesFacility) with a financial institution, under which the Company collater-alized certain of its receivables for borrowings. This agreement wasrenewed in December 2003 for another year. The Receivables Facilityprovides for borrowings of up to $25 million depending upon the levelof eligible receivables. At December 31, 2003, there were no borrow-ings outstanding under the Receivables Facility.
The Company has a $30 million demand line of credit (Short-Term Facility), which expires May 21, 2004. Borrowings under the Short-Term Facility are based on LIBOR plus the applicable margin ineffect under the Credit Facility. At December 31, 2003, there were noborrowings under the Short-Term Facility.
At December 31, 2003, other long-term debt included debtacquired in connection with recent acquisitions and other debt at inter-national locations maintained for working capital purposes. Interest ispayable on the outstanding balances at rates ranging from 2.8% to4.9% per annum.
Total debt outstanding at December 31, 2003 and 2002 includedaccrued interest of $4.0 million and $4.1 million, respectively.

IDEX Corporation 2003 Annual Report 35
The indenture for the Senior Notes permits the payment of cash dividends only to the extent that no default exists under the notes, and limits the amount of cash dividends in accordance with specifiedformulas. At December 31, 2003, under the most restrictive of theseprovisions, the Company had approximately $154.3 million availablefor the payment of cash dividends in 2004.
10. Acquisitions
In January 2004, the Company acquired Manfred Vetter GmbH, basedin Zülpich, Germany. Vetter is a world leader in the design and manu-facture of pneumatic lifting and sealing bags for vehicle and air rescue,environmental protection, industrial maintenance, and disaster recov-ery and control. Vetter is operated as part of Hale Products.
In 2003, the Company acquired Sponsler Co., Inc. (June 2003)and Classic Engineering, Inc. (September 2003). Both companies areoperated as part of the Pump Products Group. Sponsler, headquar-tered in Westminster, South Carolina, is a manufacturer of precisionturbine flow meters to meet all flow applications, including low-flowand situations where viscosity, corrosive media, extreme temperatureor hazardous materials are factors. Classic Engineering, Inc., head-quartered in Jacksonville, Florida, is a supplier of fully integrated pumpand metering systems to chemical companies and municipal watertreatment facilities. It also engineers, designs and manufactures stan-dard and custom chemical-feed systems for the water, wastewater,chemical OEM, pulp and paper, cement and general industrial markets.Classic is operated as part of Pulsafeeder, while Sponsler is operatedas part of Liquid Controls. IDEX acquired Sponsler and Classic for apurchase price of $10,251 and $3,703, respectively, with financing pro-vided by borrowings under the Credit Facility. Goodwill and intangibleassets recognized as part of these aquisitions was $11,484 and $373,respectively. In February 2003, an $8.0 million payment of deferredconsideration was made in connection with the Rheodyne acquisitionthat was consummated in July 2002.
In 2002, the Company acquired Halox Technologies, Inc. (April2002), Rheodyne, L.P. (July 2002) and Wrightech Corporation (October2002). All are operated as part of the Pump Products Group. Halox,headquartered in Bridgeport, Connecticut, is a manufacturer of point-of-use chlorine dioxide equipment. Its products generate chlorinedioxide for use in water treatment and disinfectant applications.Rheodyne, headquartered in Rohnert Park, California, is a manufactur-er of injectors, valves, fittings and accessories for the analytical instru-mentation market and used by manufacturers of high performance liq-uid chromatography equipment. Wrightech, headquartered inWaukesha, Wisconsin, is a manufacturer of stainless-steel positivedisplacement circumferential piston pumps and replacement parts forthe sanitary pump market. Wrightech is operated as part of VikingPump, while Halox is operated as part of Pulsafeeder. Rheodynebecame IDEX’s 12th stand-alone business unit, with its activitiesbeing closely coordinated with those of ISMATEC, Micropump andTrebor. IDEX acquired the above businesses for an aggregate pur-chase price of $74,928, with financing provided by borrowings underthe Credit Facility. The Company also acquired $2,136 of debt in connection with the acquisitions. Goodwill and intangible assets
recognized as part of these acquisitions was $62,370 and $6,431, respec-tively. In addition, in certain instances, the acquisitions contain purchaseprice contingencies, which are considered to be immaterial to theCompany.
In 2001, IDEX completed the acquisitions of Liquid ControlsL.L.C. (January 2001), Class 1, Inc. (January 2001) and Versa-MaticTool Inc. (June 2001). Liquid Controls and Versa-Matic are operated aspart of the Pump Products Group, while Class 1 is operated as part of the Other Engineered Products Group. Liquid Controls, headquartered in Lake Bluff, Illinois, is a leading manufacturer of positive displacement flow meters, electronic registration and processcontrol systems. Class 1, headquartered in Ocala, Florida, is a leadingmanufacturer of electronic and mechanical components and systemsfor the specialty vehicle market. Versa-Matic, headquartered in Export,Pennsylvania, is a leading manufacturer and distributor of air-operateddouble-diaphragm pumps and pump replacement parts. IDEX acquiredthese businesses for an aggregate purchase price of $132,295, withfinancing provided by borrowings under the Credit Facility. The Company also acquired $2,931 of debt in connection with theacquisitions. Goodwill and intangible assets recognized as part ofthese acquisitions was $94,320 and $1,061, respectively. Goodwill of$67,782 and intangible assets of $740 were assigned to the PumpProducts Group, while goodwill of $26,538 and intangible assets of$321 were assigned to the Other Engineered Products Group.
All acquisitions were accounted for as purchases, and operatingresults include the acquisitions from the dates of purchase. TheCompany does not consider any of the acquisitions to be materialto its results of operations, financial condition, or cash flows for anyof the years noted.
11. Comprehensive Income
The tax effects of the components of other comprehensive incomefor 2003, 2002 and 2001 follow:
2003 2002 2001
Minimum pension adjustmentPretax amount $ (2,864) $ (13,732) $ 640Tax benefit (provision) 954 4,944 (296)Aftertax amount $ (1,910) $ (8,788) $ 344
Unrealized translation adjustmentPretax amount $26,652 $ 19,466 $ 263Tax provision – – –Aftertax amount $26,652 $ 19,466 $ 263
Unrealized gains(losses) on derivativesCumulative effect of changein accounting principles $ – $ – $ 329Derivatives – 226 (555)Pretax amount – 226 (226)Tax (provision) benefit – (86) 86Aftertax amount $ – $ 140 $ (140)

Notes to Consolidated Financial Statements
(IN THOUSANDS EXCEPT PER SHARE AMOUNTS)
12. Income Taxes
Pretax income for the years ended December 31, 2003, 2002, and2001, was taxed under the following jurisdictions:
2003 2002 2001
Domestic $ 66,402 $ 58,087 $ 29,882Foreign 30,268 25,808 23,549
Total $ 96,670 $ 83,895 $ 53,431
The provision for income taxes for the years ended December31, 2003, 2002, and 2001, was as follows:
2003 2002 2001
CurrentU.S. $ 13,000 $ 12,891 $ 12,775State and local 738 448 1,178Foreign 10,093 6,852 6,920
Total current 23,831 20,191 20,873
DeferredU.S. 6,954 6,934 (1,747)State and local 779 – (150)Foreign 2,754 2,658 1,745
Total deferred 10,487 9,592 (152)Total provision for
income taxes $ 34,318 $ 29,783 $ 20,721
Deferred (prepaid) income taxes resulted from the following:
2003 2002 2001
Employee and retireebenefit plans $ 5,046 $ (59) $ (903)
Depreciation and amortization 8,334 6,603 4,364Inventories (785) (285) (2,263)Allowances and accruals (1,557) 3,560 (1,808)Other (551) (227) 458
Total deferred (prepaid) $ 10,487 $ 9,592 $ (152)
Deferred tax assets (liabilities) related to the following atDecember 31, 2003 and 2002:
2003 2002
Employee and retiree benefit plans $ 11,144 $ 13,762Depreciation and amortization (55,776) (43,328)Inventories (4,456) (4,764)Tax benefit carry forwards 872 2,575Allowances and accruals 4,922 3,789Other 2,512 2,061
Total $ (40,782) $ (25,905)
The balance sheet at December 31, 2003, included a currentdeferred tax liability of $9,437 in accrued expenses and a noncurrentdeferred tax liability of $31,345 in other noncurrent liabilities. The balance sheet at December 31, 2002, included a current deferred taxliability of $1,677 in accrued expenses and a noncurrent deferred taxliability of $24,228 in other noncurrent liabilities.
The provision for income taxes differs from the amount com-puted by applying the statutory federal income tax rate to pretaxincome. The computed amount and the differences for the yearsended December 31, 2003, 2002, and 2001, were as follows:
2003 2002 2001
Pretax income $ 96,670 $ 83,895 $ 53,431Provision for income taxes:
Computed amount atstatutory rate of 35% $ 33,835 $ 29,363 $ 18,701
State and local income tax (net of federal tax benefit) 986 291 668
Taxes on non-US earnings -net 960 674 (536)Amortization of cost in excess
of net assets acquired – – 2,197Foreign sales corporation (945) (1,260) (858)Other (518) 715 549
Total provision for income taxes $ 34,318 $ 29,783 $ 20,721
No provision has been made for U.S. or additional foreign taxeson $50,630 of undistributed earnings of foreign subsidiaries, whichare permanently reinvested. It is not practical to estimate the amountof additional tax that might be payable if these earnings were repatri-ated. However, the Company believes that U.S. foreign tax creditswould, for the most part, eliminate any additional U.S. tax and offsetany additional foreign tax.
13. Derivative Instruments
SFAS No. 133, “Accounting for Derivative Instruments and HedgingActivities”, requires that derivative financial instruments be recog-nized in the financial statements at fair value. Changes in the fair valueof derivative financial instruments are either recognized periodically inincome or shareholders’ equity as a component of comprehensiveincome, depending on whether the derivative is being used to hedgechanges in fair value or cash flows. The adoption of SFAS No. 133 in2001 initially increased comprehensive income by $204 inConsolidated Shareholders’ Equity.
At December 31, 2003, the Company had a foreign currencycontract, which it entered into in anticipation of the funding of theJanuary 2004 purchase of Manfred Vetter. The increase in fair marketvalue of this contract resulted in income of $.5 million at December31, 2003 and was included in “Other income (expense) – net” in theConsolidated Statements of Operations.
At December 31, 2001, the Company had two interest rateswaps, which effectively converted $52.3 million of floating rate debtinto fixed rate debt at interest rates approximating 5.6%. The fair mar-ket value of the interest rate swaps was a net expense of $140 atDecember 31, 2001, as reported in other comprehensive income.Both of the interest rate swaps expired in March 2002.
Fair values relating to derivative financial instruments reflect the estimated amounts that the Company would receive or pay to terminate the contracts at the reporting date, based on quoted marketprices of comparable contracts. The net gain or loss on the interestrate swap contracts was not material.

IDEX Corporation 2003 Annual Report 37
14. Retirement Benefits
The Company sponsors several qualified and nonqualified pension plans and other postretirement plans for its employees. The following table provides a reconciliation of the changes in the benefit obligations and fair value of plan assets over the two-year period ended December 31, 2003, and a statement of the funded status at December 31 for both years:
Pension Benefits Other Benefits
2003 2002 2003 2002
Change in benefit obligation
Obligation at January 1 $ 71,968 $ 58,914 $ 16,188 $ 14,171Service cost 3,765 3,486 330 346Interest cost 4,703 4,209 1,066 1,054Plan amendments (15) 407 – –Benefits paid (5,374) (3,854) (510) (480)Actuarial loss 9,470 8,806 1,583 1,097Obligation at December 31 $ 84,517 $ 71,968 $ 18,657 $ 16,188
Change in plan assets
Fair value of plan assets at January 1 $ 38,764 $ 44,402 $ – $ –Actual return on plan assets 7,668 (5,387) – –Employer contributions 20,444 3,019 510 480Benefits paid (5,374) (3,854) (510) (480)Other 746 584 – –Fair value of plan assets at December 31 $ 62,248 $ 38,764 $ – $ –
Funded status
Funded status at December 31 $ (22,269) $ (33,204) $ (18,657) $ (16,188)Unrecognized loss 29,354 28,313 3,619 2,127Unrecognized transition obligation 287 321 – –Unrecognized prior service cost 2,411 2,798 (533) (564)Net amount recognized at December 31 $ 9,783 $ (1,772) $ (15,571) $ (14,625)
Recognized in the Consolidated Balance Sheets
Prepaid benefit cost $ 5,433 $ 4,707 $ – $ –Accrued benefit liability (16,764 ) (25,085) (15,571) (14,625)Intangible asset 1,712 2,069 – –Accumulated other comprehensive income 19,402 16,537 – –Net amount recognized at December 31 $ 9,783 $ (1,772) $ (15,571) $ (14,625)
The accumulated benefit obligation for all defined benefit pension plans was $77,611 and $63,205 at December 31, 2003 and 2002, respectively.For plans with an accumulated benefit obligation in excess of plan assets, the projected benefit obligation, accumulated benefit obligation and fairvalue of plan assets was $67,847, $62,073 and $45,309, respectively, at December 31, 2003, and $62,654, $54,140 and $29,055, respectively, atDecember 31, 2002.
The assumptions used in the measurement of the Company’s benefit obligation at December 31, 2003 and 2002, were as follows:
U.S. Plans Non-U.S. Plans
2003 2002 2003 2002
Discount rate 6.00 % 6.75% 5.50 % 5.75%Expected return on plan assets 8.50 % 9.00% 6.50 % 6.50%Rate of compensation increase 4.00 % 4.00% 4.25 % 3.75%
The discount rate assumption for benefits other than pension benefit plans was 6.00% and 6.75% at December 31, 2003 and 2002, respectively.To develop the expected rate of return on plan assets, the Company considered the historical returns and the future expectations for returns on eachasset class, as well as the target asset allocation of the pension portfolio.

Notes to Consolidated Financial Statements
(IN THOUSANDS EXCEPT PER SHARE AMOUNTS)
The following tables provide the components of, and the assumptions used to determine, the net periodic benefit cost for the plans in 2003,2002, and 2001:
Pension Benefits Other Benefits
2003 2002 2001 2003 2002 2001
Service cost $ 3,765 $ 3,486 $ 3,160 $ 330 $ 346 $ 317Interest cost 4,703 4,209 3,991 1,066 1,054 1,155Expected return on plan assets (3,449) (3,903) (4,248) – – –Net amortization 3,216 848 475 (31) (29) 28Net periodic benefit cost $ 8,235 $ 4,640 $ 3,378 $ 1,365 $ 1,371 $ 1,500
U.S. Plans Non-U.S. Plans
2003 2002 2001 2003 2002 2001
Discount rate 6.75% 7.50% 8.00% 5.75% 6.00% 6.00%Expected return on plan assets 8.50% 9.00% 9.00% 6.50% 7.50% 7.00%Rate of compensation increase 4.00% 4.00% 4.00% 3.75% 4.00% 4.50%
The discount rate assumption used to determine the net periodic benefit cost for benefits other than pension benefit plans was 6.75%, 7.50%and 8.00% in 2003, 2002 and 2001, respectively. Prior service costs are amortized on a straight-line basis over the average remaining service period ofactive participants. Gains and losses in excess of 10% of the greater of the benefit obligation and the market value of assets are amortized over theaverage remaining service period of active participants. Contributions to bargaining unit-sponsored multiemployer plans and defined contribution planswere $6,756, $6,607 and $6,292 for 2003, 2002 and 2001, respectively.
For measurement purposes, an 8% annual rate of increase in the per capita cost of covered health care benefits was assumed for 2003. The ratewas assumed to decrease gradually each year to a rate of 6% for 2008, and remain at that level thereafter. Assumed health care cost trend rates havea significant effect on the amounts reported for the health care plans. A 1% increase in the assumed health care cost trend rates would increase theservice and interest cost components of the net periodic benefit cost by $137 and the health care component of the accumulated postretirement ben-efit obligation by $1,711. A 1% decrease in the assumed health care cost trend rate would decrease the service and interest cost components of thenet periodic benefit cost by $116 and the health care component of the accumulated postretirement benefit obligation by $1,463.
The provisions of the Medicare Prescription Drug, Improvement, and Modernization Act of 2003 (Act) have not been taken into account in thedetermination of IDEX’s accumulated postretirement benefit obligation or net periodic benefit cost, pending further guidance on the accounting for thefederal subsidy. The Company does not expect that the effects of the Act will have a material impact on its results of operations, financial condition,or cash flows.
Plan AssetsThe Company’s pension plan weighted-average asset allocations at December 31, 2003, and 2002, by asset category, were as follows:
2003 2002
Equity securities 68% 54%Debt securities 31 39Other 1 7
Total 100% 100%
The investment objectives of its plan assets are to earn the highest possible rate of return consistent with the tolerance for risk as deter-mined periodically by IDEX in its role as a fiduciary. The general guidelines of asset allocation of fund assets are that equities will represent from55% to 75% of the market value of total fund assets with a target of 64%, and fixed income obligations, including cash, will represent from 25%to 45% with a target of 36%. The Company strives to maintain asset allocations within the designated ranges by conducting periodic reviews offund allocations and plan liquidity needs, and rebalancing the portfolio accordingly. As of December 31, 2003 and 2002, there were no shares ofthe Company’s stock held in plan assets.
Cash FlowsThe Company expects to contribute approximately $9.0 million to its pension plans and $.7 million to its other postretirement benefit plans in2004.
15. Quarterly Results of Operations
The following is a summary of the unaudited quarterly results of operations for the years ended December 31, 2003 and 2002:
2003 Quarters 2002 Quarters
First Second Third Fourth First Second Third Fourth
Net sales $195,498 $207,147 $197,314 $197,961 $174,936 $190,430 $189,105 $187,543Gross profit 74,303 82,123 76,178 76,716 65,425 74,138 71,614 70,261Operating income 23,401 29,557 28,943 27,961 22,506 28,160 26,945 22,761Net income 12,695 16,943 16,509 16,205 11,545 15,610 14,786 12,171Basic EPS $ .39 $ .52 $ .51 $ .49 $ .38 $ .49 $ .46 $ .38Basic weighted average shares outstanding 32,291 32,384 32,661 32,785 30,513 31,668 32,245 32,252Diluted EPS $ .39 $ .51 $ .49 $ .48 $ .37 $ .48 $ .45 $ .37Diluted weighted average shares outstanding 32,805 33,131 33,640 33,826 31,544 32,653 32,883 32,893
During the second and fourth quarters of 2002, IDEX took actions to downsize its operations to reflect lower levels of activity. As a result,the Company recorded a charge of $107 and income of $310 in the second and fourth quarters of 2002, respectively, related to the restructuringactivity. See Note 7 for additional details.

IDEX Corporation 2003 Annual Report 39
Independent Auditors’ Report
To the Board of Directors and Shareholders of IDEX CorporationWe have audited the accompanying consolidated balance sheets of IDEX Corporation and its subsidiaries as of December 31, 2003 and 2002
and the related consolidated statements of operations, consolidated shareholders’ equity, and consolidated cash flows for each of the three yearsin the period ended December 31, 2003. These financial statements are the responsibility of the Company’s management. Our responsibility is toexpress an opinion on these financial statements based on our audits.
We conducted our audits in accordance with auditing standards generally accepted in the United States of America. Those standards requirethat we plan and perform the audit to obtain reasonable assurance about whether the financial statements are free of material misstatement. Anaudit includes examining, on a test basis, evidence supporting the amounts and disclosures in the financial statements. An audit also includesassessing the accounting principles used and significant estimates made by management, as well as evaluating the overall financial statementpresentation. We believe that our audits provide a reasonable basis for our opinion.
In our opinion, such consolidated financial statements present fairly, in all material respects, the financial position of the Company and itssubsidiaries at December 31, 2003 and 2002 and the results of their operations and their cash flows for each of the three years in the period endedDecember 31, 2003 in conformity with accounting principles generally accepted in the United States of America.
As discussed in Note 2 to the Consolidated Financial Statements, in 2002 the Company changed its method of accounting for goodwill andintangible assets to conform to Statement of Financial Accounting Standards No. 142, “Goodwill and Other Intangible Assets.”
Deloitte & Touche LLPChicago, IllinoisJanuary 22, 2004
Management Report
IDEX Corporation’s management is responsible for the fair presentation and consistency of all financial data included in this Annual Report in accor-dance with accounting principles generally accepted in the United States of America. Where necessary, the data reflect management’s best estimates and judgments.
Management also is responsible for maintaining a system of internal control with the objectives of providing reasonable assurance thatIDEX’s assets are safeguarded against material loss from unauthorized use or disposition, and that authorized transactions are properly recordedto permit the preparation of accurate financial data. Cost benefit judgments are an important consideration in this regard. The effectiveness ofinternal control is maintained by personnel selection and training, division of responsibilities, establishment and communication of policies, andongoing internal review programs and audits. Management believes that IDEX’s system of internal control as of December 31, 2003, is effectiveand adequate to accomplish the above described objectives.
Dennis K. WilliamsChairman of the Board, President and Chief Executive Officer
Wayne P. SayatovicSenior Vice President – Finance and Chief Financial Officer
Northbrook, IllinoisJanuary 22, 2004
Reports

Business Units
Pump Products
GAST MANUFACTURING, INC.
2550 Meadowbrook RoadBenton Harbor, MI 49022(269) 926-6171Ivy B. SuterPresidentAge: 50Years of Service: 3
LIQUID CONTROLS, INC.
105 Albrecht DriveLake Bluff, IL 60044(847) 295-1050Michael SchneiderPresidentAge: 40Years of Service: 10
SPONSLER CO., INC.
2363 Sandifer Blvd.Westminster, SC 29693(864) 647-2065Michael R. SponslerPresidentAge: 55Years of Service: 18
PULSAFEEDER, INC.
2883 Brighton-Henrietta Town Line Rd.Rochester, NY 14623(585) 292-8000Paul M. BeldhamPresident Age: 48Years of Service: 18
KNIGHT, INC.
20531 Crescent Bay DriveLake Forest, CA 92630(949) 595-4800George J. NoaPresident Age: 53Years of Service: 7
HALOX TECHNOLOGIES, INC.
304 Bishop AvenueBridgeport, CT 06610(203) 334-6278 Peter L. TimpanelliPresident Age: 50Years of Service: 1
VIKING PUMP, INC.
406 State St.Cedar Falls, IA 50613(319) 266-1741Steven C. FairbanksPresident Age: 44Years of Service: 8
WARREN RUPP, INC.
800 North Main St.Mansfield, OH 44902(419) 524-8388Thomas E. AkehurstPresidentAge: 50Years of Service: 9
VERSA-MATIC, INC.
6017 Enterprise DriveExport, PA 15632(724) 327-7867Nicholas L. DorschPresidentAge: 38Years of Service: 9
IDEX TECHNOLOGY
(SUZHOU) CO. LTD.
Units A and BNo. 428 Zing Long StreetSuchun Industrial SquareSuzhou Industrial ParkSuzhou, China011-86-512-6283-3000Cyril LeungGeneral ManagerAge: 48Years of Service: 1
From left to right, seated: Cyril Leung (Suzhou), Pete Timpanelli (Halox),Ivy Suter (Gast Manufacturing), Nick Dorsch (Versa-Matic), John McMurray(Group Executive)
From left to right, standing: Mike Schneider (Liquid Controls), Mike Sponsler (Sponsler), Steve Fairbanks (Viking Pump), Tom Akehurst(Warren Rupp), George Noa (Knight), Paul Beldham (Pulsafeeder)

IDEX Corporation 2003 Annual Report 41
From left to right, seated: Jeff Hohman (Micropump), Henry O’Connell(Precision Flow Products), Greg Orr (Trebor)
From left to right, standing: Mark McDonald (Rheodyne), Peter Zwingli (ISMATEC)
NOTE: Years of service include periods prior to acquisition by IDEX.
PRECISION FLOW PRODUCTS
1402 N.E. 136th Ave.Vancouver, WA 98684(360) 253-2008Henry J. O’ConnellPresidentAge: 50Years of Service: less than 1
MICROPUMP, INC.
1402 N.E. 136th Ave.Vancouver, WA 98684(360) 253-2008Jeffrey L. HohmanPresidentAge: 50Years of Service: 13
ISMATEC S.A.
Feldeggstrasse 6CH-8152 Glattbrugg-ZürichSwitzerland011-41-1874-9494Peter ZwingliManaging DirectorAge: 42Years of Service: less than 1
TREBOR INTERNATIONAL, INC.
8100 South 1300 WestWest Jordan, UT 84088(801) 561-0303Gregory R. OrrPresidentAge: 42Years of Service: 8
RHEODYNE, L.P.
600 Park CourtRohnert Park, CA 94928(707) 588-2000Mark F. McDonaldPresidentAge: 53Years of Service: 1
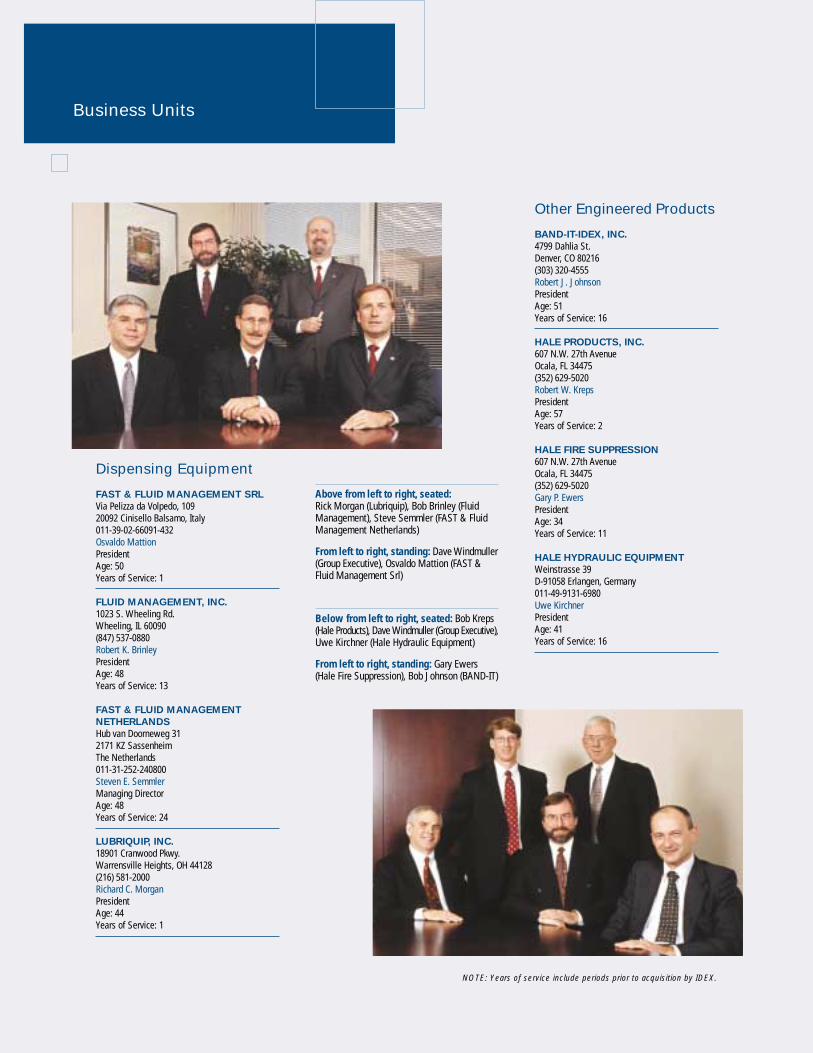
Business Units
Dispensing Equipment
FAST & FLUID MANAGEMENT SRL
Via Pelizza da Volpedo, 10920092 Cinisello Balsamo, Italy011-39-02-66091-432Osvaldo MattionPresidentAge: 50Years of Service: 1
FLUID MANAGEMENT, INC.
1023 S. Wheeling Rd.Wheeling, IL 60090(847) 537-0880Robert K. BrinleyPresident Age: 48Years of Service: 13
FAST & FLUID MANAGEMENT
NETHERLANDS
Hub van Doorneweg 312171 KZ SassenheimThe Netherlands011-31-252-240800Steven E. SemmlerManaging DirectorAge: 48Years of Service: 24
LUBRIQUIP, INC.
18901 Cranwood Pkwy.Warrensville Heights, OH 44128(216) 581-2000Richard C. MorganPresidentAge: 44Years of Service: 1
Above from left to right, seated:Rick Morgan (Lubriquip), Bob Brinley (FluidManagement), Steve Semmler (FAST & FluidManagement Netherlands)
From left to right, standing: Dave Windmuller(Group Executive), Osvaldo Mattion (FAST &Fluid Management Srl)
Below from left to right, seated: Bob Kreps(Hale Products), Dave Windmuller (Group Executive),Uwe Kirchner (Hale Hydraulic Equipment)
From left to right, standing: Gary Ewers(Hale Fire Suppression), Bob Johnson (BAND-IT)
Other Engineered Products
BAND-IT-IDEX, INC.
4799 Dahlia St.Denver, CO 80216(303) 320-4555Robert J. JohnsonPresidentAge: 51Years of Service: 16
HALE PRODUCTS, INC.
607 N.W. 27th AvenueOcala, FL 34475(352) 629-5020Robert W. KrepsPresidentAge: 57Years of Service: 2
HALE FIRE SUPPRESSION
607 N.W. 27th AvenueOcala, FL 34475(352) 629-5020Gary P. EwersPresidentAge: 34Years of Service: 11
HALE HYDRAULIC EQUIPMENT
Weinstrasse 39 D-91058 Erlangen, Germany011-49-9131-6980Uwe KirchnerPresidentAge: 41Years of Service: 16
NOTE: Years of service include periods prior to acquisition by IDEX.

Corporate Officers & Directors
IDEX Corporation 2003 Annual Report 43
CORPORATE OFFICERS
Dennis K. WilliamsChairman of the Board,
President and Chief Executive OfficerAge: 57Years of Service: 4
Wayne P. SayatovicSenior Vice President – Finance
and Chief Financial OfficerAge: 57Years of Service: 31
Dominic A. RomeoVice President and Chief Financial Officer – electAge: 44Years of Service: less than 1
Kimberly K. BorsVice President – Human ResourcesAge: 43Years of Service: 1
Clinton L. KoomanVice President – ControllerAge: 60Years of Service: 39
Douglas C. LennoxVice President – TreasurerAge: 51Years of Service: 24
John L. McMurrayVice President – Group Executive of Pump
Products and Operational ExcellenceAge: 53Years of Service: 11
Dennis L. MetcalfVice President – Corporate DevelopmentAge: 56Years of Service: 30
Frank J. NotaroVice President – General Counsel and SecretaryAge: 40Years of Service: 6
David T. WindmullerVice President – Group Executive of Dispensing
Equipment and Other Engineered ProductsAge: 46Years of Service: 23
NOTE: Years of service for corporate officers include periods with predecessor to IDEX.
DIRECTORS
Dennis K. Williams Chairman of the Board,
President and Chief Executive OfficerIDEX CorporationNorthbrook, IllinoisAge: 57Years of Service: 4
Bradley J. Bell Executive Vice President and
Chief Financial OfficerNalco CompanyNaperville, IllinoisAge: 51Years of Service: 3
Frank S. Hermance Chairman and Chief Executive OfficerAMETEK, Inc.Paoli, PennsylvaniaAge: 55Years of Service: less than 1
Gregory B. Kenny President and Chief Executive OfficerGeneral Cable CorporationHighland Heights, KentuckyAge: 51Years of Service: 2
Paul E. Raether MemberKohlberg Kravis Roberts & Co., L.L.C.New York, New YorkAge: 57Years of Service: 16
Neil A. Springer Managing DirectorSpringer & Associates, L.L.C.Chicago, IllinoisAge: 65Years of Service: 14
Michael T. Tokarz MemberThe Tokarz Group L.L.C.New York, New YorkAge: 54Years of Service: 16
Member of:
Executive Committee
Audit Committee
Compensation Committee
Nominating and Governance Committee

Corporate Executive Office
IDEX Corporation630 Dundee RoadNorthbrook, Illinois 60062USA(847) 498-7070
Investor Information
Inquiries from shareholders and prospective investors should be directed to:Susan H. Fisher, Director – Investor Relations, at the Northbrook, IL office (above).Further information also may be accessed at www.idexcorp.com.
Registrar and Transfer Agent:
Inquiries about stock transfers, address changes or IDEX’s dividend reinvestment programshould be directed to:
National City BankShareholder Services3rd Floor North4100 W. 150th StreetCleveland, Ohio 44135(800) 622-6757
Independent Auditors
Deloitte & Touche LLPTwo Prudential Plaza180 North Stetson AvenueChicago, Illinois 60601
Dividend Policy
IDEX paid a quarterly dividend on its common stock on January 30, 2004, of $0.14 per share,which is unchanged from last year’s quarterly dividend rate. The declaration of future dividends,subject to certain limitations, is within the discretion of the company’s Board of Directors and willdepend upon, among other things, business conditions, earnings and IDEX’s financial condition.See Note 9 of the Notes to Consolidated Financial Statements.
Stock Market Information
IDEX common stock was held by an estimated 5,700 shareholders at December 31, 2003, and istraded on the New York Stock Exchange and Chicago Stock Exchange under the ticker symbol IEX.
Public Filings
Shareholders may obtain a copy of any Form 10-K and Form 10-Q filed with the United StatesSecurities and Exchange Commission by written request to the attention of Susan H. Fisher,Director – Investor Relations, at the Northbrook, IL office (above), or through the company’s website at www.idexcorp.com.
Annual Meeting
The annual meeting of IDEX shareholders will be held on Tuesday, March 23, 2004, at 10:00 amlocal time at:
LaSalle RoomBank of America231 South LaSalle StreetChicago, Illinois 60697
Shareholder Information
5
10
15
20
25
30
35
$45
92 93 94 95 96 97 009998 030201
40
Stock History
Quarterly Closing Prices
Quarterly Stock Price
First Second Third Fourth
2003 High $34.50 $36.88 $40.40 $42.37Low 26.02 28.76 35.10 35.89Close 29.00 36.24 36.44 41.59
2002 High $38.90 $39.66 $33.50 $34.83Low 33.25 31.65 27.15 25.70Close 37.00 33.50 28.55 32.70
IDEX Corporation 2003 Annual Report 44

IDEX CORPORATION
630 DUNDEE ROAD
NORTHBROOK, IL 60062 USAwww.idexcorp.com