Embed Size (px)
Citation preview
New York City Department of Education English Language Arts Curriculum Audit:
Classroom Observation Reportfor Districts 10, 11, 14, 18, and 29
November 2008
22 Cortlandt Street, Floor 16New York, NY 10007-3139800-356-2735 212-419-0415 www.learningpt.org
Copyright © 2008 Learning Point Associates. All rights reserved.
This work was originally produced in whole or in part by Learning Point Associates with funds from the New York State Education Department (NYSED). The content does not necessarily reflect the position or policy of NYSED, nor does mention or visual representation of trade names, commercial products, or organizations imply endorsement.
3227_11/08
ContentsPage
Introduction......................................................................................................................................1
About the School Observation Measure ....................................................................................1
Approach....................................................................................................................................2
Schools and Classrooms Observations ......................................................................................3
Report Organization...................................................................................................................3
Factors to Consider ....................................................................................................................4
Findings............................................................................................................................................5
Instructional Orientation ............................................................................................................5
Classroom Orientation ...............................................................................................................7
Instructional Strategies...............................................................................................................9
Student Activities.....................................................................................................................12
Technology Use .......................................................................................................................15
Assessments .............................................................................................................................16
Academic Focus and Student Engagement..............................................................................17
Conclusion ...............................................................................................................................18
References......................................................................................................................................19
Appendix: Definition of Terms......................................................................................................20
Learning Point Associates NYCDOE: Classroom Observation Report—1
Introduction
This Classroom Observation Report summarizes the results of observations of English Language Arts (ELA) classes in 64 schools located in New York City districts 10, 11, 14, 18, and 29. The observations were conducted for the New York City Department of Education by Learning Point Associates between April 1 and early June 2008. These observations were conducted using the School Observation Measure (SOM), developed by the Center for Research in Educational Policy (CREP) at the University of Memphis.
The purpose of this report is to describe the instructional practices observed in the ELA classes so that school and district stakeholders are able to evaluate the observed practices within the context of their instructional goals. The data presented in this report are not evaluative. The importance and the meaning of the observation data will be determined by the district and school stakeholders who read the report. Stakeholders will decide whether the data are consistent with district and school priorities and expectations.
About the School Observation Measure
The SOM was developed for use in schools implementing whole-school reform initiatives. With its singular focus on instructional strategies, the SOM is content-neutral and can be used to observe a range of classes in the core curricular subject areas.
The SOM measures the prevalence of 24 instructional practices that are classified under six categories: instructional orientation, classroom organization, instructional strategies, student activities, technology use, and assessments. In addition, the SOM includes two evaluative items: academic focus and student engagement. (A description of each instructional practice is provided in the Appendix.)
CREP selected the instructional practices included on the SOM through surveys and discussions with policymakers, researchers, administrators, and teachers who identified practices that they considered to be indicators of a school’s orientation and implementation of school reform designs (Ross, McDonald, & Bol, 2004). Based on the input of these policymakers and educators, two of the 24 practices were classified as traditional practices and seven as student-centered practices:
Traditional Practices. The two traditional practices included in the SOM are direct instruction and independent seatwork. Direct instruction is defined as a teacher-controlled practice, used either with the entire class or in small groups, which has an academic focus and may use lecture and questioning formats. (See the Appendix for definitions.) Independent seatwork is defined as a practice in which students independently use worksheets or textbook problems to practice content or complete a practice test.
Student-Centered Practices. The SOM also includes student-centered practices, which “reflect an emphasis on higher order learning and attainment of deep understanding of content,” including “whether or not technology was used as a component of the strategy” (Ross, McDonald, & Bol, 2004). These practices are cooperative/collaborative learning;
Learning Point Associates NYCDOE: Classroom Observation Report—2
project-based learning; higher level questioning (by the teacher); experiential, hands-on learning; independent inquiry/research; student discussion; and use of technology as a learning tool or resource (such as Internet research, database creation). (See the Appendix for definitions.)
The SOM does not include instructional practices or characteristics other than the 24 practicesand the two evaluative items. There are practices and characteristics that might be observed in a classroom but are not included in the instrument and cannot be coded. For example, there are no opportunities to code whole-group instruction, which materials are being used (unless technology), teacher giving direction to students, or students reading together from a text.
The presence of the instructional practices, as well as academic focus and student engagement, are recorded using a rating system that designates the emphasis of the instructional practices during an observation event. The rating categories are as follows:
Extensively. The practice receives substantive time and/or emphasis in classes and is a highly prevalent component of teaching and learning across classes.
Frequently. The practice receives substantive time or emphasis in the classes and is a prevalent component of teaching and learning across classes.
Occasionally. The practice receives minimal or modest time or emphasis in classes and is not a prevalent or emphasized component across classes.
Rarely. The practice receives isolated use and/or little time in classes and is clearly not a prevalent or emphasized component.
Not observed. The practice was never observed.
National norms for each of the instructional practices were developed from the large amount of observation data collected by CREP using the SOM in hundreds of classrooms nationwide. The national norms make it possible to compare the findings from this sample with a larger national sample. One note, however, is that the national norm data are for two groups of schools: elementary and secondary (which includes middle and high schools). The data collected from the New York City schools are aggregated into three groups: elementary, middle, and high school. Therefore, middle and high school data are compared with the same national norm data. The national norm data were derived from classes in multiple subject areas, not just ELA.
Approach
A SOM is based on a 45- to 50-minute observation of a single classroom. The classroom observation focuses on the extent to which the 24 instructional practices and two summary measures (academic focus and student engagement) are emphasized or implemented. Every 15 minutes during a classroom observation, the observer records the extent to which the practices and summary measures were observed in that 15-minute class segment. During one 45- to 50-minute class observation session, three 15-minute segments are observed and three forms are completed. The information from the three forms is summarized into a SOM for that classroom. Multiple SOMs are completed for each school. In this sample of 64 schools, an average of 5.5 ELA classes were observed and 5.5 SOMs completed per school.
Learning Point Associates NYCDOE: Classroom Observation Report—3
To ensure the reliability of data, observers were trained to use the SOM by trainers from CREP. Training for the New York City observers took place in late October 2007 and again in late February 2008, shortly before site visits began. To enhance reliability, observers first conducted observations in pairs so they could compare findings. In a reliability study (Lewis, Ross, & Alberg, 1999), pairs of trained observers selected the identical overall response on the five-category rubric on 67 percent of the items and were within one category on 95 percent of items.
Schools and Classrooms Observed
Observations were conducted in all 64 sample schools. Within each school, observation days were scheduled at least two weeks apart, except in occasional cases for which this approach was not feasible. Learning Point Associates staff selected the classrooms that were observed. If the teacher in a selected classroom was not present the day the observations were scheduled, Learning Point Associates staff selected a different classroom to observe from a list of alternates.
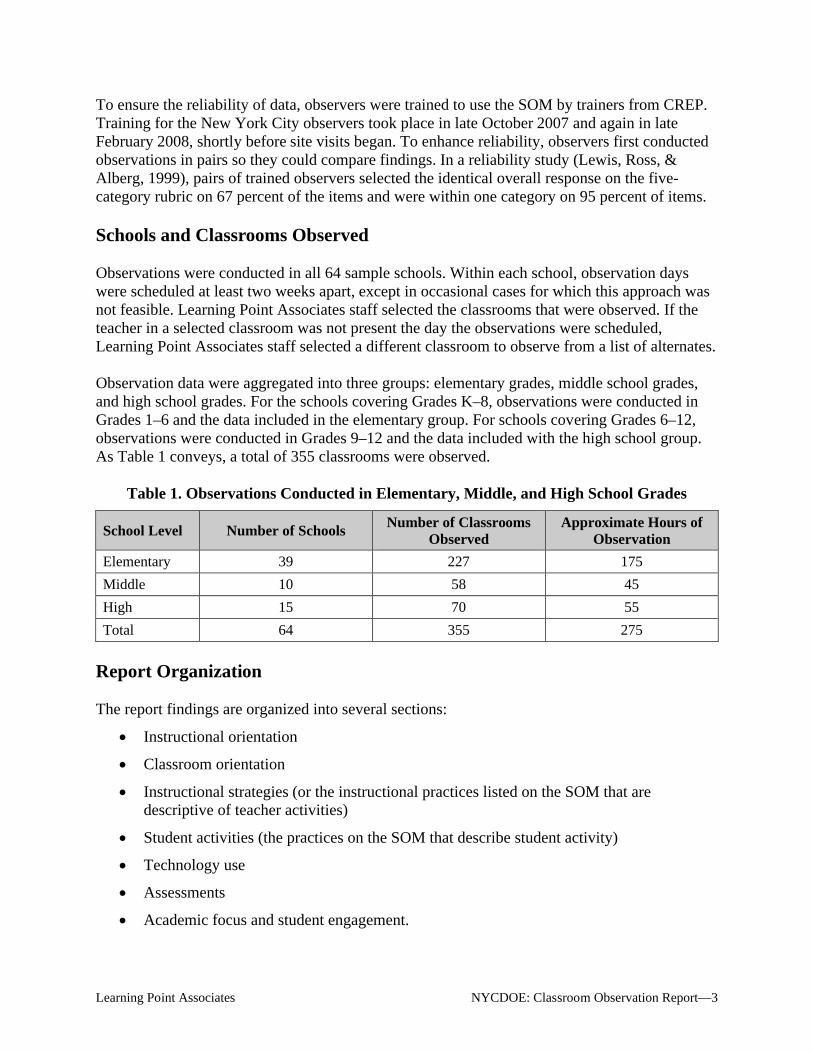
Observation data were aggregated into three groups: elementary grades, middle school grades, and high school grades. For the schools covering Grades K–8, observations were conducted in Grades 1–6 and the data included in the elementary group. For schools covering Grades 6–12, observations were conducted in Grades 9–12 and the data included with the high school group. As Table 1 conveys, a total of 355 classrooms were observed.
Table 1. Observations Conducted in Elementary, Middle, and High School Grades
School Level Number of SchoolsNumber of Classrooms
ObservedApproximate Hours of
Observation
Elementary 39 227 175
Middle 10 58 45
High 15 70 55
Total 64 355 275
Report Organization
The report findings are organized into several sections:
Instructional orientation
Classroom orientation
Instructional strategies (or the instructional practices listed on the SOM that are descriptive of teacher activities)
Student activities (the practices on the SOM that describe student activity)
Technology use
Assessments
Academic focus and student engagement.
Learning Point Associates NYCDOE: Classroom Observation Report—4
For most of the instructional practices, the prevalence of instructional practices for each school level is depicted in figures. (As noted above, prevalence is determined by a practice being extensively or frequently emphasized or given substantive time.) Also presented are tables depicting whether the New York City sample is over, under, or the same as the national norm. For the instructional practices with very low frequency in the New York City sample, information is presented in bulleted points rather than using figures and tables.
Factors to Consider
There are several key factors to consider when reviewing the data presented in this report. First, the SOM focuses on instructional practice and not instructional content. Second, only the instructional practices covered by the SOM are recorded. These practices were selected because they represent practices associated with comprehensive school reform. Certain instructional practices are not on the SOM, such as whole-group instruction. Third, the SOM has only two evaluative items: academic focus and academic engagement. Finally, and most important, the SOM data make sense only in the context of school and district priorities.
Learning Point Associates NYCDOE: Classroom Observation Report—5
Findings
Findings are presented for the following instructional areas identified by the SOM: instructional orientation, classroom orientation, instructional strategies, student activities, technology use, assessments, and academic focus and student engagement.
Instructional Orientation
Direct instruction, team teaching, cooperative/collaborative learning, and individual tutoring areinstructional practices associated with instructional orientation.
Direct Instruction
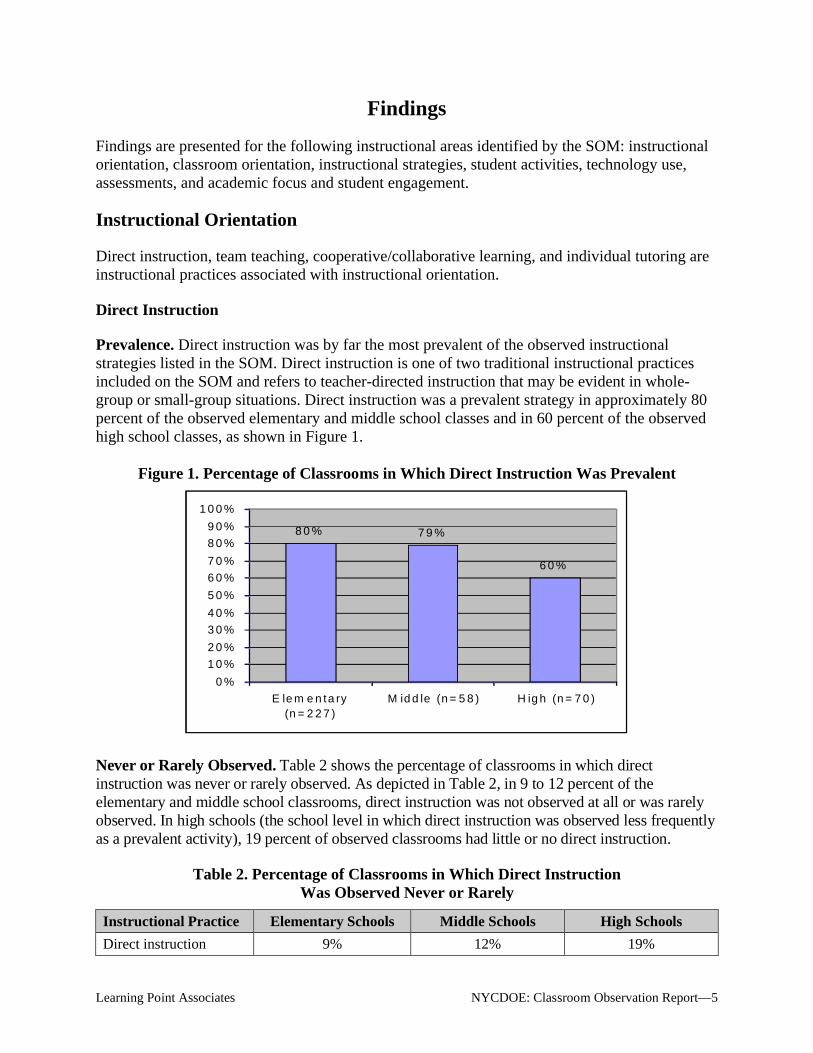
Prevalence. Direct instruction was by far the most prevalent of the observed instructional strategies listed in the SOM. Direct instruction is one of two traditional instructional practices included on the SOM and refers to teacher-directed instruction that may be evident in whole-group or small-group situations. Direct instruction was a prevalent strategy in approximately 80 percent of the observed elementary and middle school classes and in 60 percent of the observed high school classes, as shown in Figure 1.
Figure 1. Percentage of Classrooms in Which Direct Instruction Was Prevalent
8 0 % 7 9 %
6 0 %
0 %
1 0 %
2 0 %
3 0 %
4 0 %
5 0 %
6 0 %
7 0 %
8 0 %
9 0 %
1 0 0 %
E le m e n ta ry(n = 2 2 7 )
M id d le (n = 5 8 ) H ig h (n = 7 0 )
Never or Rarely Observed. Table 2 shows the percentage of classrooms in which direct instruction was never or rarely observed. As depicted in Table 2, in 9 to 12 percent of the elementary and middle school classrooms, direct instruction was not observed at all or was rarely observed. In high schools (the school level in which direct instruction was observed less frequently as a prevalent activity), 19 percent of observed classrooms had little or no direct instruction.
Table 2. Percentage of Classrooms in Which Direct Instruction Was Observed Never or Rarely
Instructional Practice Elementary Schools Middle Schools High Schools
Direct instruction 9% 12% 19%
Learning Point Associates NYCDOE: Classroom Observation Report—6
Comparison to National Norms. As shown in Table 3, the prevalence of direct instruction was higher than the national norms for elementary and middle schools and somewhat lower for high schools.
Table 3. Direct Instruction: Comparison to National Norms
Instructional Practice
Elementary Schools Middle Schools High Schools
New York City
National Norm
New York City
National Norm
New York City
National Norm
Direct instruction
3.11 2.75 3.21 2.85 2.74 2.85
Team Teaching, Collaborative Learning, and Tutoring
Three other practices associated with instructional orientation are team teaching, collaborative learning, and tutoring. Team teaching was coded when more than one person assumed a teaching role in the classroom. Collaborative learning is a student-centered activity and was coded when small groups of students interacted for the purpose of cooperating and working collaboratively. Individual tutoring is a situation during which one student receives individual academic support from an adult or peer within a planned context. Individual tutoring was coded only when the tutoring took place within or very near the classroom; it was not coded when a student left the classroom or the classroom area to work with a tutor.
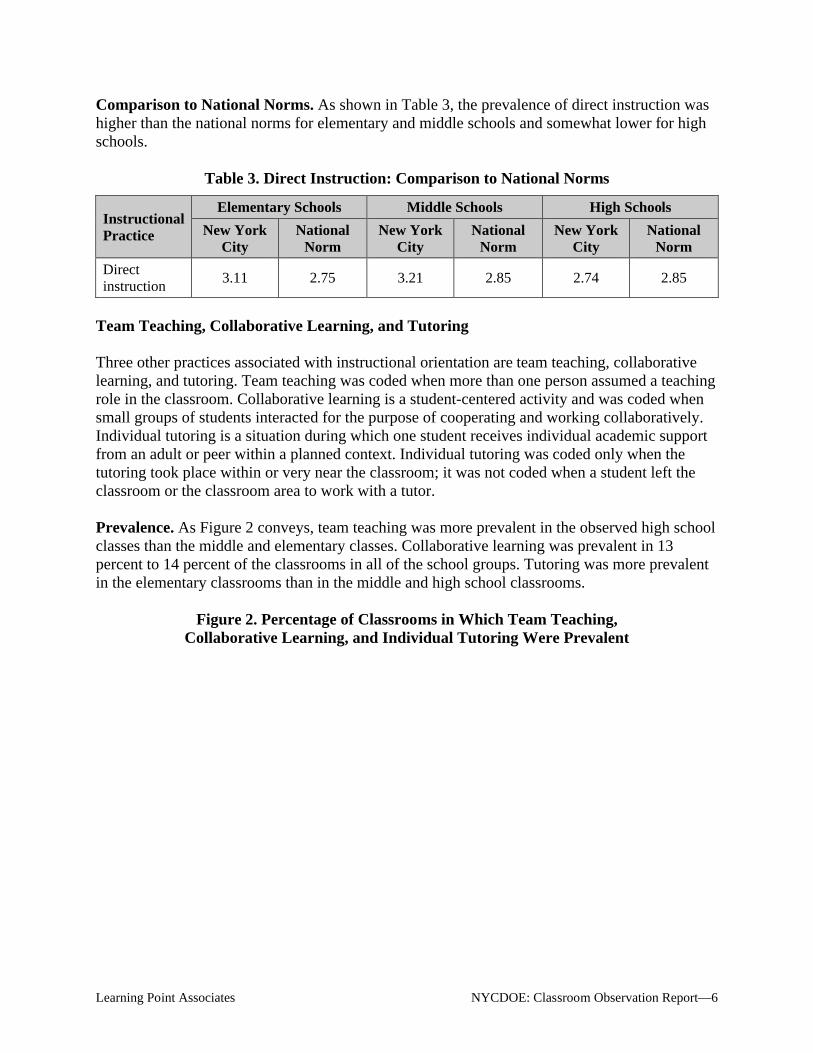
Prevalence. As Figure 2 conveys, team teaching was more prevalent in the observed high school classes than the middle and elementary classes. Collaborative learning was prevalent in 13 percent to 14 percent of the classrooms in all of the school groups. Tutoring was more prevalent in the elementary classrooms than in the middle and high school classrooms.
Figure 2. Percentage of Classrooms in Which Team Teaching, Collaborative Learning, and Individual Tutoring Were Prevalent
Learning Point Associates NYCDOE: Classroom Observation Report—7
9% 7%
19%14% 14% 13%
8%4% 1%
0%
10%
20%
30%
40%
50%
60%
70%
80%
90%
100%
Elementary(n=227)
Middle (n=58) High (n=70)
Team teaching
Collaborative learning
Individual tutoring
Never or Rarely Observed. Table 4 shows the percentage of classrooms in which team teaching, collaborative learning, and individual tutoring were never or rarely observed. Of the three practices, tutoring was the least observed (in part because of SOM guidelines that stipulate that tutoring not be coded if it takes place well outside of the classroom area).
Table 4. Percentage of Classrooms in Which Team Teaching, Collaborative Learning, and Individual Tutoring Were Observed Never or Rarely
Instructional Practice Elementary Schools Middle Schools High Schools
Team teaching 86% 90% 80%
Collaborative learning 77% 76% 81%
Individual tutoring 89% 93% 99%
Comparison to National Norms. Table 5 compares the prevalence of team teaching, collaborative learning, and individual tutoring between the New York City sample and the national norms. With the exception of team teaching in the New York City sample high schools, the practices were slightly less prevalent in the New York City sample classrooms than the national norms.
Table 5. Team Teaching, Collaborative Learning, and Individual Tutoring:Comparison to National Norms
Instructional Practice
Elementary Schools Middle Schools High Schools
New York City
National Norm
New York City
National Norm
New York City
National Norm
Team teaching
0.48 0.74 0.31 0.42 0.73 0.42
Collaborative learning
0.74 0.91 0.81 0.97 0.69 0.97
Individual 0.37 0.89 0.19 0.34 0.07 0.34
Learning Point Associates NYCDOE: Classroom Observation Report—8
tutoring
Classroom Orientation
Ability Grouping and Work Centers
Among the instructional characteristics assessed by the SOM is student grouping (i.e., the extent to which students are grouped by ability and in work centers where they work individually or in small groups). Although the SOM does not include a code for whole-group instruction, an assumption is that whole-group instruction occurs when smaller student groups are not deliberately organized.
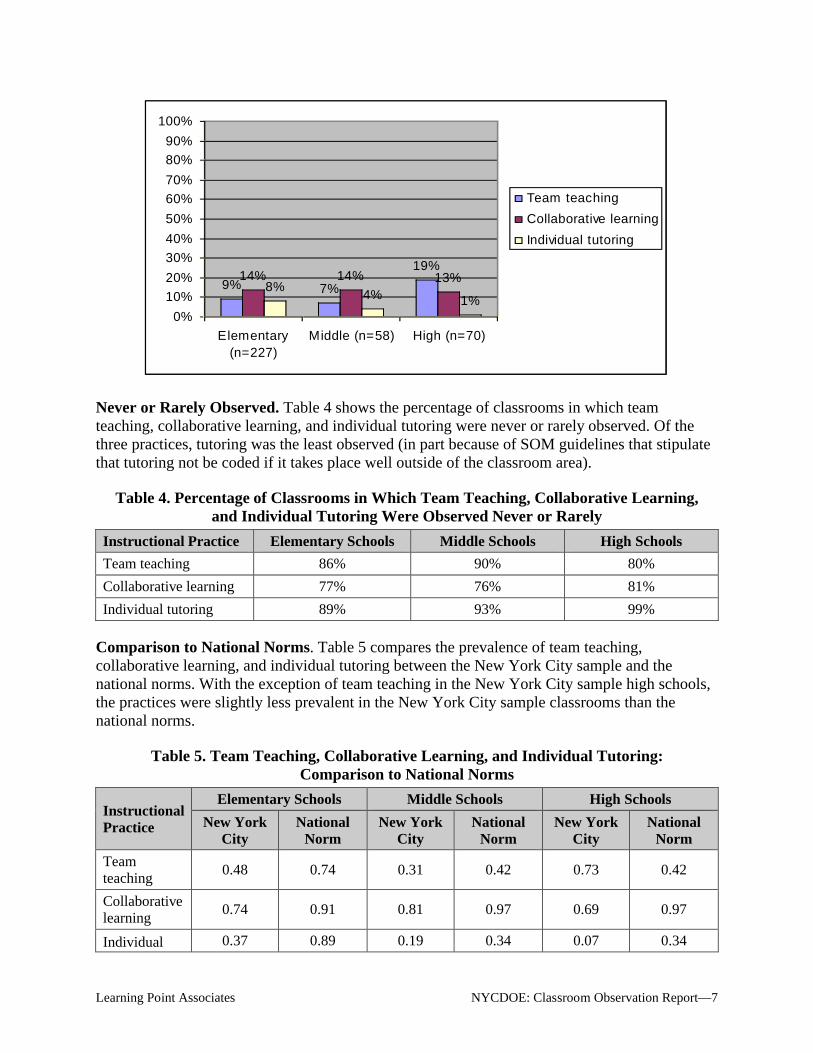
Prevalence. In the sample schools, as Figure 3 depicts, both ability groups and work centers were more prevalent in elementary schools than in middle and secondary schools. Note that prevalence is determined by the observers’ ratings of extensively or frequently. Figure 3 depicts the percentage of classrooms in which the instructional practices—ability groups and work centers—were observed frequently or extensively.
Figure 3. Percentage of Classrooms in Which Ability Groups andWork Centers Were Prevalent
1 8 %
7 %3 %
4 9 %
2 % 3 %
0 %
1 0 %
2 0 %
3 0 %
4 0 %
5 0 %
6 0 %
7 0 %
8 0 %
9 0 %
1 0 0 %
E le m e n t a ry(n = 2 2 7 )
M id d le(n = 5 8 )
H ig h(n = 7 0 )
A b i l i t y g ro u p s
W o rk c e n t e rs
Never or Rarely Observed. Table 6 depicts the percentage of classrooms in which ability groups and work centers were observed never or rarely. Consistent with Figure 3, Table 6 notes that in middle and high schools, ability groups and work centers were seldom observed in the ELA classrooms. In elementary schools, ability groups were rarely or never observed in 70 percent of the classrooms.
Table 6. Percentage of Classrooms in Which Ability Groups andWork Centers Were Observed Never or Rarely
Instructional Practice Elementary Schools Middle Schools High Schools
Ability groups 70 % 91% 94%
Work centers 37% 98% 97%

Learning Point Associates NYCDOE: Classroom Observation Report—9
Comparison to National Norms. To compare the prevalence of instructional practices to national norms, averages of frequency ratings from all SOMs for each of the elementary, middle, and high school groups were determined and compared to the averages in the national sample.
National norms and the New York City averages were determined by using a 0–4 scale (0 being never observed and 4 being extensively observed), deriving the sum of the responses per instructional practice, and then determining the average by dividing the sum by the total number of SOMs per instructional practice. A mean of 4 indicates that, on average, a practice was extensively observed. A mean of 1 indicates that on average, a practice was rarely observed.
Table 7 indicates that for the New York City school sample, the average prevalence of ability groups and work centers in the New York City sample ELA classrooms was less than the national norm average. The exception was the prevalence of elementary school work centers, which exceeded the national norm.
Learning Point Associates NYCDOE: Classroom Observation Report—10
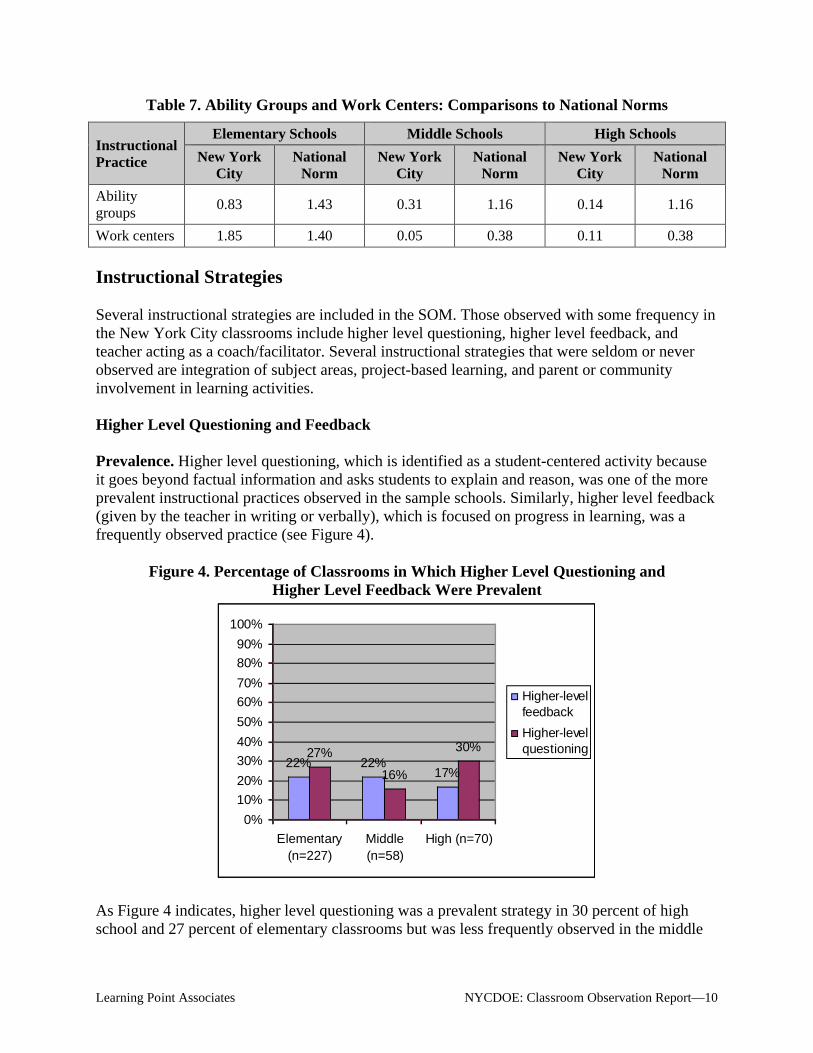
Table 7. Ability Groups and Work Centers: Comparisons to National Norms
Instructional Practice
Elementary Schools Middle Schools High Schools
New York City
National Norm
New York City
National Norm
New York City
National Norm
Ability groups
0.83 1.43 0.31 1.16 0.14 1.16
Work centers 1.85 1.40 0.05 0.38 0.11 0.38
Instructional Strategies
Several instructional strategies are included in the SOM. Those observed with some frequency in the New York City classrooms include higher level questioning, higher level feedback, and teacher acting as a coach/facilitator. Several instructional strategies that were seldom or never observed are integration of subject areas, project-based learning, and parent or community involvement in learning activities.
Higher Level Questioning and Feedback
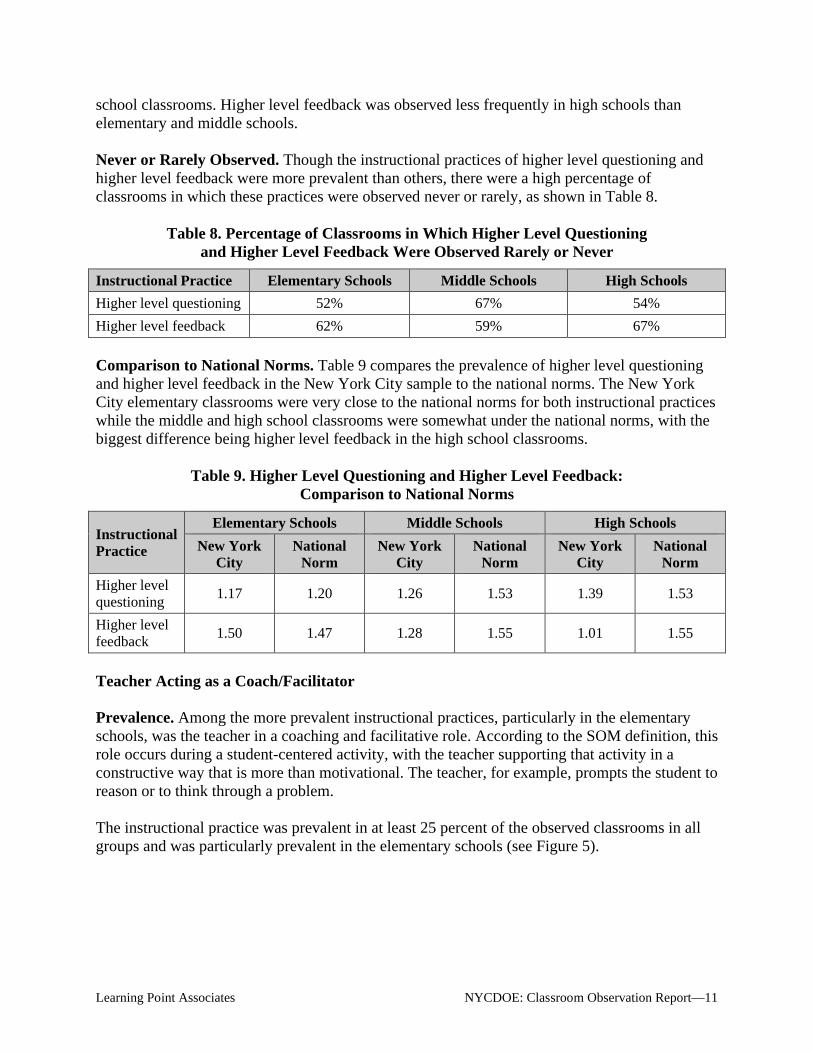
Prevalence. Higher level questioning, which is identified as a student-centered activity because it goes beyond factual information and asks students to explain and reason, was one of the more prevalent instructional practices observed in the sample schools. Similarly, higher level feedback(given by the teacher in writing or verbally), which is focused on progress in learning, was a frequently observed practice (see Figure 4).
Figure 4. Percentage of Classrooms in Which Higher Level Questioning andHigher Level Feedback Were Prevalent
22% 22%17%
27%
16%
30%
0%
10%
20%
30%
40%
50%
60%
70%
80%
90%
100%
Elementary(n=227)
Middle(n=58)
High (n=70)
Higher-levelfeedback
Higher-levelquestioning
As Figure 4 indicates, higher level questioning was a prevalent strategy in 30 percent of high school and 27 percent of elementary classrooms but was less frequently observed in the middle
Learning Point Associates NYCDOE: Classroom Observation Report—11
school classrooms. Higher level feedback was observed less frequently in high schools than elementary and middle schools.
Never or Rarely Observed. Though the instructional practices of higher level questioning and higher level feedback were more prevalent than others, there were a high percentage of classrooms in which these practices were observed never or rarely, as shown in Table 8.
Table 8. Percentage of Classrooms in Which Higher Level Questioning and Higher Level Feedback Were Observed Rarely or Never
Instructional Practice Elementary Schools Middle Schools High Schools
Higher level questioning 52% 67% 54%
Higher level feedback 62% 59% 67%
Comparison to National Norms. Table 9 compares the prevalence of higher level questioning and higher level feedback in the New York City sample to the national norms. The New York City elementary classrooms were very close to the national norms for both instructional practiceswhile the middle and high school classrooms were somewhat under the national norms, with the biggest difference being higher level feedback in the high school classrooms.
Table 9. Higher Level Questioning and Higher Level Feedback:Comparison to National Norms
Instructional Practice
Elementary Schools Middle Schools High Schools
New York City
National Norm
New York City
National Norm
New York City
National Norm
Higher level questioning
1.17 1.20 1.26 1.53 1.39 1.53
Higher level feedback
1.50 1.47 1.28 1.55 1.01 1.55
Teacher Acting as a Coach/Facilitator
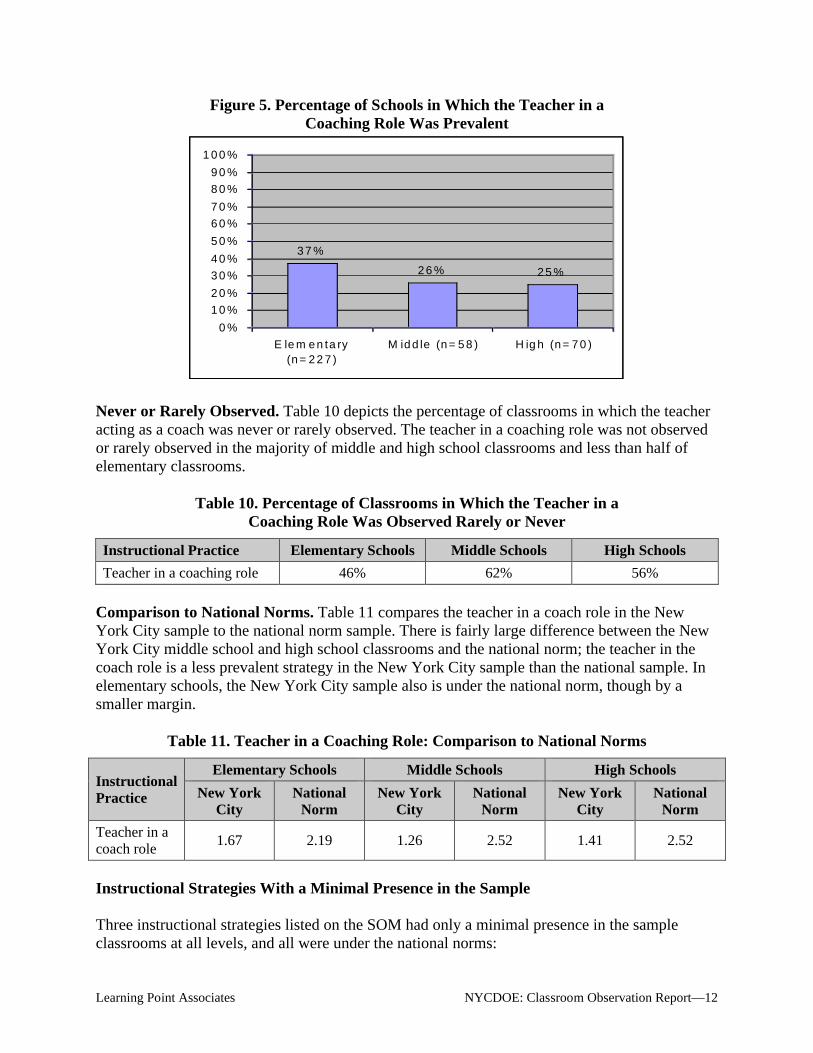
Prevalence. Among the more prevalent instructional practices, particularly in the elementary schools, was the teacher in a coaching and facilitative role. According to the SOM definition, this role occurs during a student-centered activity, with the teacher supporting that activity in a constructive way that is more than motivational. The teacher, for example, prompts the student to reason or to think through a problem.
The instructional practice was prevalent in at least 25 percent of the observed classrooms in all groups and was particularly prevalent in the elementary schools (see Figure 5).
Learning Point Associates NYCDOE: Classroom Observation Report—12
Figure 5. Percentage of Schools in Which the Teacher in aCoaching Role Was Prevalent
3 7 %
2 6 % 2 5 %
0 %
1 0 %
2 0 %
3 0 %
4 0 %
5 0 %
6 0 %
7 0 %
8 0 %
9 0 %
1 0 0 %
E le m e n ta ry(n = 2 2 7 )
M id d le (n = 5 8 ) H ig h (n = 7 0 )
Never or Rarely Observed. Table 10 depicts the percentage of classrooms in which the teacher acting as a coach was never or rarely observed. The teacher in a coaching role was not observed or rarely observed in the majority of middle and high school classrooms and less than half of elementary classrooms.
Table 10. Percentage of Classrooms in Which the Teacher in aCoaching Role Was Observed Rarely or Never
Instructional Practice Elementary Schools Middle Schools High Schools
Teacher in a coaching role 46% 62% 56%
Comparison to National Norms. Table 11 compares the teacher in a coach role in the New York City sample to the national norm sample. There is fairly large difference between the New York City middle school and high school classrooms and the national norm; the teacher in the coach role is a less prevalent strategy in the New York City sample than the national sample. In elementary schools, the New York City sample also is under the national norm, though by a smaller margin.
Table 11. Teacher in a Coaching Role: Comparison to National Norms
Instructional Practice
Elementary Schools Middle Schools High Schools
New York City
National Norm
New York City
National Norm
New York City
National Norm
Teacher in a coach role
1.67 2.19 1.26 2.52 1.41 2.52
Instructional Strategies With a Minimal Presence in the Sample
Three instructional strategies listed on the SOM had only a minimal presence in the sample classrooms at all levels, and all were under the national norms:
Learning Point Associates NYCDOE: Classroom Observation Report—13
Integration of Subject Areas. The strategy was observed rarely or not at all in 94 percent of elementary classrooms, 93 percent of middle school classrooms, and 96 percent of the high school classrooms.
Project-Based Learning. The strategy was observed rarely or not at all in 97 percent of elementary classrooms, 95 percent of middle school classrooms, and 93 percent of high school classrooms.
Parent/Community Involvement in Learning Activities. The strategy was never observed in any of the elementary or middle schools and in 97 percent of high school classrooms.
Student Activities
The most prevalent student activities observed were independent seatwork, student writing, student reading, and student discussion. Of the seven student activities that are included in the SOM, three activities had little or no presence in the observed classrooms: systematic individual instruction (differentiated assignments); independent inquiry conducted by students (which is considered a student-centered activity); and experiential, hands-on learning (which also is a student-centered activity).
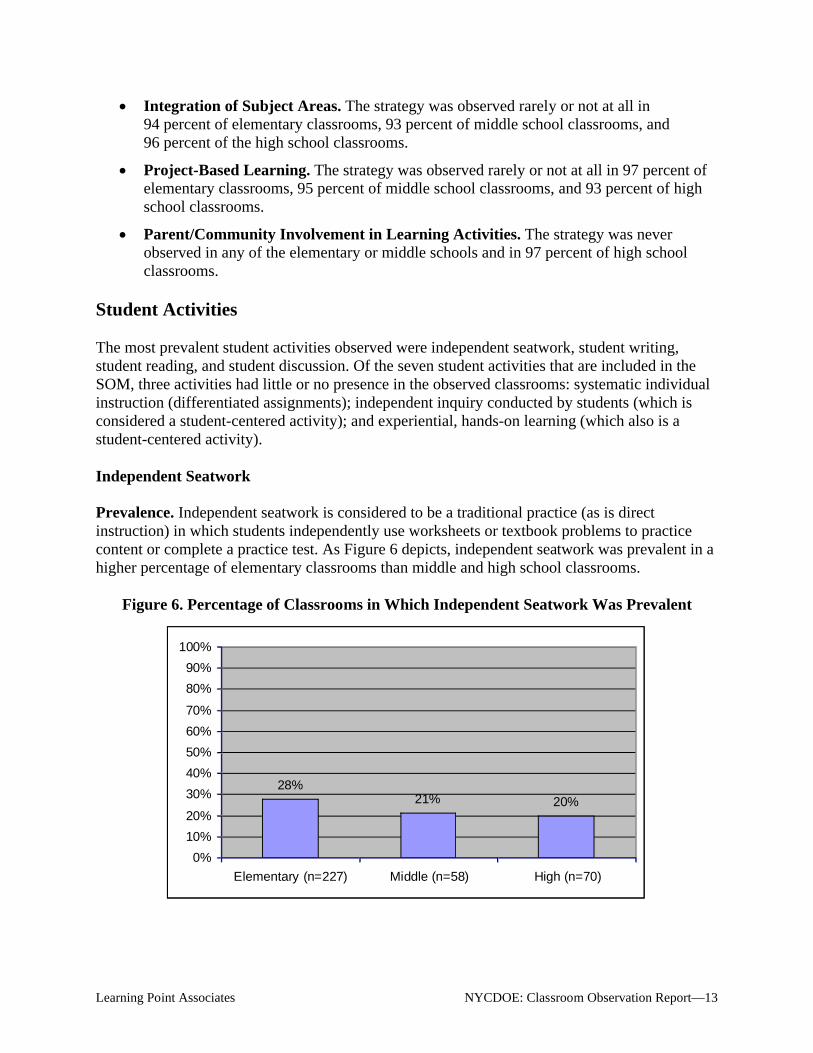
Independent Seatwork
Prevalence. Independent seatwork is considered to be a traditional practice (as is direct instruction) in which students independently use worksheets or textbook problems to practice content or complete a practice test. As Figure 6 depicts, independent seatwork was prevalent in a higher percentage of elementary classrooms than middle and high school classrooms.
Figure 6. Percentage of Classrooms in Which Independent Seatwork Was Prevalent
28%21% 20%
0%
10%
20%
30%
40%
50%
60%
70%
80%
90%
100%
Elementary (n=227) Middle (n=58) High (n=70)
Learning Point Associates NYCDOE: Classroom Observation Report—14
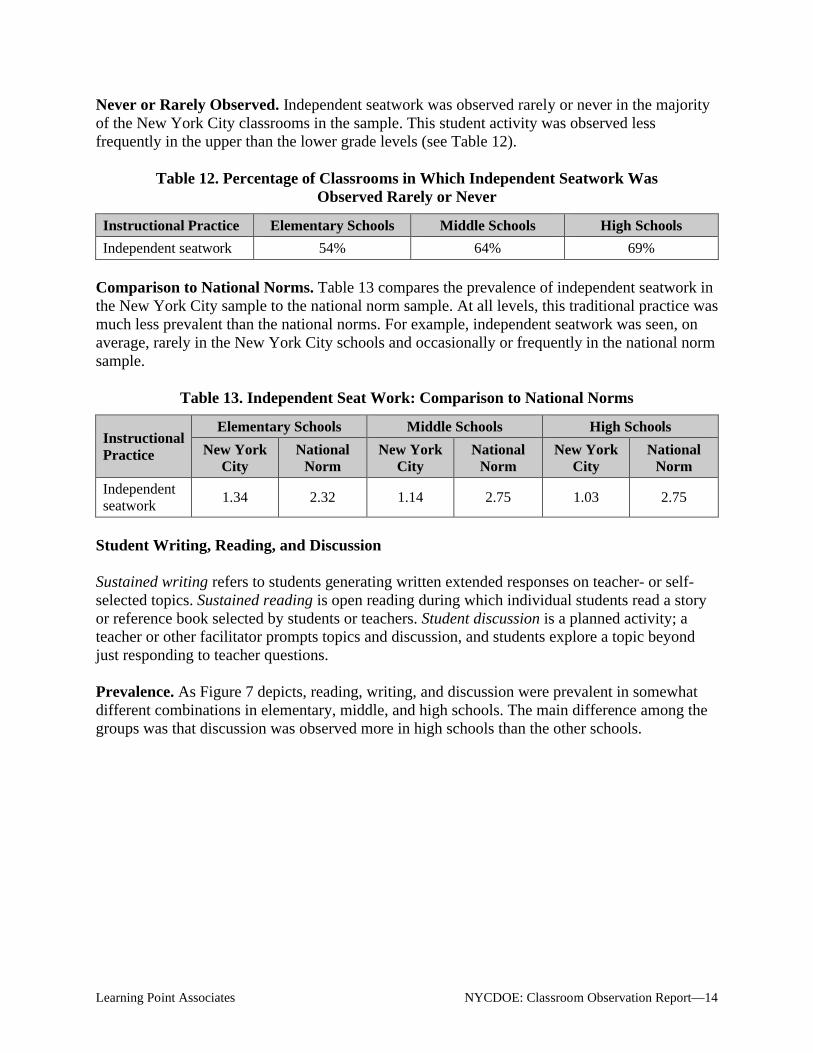
Never or Rarely Observed. Independent seatwork was observed rarely or never in the majority of the New York City classrooms in the sample. This student activity was observed less frequently in the upper than the lower grade levels (see Table 12).
Table 12. Percentage of Classrooms in Which Independent Seatwork WasObserved Rarely or Never
Instructional Practice Elementary Schools Middle Schools High Schools
Independent seatwork 54% 64% 69%
Comparison to National Norms. Table 13 compares the prevalence of independent seatwork in the New York City sample to the national norm sample. At all levels, this traditional practice was much less prevalent than the national norms. For example, independent seatwork was seen, on average, rarely in the New York City schools and occasionally or frequently in the national norm sample.
Table 13. Independent Seat Work: Comparison to National Norms
Instructional Practice
Elementary Schools Middle Schools High Schools
New York City
National Norm
New York City
National Norm
New York City
National Norm
Independent seatwork
1.34 2.32 1.14 2.75 1.03 2.75
Student Writing, Reading, and Discussion
Sustained writing refers to students generating written extended responses on teacher- or self-selected topics. Sustained reading is open reading during which individual students read a story or reference book selected by students or teachers. Student discussion is a planned activity; a teacher or other facilitator prompts topics and discussion, and students explore a topic beyond just responding to teacher questions.
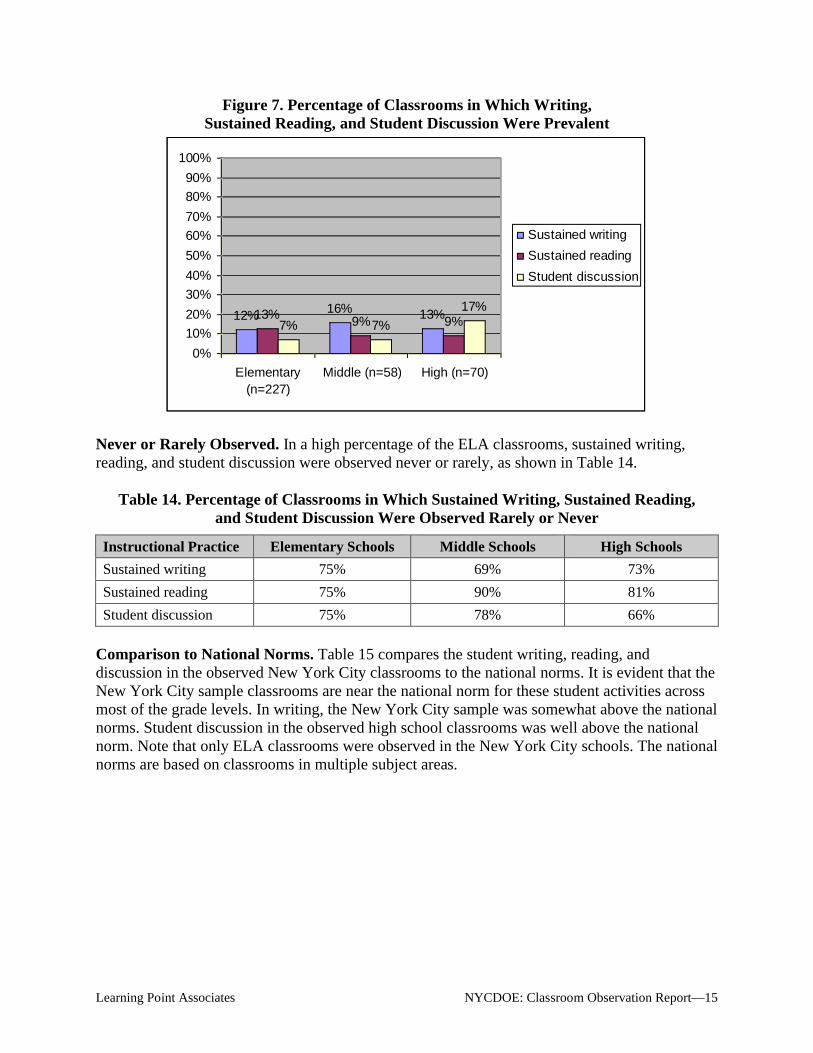
Prevalence. As Figure 7 depicts, reading, writing, and discussion were prevalent in somewhat different combinations in elementary, middle, and high schools. The main difference among the groups was that discussion was observed more in high schools than the other schools.
Learning Point Associates NYCDOE: Classroom Observation Report—15
Figure 7. Percentage of Classrooms in Which Writing, Sustained Reading, and Student Discussion Were Prevalent
12% 16% 13%13% 9% 9%7% 7%
17%
0%
10%
20%
30%
40%
50%
60%
70%
80%
90%
100%
Elementary(n=227)
Middle (n=58) High (n=70)
Sustained writing
Sustained reading
Student discussion
Never or Rarely Observed. In a high percentage of the ELA classrooms, sustained writing, reading, and student discussion were observed never or rarely, as shown in Table 14.
Table 14. Percentage of Classrooms in Which Sustained Writing, Sustained Reading,and Student Discussion Were Observed Rarely or Never
Instructional Practice Elementary Schools Middle Schools High Schools
Sustained writing 75% 69% 73%
Sustained reading 75% 90% 81%
Student discussion 75% 78% 66%
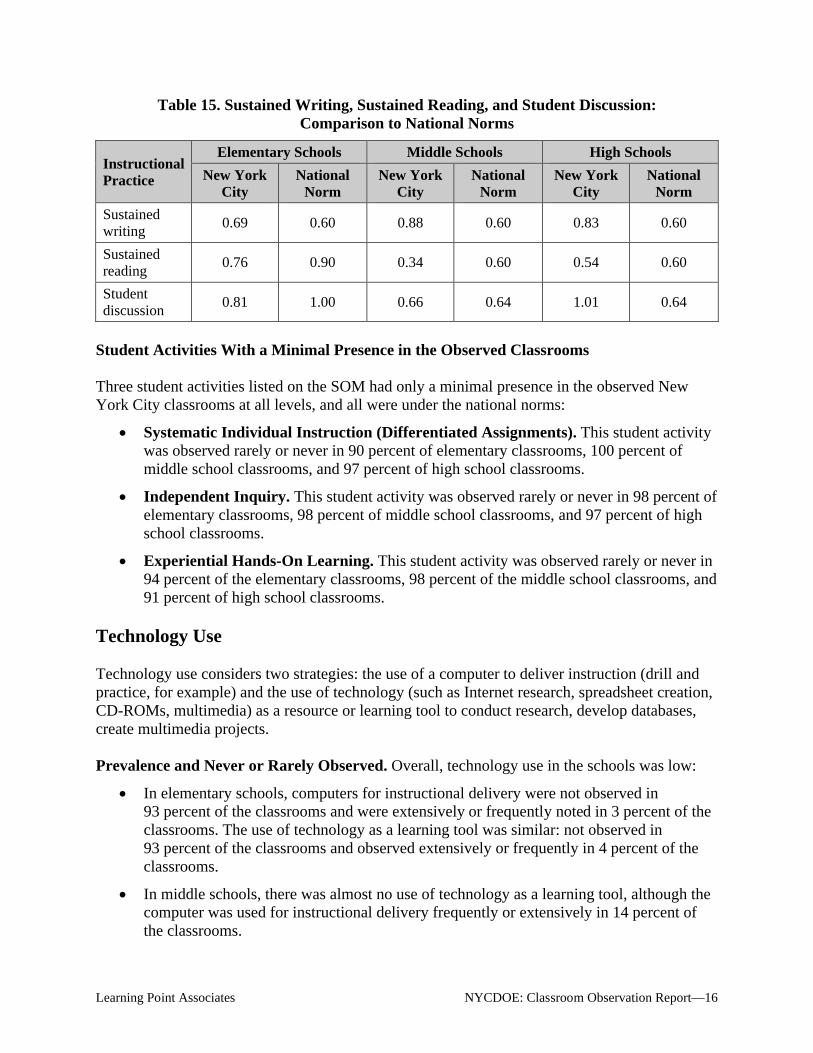
Comparison to National Norms. Table 15 compares the student writing, reading, and discussion in the observed New York City classrooms to the national norms. It is evident that the New York City sample classrooms are near the national norm for these student activities across most of the grade levels. In writing, the New York City sample was somewhat above the national norms. Student discussion in the observed high school classrooms was well above the national norm. Note that only ELA classrooms were observed in the New York City schools. The national norms are based on classrooms in multiple subject areas.
Learning Point Associates NYCDOE: Classroom Observation Report—16
Table 15. Sustained Writing, Sustained Reading, and Student Discussion:Comparison to National Norms
Instructional Practice
Elementary Schools Middle Schools High Schools
New York City
National Norm
New York City
National Norm
New York City
National Norm
Sustained writing
0.69 0.60 0.88 0.60 0.83 0.60
Sustained reading
0.76 0.90 0.34 0.60 0.54 0.60
Student discussion
0.81 1.00 0.66 0.64 1.01 0.64
Student Activities With a Minimal Presence in the Observed Classrooms
Three student activities listed on the SOM had only a minimal presence in the observed New York City classrooms at all levels, and all were under the national norms:
Systematic Individual Instruction (Differentiated Assignments). This student activity was observed rarely or never in 90 percent of elementary classrooms, 100 percent of middle school classrooms, and 97 percent of high school classrooms.
Independent Inquiry. This student activity was observed rarely or never in 98 percent of elementary classrooms, 98 percent of middle school classrooms, and 97 percent of high school classrooms.
Experiential Hands-On Learning. This student activity was observed rarely or never in 94 percent of the elementary classrooms, 98 percent of the middle school classrooms, and 91 percent of high school classrooms.
Technology Use
Technology use considers two strategies: the use of a computer to deliver instruction (drill and practice, for example) and the use of technology (such as Internet research, spreadsheet creation, CD-ROMs, multimedia) as a resource or learning tool to conduct research, develop databases, create multimedia projects.
Prevalence and Never or Rarely Observed. Overall, technology use in the schools was low:
In elementary schools, computers for instructional delivery were not observed in 93 percent of the classrooms and were extensively or frequently noted in 3 percent of the classrooms. The use of technology as a learning tool was similar: not observed in 93 percent of the classrooms and observed extensively or frequently in 4 percent of the classrooms.
In middle schools, there was almost no use of technology as a learning tool, although the computer was used for instructional delivery frequently or extensively in 14 percent of the classrooms.
Learning Point Associates NYCDOE: Classroom Observation Report—17
In high schools, computer for instructional delivery was observed never or rarely in 86 percent of classrooms and was observed frequently or extensively in 9 percent of classrooms. Technology was observed never or rarely in 94 percent of classrooms and frequently or extensive observed in 6 percent of classrooms.
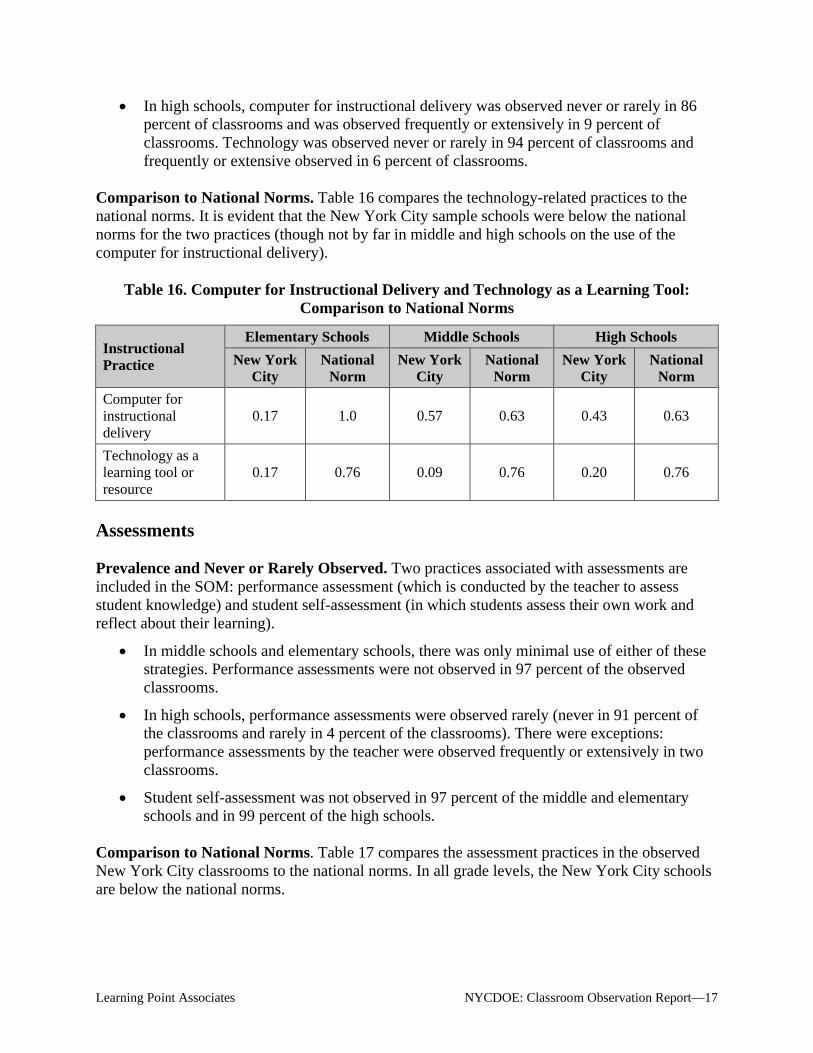
Comparison to National Norms. Table 16 compares the technology-related practices to the national norms. It is evident that the New York City sample schools were below the national norms for the two practices (though not by far in middle and high schools on the use of the computer for instructional delivery).
Table 16. Computer for Instructional Delivery and Technology as a Learning Tool: Comparison to National Norms
Instructional Practice
Elementary Schools Middle Schools High Schools
New York City
National Norm
New York City
National Norm
New York City
National Norm
Computer for instructional delivery
0.17 1.0 0.57 0.63 0.43 0.63
Technology as a learning tool or resource
0.17 0.76 0.09 0.76 0.20 0.76
Assessments
Prevalence and Never or Rarely Observed. Two practices associated with assessments are included in the SOM: performance assessment (which is conducted by the teacher to assess student knowledge) and student self-assessment (in which students assess their own work and reflect about their learning).
In middle schools and elementary schools, there was only minimal use of either of these strategies. Performance assessments were not observed in 97 percent of the observed classrooms.
In high schools, performance assessments were observed rarely (never in 91 percent of the classrooms and rarely in 4 percent of the classrooms). There were exceptions: performance assessments by the teacher were observed frequently or extensively in two classrooms.
Student self-assessment was not observed in 97 percent of the middle and elementary schools and in 99 percent of the high schools.
Comparison to National Norms. Table 17 compares the assessment practices in the observed New York City classrooms to the national norms. In all grade levels, the New York City schools are below the national norms.
Learning Point Associates NYCDOE: Classroom Observation Report—18
Table 17. Performance Assessment and Student Self-Assessment:Comparison to National Norms
Instructional Practice
Elementary Schools Middle Schools High Schools
New York City
National Norm
New York City
National Norm
New York City
National Norm
Performance assessment
0.09 0.60 0.10 0.58 0.17 0.58
Student self-assessment
0.03 0.38 0.03 0.29 0.04 0.29
Academic Focus and Student Engagement
Academic focus and student engagement are the only evaluative items in the SOM. Referred to as summary items, they provide overall estimates of the time that students spend in academic activities and estimates of the time during which students are engaged and attentive.
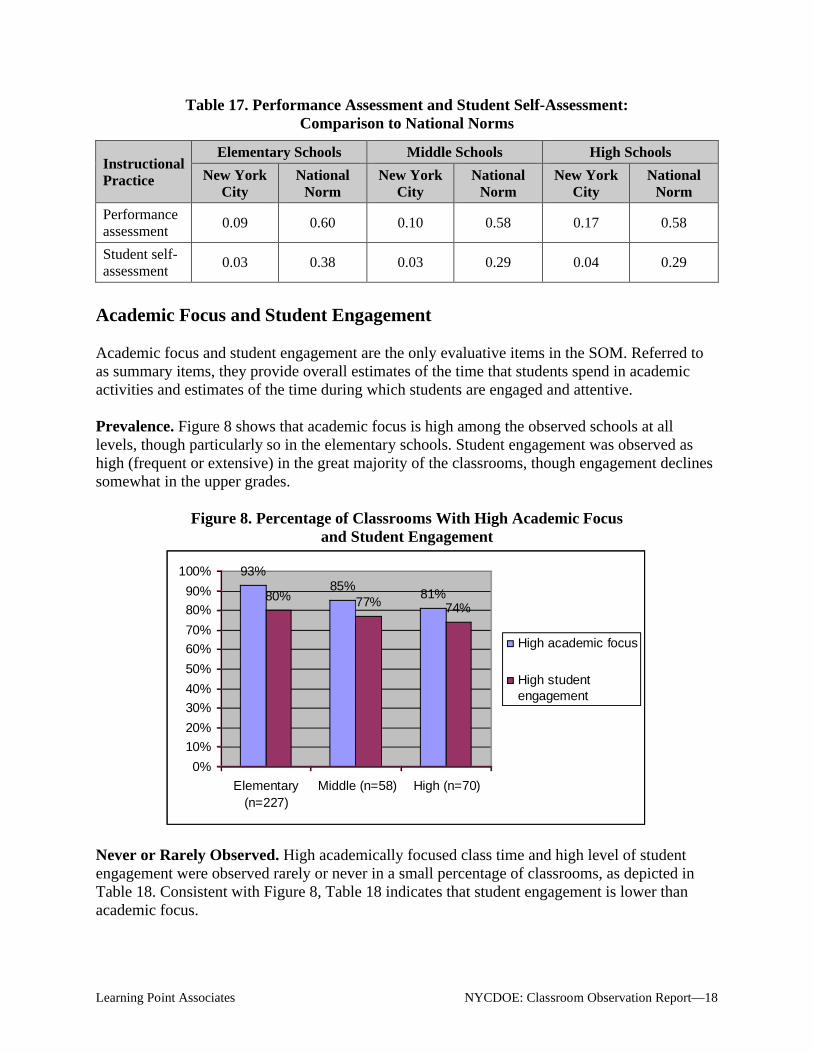
Prevalence. Figure 8 shows that academic focus is high among the observed schools at all levels, though particularly so in the elementary schools. Student engagement was observed as high (frequent or extensive) in the great majority of the classrooms, though engagement declines somewhat in the upper grades.
Figure 8. Percentage of Classrooms With High Academic Focus and Student Engagement
93%85%
81%80% 77% 74%
0%
10%
20%
30%
40%
50%
60%
70%
80%
90%
100%
Elementary(n=227)
Middle (n=58) High (n=70)
High academic focus
High studentengagement
Never or Rarely Observed. High academically focused class time and high level of student engagement were observed rarely or never in a small percentage of classrooms, as depicted in Table 18. Consistent with Figure 8, Table 18 indicates that student engagement is lower than academic focus.
Learning Point Associates NYCDOE: Classroom Observation Report—19
Table 18. Percentage of Classrooms in Which High Academic Focus andStudent Engagement Were Observed Rarely or Never
Instructional Practice Elementary Schools Middle Schools High Schools
High academic focus 0% 2% 1%
High student engagement 4% 10% 9%
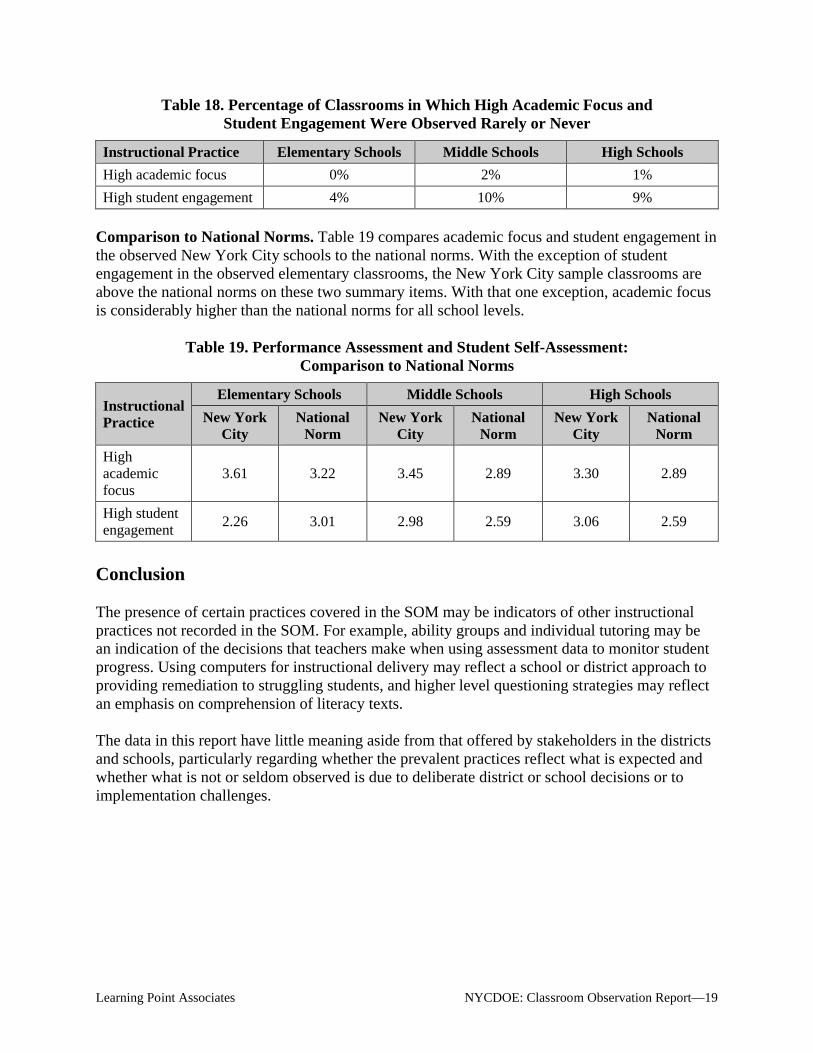
Comparison to National Norms. Table 19 compares academic focus and student engagement in the observed New York City schools to the national norms. With the exception of student engagement in the observed elementary classrooms, the New York City sample classrooms are above the national norms on these two summary items. With that one exception, academic focus is considerably higher than the national norms for all school levels.
Table 19. Performance Assessment and Student Self-Assessment:Comparison to National Norms
Instructional Practice
Elementary Schools Middle Schools High Schools
New York City
National Norm
New York City
National Norm
New York City
National Norm
High academic focus
3.61 3.22 3.45 2.89 3.30 2.89
High student engagement
2.26 3.01 2.98 2.59 3.06 2.59
Conclusion
The presence of certain practices covered in the SOM may be indicators of other instructional practices not recorded in the SOM. For example, ability groups and individual tutoring may be an indication of the decisions that teachers make when using assessment data to monitor student progress. Using computers for instructional delivery may reflect a school or district approach to providing remediation to struggling students, and higher level questioning strategies may reflect an emphasis on comprehension of literacy texts.
The data in this report have little meaning aside from that offered by stakeholders in the districts and schools, particularly regarding whether the prevalent practices reflect what is expected and whether what is not or seldom observed is due to deliberate district or school decisions or to implementation challenges.
Learning Point Associates NYCDOE: Classroom Observation Report—20
References
Lewis, E. M., Ross, S. M., & Alberg, M. (1999). School observation measure: Reliability analysis. Memphis, TN: Center for Research in Educational Policy.
Ross, S. M., McDonald, A. J., & Bol, L. (2004). First year evaluation of Tennessee charter schools: 2003-2004. Memphis, TN: Center for Research in Educational Policy.
Learning Point Associates NYCDOE: Classroom Observation Report—21
Appendix. Definition of Terms
The SOM consists of 24 strategies distinguished categorically into six areas of instruction: instructional orientation, classroom organization, instructional strategies, student activities, technology use, and assessments. In addition, two summary items assessing the level of academic focus and the level of student engagement in the lesson are included in the data summary. Definitions of these terms follow.
Instructional Orientation
The format of the classroom can vary widely. Therefore CREP sorted instructional orientation into four main items, which may include any combination of direct instruction, team teaching, cooperative/collaborative learning, and/or individual tutoring.
Direct Instruction. Direct instruction involves teacher-directed and teacher-controlled classroom instruction and must have an academic focus that goes beyond simply giving instructions. In direct instruction, the teacher may use lecture- or questioning-type format. Direct instruction includes instances when the teacher explains a concept, reads to students, or guides students in practicing a concept.
Team Teaching. When two or more teachers or teacher aides have an instructional role within the same class, it sometimes is considered team teaching. In addition, if two certified teachers are both present in a classroom, it is considered team teaching even if only one teacher is leading instruction during the observation. The observation of a noncertified teacher assistant, parent, or community member engaged in a teaching role also is considered team teaching. However, it is not team teaching if a noncertified teacher is present but not teaching during the observation.
Cooperative/Collaborative Learning. Cooperative/collaborative learning consists of small-group interactions, including partner reading with the expectation that students will help each other on the activity or produce a group project at some point in the future. In cooperative/collaborative learning, the emphasis is on working together and learning to cooperate.
Individual Tutoring. Individual tutoring is when a student receives one-on-one help from a teacher, aide, peer, or volunteer. The tutoring must be planned in advanced, with both the role of tutor and tutee predetermined. It is not considered individual tutoring when a teacher stops to answer a child’s question or helps the student solve a problem unless the interaction was preplanned. That type of instructional delivery is captured under “teacher acting as coach/facilitator” (see description in the Instructional Strategies subhead).
Classroom Organization
CREP identified three types of classroom organization that may be beneficial to learning: ability grouping, multiage grouping, and work centers.
Ability Grouping. Ability grouping is when students receive differentiated instruction based on their performance level. In ability grouping, students are seated with other students of similar abilities.
Learning Point Associates NYCDOE: Classroom Observation Report—22
Multiage Grouping. Multiage grouping is when students from different grades or students of different ages are grouped in the same class. The classes are determined by students’ estimated abilities, past achievement, and projected educational careers.
Work Centers. Work centers are specific areas of the classroom with special materials and resources designed for a specific purpose. Work centers can be used either by individuals or by groups and often contain reading rugs and materials, computers, or instruction boards. The work center must be in use during the SOM observation in order for it to be documented in the observation.
Instructional Strategies
CREP identified six types of instructional strategies that may be observed using the SOM: higherlevel instructional feedback, integration of subject areas, project-based learning, higher level questioning, the teacher acting as a coach/facilitator, and parent/community involvement in learning activities.
Higher Level Instructional Feedback. Teachers engage in higher level instructional feedback when they provide answers or new information that is elaborative and goes beyond telling students that their answers are correct or incorrect. Simply giving the student positive reinforcement does not constitute higher level instructional feedback; the teacher must elaborate on a student’s responses and provide him or her with additional relevant information.
Integration of Subject Areas. Integration of subject areas requires the teacher to plan to use knowledge of multiple subject areas in a single lesson. In these cases, the content is not separated by subject and the instructional activity needs to meet major objectives of each discipline. Integration of subject areas must go beyond a routine combination of subjects. For example, completing word problems in a mathematics textbook or analyzing a graph from a science book is not considered integration of subject areas.
Project-Based Learning. Project-based learning is an opportunity for students to learn through the process of an ongoing inquiry; they learn skills through the process of creating a project. These are long-term, planned projects and frequently produce tangible results or culminate in a final performance or product. Examples of project-based learning include creating exhibits, writing books, doing research reports, and conducting community service.
Higher Level Questioning. Teachers utilize higher level questioning when they prompt students to think beyond factual information and to apply, analyze, synthesize, or evaluate what they have learned. The teacher asks questions that encourage students to discuss or debate their knowledge, offer opinions about cause and effect, speculate on the hypothetical, or think about a problem in a creative manner. Higher level questioning requires the teacher to elicit the higher level thinking and problem strategies from students. It differs from higher level instructional feedback (see the first description in the Instructional Strategies subheading), in which the teacher provides students with additional information but does not require them to express their own higher level thinking.
Learning Point Associates NYCDOE: Classroom Observation Report—23
Teacher Acting as Coach/Facilitator. When a teacher acts as a coach/facilitator, he or she guides students in either an independent or a group activity. This situation cannot occur during a traditional lecture format. The teacher not only motivates the students but provides them with academically focused comments, suggestions, or modeling. Simple positive reinforcement does not constitute acting as a coach/facilitator.
Parent/Community Involvement in Learning Activities. Parent/community involvement in learning activities requires involvement beyond a parent’s presence in a classroom. The parent or community member must support the student’s learning; this situation may involve assisting with materials, monitoring student work, guiding an academic activity, or tutoring a student.
Student Activities
In the development of the SOM, CREP identified seven major student activities that are seen in quality education and academic achievement. Students may learn through independent seatwork, experiential hands-on learning, systematic individual instruction, sustained writing, sustained reading, independent inquiry/research, and student discussion.
Independent Seatwork. When students complete worksheets, textbook problems, or practice tests, they are doing independent seatwork. Students work individually, reviewing or practicing content they have studied. It is not considered independent seatwork when students use hands-on manipulatives, work on a computer, conduct their own research, write a paper or journals, or read a book that is not a textbook.
Experiential, Hands-On Learning. The process of learning through concrete experiences, hands-on manipulatives, or computer-based or noncomputer-based simulations is considered experiential hands-on learning. Experiential hands-on learning includes using science equipment, games, and/or physically touching some type of object. Students learn by doing.
Systematic Individual Instruction. When assignments or activities are modified to better match a student’s needs and interests, it is considered systematic individual instruction. This modificationcan include a teacher-selected computer program that is suited to a student’s abilities, computer programs that adapt lessons to a student’s level of proficiency, or different students receiving different worksheets or reading materials. Systematic individual instruction does not include instances when students are simply working at their own pace, playing games, or engaging in other noneducational activities.
Sustained Writing. Students engage in sustained writing when they write a story, write an extended response to a question or prompt, or write about a self-selected or teacher-assigned theme. Sustained writing goes beyond responding to short-answer essays at the end of a textbook.
Sustained Reading. When students read a story, novel, reference book, or other print material without trying to find answers to objective questions, it is considered sustained reading. If the
Learning Point Associates NYCDOE: Classroom Observation Report—24
student reads a textbook or other reading material with the express purpose of finding answers to certain questions, it is not sustained reading.
Independent Inquiry/Research. When students gather facts or search for information in a manner that goes beyond referring to an everyday textbook, it is considered independent inquiry/research. The research may be conducted in either an individual or group setting and may use multimedia sources. If students use only resources or Internet sites that were specifically provided by the teacher, the assignment is not considered independent inquiry/research.
Student Discussion. Student discussion occurs when students are prompted to talk; share experiences; debate; or converse in pairs, small groups, or as a whole class. These discussions usually focus on a particular higher level idea. A student discussion is not simply a social or informal discussion, and it must go beyond students replying to teacher questions.
Technology Use
CREP categorized technology use in the classroom in two ways: either as a way of delivering instruction or as a tool for learning.
Computers for Instructional Delivery. The use of a computer to practice or learn concepts or present material is considered the use of computers for instructional delivery. Either the teacher or the students may use the computer, but the technology must be doing the “teaching”—not simply be used as a tool in completing a lesson.
Technology as a Learning Tool or Resource. This practice includes instances when students use technology to obtain, manipulate, or communicate information to complete a learning task. Examples of using technology as a learning tool or resource include Internet research, spreadsheets and databases, or word processing. Digital cameras, graphing calculators, computers, and MP3 players all may be used as learning tools or resources.
Assessments
CREP identified two types of assessments to document student ability and progress in school classrooms: performance assessment and student self-assessment. The assessments must be formal and may be either teacher-based or student-based.
Performance Assessment. Performance assessment strategies are used when a teacher uses a formal assessment such as a rubric or rating scale to assess students’ demonstrated knowledge. This assessment must be formally organized and goes beyond paper-and-pencil tests or report card grades. Performance assessment may include portfolios or charts of progress.
Student Self-Assessment. Student self-assessment is when students reflect on their own learning. This assessment may take place through portfolios, logs, or checklists. Student assessment does not include instances of getting test feedback from a computer or grading their own or another student’s papers.
Learning Point Associates NYCDOE: Classroom Observation Report—25
Summary Items
Finally, CREP defined two summary items: the academic focus of class time and the student’s engagement in the lessons. These items are not necessarily related. For example, students may be highly engaged in a nonacademically focused class activity or they may not be highly engaged in an academically focused lesson.
High Academically Focused Class Time. The focus of class time relates to how much time is spent on curriculum-based teaching and learning. This situation is not necessarily related to the quality of teaching. The academic focus of class time is disrupted by discipline, class interruptions, and teacher activities that do not have instructional objectives.
High Level of Student Attention, Interest, Engagement. The level of student attention, interest, and engagement relates to the how invested students appear to be in the class activities.


![[PPT]PowerPoint Presentation - MsMercado - homemsmercado.wikispaces.com/file/view/La_biologia_celular.ppt · Web viewTitle PowerPoint Presentation Last modified by NYCDOE Schools](https://img.pdfslide.net/doc/110x75/5b0e3e427f8b9af9688bb010/pptpowerpoint-presentation-msmercado-viewtitle-powerpoint-presentation-last.jpg)