Embed Size (px)
Citation preview

New York City Department of Environmental Protection Water System Safe Yield Calculation - 2011

New York City
Department of Environmental Protection
Water System Safe Yield Calculation - 2011
Authors:
Paul V. Rush, P.E. Deputy Commissioner
Bureau of Water Supply
Thomas Murphy, P.E. Division Chief, Bureau of Water Supply
Water Systems Operations
Robert A. Mayer, P.E. Deputy Chief, Strategic Services
Bureau of Water Supply
Tina Johnstone, P.E. Director, Bureau of Water Supply, Operations
Dana Olivio
Assistant Environmental Engineer Bureau of Water Supply
Strategic Services
Howard J. Woods, Jr., P.E. Howard J. Woods, Jr. & Associates LLC
November 30, 2011

i
TABLE OF CONTENTS
1. Executive Summary .............................................................................................. 1
2. Overview of New York City’s Water Supply Operations ......................................... 3 2.1. Water Supply Operations .......................................................................................................................... 3
2.2. Water Supply Reliability .............................................................................................................................. 5 2.3. Water Quality Reliability ............................................................................................................................. 6 2.4. Environmental Objectives ........................................................................................................................... 7 2.5. Economic Considerations ............................................................................................................................ 8
3. Prior Estimates of System Safe Yield ..................................................................... 9 3.1. The 1954 Decree Calculation ............................................................................................................... 10 3.2. The 1974 Calculation ............................................................................................................................... 10 3.3. The 1993 System Analysis ..................................................................................................................... 10
4. Safe Yield Calculation – 2011 .............................................................................. 11 4.1. Model Background .................................................................................................................................... 11 4.2. Safe Yield Model Run Details ................................................................................................................ 17 4.3. Present Water Demands ........................................................................................................................ 23
Citations ................................................................................................................... 24
Footnotes ................................................................................................................. 25

1
1. Executive Summary This report provides a summary of the computation of the safe yield of the New York City Reservoir System. This analysis has been undertaken by agreement of the Parties to the 1954 Supreme Court Decree (Decree),i the states of New York, New Jersey, Delaware, the Commonwealth of Pennsylvania and the City of New York, for the purpose of reevaluating the Excess Release Quantity as defined in the Decree as specified in the Flexible Flow Management Program (FFMP) that went into effect on June 1, 2008. The calculation of safe yield assumes that severe hydrologic conditions will occur at some point in the future and that these conditions can be approximated by a theoretical repeat of the drought of the 1960’s. Prior computations of safe yield relied on
the hydrologic record of the 1930’s drought, an event less severe than the 1960’s drought. In addition, this new computation of the System safe yield takes advantage of modern computational methods and data processing capabilities not previously available. This allows for an analysis of the conjunctive operations of all components of the System using daily time steps. Prior computations generally used less precise monthly time steps and did not fully assess the aggregate capabilities and limitations of the real-world System. The calculation of safe yield prepared in support of the 1954 Supreme Court Decree estimated the safe yield at 1,665 Million Gallons per Day (MGD). More recent calculations, which took account of the more severe drought of the 1960’s and additional release and operating rule requirements, estimated the safe yield in the range of
1,225 MGD to 1,370 MGD. For the current
calculation of the New
York City water
supply system safe
yield, the Operations
Support Tool (OST)
driven by OASIS
Software was
employed. OASIS is a
software program that
models the operations
of a water resource
system. It simulates the
routing of water
through a system of
nodes and arcs by
solving a linear
Figure 1: Neversink Reservoir

2
program. The routing accounts for both
human control and physical constraints
on the system. The model is able to
incorporate all of NYC’s operating rules
and constraints that apply to its entire
water supply system. It also reflects
water supply priorities and operating
policies imposed on the operation of the
system.
The model is constructed to capture not
only the rules and regulations that the
City must abide by, but also the realistic
way the system is operated on a day-to-
day basis. Operating rules in the model
consist of regulatory release
requirements, reservoir balancing
routines, and operating preference (e.g.
drawdown priority, water quality, etc.).
The City calculates safe yield as the
maximum continuous demand that can
be met by the City water supply system
during a repetition of the drought of
record while maintaining a 25% storage
reserve in the collection reservoirs of the
Catskill and Croton Systems and in
Rondout Reservoir. This is necessary to
maintain potable water quality and to
provide adequate flow and pressure in
the water distribution system. This
reserve requirement has been included in
all prior calculation of safe yield for the
system since the Decree.
In order to determine the NYC reservoir
system safe yield, a series of trial and
error runs were performed for each
scenario by gradually increasing average
total annual demand until a supply
shortage occurred. The runs were
conducted at 10 MGD demand
increments and produced the following
results.
Scenario Estimated
Safe Yield
Present With Pumping 1,140 MGD
Present Without Pumping 1,080 MGD
Future With Pumping 1,310 MGD
Future Without Pumping 1,180 MGD
The four separate model runs determine
the estimated safe yield of the system
under present system conditions and
under anticipated conditions when
certain modifications to the system have
been completed. The present conditions
are analyzed with and without pumping
from the Croton System. The future
conditions are also analyzed with and
without pumping from the Croton
system.
The safe yield estimated for the system under present conditions without pumping is less than the average water demand for the past five years by a margin of 8.4%. With pumping from the Croton system, the safe yield estimate is 1,140 MGD, an amount that is less than the recent average demands by 3.3%. Under future system conditions, treatment will allow the Croton System to be used to a greater extent. Without pumping, the safe yield will match recent water demands and with pumping, the safe yield will exceed recent demands by 11%.

3
2. Overview of New York City’s Water Supply Operations
2.1. Water Supply Operations
The New York City reservoir system is
among the most complex water supply
systems in the world. On average, more
than 1.1 billion gallons (BG) of water
flows each day by gravity from upstate
New York to meet the water supply
needs of more than 9 million residents of
the City and the surrounding
communities. The City must manage the
system in a way that protects water
supply reliability and balances multiple
objectives including water quantity and
quality, as well as environmental, and
economic objectives.
The City’s water supply system,
depicted on Figure 1, is made up of the
Delaware, Catskill, and Croton Systems.
The Delaware System includes four
reservoirs, the Delaware River Basin
Reservoirs; Pepacton, Cannonsville, and
Neversink, from which water is diverted
to the fourth reservoir, Rondout
Reservoir. From Rondout Reservoir,
water is diverted to West Branch and
Kensico Reservoirs via the Delaware
Aqueduct. The Catskill System includes
the Schoharie and Ashokan Reservoirs,
which divert water to Kensico Reservoir.
From Kensico, water is diverted to
Hillview Reservoir and subsequently
conveyed to the City via City Tunnel
Nos. 1, 2, and 3. The City’s Croton
System, which is currently not in service
pending completion of the Croton Water
Treatment Plant, includes 12 reservoirs
and 3 controlled lakes that can deliver
water to the Jerome Park Reservoir in
the Bronx for distribution.
The Delaware River Basin reservoirs
have provided 50% of the water
delivered to meet the City’s needs.ii In
addition, Delaware System water is
historically the highest quality water in
the system and there is often a need to
divert more from the Delaware System.
Conditions like high turbidity events in
Ashokan Reservoir, droughts, or when a
critical piece of infrastructure is offline
for repairs or inspection are examples of
circumstances that require increased
diversion from the Delaware System.
It is in this context that the City manages
the water system to maximize overall
system reliability, maintain high quality
drinking water for those dependent on
the City’s system for their water supply
needs, address environmental concerns,
and meet regulatory and other legal
obligations. While the system is
fundamentally and foremost a drinking
water supply system essential to the City
of New York and surrounding
communities, the assets of the system
are used to support other important
environmental and economic needs.
Bureau of Water Supply’s
Mission Statement
The mission of the Bureau of Water
Supply is to reliably deliver a sufficient
quantity of high quality drinking water
and to ensure the long-term
sustainability of the delivery of this
most valuable resource in order to
promote public health, economic
development, and quality of life of the
City of New York.

4
Figure 2: New York City Water Supply System

5
The following sections describe in more
detail the major objectives for which the
City’s water supply system is operated.
2.2. Water Supply Reliability
The City’s main priority is to meet the
water supply needs of the City and
upstate users. Accordingly, overall
system reliability is the most important
objective. The City consistently operates
the system in a proactive manner to be
prepared for unplanned events that could
impair its ability to deliver high-quality
water. As the highest quality and most
reliable year-round water supply within
the New York City System, the
Delaware reservoirs are critical for
maintaining this overall supply
reliability.
The City is faced with the constant need
to maintain the hydrologic reliability of
the water supply and protect against
potential drought or infrastructure failure
conditions. To this end, operators
endeavor to manage the system so that
reservoirs are full by the beginning of
the drawdown period, on or around June
1st of each year. Operators and
managers then balance reservoir
drawdown, taking account of refill
probability, water quality, reservoir
release requirements and economics. To
do this, operators must forecast the range
of inflow to each reservoir and estimate
the probability of drawing the reservoirs
down to undesirably low levels during
the drawdown period and of refilling the
system by the beginning of the next
drawdown period. Doing this analysis in
a robust fashion is a very difficult task,
particularly in a system as extensive and
complex as New York City’s. The new
system modeling software, known as the
Operations Support Tool (OST), which
is being used by the City while under
further development, is greatly assisting
in this effort.
Theoretical calculations of the “safe
yield” of any water system presume that
all water in the system can be allocated
to some purpose. This would include
diversions for drinking water use,
conservation releases from reservoirs,
and natural losses like evaporation or the
allocation of storage volumes to dead-
storage or operational minimum reserves.
The theoretical calculated value of “safe
yield” is derived by assuming that the
system would be operated to complete
depletion of the operational storage
volume at some critical point during the
design drought. This point would be
followed by a refill period that would
allow full diversions to be maintained
throughout the design drought.
However, in practice, operators should
not and do not operate the system in a
way that would result in emptying all
reservoirs at the worst point in the
drought of record. The limited record of
hydrologic data available demonstrates
that worse conditions than the “drought
of record” can occur. The traditional
value of safe yield for the New York
City System was based on the 1930’s
drought while the calculations described
in this report are based on the more
severe 1960’s drought. Other analyses,
such as tree-ring studies,iii
suggest that
even more severe events than the 1960’s
drought have occurred in the past outside
of the period of recorded hydrologic data.
The consequences of emptying all
reservoirs would be catastrophic, and in
actual operations, there is no assurance
that the historical drought-ending rainfall

6
will come at precisely
the right moment to
“save the day.”
Although there are
various definitions,
the American Water
Works Association
(“AWWA”) defines
safe yield as “[t]he
maximum rate at
which water can be
withdrawn continu-
ously over a long
period of time
including very dry
periods."iv
The City
calculates safe yield
as the maximum continuous demand that
can be met by the City water supply
system during a repetition of the drought
of record while maintaining a 25%
storage reserve in the collection
reservoirs of the Catskill and Croton
Systems and in Rondout Reservoir.
Like numerous other municipalities that
maintain such reserve for various
reasons, the City maintains this reserve
capacity based on the following
rationale:
To have reserve storage should a
period occur that is drier than that
experienced in the past (i.e., a new
drought of record);
To limit water quality impacts
caused by reservoir drawdown;
To allow for the effect of silting,
which most likely has reduced
reservoir storage volume;
To provide adequate hydraulic
head to deliver water at full
aqueduct capacities; and
To provide reservoir storage in the
event a dry period occurs while
spring runoff is frozen.
2.3. Water Quality Reliability The City must maintain a safe, reliable,
high quality water supply for its
consumers. As with water supply
reliability, the system must be ready to
respond to a water quality event when it
occurs. Water quality events include but
are not limited to high turbidity resulting
from storm runoff, elevated levels of
phytoplankton or coliform bacteria, or an
increase in concentrations of disinfection
by-product (DBP) precursors, which are
naturally occurring organic matter
compounds that can react with chlorine
to produce DBPs.
Figure 3: Rainbow Over Shaft 18

7
An integral part of maintaining water
quality reliability includes management
of the reservoir system such that
delivered water quality is maximized. In
the event that contaminants in drinking
water could rise to unacceptable levels,
appropriate physical and/or chemical
treatment must be undertaken.
The City’s comprehensive water quality
monitoring plan (New York City
Department of Environmental Protection,
2009) is designed to ensure compliance
with all federal, state, and local
regulations; protect the water supply for
public health; protect and improve the
watersheds to meet the terms of the
Filtration Avoidance Determination,
described below, (US Environmental
Protection Agency Region 2, 2007);
meet the needs for current and future
predictions of watershed conditions and
reservoir water quality; support
operational decisions and policies; and
provide surveillance to ensure delivery
of the best quality water to consumers.
In 2002, New York City was granted a
five-year Filtration Avoidance
Determination (FAD) by the United
States Environmental Protection Agency
(USEPA) for the Catskill and Delaware
water supply systems (US
Environmental Protection Agency
Region 2, 2002). The FAD waived the
requirements for unfiltered water
systems to provide filtration, as
promulgated by the Surface Water
Treatment Rule, contingent on several
conditions including: construction of a
UV Disinfection Facility to treat the
Catskill and Delaware water supplies;
implementation of a Catskill Turbidity
Control Program (CTCP); and continued
implementation of a broad suite of
watershed protection programs by the
City. The Catskill Turbidity Control
Program was originally proposed by the
City in Section 6.4.9 of New York City’s
2001 Watershed Protection Program
Summary, and updated and refined in
Section 2.3.11 of New York City’s 2006
Long-term Watershed Protection
Program (New York City Department of
Environmental Protection, 2001; New
York City Department of Environmental
Protection, 2006). Catskill turbidity
control remained a priority concern in
the 2007 FAD, which required
implementation of OST for controlling
turbidity export from Schoharie, as
described in the CTCP Phase II
Implementation Plan (US Environmental
Protection Agency Region 2, 2007).
Further, the 2007 FAD required the City
to continue to study turbidity control
options for the Ashokan Reservoir and
implement any selected options.
2.4. Environmental Objectives
In addition to providing a high quality,
reliable supply of drinking water to its
water supply users, the City operates
pursuant to rules that serve to protect
downstream users, fish habitat and
stream ecosystems. Reservoir releases
are made in accordance with the New
York State Environmental Conservation
Law 6 NYCRR Parts 670 and 672 to
maintain flows from Rondout Reservoir
and in the Croton and Catskill Systems.
Minimum releases to tributaries of the
Delaware River are defined by the terms
of the 1954 Supreme Court Decree
(Decree), agreements among the Parties
of the Decree, DRBC dockets, and the
current Flexible Flow Management
Program (FFMP). The release rate
requirements for the tributaries to the
Delaware River outlined by 6 NYCRR

8
671 have been superseded by the various
Decree Parties agreements and DRBC
dockets. The Shandaken Tunnel, which
diverts water from Schoharie Reservoir
to Ashokan Reservoir, is also operated
pursuant to New York State Department
of Environmental Conservation SPDES
Permit NY-0268151 (New York State
Department of Environmental
Conservation, 2006).
2.5. Economic Considerations
Fortunately, conditions that approximate
the design drought and challenge the
safe yield of the system are infrequent.
During normal conditions, the operation
of the reservoir system can be tailored to
address important economic objectives.
These economic objectives include:
Minimizing the cost of operations
and maintenance to customers of
the water system;
Minimizing energy consumption;
Providing assistance in flood
mitigation for downstream users;
and
Maintaining flows to meet various
cold-water fishery and recreational
needs.
Under normal conditions, the water
supply system should be operated in a
manner designed to satisfy the
aforementioned water resource needs.
However, as drought conditions develop,
the operation of the system will shift
toward supply preservation objectives
set to maintain the reliability of the
system. During normal conditions, the
system should not be operated in a
prescriptive manner based on the
theoretical safe yield. The safe yield of
the system is one important planning
measure for reliability during drought
conditions but it is not an operational
formula. Conventional principals of
water supply
management dictate that
when there is other high
quality water available
in normal and wet
periods, the cost to
pump and treat Croton
or Catskill water can
and should be
minimized. This would
also minimize additional
unnecessary envi-
ronmental impacts
associated with
increased energy
use. The Decree also
notes that sources of
water that require
pumping are specifically
excluded from the
City’s calculation of
safe yield for the
Figure 4: Pepacton Reservoir

9
purposes of determining the Excess
Release Quantity.
3. Prior Estimates of System Safe Yield
The traditional technique previously
used to determine the official "Safe
Yield" of the New York City water
supply system employed the "Mass
Curve" method. The details of this
method can be found in many excellent
texts and will not be expounded upon in
this document. Suffice it to say that in
previous studies, this technique was
applied separately to each of the City's
three reservoir subsystems, and to
Rondout reservoir. The sum of these
four yield numbers became the official
NYC water supply system “Safe Yield.”
It should be noted that there are several
disadvantages to the “Mass Curve”
method. Important constraints on
individual reservoirs, both of a physical
and operational nature, are substantially
ignored by simply adding the calculated
values of safe yield determined
individually for each of the reservoirs.
With the advent of additional and more
complex operating constraints (e.g., the
"Good Faith" agreement and NYSDEC’s
reservoir release regulations), the
importance of individual reservoir
operations to meet these added
constraints became even more
paramount in accurately determining the
"Safe Yield".
A second and very important
disadvantage of the "Mass Curve"
method is its disregard of integrated
system operation. In using the "Mass
Curve" method, the distinct elements of
the New York City water supply system
were isolated and their individual safe
yields determined. The result of this
procedure was to determine four "Safe
Yields" based on somewhat different
critical drawdown periods, thereby
foregoing the ability to optimize
subsystem operations. By integrating all
the reservoir elements in a system model,
a higher system "Safe Yield" can be
realized.
This is because, at any given time,
reservoirs in the system with higher
inflows relative to the others in a given
period can assume a larger portion of the
total system demand. The net result of
this type of operation is a flexible
shifting of the demand burden to
different parts of the system over time,
thus extending the system-wide critical
drawdown period, and producing a
greater "Safe Yield" relative to the one
computed by the "Mass Curve"
technique.
While the real-world synergy of
operating the entire reservoir system as a
whole increases the theoretical safe yield
of the system, prior computations of safe
yield relied on monthly rather than daily
time steps. By viewing changes in the
system by monthly time steps, shorter-
term changes to the system are
effectively averaged out of the
computation. The result is a tendency
toward over-estimating the safe yield of
the system.
A third disadvantage of the "Mass
Curve" method is its inability to perform
Delaware River routing and directed
release targeting, which are
accommodated in an integrated system
model. In the "Mass Curve" method,

10
only approximations could be made for
daily target releases.
A fourth disadvantage of the "Mass
Curve" method is its inability to model
non-NYC reservoirs, which have an
effect on NYC reservoir operations. This
is clearly the case in modeling the Lake
Wallenpaupack operations plan which
results in a reduction in NYC directed
releases to the Delaware River. This is a
task that can easily be performed by an
integrated system model.
3.1. The 1954 Decree Calculation
The stated value of safe yield for the
New York City reservoir system was
developed in support of the 1954
Supreme Court Decree. This calculation
relied on a mass curve analysis using
monthly inflow and withdrawal time
steps. The system inflow pattern was
based on what was then known to be the
worst drought of record, the 1930’s
drought. The impact of the
apportionment of water from sources
located in the Delaware Basin was
considered in the computation. A
minimum storage reserve equal to 25%
of the volume of the Croton and Catskill
Reservoir Systems and the Rondout
Reservoir was part of this computation.
In addition, the calculation excluded
pumping from the Croton System. The
resulting safe yield for the system was
estimated to be 1,665 Million Gallons
per Day (MGD).v
3.2. The 1974 Calculation
In response to conditions that actually
occurred in the 1960’s, the New York
City Department of Water Resources
prepared an updated calculation of the
system safe yield in 1974 (the Mekenian
and Rosen calculation).vi
This
computation was also done using a mass
curve analysis that estimated the safe
yield of each independent reservoir
system. As in the case of the 1954
Decree calculation, this analysis also
maintained a 25% reserve in the Catskill,
Croton and Rondout Reservoirs. The
release requirements of the 1954 Decree
were accounted for in the estimate.
Monthly time steps were used in the
computation and the analysis excluded
pumping from the Croton system. The
inflow pattern replicated the actual flow
record complied in the 1960’s drought.
The resulting safe yield for the system
was estimated to be 1,225 (MGD).
3.3. The 1993 System Analysis
In 1993, R. A. Mayer performed an
integrated analysis of all New York City
reservoir system components using a
digital computer model.vii
As in the case
of the prior computations, a monthly
time step was used in this simulation. A
25% reserve volume was maintained in
the Croton, Catskill and Rondout
Reservoirs as in prior computations.
The reservoir system operating rules
were updated to include the goals of the
Good Faith Negotiations and the release
requirements of New York State
Environmental Conservation Regula-
tions, 6 NYCRR Part 670, 671 and 672
were also accounted for in the
computation. However, unlike past
computations, pumping from the Croton
system was factored into the estimate of
safe yield rather than excluded. The
resulting safe yield for the system was
estimated to be 1,370 (MGD).

11
4. Safe Yield Calculation – 2011
4.1. Model Background
For the current calculation of the New
York City water supply system safe
yield, the OASIS component of the
Operations Support Tool (OST), a
forecast-driven simulation and analysis
tool, was employed. OASIS is a
computer program that models the
operations of a water resource system. It
simulates the routing of water through a
system of nodes and arcs by solving a
linear program. The routing accounts for
both human control and physical
constraints on the system. The OASIS
model is able to incorporate operating
rules and constraints that apply to the
entire NYC water supply system and
reflects realistic water supply operations
and priorities.
A critical component of the NYC OASIS
model is a proprietary programming
language named Operations Control
Language (“OCL”). OCL consists of
thousands of lines of code that represent
NYC’s complex water supply operations.
The City operates its reservoir system
pursuant to rules that serve to protect
downstream users, fish habitat and
stream ecosystems. Reservoir releases
are made in accordance with the New
York State Environmental Conservation
Regulations, 6 NYCRR Parts 670 and
672 to maintain flows from Rondout
Reservoir and in the Croton and Catskill
Figure 5: Ashokan Reservoir
12
Systems. Minimum releases to
tributaries of the Delaware River and the
flow target on the Delaware River at
Montague, New Jersey are defined by
the following: the terms of the 1954
Supreme Court Decree, The “Good Faith”
Agreement among the Parties to the
Decree, DRBC reservoir release dockets,
NYSDEC 6 NYCRR Part 671 and the
current OST-based Flexible Flow
Management Program. In addition, the
Shandaken Tunnel, which diverts water
from Schoharie Reservoir to Ashokan
Reservoir, is operated pursuant to New
York State Department of
Environmental Conservation SPDES
Permit NY-0268151. All of these rules
are embedded in the NYC OASIS model
OCL. It is this complex coding that
drives the model.
The City manages the water system to
maximize overall system reliability,
maintain high quality water for those
dependent on the City’s system for their
water supply needs, address
environmental concerns, and meet
regulatory and other legal obligations.
The model captures not only the rules
and regulations that the City must abide
by, but also the realistic way the system
is operated on a day-to-day basis.
Operating rules in the model consists of
the aforementioned regulatory release
requirements, reservoir balancing
routines, and operating preferences (e.g.,
drawdown priority, water quality, etc.).
OASIS expresses system objectives by a
series of linear relationships that
comprise the “objective function.”
OASIS consists of goals and constraints.
While OASIS attempts to meet goals to
the extent possible, it must always meet
constraints. Each goal is assigned a
weight, a relative numerical value to
establish priorities among competing
objectives. Weights determine the
number of points the model receives for
meeting various objectives. OASIS
creates a linear programming problem
(LP) based on all goals and constraints
in the model for each simulation day.
The linear program is solved in such a
way as to maximize the number of
points while complying with all model
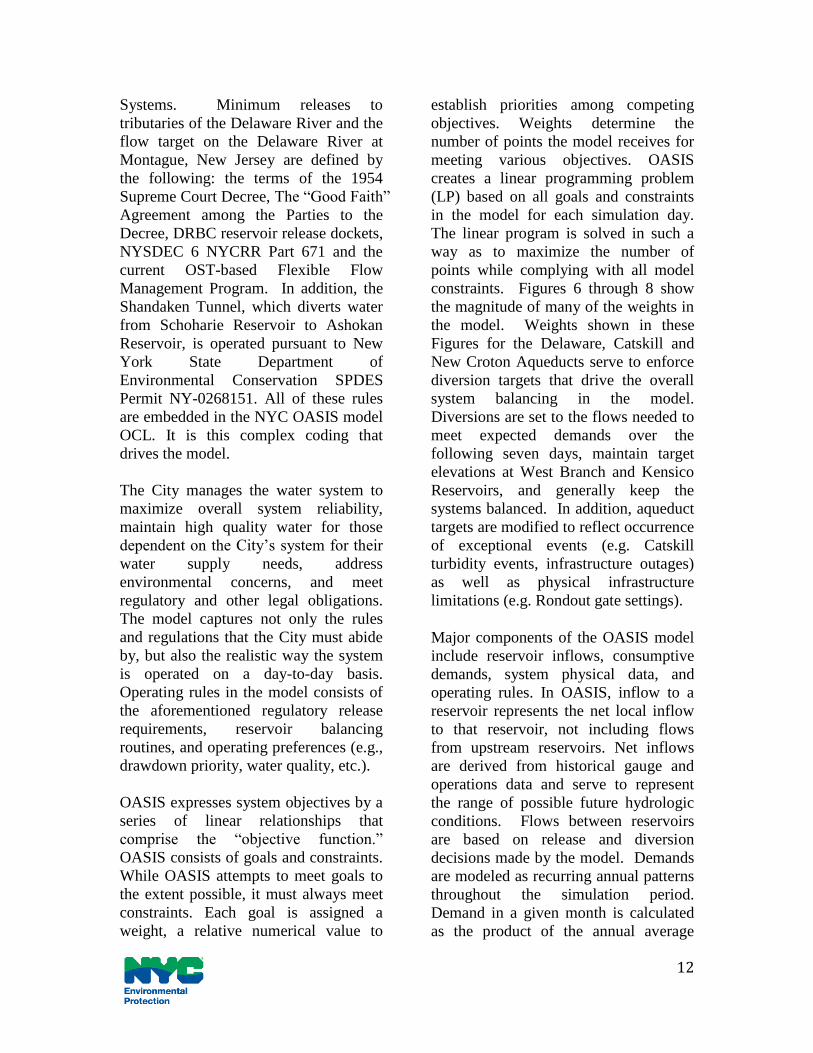
constraints. Figures 6 through 8 show
the magnitude of many of the weights in
the model. Weights shown in these
Figures for the Delaware, Catskill and
New Croton Aqueducts serve to enforce
diversion targets that drive the overall
system balancing in the model.
Diversions are set to the flows needed to
meet expected demands over the
following seven days, maintain target
elevations at West Branch and Kensico
Reservoirs, and generally keep the
systems balanced. In addition, aqueduct
targets are modified to reflect occurrence
of exceptional events (e.g. Catskill
turbidity events, infrastructure outages)
as well as physical infrastructure
limitations (e.g. Rondout gate settings).
Major components of the OASIS model
include reservoir inflows, consumptive
demands, system physical data, and
operating rules. In OASIS, inflow to a
reservoir represents the net local inflow
to that reservoir, not including flows
from upstream reservoirs. Net inflows
are derived from historical gauge and
operations data and serve to represent
the range of possible future hydrologic
conditions. Flows between reservoirs
are based on release and diversion
decisions made by the model. Demands
are modeled as recurring annual patterns
throughout the simulation period.
Demand in a given month is calculated
as the product of the annual average

13
demand level and a monthly peaking
factor. The OASIS model includes data
that represent physical constraints on the
flow and storage of water (e.g., spillway
rating curves, maximum capacities of
aqueducts and release works, elevations
of structures, reservoir storage-elevation
curves).
Balancing the system is another key
factor in the model. Catskill, Delaware,
and Croton diversions are balanced
based on storage levels and season.
Adjustments to this balance are made in
case more or less water is needed to
meet demands or to keep West Branch
and Kensico Reservoirs at specific
elevations. Individual reservoirs within
each system are balanced such that
drawdown occurs roughly
simultaneously within a sub-system.
These sub-system balancing rules are
associated with the lowest weighs in the
model such that all other operating rules
will over-ride the sub-system balancing
The model will choose to make the
required reservoir releases before
attempting to bring the system into
balance.
The first step for overall system
balancing is to determine the total
diversion needed to meet demands over
the next 7 days and maintain Kensico
and West Branch Reservoir target
elevations. Next, the system operations
mode is determined, based on user
inputs, current usable storage, and
probability of refill on or around June 1st.
A flow chart showing the balancing
routine is presented in Figure 9.
Figure 6: Simplified System Link Diagram

14
The current model includes a daily
inflow database that includes data from
1927 through 2010. It should be noted
that the OASIS model can inform
reservoir system operators about the
impacts of different operating rules or
scenarios, but does not optimize
operating rules or scenarios for the user.
In order to determine the NYC reservoir
system safe yield, a series of trial and
error runs were performed gradually
increasing average total annual demand
until a shortage occurred.
Figure 7: Delaware Subsystem
15
Figure 8: Croton Subsystem

16
Fig
ure
9: S
yst
em B
alan
cin
g R
ou
tin
e
17
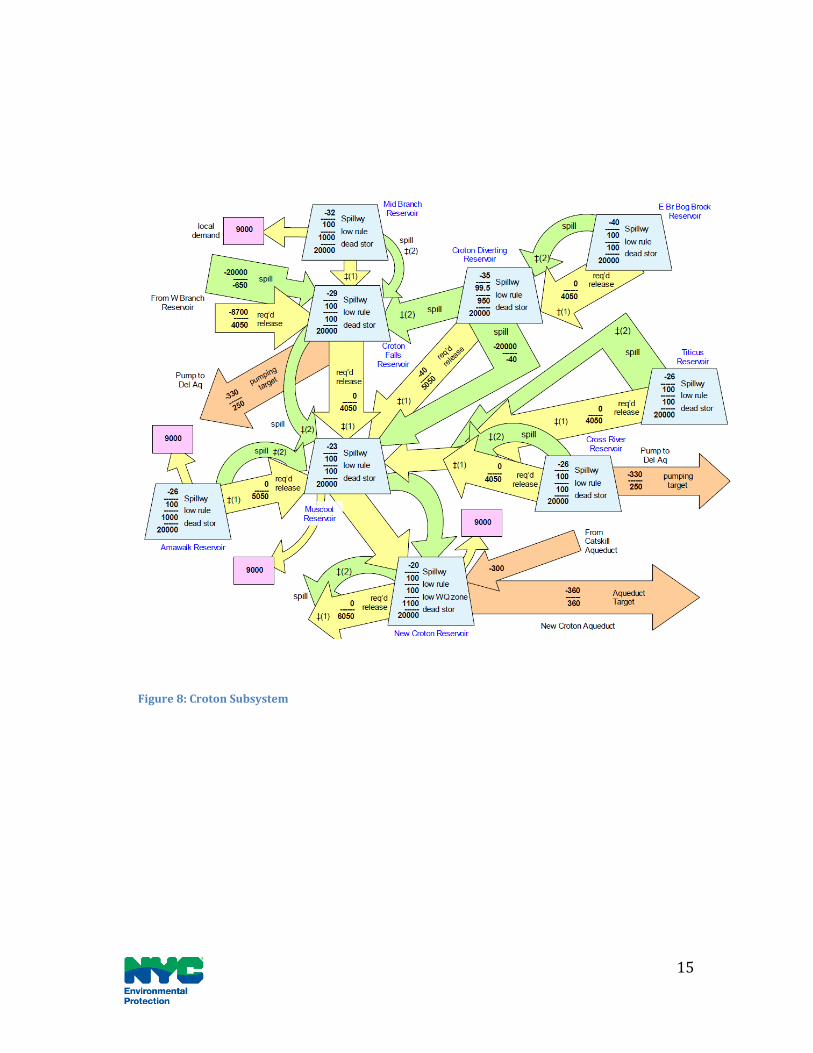
4.2. Safe Yield Model Run Details
The OST simulation mode was used for
the safe yield model runs. The
simulation mode is designed for the
purpose of long-term planning and
consists of a single extended simulation
period over which operating rules are
applied consistently. In this case, the
1960’s drought of record was simulated,
beginning on June 1, 1960 and ending on
June 1, 1967. This driest period of
record was used to determine the safe
yield, which is the maximum annual
average demand that could be met by the
system.
Twenty-five percent of the gross
reservoir storage was held in reserve for
the Catskill and Croton reservoir
systems and Rondout Reservoir,
consistent with past safe yield
calculations. In addition, minimum
operating level requirements were
specified for Kensico Reservoir (351.5
ft) and West Branch Reservoir (478 ft).
These reservoirs are the terminal supply
reservoirs for the system. Water surface
elevations must be maintained at or
above these levels to provide adequate
flow and pressure within the City’s
water distribution network and to allow
adjacent communities to draft water
from the system (e.g., from Kensico
Reservoir). In addition, these elevations
also allow the City to maintain an
operational storage reserve in the event
that actual drought conditions are worse
than the historic drought of record.
While beyond the scope of this report,
experience has also demonstrated the
need to maintain these reservoir levels to
ensure that safe drinking water
objectives can be met.viii
For this study, four
scenarios were selected.
The operating rules (e.g.,
regulatory release
requirements, reservoir
balancing routines, and
operating preference) for
all scenarios are the
same. The scenarios
differed in terms of the
planning horizon (i.e.,
present or future) and
whether or not pumping
was allowed from the
Croton System. The four
separate model runs
determine the estimated
safe yield of the system under present
system conditions and under anticipated
conditions when certain modifications of
the system have been completed. The
present conditions are analyzed with and
without pumping from the Croton
System. The future conditions are also
analyzed with and without pumping
from the Croton system. A detailed
summary of each model condition
follows.
Figure 10: New Croton Spillway

18
Scenario 1 “SY_PR_SF_P” Safe Yield Run 1 Present operating conditions Croton pumping Model Assumptions for Scenario 1
Catskill Aqueduct maximum capacity (Ashokan to Kensico): 595 MGD
Catskill Aqueduct minimum capacity (Ashokan to Kensico): 275 MGD
New Croton Aqueduct Capacity (with pumping): 42 MGD
Croton Falls hydraulic pumping: 30 MGD
Cross River electrical pumping: 60 MGD
Rondout – West Branch Tunnel (RWBT) maximum capacity (Delaware Aqueduct): 850 MGD
RWBT Leak: Function of the tunnel flow ranging from 20-35 MGD
NYC Delaware Basin diversions: FFMP 6/1/2011
Shandaken Tunnel: Part 671 regulations and SPDES permit
Croton System Reservoirs & Rondout Reservoir: Part 672 regulations
Ashokan Reservoir Community releases: Implemented
Ashokan Waste Channel: On Kensico minimum operating
level: 351.5 ft West Branch minimum
operating level: 478 ft (due to 25% storage reserve)
Water supply demand: Outside community demand implicit in total water supply demand
Demand: Seasonal monthly demand factors applied (Figure 11)
Under present conditions, the losses in
the Rondout-West Branch Tunnel vary
with flow through the tunnel. For tunnel
flow rates less than 800 MGD, these
losses are estimated at 20 MGD. For
tunnel flow rates in excess of 800 MGD,
the losses are estimated at 35 MGD.
Figure 11: Seasonal Demand Factors

19
Scenario 2 “SY_PR_SF_NP” Safe Yield Run 2 Present operating conditions No Croton pumping Model Assumptions for Scenario 2
Catskill Aqueduct maximum capacity (Ashokan to Kensico): 595 MGD
Catskill Aqueduct minimum capacity (Ashokan to Kensico): 275 MGD
New Croton Aqueduct Capacity (with pumping): 0 MGD
Croton Falls hydraulic pumping: 0 MGD
Cross River electrical pumping: 0 MGD
Rondout – West Branch Tunnel maximum capacity (Delaware Aqueduct): 850 MGD
RWBT Leak: Function of the tunnel flow ranging from 20-35 MGD
NYC Delaware Basin diversions: FFMP 6/1/2011
Shandaken Tunnel: Part 671 regulations and SPDES permit
Croton System Reservoirs & Rondout Reservoir: Part 672 regulations
Ashokan Reservoir Community releases: Implemented
Ashokan Waste Channel: On Kensico minimum operating
level: 351.5 ft West Branch minimum
operating level: 478 ft (due to 25% storage reserve)
Water supply demand: Outside community demand implicit in total water supply demand
Demand: Seasonal monthly demand factors applied
Under future model conditions, the leak
in the Rondout-West Branch Tunnel has
been eliminated. In addition, the
Catskill Aqueduct capacity has been
increased from 595 MGD to 600 MGD.
Finally, treatment for the Croton system
is in place allowing this system to be
considered in the future “with pumping”
scenario. The 25% storage reserve is
maintained for the Croton, Catskill and
Rondout Reservoirs as in all prior
calculations.
Scenario 3 “SY_F_SF_P” Safe Yield Run 3 Future operating conditions Croton pumping Model Assumptions for Scenario 3
Catskill Aqueduct maximum capacity (Ashokan to Kensico): 600 MGD
Catskill Aqueduct minimum capacity (Ashokan to Kensico): 275 MGD
New Croton Aqueduct Capacity (with pumping): 290 MGD
Croton Falls hydraulic pumping: 180 MGD
Cross River electrical pumping: 60 MGD
Rondout – West Branch Tunnel maximum capacity (Delaware Aqueduct): 850 MGD
RWBT Leak: No leak NYC Delaware Basin
diversions: FFMP 6/1/2011 Shandaken Tunnel: Part 671
regulations and SPDES permit Croton System Reservoirs &
Rondout Reservoir: Part 672 regulations
20
Ashokan Reservoir Community releases: Implemented
Ashokan Waste Channel: On Kensico minimum operating
level: 351.5 ft West Branch minimum
operating level: 478 ft (due to 25% storage reserve)
Water supply demand: Outside community demand implicit in total water supply demand
Demand: Seasonal monthly demand factors applied
Scenario 4 ”SY_F_SF_NP” Safe Yield Run 4 Future operating conditions No Croton pumping Model Assumptions for Scenario 4
Catskill Aqueduct maximum capacity (Ashokan to Kensico): 600 MGD
Catskill Aqueduct minimum capacity (Ashokan to Kensico): 275 MGD
New Croton Aqueduct Capacity (no pumpingix): 70 MGD
Croton Falls hydraulic pumping: 0 MGD
Cross River electrical pumping: 0 MGD
Rondout – West Branch Tunnel maximum capacity (Delaware Aqueduct): 850 MGD
RWBT Leak: No leak NYC Delaware Basin
diversions: FFMP 6/1/2011 Shandaken Tunnel: Part 671
regulations and SPDES permit Croton System Reservoirs &
Rondout Reservoir: Part 672 regulations
Ashokan Reservoir Community releases: Implemented
Ashokan Waste Channel: On Kensico minimum operating
level: 351.5 ft West Branch minimum
operating level: 478 ft (due to 25% storage reserve)
Water supply demand: Outside community demand implicit in total water supply demand
Demand: Seasonal monthly demand factors applied
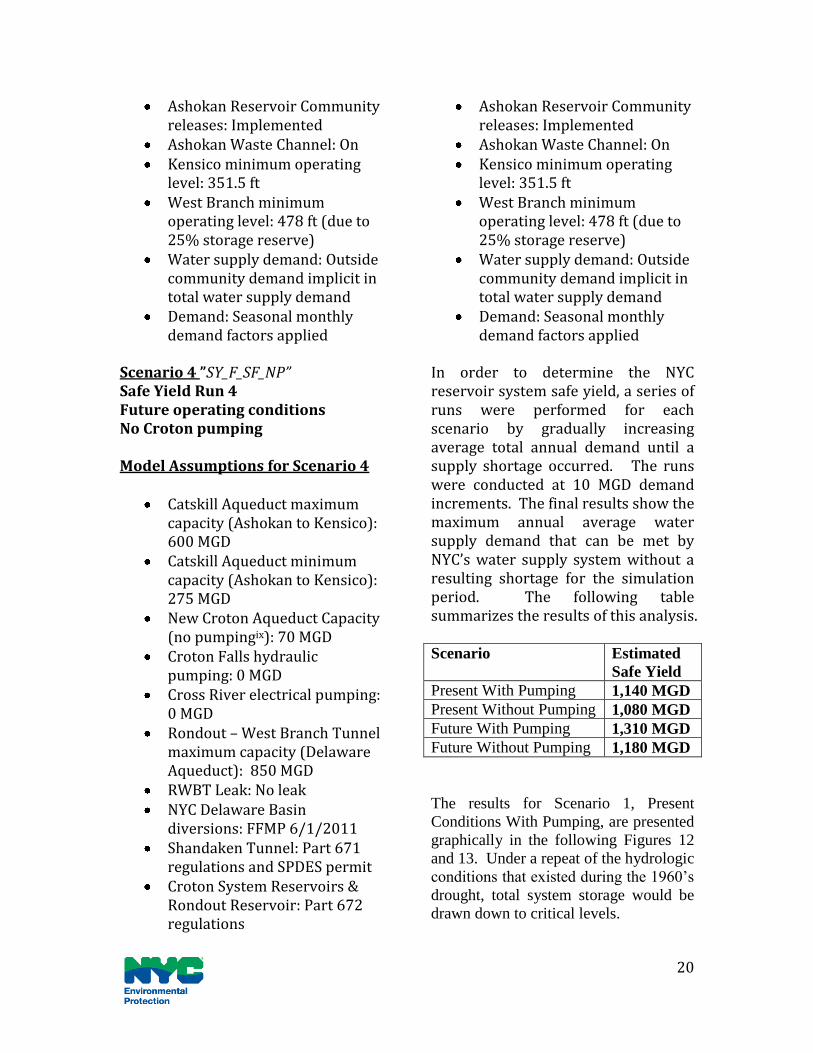
In order to determine the NYC reservoir system safe yield, a series of runs were performed for each scenario by gradually increasing average total annual demand until a supply shortage occurred. The runs were conducted at 10 MGD demand increments. The final results show the maximum annual average water supply demand that can be met by NYC’s water supply system without a resulting shortage for the simulation period. The following table summarizes the results of this analysis. Scenario Estimated
Safe Yield
Present With Pumping 1,140 MGD
Present Without Pumping 1,080 MGD
Future With Pumping 1,310 MGD
Future Without Pumping 1,180 MGD
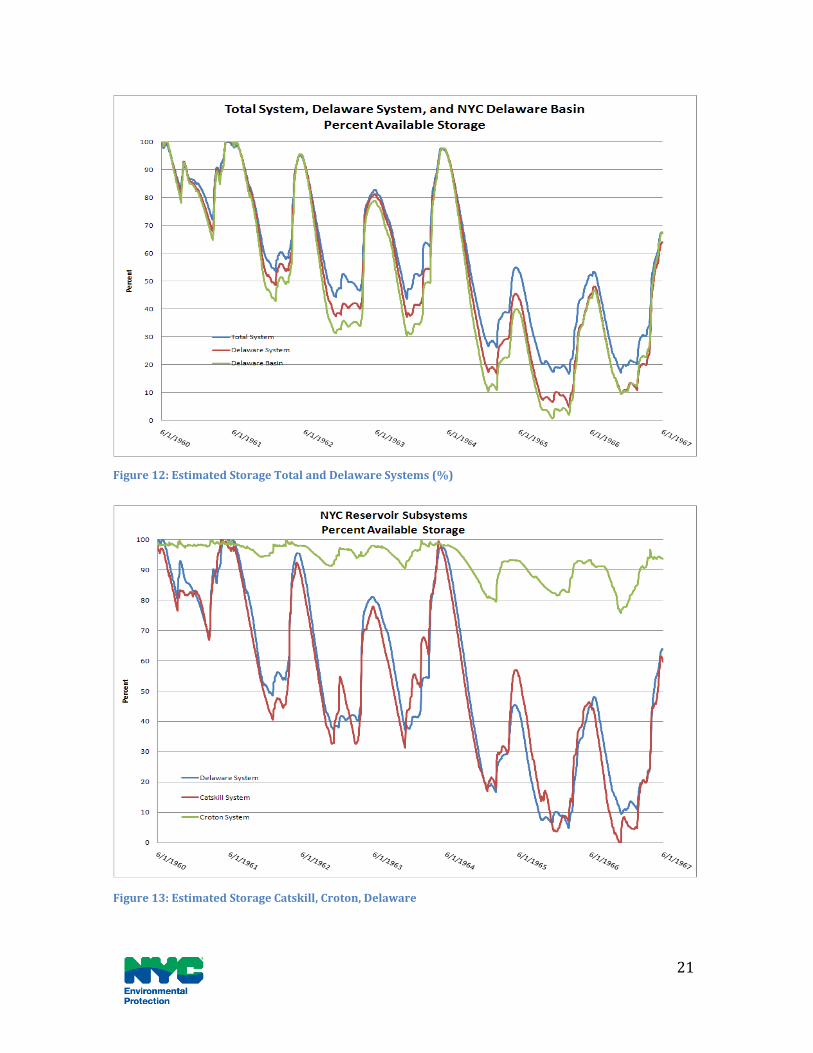
The results for Scenario 1, Present
Conditions With Pumping, are presented
graphically in the following Figures 12
and 13. Under a repeat of the hydrologic
conditions that existed during the 1960’s
drought, total system storage would be
drawn down to critical levels.
21
Figure 12: Estimated Storage Total and Delaware Systems (%)
Figure 13: Estimated Storage Catskill, Croton, Delaware

22
In this calculation, the Delaware Basin
reservoirs would be emptied while some
storage is maintained in the Rondout
Reservoir. Total system storage declines
to levels below 20%, reflecting the
combined Catskill, Croton, Rondout
reserve, which is a minimum level of
25% for these reservoirs.
Present conditions represent a severe
case because of the lack of availability
of the full capacity of the Croton System.
At present, although it is permissible to
utilize the Croton supply, infrastructure
improvements underway to support the
construction of the Croton Water
Filtration Plant limit the ability to place
Croton water into the distribution system.
Even with pumping, the amount of water
available for use under drought
conditions is limited and the Croton
system remains relatively full in this
scenario. Water quality constraints
effectively shift the reserve amount to a
portion of the system that may not be
completely available due to ongoing
construction. A comparison of present
and future storage volume in the Croton
System is shown in Figure 14.
Figure 14: Croton System Storage

23
4.3. Present Water Demands
The calculation of the safe yield of the
system under a design drought condition
provides a useful benchmark. If
hydrologic conditions similar to the
design drought occur again, the
comparison of safe yield to current water
demands demonstrates the need for
demand management in earlier drought
stages. Over the years, the City has
aggressively pursued water conservation
initiatives and this has resulted in a
measureable and meaningful decline in
water consumption.
In the last ten years, the amount of water
delivered to water users has declined
from nearly 1,365 MGD to roughly
1,159 MGD – a decline of 15%. For the past five years, water demands have average 1,179 MGD. This is significantly lower than the peak system demands recorded in 1979 when the average daily demand for in-
City uses was 1,512 MGD. The decline in water use has occurred even while the population of the system has grown dramatically. In 1980, the population of New York City was
7,071,639,x and this has grown by 15.6%
to 8,175,133 in 2010.xi
Aggressive
mandatory conservation measures,
including the advent of the leak and
waste detection program in 1981,
the universal metering program
(implemented in 1988), and the general
impact of the U.S. Energy Policy Act of
1992, which resulted in the manufacture
of more water efficient home appliances,
have all worked to reduce water
consumption. The safe yield estimated for the system under present condi-tions without pumping is less than the average demand for the past five years by a margin of 8.4%. With pumping from the Croton system, the safe yield estimate is 1,140 MGD, an amount that is less than the recent average
demands by 3.3%. Under future system conditions, treatment will allow the Croton System to be used to a greater extent. Without pumping, the safe yield will match recent demands and with pumping, the safe yield will exceed recent demands by 11%.
Figure 15: Cannonsville Reservoir - November 2001

24
Citations New York City Department of
Environmental Protection. (2009). 2009
Watershed Water Quality Monitoring
Plan.
New York City Department of
Environmental Protection. (2006). Long-
term Watershed Protection Program.
New York City Department of
Environmental Protection. (2001).
Watershed Protection Program
Summary.
New York City Department of
Environmental Protection. (2009). The
Impact of Drawdown on Water Quality
in Catskill and Delaware Reservoirs.
New York State Department of
Environmental Conservation. (2006).
State Pollutant Discharge Elimination
System (SPDES) Discharge Permit for
the Shandaken Tunnel Outlet.
US Environmental Protection Agency
Region 2. (2002). New York City
Filtration Avoidance Determination.
http://www.epa.gov/r02earth/water/nycs
hed/.
US Environmental Protection Agency
Region 2. (2007). New York City
Filtration Avoidance Determination.
http://www.epa.gov/r02earth/water/nycs
hed/.

25
Footnotes i Agreement of the Parties to the 1954 U.S. Supreme Court Decree, December 10, 2008; Section 15, Reassessment Study, p. 19. ii More recently, the Delaware System, which includes Rondout Reservoir, has been used
to meet 60-70% of the City demand.
iii Tree-Ring Analysis as a Predictor of Pre-1927 Reservoir Inflows; Department of Environmental Engineering; Manhattan College; New York; April 2004. iv See AWWA’s “Principles and Practices of Water Supply Operations: Water Sources” (2003). v 347 U.S. at 998, Amended Decree, Paragraph III(B)(1)(c); June 7, 1954. vi Dependable Supply of New York City’s Water Supply Sources Based on 1961-1967 Drought; Mekenian, George, P.E. and Rosen, Herman, P.E.; City of New York Department of Water Resources; February, 1974. vii Safe Yield Study of the New York City Reservoir System; Mayer, Robert A., P.E.; City of New York Department of Environmental Protection; December 29, 1993. viii Studies within the NYC Watershed include: Effler & Bader, 1998, Effler, et al., 1998, Effler & Matthews, 2004, and Marzec, et.al., 2009. A major drawdown at Cannonsville in 1995 demonstrated the impacts that drawdown can have including: 1) Increased TP and decreased Secchi depth due to sediment re-suspension; and 2) enhanced phytoplankton growth.
ix The 70 MGD contribution from the Croton System represents water that can be taken into the distribution system from the Croton System under this scenario without treatment. This water would be available only in emergency conditions and with the prior approval of the New York Department of Health, which may not be granted. In order for this water to be treated, some low level pumping through the treatment plant is required. x 1980 Census of Population, Volume 1, Chapter B, Part 34; General Population Characteristics, Table 16; U.S. Department of Commerce; Washington D.C.; August 1982; p. 34-56. xi U.S. Bureau of Census; State & County Quickfacts; New York (city), New York; http://quickfacts.census.gov/qfd/states/36/3651000.html