Embed Size (px)
Citation preview

© 2013 International Monetary Fund WP/13/7
IMF Working Paper
Asia and Pacific Department
New Zealand Banks’ Vulnerabilities and Capital Adequacy
Prepared by Byung Kyoon Jang and Masahiko Kataoka1
Authorized for distribution by Brian Aitken
January 2013
Abstract
The paper finds that, given New Zealand’s conservative approach in implementing the Basel II framework, New Zealand banks’ headline capital ratios underestimate their capital strength. A comparison with Canadian, UK and Australian banks highlights the impact of New Zealand’s more conservative approach. Stress tests in the paper show that four large New Zealand banks could withstand sizable stand-alone shocks to their exposure to either residential mortgages (calibrated on the Irish crisis experience) or corporate lending. However, combined shocks to both residential mortgages and corporate lending would put more pressure on the banks’ capital. Given high bank concentration and large offshore wholesale funding needs, the merits of higher minimum capital requirements for systemically important domestic banks could be considered, together with other measures to be implemented. JEL Classification Numbers: G20, G21, G28
Keywords: Basel II, capital, loss given default, probability of default, stress tests
Author’s E-Mail Address: [email protected], [email protected]
1 We would like to thank David Hargreaves, Ian Harrison, Chris Mathew, Michael Reddell, Andy Wood, and seminar participants at the Reserve Bank of New Zealand and the New Zealand Treasury for their helpful comments and suggestions. Sung Eun Jung and Uche Eze provided excellent assistance.
This Working Paper should not be reported as representing the views of the IMF. The views expressed in this Working Paper are those of the authors and do not necessarily represent those of the IMF or IMF policy. Working Papers describe research in progress by the author(s) and are published to elicit comments and to further debate.

2
Contents Page I. Introduction and Overview .............................................................................................. 4 II. Key Features of the New Zealand Banking Sector .......................................................... 4 III. Basel II Implementation and Capital Ratios .................................................................... 9 IV. How Vulnerable are New Zealand Banks to Shocks to Residential Mortgages and Corporate Lending? ....................................................................................................... 13
A. Shocks to Residential Mortgages ............................................................................. 13 B. Shocks to Corporate Lending ................................................................................... 16 C. Combined Shocks .................................................................................................... 19
Figures 1. International Comparison of Key Soundness Financial Indicators .................................. 5 2. Bank Market Share in New Zealand ................................................................................ 6 3. New Zealand’s Four Largest Banks: Tier 1 Capital Ratio and Risk Weight ................... 6 4. New Zealand’s Four Largest Banks: EAD and Tier 1 Capital ........................................ 6 5. Banking Sector Assets for Selected Countries ................................................................. 7 6. Assets of Four Major Banks for Selected Countries ........................................................ 7 7. Bank Asset Composition .................................................................................................. 7 8. Household Debt ................................................................................................................ 7 9. Central Bank Balance Sheet Sizes ................................................................................... 8 10. Government Guaranteed Debt ......................................................................................... 8 11. Total Short-Term External Debt ...................................................................................... 8 12. Loans to Customer Deposits ............................................................................................ 8 13. Tier 1 Regulatory Capital Ratio ....................................................................................... 9 14. Total Regulatory Capital Ratio ........................................................................................ 9 15. Tangible Common Equity to Risk Weighted Assets...................................................... 10 16. Tangible Common Equity to Tangible Assets ............................................................... 10 17. Nonperforming Housing Loans ..................................................................................... 10 18. Loss Given Default on Residential Mortgages .............................................................. 11 19. Probability of Default on Residential Mortgages........................................................... 12 20. PD Range and Composition of Residential Mortgages .................................................. 12 21. Average Risk Weights for Residential Mortgages ......................................................... 12 22. Real Estate Prices in Ireland and New Zealand ............................................................. 14 23. Capital Ratio Change ..................................................................................................... 15 24. Agricultural Debt to Agricultural Export Earnings ........................................................ 17 25. Property Prices ............................................................................................................... 17 26. Export Commodity Price Index ..................................................................................... 17 27. Sectoral Nonperforming Loans ...................................................................................... 17 28. Capital Ratio Change ..................................................................................................... 18 29. Real Estate Prices in Recent Crises ................................................................................ 19 30. Core and Retail Funding Ratios ..................................................................................... 20

3
Tables 1. New Zealand’s Four Largest Banks: Selected Financial Soundness Indicators .............. 6 2. Risk Weights for Banks’ Internal Models Under the Basel II Capital Framework ......... 9 3. New Zealand’s Four Largest Banks: LGD for Residential Mortgages and Impact on Capital Adequacy Ratios ......................................................................... 11 4. New Zealand’s Four Largest Banks: Risk Weight for Residential Mortgages and Impact on Capital Adequacy Ratios ......................................................................... 13 5. ANZ: Credit Risk Exposure ........................................................................................... 13 6. Ireland: Four Large Banks’ Residential Mortgages ....................................................... 15 7. New Zealand’s Four Largest Banks: Impact on Capital of Shocks to Residential Mortgages ................................................................................................................. 16 8. Credit Exposures by Portfolio Type ............................................................................... 17 9. New Zealand’s Four Largest Banks: Impact on Capital of Shocks to Corporate Lending .................................................................................................................... 18 10. New Zealand’s Four Largest Banks: Impact of Combined Shocks on Capital.............. 19 11. Banking System Stress Tests’ Assumptions .................................................................. 20 References ............................................................................................................................... 21

4
I. INTRODUCTION AND OVERVIEW
1. The soundness of the New Zealand banking sector was crucial to the resilience of the economy during the global financial crisis. The banking sector is dominated by four large subsidiaries of Australian banks that have proved resilient to the recent turbulence in the global financial markets. Their combined assets are close to 90 percent of total banking sector assets and about 160 percent of GDP. Bank profits are strong and nonperforming loans are less than 2 percent of total loans, low by advanced country standards. Sound regulation and supervision helped maintain stability.
2. Banks’ large exposure to highly indebted households and the agriculture sector and sizeable short-term offshore borrowing are key vulnerabilities. House prices appear overvalued and a sharp decline would create strains. Household debt is high at over 140 percent of disposable income but banks’ exposure to high risk mortgages is low. A large fall in commodity prices could also impair the quality of agricultural loans substantially. Short-term external debt remains sizable, but New Zealand banks have made steady progress in lengthening the maturity profile of their wholesale funding since 2008 and increasing the share of retail deposits.
3. The paper finds that the four large New Zealand banks have capital well above the regulatory requirements with high quality capital. Their headline capital ratios are below the global average for large banks in a sample of advanced and emerging market economies, but New Zealand’s conservative approach in implementing the Basel II framework implies that New Zealand banks’ headline capital ratios underestimate their capital strength. A comparison with Canadian, UK and Australian banks highlights the impact of New Zealand’s more conservative approach.
4. Stress tests in the paper show that the four large New Zealand banks are largely able to withstand sizable stand-alone shocks to their exposure to either residential mortgages (calibrated on the Irish crisis experience) or corporate lending. The risks are highly linked, however, and sizable combined shocks to both mortgages and corporate lending would have more pressure on the banks’ capital. Banking sector vulnerability should be assessed on an ongoing basis to minimize the risk that systemically important banks pose to the economy. Options to strengthen prudential norms if needed could include higher minimum capital requirements for systemically important domestic banks to provide higher loss absorbency, taking into account the currently evolving international standards and other measures to be implemented in New Zealand. Higher capital buffers at systemically important domestic banks in New Zealand would be beneficial, particularly in times of market uncertainty and given high bank concentration and their large offshore wholesale funding needs.
II. KEY FEATURES OF THE NEW ZEALAND BANKING SECTOR
5. New Zealand banks have continued to build their capital buffers. Capital adequacy has improved since 2007, with the total capital ratio reaching about 13 percent in 2012, which is below the average of 30 advanced countries’ capital ratios (Figure 1). Bank profits are strong and nonperforming loans have fallen to less than 2 percent of total loans, low by advanced country standards.

5
1011121314151617181920
1011121314151617181920
2007 2008 2009 2010 2011 2012
Singapore Switzerland United Kingdom
United States 1/ Average 2/
Bank Regulatory Capital to Risk-Weighted Assets(In percent)
1/Basel I2/Average for Advanced Economies.
-15
-5
5
15
25
35
45
-15
-5
5
15
25
35
45
2007 2008 2009 2010 2011 2012
Australia 1/ Canada Hong Kong SAR
New Zealand Average 2/
Bank Return on Equity(In percent)
1/Accumulated income of the last 12 months.2/Average for Advanced Economies.
-15
-5
5
15
25
35
45
-15
-5
5
15
25
35
45
2007 2008 2009 2010 2011 2012
Singapore Switzerland 1/ United Kingdom 2/
United States Average 3/
Bank Return on Equity(In percent)
1/Gross profits.2/After extraordinary items and taxes.3/Average for Advanced Economies.
0
1
2
3
4
5
6
7
0
1
2
3
4
5
6
7
2007 2008 2009 2010 2011 2012
Australia 1/ Canada Hong Kong SAR 2/
New Zealand Average 3/
Bank Nonperforming Loans to Total Loans(In percent)
1/Includes both impaired and past due items.2/Loans classified as substandard, doubtful, and loss; not necessarily linked to a 90-day criterion.
0
1
2
3
4
5
6
7
0
1
2
3
4
5
6
7
2007 2008 2009 2010 2011 2012
Singapore 1/ Switzerland United Kingdom
United States Average 2/
Bank Nonperforming Loans to Total Loans(In percent)
1/Non-bank nonperforming loans to total non-bank loans. Other characteristics may be considered beyond the 90-day past-due criterion to classify a loan as nonperforming.2/Average for Advanced Economies.
Figure 1 International Comparison of Key Soundness Financial Indicators
Source: IMF: Global Financial Stability Report.
1011121314151617181920
1011121314151617181920
2007 2008 2009 2010 2011 2012
Australia Canada Hong Kong SAR
New Zealand Average 1/
Bank Regulatory Capital to Risk-Weighted Assets(In percent)
1/Average for 30 Advanced Economies.

6
6. The banking sector is dominated by four large subsidiaries of Australian banks that have proved resilient to the recent turbulence in the global financial markets. The assets of the four large banks are close to 90 percent of total banking sector assets (Figure 2) and the four banks account for about 95 percent of the residential mortgage market. All the four banks are profitable and capital adequacy has improved since 2007, mainly driven by increases in capital with subdued growth in risk-weighted assets (Figures 3 and 4). The quality of capital is high, as it is mainly common equity. The four large banks’ key financial soundness indicators are summarized in Table 1, which shows some of their strength.
Sep-12 Sep-11 Sep-10 Jun-12 Sep-11 Sep-10 Jun-12 Jun-11 Jun-10 Sep-12 Sep-11 Sep-10
ProfitabilityReturn on assets 1.1 0.9 0.7 1.0 0.9 0.9 1.1 0.9 0.4 0.9 0.7 0.5Return on equity 12.2 10.3 8.1 14.7 16.1 15.5 16.8 15.2 7.0 11.9 10.1 7.3Net interest margin 2.6 2.6 2.4 2.0 1.9 1.8 2.1 1.9 1.6 2.3 2.3 2.1
Capital adequacyTier one capital ratio (Basel II) 10.8 10.0 9.7 10.4 9.0 8.9 11.7 11.2 10.9 10.8 10.5 9.9Total capital ratio (Basel II) 12.5 12.7 13.1 12.7 11.8 11.8 12.6 12.8 13.2 12.5 13.0 12.7TCE/Total Assets 1/ 5.7 5.7 6.0 2.5 2.0 2.1 3.5 3.6 3.5 5.0 5.7 6.3TCE/Tangible Assets 2/ 5.9 5.9 6.1 2.5 2.0 2.1 3.5 3.6 3.5 5.3 5.8 6.4
Assets quality and provisioning Past due 90 days plus/total loans 0.2 0.3 0.3 0.4 0.4 0.4 0.4 0.6 0.7 0.3 0.5 0.5
Gross impaired to total assets 1.1 1.4 1.7 0.7 0.9 1.1 0.4 0.5 0.5 1.3 1.3 1.3Net impaired assets to equity 8.6 11.6 13.7 5.8 9.9 13.2 4.2 6.7 7.5 10.2 12.7 10.9Specific provision to gross impaired assets 32.9 28.6 30.2 39.4 34.4 31.3 30.7 22.8 18.4 31.8 28.2 40.6Total provision to gross impaired assets 77.2 67.0 69.8 99.8 76.8 66.7 86.5 70.2 80.1 73.8 75.4 102.2
LiquidityCash to total assets 2.3 2.0 1.9 2.0 2.7 2.9 1.6 2.0 1.8 2.3 2.0 0.9Cash and due from banks to total assets 3.7 5.8 4.9 3.7 4.8 4.7 1.9 2.0 1.8 2.8 3.2 1.0
Sources: Banks' disclosure statements; and Fund staff calculations.1/ TCE = tangible common equity = total equity minus intangible assets (incl. goodwill).2/ Tangible assets = total assets minus intangible assets (incl. goodwill).3/ 2012 data are as of end June. Income statement data are annualised.
Table 1. New Zealand's Four Largest Banks: Selected Financial Soundness Indicators(In percent)
ANZ BNZ 3/ ASB Westpac
0
5
10
15
20
25
30
35
0
5
10
15
20
25
30
35
ANZ National ASB BNZ Westpac Others
June 2009
June 2012
Figure 2. Bank Market Share in New Zealand(In percent of total bank assets)
Source: RBNZ: Financial Stability Report.
35
37
39
41
43
45
47
49
51
53
55
6
7
8
9
10
11
12
Sep-08 Mar-09 Sep-09 Mar-10 Sep-10 Mar-11 Sep-11
Tier 1 Capital Ratio (LHS) Risk Weight (RHS)
Figure 3. New Zealand's Four Largest Banks:Tier 1 Capital Ratio and Risk Weight
(In percent)
Sources: Banks' disclosure statements; and IMF staff calculations.
0
50,000
100,000
150,000
200,000
250,000
300,000
350,000
400,000
0
3,000
6,000
9,000
12,000
15,000
18,000
21,000
Sep-08 Mar-09 Sep-09 Mar-10 Sep-10 Mar-11 Sep-11
Tier 1 Capital (LHS) Ordinary Share Capital (LHS)
Retained Earnings (LHS) Exposure at Default (RHS)
Figure 4. New Zealand's Four Largest Banks:EAD and Tier 1 Capital
(In millions of New Zealand dollars)
Sources: Banks' disclosure statements; and IMF staff calculations.
7
0
20
40
60
80
100
120
140
0
20
40
60
80
100
120
140
SGP
SWI
ESPBELN
ZLCA
NN
LDSW
EU
KA
US
FRABRARU
SCH
NM
EXJPND
EUITLKO
RTU
RH
KIRLU
SA
UT
IND
2011 2010
Figure 6. Assets of Four Major Banks for Selected Countries(In percent of these banks' home country banking sector assets)
Sources: Bankscope; and IMF staff calculations.
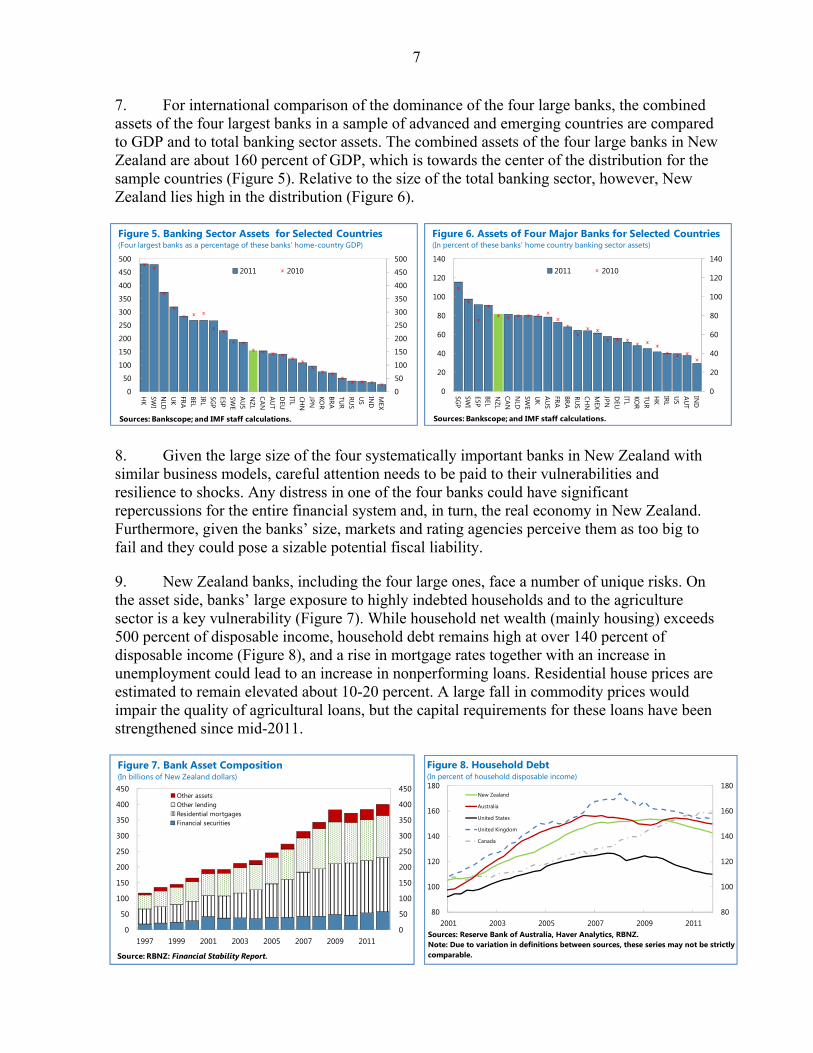
7. For international comparison of the dominance of the four large banks, the combined assets of the four largest banks in a sample of advanced and emerging countries are compared to GDP and to total banking sector assets. The combined assets of the four large banks in New Zealand are about 160 percent of GDP, which is towards the center of the distribution for the sample countries (Figure 5). Relative to the size of the total banking sector, however, New Zealand lies high in the distribution (Figure 6).
8. Given the large size of the four systematically important banks in New Zealand with similar business models, careful attention needs to be paid to their vulnerabilities and resilience to shocks. Any distress in one of the four banks could have significant repercussions for the entire financial system and, in turn, the real economy in New Zealand. Furthermore, given the banks’ size, markets and rating agencies perceive them as too big to fail and they could pose a sizable potential fiscal liability.
9. New Zealand banks, including the four large ones, face a number of unique risks. On the asset side, banks’ large exposure to highly indebted households and to the agriculture sector is a key vulnerability (Figure 7). While household net wealth (mainly housing) exceeds 500 percent of disposable income, household debt remains high at over 140 percent of disposable income (Figure 8), and a rise in mortgage rates together with an increase in unemployment could lead to an increase in nonperforming loans. Residential house prices are estimated to remain elevated about 10-20 percent. A large fall in commodity prices would impair the quality of agricultural loans, but the capital requirements for these loans have been strengthened since mid-2011.
0
50
100
150
200
250
300
350
400
450
500
0
50
100
150
200
250
300
350
400
450
500
HK
SWI
NLD
UK
FRABELIRLSG
PESPSW
EA
US
NZL
CAN
AU
TD
EUITLCH
NJPNKO
RBRATU
RRU
SU
SIN
DM
EX
2011 2010
Figure 5. Banking Sector Assets for Selected Countries(Four largest banks as a percentage of these banks' home-country GDP)
Sources: Bankscope; and IMF staff calculations.
0
50
100
150
200
250
300
350
400
450
0
50
100
150
200
250
300
350
400
450
1997 1999 2001 2003 2005 2007 2009 2011
Other assetsOther lendingResidential mortgagesFinancial securities
Figure 7. Bank Asset Composition(In billions of New Zealand dollars)
Source: RBNZ: Financial Stability Report.
80
100
120
140
160
180
80
100
120
140
160
180
2001 2003 2005 2007 2009 2011
New Zealand
Australia
United States
United Kingdom
Canada
Figure 8. Household Debt(In percent of household disposable income)
Sources: Reserve Bank of Australia, Haver Analytics, RBNZ.Note: Due to variation in definitions between sources, these series may not be strictly comparable.

8
10. New Zealand banks’ reliance on short-term offshore funding is an additional vulnerability as they are exposed to potential disruptions in global financial markets. After the collapse of Lehman Brothers, banks came to the Reserve Bank of New Zealand (RBNZ) for liquidity support (Figure 9) and used the government’s wholesale funding guarantee to gain access to international markets (Figure 10). Parent banks in Australia also provided funding to their subsidiaries in New Zealand.2 New Zealand banks, however, have made steady progress in lengthening the maturity profile of their wholesale funding since 2008 and increasing the share of retail deposits. But New Zealand’s short-term external debt (mostly held by banks) remains sizable at about 50 percent of GDP (Figure 11), and loan-to-deposit ratios are high (Figure 12).
2 According to Standard & Poor’s, New Zealand subsidiaries benefit from parent banks’ support to the tune of three notches in their credit ratings.
150
200
250
300
350
400
450
500
20
30
40
50
60
70
80
Jun-06 Mar-07 Dec-07 Sep-08 Jun-09 Mar-10 Dec-10 Sep-11 Jun-12
AUS NZL SPN IRL (RHS) UK (RHS)
Figure 11. Total Short-Term External Debt 1/(In percent of GDP)
1/ Short-term debt is on a residual maturity basis for Australia and New Zealand and on an original maturity basis for other countries.Sources: WB-IMF-BIS-OECD Joint External Debt Hub; and IMF staff calculations.
50
100
150
200
250
300
350
50
100
150
200
250
300
350
Jan-07 May-07 Sep-07 Jan-08 May-08 Sep-08 Jan-09 May-09 Sep-09
AUS EUR JPN
UK US NZL
Figure 9. Central Bank Balance Sheet Sizes(January 2007 = 100)
Sources: BOE; BOJ; ECB; FRB; RBA; and RBNZ
0
2
4
6
8
10
12
14
16
0
2
4
6
8
10
12
14
16
Oct-08 Dec-08 Feb-09 Apr-09 Jun-09 Aug-09 Oct-09 Dec-09
AUS IRE KOR
UK US NZL
Median 1/
Figure 10. Government Guaranteed Debt(In percent of GDP)
1/ Median of 17 advanced countries' government guaranteed debt.Sources: Dealogic; and IMF staff calculations.
0
50
100
150
200
250
300
350
400
450
500
0
50
100
150
200
250
300
350
400
450
500New Zealand banks Australian banks
2011 2010
average (2011) average(2010)
Figure 12. Loans to Customer Deposits(Four largest banks, in selected countries)
Sources: Bankscope; and IMF staff calculations.

9
III. BASEL II IMPLEMENTATION AND CAPITAL RATIOS
11. Different countries apply different approaches to the definitions of Pillar 1 risk-weighted assets, eligible capital, and capital limits in implementing the Basel II framework, and regulators’ supervisory review process of banks’ own internal capital adequacy assessment could also play an important role in defining the level of capital held. In implementing the Basel II framework, the RBNZ required banks to adopt a more conservative approach in several cases than required by the Basel II framework (Table 2). Most importantly, a 20 percent loss given default (LGD) floor was adopted for residential mortgages, well above the Basel II floor of 10 percent. As a result, New Zealand banks’ LGD rates are higher than those of many other countries’ banks.
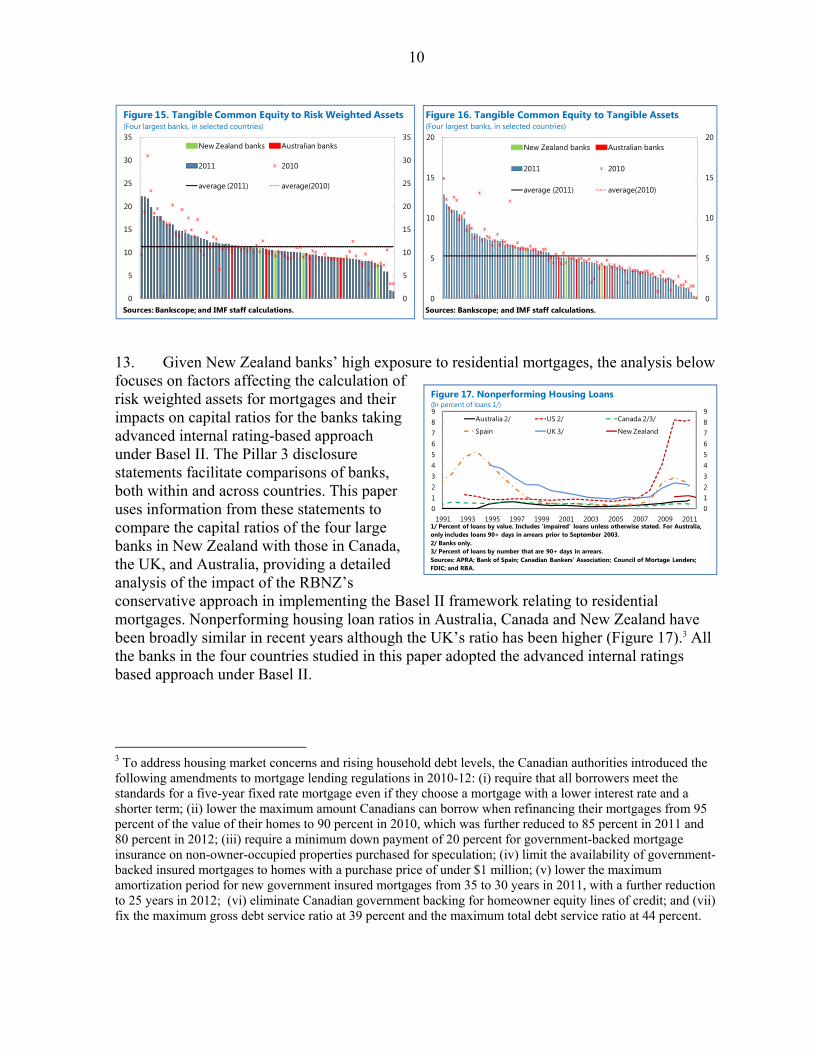
12. The headline capital ratios for the four large New Zealand banks are lower than for other advanced and emerging countries’ banks (Figures 13 and 14). However, differences in regulatory rules relating to the calculation of required capital suggest that different countries’ capital ratios should be interpreted with caution. For example, the risk-weighted assets numbers are not directly comparable across countries. New Zealand’s requirements for calculating risk weighted assets likely imply that risk-weighted assets in New Zealand banks are higher than for comparable banks in other countries, resulting in lower headline capital ratios for the same amount of capital. Moreover, due to the RBNZ’s conservative capital eligibility and deduction rules New Zealand banks tend to hold higher quality capital, which is reflected in their higher rankings in tangible common equity ratios compared with their rankings in Tier 1 and total capital ratios (Figures 15 and 16).
0
5
10
15
20
25
30
35
0
5
10
15
20
25
30
35New Zealand banks Australian banks
2011 2010
average (2011) average(2010)
Figure 13. Tier1 Regulatory Capital Ratio(Four largest banks, in selected countries)
Sources: Bankscope; and IMF staff calculations.0
5
10
15
20
25
30
35
0
5
10
15
20
25
30
35New Zealand banks Australian banks
2011 2010
average (2011) average (2010)
Figure 14. Total Regulatory Capital Ratio(Four largest banks, in selected countries)
Sources: Bankscope; and IMF staff calculations.
AustraliaFinal position
Initial bank position after RBNZ actions
10 % and not sensitive to loan-to-value (LVR)
about 0.5% 1.25% minimum 0.8%10% 30% 15-20%
Rural loans:50% …
80-90%
about 30% 80% 30-50%
1/ The Basel II framework specifies a minimum value of 10 percent for loss given default.
Average risk weigh
Average risk weigh System average of
Credit cards:Average risk weighSource: Reserve Bank of New Zealand
probability of def
Table 2. Risk Weights for Banks' Internal Models Under the Basel II Capital FrameworkNew Zealand
Housing loans:Loss given default 1 Just over 20% and 20% minimum
sensitive to LVRLong run portfolio:
10
13. Given New Zealand banks’ high exposure to residential mortgages, the analysis below focuses on factors affecting the calculation of risk weighted assets for mortgages and their impacts on capital ratios for the banks taking advanced internal rating-based approach under Basel II. The Pillar 3 disclosure statements facilitate comparisons of banks, both within and across countries. This paper uses information from these statements to compare the capital ratios of the four large banks in New Zealand with those in Canada, the UK, and Australia, providing a detailed analysis of the impact of the RBNZ’s conservative approach in implementing the Basel II framework relating to residential mortgages. Nonperforming housing loan ratios in Australia, Canada and New Zealand have been broadly similar in recent years although the UK’s ratio has been higher (Figure 17).3 All the banks in the four countries studied in this paper adopted the advanced internal ratings based approach under Basel II.
3 To address housing market concerns and rising household debt levels, the Canadian authorities introduced the following amendments to mortgage lending regulations in 2010-12: (i) require that all borrowers meet the standards for a five-year fixed rate mortgage even if they choose a mortgage with a lower interest rate and a shorter term; (ii) lower the maximum amount Canadians can borrow when refinancing their mortgages from 95 percent of the value of their homes to 90 percent in 2010, which was further reduced to 85 percent in 2011 and 80 percent in 2012; (iii) require a minimum down payment of 20 percent for government-backed mortgage insurance on non-owner-occupied properties purchased for speculation; (iv) limit the availability of government-backed insured mortgages to homes with a purchase price of under $1 million; (v) lower the maximum amortization period for new government insured mortgages from 35 to 30 years in 2011, with a further reduction to 25 years in 2012; (vi) eliminate Canadian government backing for homeowner equity lines of credit; and (vii) fix the maximum gross debt service ratio at 39 percent and the maximum total debt service ratio at 44 percent.
0
5
10
15
20
25
30
35
0
5
10
15
20
25
30
35New Zealand banks Australian banks
2011 2010
average (2011) average(2010)
Figure 15. Tangible Common Equity to Risk Weighted Assets(Four largest banks, in selected countries)
Sources: Bankscope; and IMF staff calculations.
0123456789
0123456789
1991 1993 1995 1997 1999 2001 2003 2005 2007 2009 2011
Australia 2/ US 2/ Canada 2/3/
Spain UK 3/ New Zealand
Figure 17. Nonperforming Housing Loans(In percent of loans 1/)
1/ Percent of loans by value. Includes 'impaired' loans unless otherwise stated. For Australia, only includes loans 90+ days in arrears prior to September 2003.2/ Banks only.3/ Percent of loans by number that are 90+ days in arrears.Sources: APRA; Bank of Spain; Canadian Bankers’ Association; Council of Mortage Lenders; FDIC; and RBA.
0
5
10
15
20
0
5
10
15
20New Zealand banks Australian banks
2011 2010
average (2011) average(2010)
Figure 16. Tangible Common Equity to Tangible Assets(Four largest banks, in selected countries)
Sources: Bankscope; and IMF staff calculations.

11
14. New Zealand banks’ high LGD rates required by the RBNZ result in higher Pillar 1 risk weighted assets for the same amount of residential mortgages, compared with most other countries’ banks (Figure 18).4 This in turn leads to lower capital ratios for the same amount of capital. For example, if New Zealand banks’ LGD rates are reduced to the Basel II 10 percent floor, which was the rate for one of the four Canadian banks in 2011,5 the four large New Zealand banks’ weighted average Tier 1 and total capital ratios are estimated to increase by about 150 and 200 basis points, respectively (Table 3). Even if New Zealand banks’ LGD rates are lowered to 15 percent, which are higher than UK and Spanish banks’ LGD rates, the four New Zealand banks’ Tier 1 and total capital ratios are estimated to increase by around 100 basis points, respectively.
15. The weighted average of the probabilities of default (PD) on residential mortgages for the four large New Zealand banks is over three times that of Canada’s three large banks, or about 1.2 times that of Australian four large banks (Figure 19), although nonperforming housing loan ratios in New Zealand, Australia and Canada have been broadly similar in recent years. 6 In Canada, mortgages insured by government-owned Canada Mortgage and Housing Corporation (CMHC) are assigned a zero risk weight for regulatory capital requirement purposes.7 Thus, over 60 percent of the four large Canadian banks’ residential mortgages
4 For residential mortgages, capital requirement = LGD × f (PD). See BCBS (2006), p. 70. 5 This bank provides almost 40 percent of the total residential mortgages underwritten by the four large banks in Canada. 6 The Bank of Montreal (BMO)’s disclosure statements don’t report exposure-weighted probabilities of default for PD ranges so that the BMO is excluded in this comparison. 7 Mortgages covered by approved private insurers are assigned a slightly higher weight. CMHC accounts for about 70 percent of all outstanding mortgage insurance. Due to the regulatory capital reductions provided by mortgage insurance, about two thirds of Canadian mortgages are insured. See Kiff (2010).
10
12
14
16
18
20
22
24
10
12
14
16
18
20
22
24
Q1 2009 Q3 2009 Q1 2010 Q3 2010 Q1 2011 Q3 2011
CAN 1/ AUS 1/ ESP 2/ UK 3/ NZL /1
Figure 18. Loss Given Default on Residential Mortgages(In percent)
1/ Four largest banks. 2/ Two largest banks. Reporting dates Q4 2009, Q4 2010, and Q4 2011.3/ Three banks. Reporting dates Q4 2009, Q4 2010, and Q4 2011.Sources: Banks' disclosure statements; and IMF staff calculations.
Tier 1 capital Total capitalUsing current LGD (21.6% 1/) 10.1 12.6Assuming LGD 10% 11.7 14.6Assuming LGD 15% 11.0 13.7Assuming average for Canadian 4 large banks' LGD (13.9% 1/) 11.1 13.91/ Weighted averagesSources: Banks' disclosure statements; and IMF staff estimates.
Capital adequacy ratios 1/
Table 3. New Zealand's Four Largest Banks:LGD for Residential Mortgages and Impact on Capital Adequacy Ratios
(In percent)

12
0
0.5
1
1.5
2
2.5
3
3.5
4
0
0.5
1
1.5
2
2.5
3
3.5
4
Q1 2009 Q3 2009 Q1 2010 Q3 2010 Q1 2011 Q3 2011
NZ weighted average 1/ NZ minAUS weighted average 2/ AUS minCAN weighted average 3/ CAN min
Figure 19. Probability of Default on Residential Mortgages(In percent)
1/ Includes ANZ, ASB, BNZ, and Westpac. 2/ Includes ANZ, CBA, NAB, and Westpac. 3/ Includes BMO, CIBC, Scotiabank, and TD Bank.Sources: Banks' disclosure statements; and IMF staff calculations.
0
10
20
30
40
50
60
70
80
0
10
20
30
40
50
60
70
80
0.0 to 0.2 0.2 to 0.5 0.5 to 2.0 2.0 to 10.0 10.0 to 99.9 100
New Zealand (Sept 2011) 1/
Australia (Sept 2011) 2/
Canada (Oct 2011) 3/
Canada (Oct 2010) 3/
Figure 20. PD Range and Composition of Residential Mortgages(In percent of total)
PD Range1/ Includes ANZ, ASB, BNZ, and Westpac. For ASB, data for June 2011.2/ Includes ANZ, CBA, NAB, and Westpac. For CBA, data for December 2011.3/ Includes BMO, CIBC, Scotiabank, and TD Bank. Sources: Banks' disclosure statements; and IMF staff estimates.
0 5 10 15 20 25 30 35 40 45 50
05
101520253035404550
Q1 2009 Q3 2009 Q1 2010 Q3 2010 Q1 2011 Q3 2011
NZ weighted average 1/ NZ minAUS weighted average 2/ AUS minUK weighted average 3/ UK minCAN weighted average 4/ CAN min
Figure 21. Average Risk Weights for Residential Mortgages(In percent)
1/ Includes ANZ, ASB, BNZ, and Westpac. 2/ Includes ANZ, CBA, NAB, and Westpac. 3/ Includes Barclays, Lloyds TSB, and RBS.4/ Includes BMO, CIBC, Scotiabank, and TD Bank.Sources: Banks' disclosure statements; and IMF staff calculations.
belong to the lowest risk bucket in 2011, compared with just about 10 percent in New Zealand and around 40 percent in Australia (Figure 20).8
16. Reflecting the differences in the probability of default and loss-given-default rates, the New Zealand banks’ average risk weight is almost 3 times the average of the Canadian banks or around 1½ times that of the Australian or UK banks (Figure 21). If the Canadian banks’ risk weight is applied to the New Zealand banks, their total capital ratio is estimated to rise by more than 250 basis points and the Tier 1 capital ratio by more than 200 basis points (Table 4). If the risk weights of the Australian and UK banks are used, the New Zealand banks’ capital ratios are estimated to increase more than 100 basis points.
8 One Canadian bank acquired a US bank in 2011, which increased the probability of default and risk weight of that bank substantially.

13
17. The above analysis does not take into account the differences in the definitions of eligible capital as well as other variances. According to the Australian Bankers’ Association (2009), for example, the Australian and UK rules are different in the measurement of eligible Tier 1 capital relating to equity investments, dividends, and expected loss and eligible provisions, generally resulting in larger Tier 1 capital deductions under Australian rules. A fuller analysis of all the variances would facilitate international comparisons of headline capital ratios in different countries and jurisdictions.
IV. HOW VULNERABLE ARE NEW ZEALAND BANKS TO SHOCKS TO RESIDENTIAL
MORTGAGES AND CORPORATE LENDING?
A. Shocks to Residential Mortgages
18. To assess the risks of residential mortgage lending (about 45 percent of the four large banks’ total lending), this paper uses the September 2011 data published by the banks on their risk exposure. Following the adoption of the Basel II internal ratings-based approach, the four banks publish a breakdown of corporate, residential mortgage, and other retail lending exposure disaggregated into six risk categories in the Pillar 3 statements (for example, see data for ANZ, the largest bank in New Zealand in Table 5 below). For each risk category, the probability of default, loss given default, and risk weights are reported.
Tier 1 capital Total capitalUsing current risk weight (28.7% 1/) 10.1 12.6Assuming Australian 4 large banks' risk weight (16.8% 1/) 11.3 14.1Assuming British 4 large banks' risk weight (18.5% 1/) 11.1 13.9Assuming Canadian 4 large banks' risk weight (10.3% 1/) 12.1 15.1Assuming Canadian 4 large banks' risk weight (7.4% 1/ 2/) 12.4 15.51/ Weighted averages2/ As of October 2011Sources: Banks' disclosure statements; and IMF staff estimates.
Capital adequacy ratios 1/
Table 4. New Zealand's Four Largest Banks:Risk Weight for Residential Mortgages and Impact on Capital Adequacy Ratios
(In percent)
Exposure Probability Loss Given Average Risk Risk Weighted Capital at Default of Default Default Weight Exposure Requirement
Corporate 45,580 3.88% 41% 62% 29,743 2,381Sovereign 8,989 0.01% 5% 1% 77 6Bank 13,612 0.02% 62% 17% 2,432 194Retail mortgages 46,597 2.85% 21% 24% 11,749 940Other retail 8,947 3.87% 68% 62% 5,847 467Total 123,725 2.79% 35% 38% 49,848 3,988Source: ANZ's disclosure statement.
Table 5. ANZ: Credit Risk Exposure(As of September 30, 2011; in millions of New Zealand dollars)

14
19. The four large banks are exposed to residential mortgages, but the data in the Pillar 3 disclosure statements show that residential mortgage lending is considered by the banks to be less risky than corporate and other retail lending. The average risk weight for corporate lending at ANZ, for example, is about 2½ times that for residential mortgages. Although the amount of corporate lending is similar to that of residential mortgages in the case of ANZ, the required capital for corporate lending is about 2½ times that for residential mortgages, reflecting that corporate lending is riskier.
20. The stress test scenarios considered in the paper apply Irish banks’ residential mortgage developments during the global financial crisis to New Zealand banks’ balance sheets. The Irish banks’ residential mortgage quality has deteriorated sharply, due to the large increase in unemployment to 14.8 percent in 2012 from 4.7 percent in 2007 and a 50 percent decline in housing prices from the peak in 2007 (Figure 22), together with high loan-to-value ratios at origination (over 50 percent of loans above 80 percent loan-to-value ratios in 2004-06).9 It is probably unlikely that New Zealand banks would see such a sharp deterioration in asset quality, with their prudent lending practices, including low loan-to-value ratios. Nonetheless, the Irish experience is used to calibrate tail-risk scenarios for the New Zealand banks in order to see whether they are resilient to such severe stress scenarios.
21. To apply the Irish experience to the New Zealand banks, the paper assumes that the shares of the three riskiest categories for residential mortgages at the four large New Zealand banks would rise to those of the Irish banks in 2010 and the share of the next low risk category would decline accordingly (Table 6).10
9 Irish banks also incurred heavy losses from commercial property lending, which amounted to 31 percent of total loans in 2006. The average haircut applied when large commercial property loans were transferred to Ireland’s national asset management agency was about 57 percent. 10 The data in Table 6 are based on prior disclosure standards for banks. To improve the number and quality of disclosures the Irish authorities have recently strengthened disclosure standards. See http://www.centralbank.ie/press-area/press-releases/Pages/CentralBankpublishesImpairmentProvisioningandDisclosureGuidelines.aspx
100
120
140
160
180
200
220
240
100
120
140
160
180
200
220
240
Dec-99 Dec-01 Dec-03 Dec-05 Dec-07 Dec-09 Dec-11
New ZealandIreland
Figure 22. Real Estate Prices in Ireland and New Zealand(Q4 1999=100)
Source: BIS.

15
2007 2008 2009 2010
High and Good quality 83.3 77.9 69.1 66.8 Satisfactory quality 11.7 14.6 15.8 15.0 Lower quality 2.1 2.3 2.7 2.9 Past due but not impaired 2.6 4.2 6.0 6.7 Impaired loans 0.2 1.0 6.4 8.5Total 100 100 100 100
Nonperforming loans 0.8 2.4 8.7 11.4Sources: Banks' disclosure statements; and IMF staff estimates.1/ Includes Anglo Irish Bank, Irish Life and Permanent plc, Bank of Ireland, and AlliedIrish Banks. Includes estimates of assets transferred to National Asset Managementagency (NAMA).
Table 6. Ireland: Four Large Banks' Residential Mortgages 1/(In percent of total)
22. Under this scenario (Scenario 1), the four large New Zealand banks’ probability of default is estimated to increase sharply from 2¾ percent to 10½ percent and the estimated losses would be larger than the banks’ provisions, resulting in a reduction in the banks’ capital. The banks’ Tier 1 capital ratio is estimated to decline by about 1 percentage point (Table 7). Under a second scenario that is scenario 1 plus an increase of the LGD and risk weights by 1½ times (Scenario 2), the banks’ Tier 1 capital ratio is estimated to decline to about 7 percent, but all the four banks’ Tier 1 capital ratio would remain well above the regulatory minimum ratio of 4 percent. Such a large increase in the LGD to 33 percent would probably not happen in New Zealand, given the banks’ low loan-to-value ratios and modest house price overvaluation estimated at 10–20 percent. Downward internal ratings migration, which pushes up the measure of risk-weighted assets and, hence, capital requirements, accounts for more than half of the reductions in Tier 1 capital ratio under both scenarios (Figure 23).
-5
-4
-3
-2
-1
0
-5
-4
-3
-2
-1
0Tier 1 capital Total capital Tier 1 capital Total capital
Net Tier 1 capital changeRWA driven
Figure 23. Capital Ratio Change(In percent)
* Assuming the shares of the 3 highest risk categories for residential mortgage exposures at the levels of Irish banks.** Scenario 1 plus increases of LGD and RW by 1.5 times.Sources: Banks' disclosure statements; and IMF staff calculations.
Scenario 1 * Scenario 2 **

16
23. The above stress tests show some resilience of the four large New Zealand banks to a stand-alone sizable decline in residential mortgage quality. There are a number of factors that would mitigate the potential risks associated with mortgage lending. In implementing the Basel II framework, the RBNZ required banks to assume higher rates of loss-given-default than in many other countries. At the same time, banks were relatively conservative. They limited their exposure to high risk borrowers. According to the 2010 Household Economic Survey, about 1 percent of owner-occupied mortgages had loan-to-value ratios above 80 percent and debt-service ratios above 50 percent. The full recourse nature of mortgage lending also helped limit strategic loan defaults.
B. Shocks to Corporate Lending
24. The four large New Zealand banks’ exposure to businesses, including the agriculture sector, is smaller than to households, but substantial at 27 percent of total lending (Table 8). Debt levels in the agriculture sector and property prices in the rural area remain elevated (Figures 24 and 25). A large fall in dairy and meat prices, which remain at high levels, could reduce the quality of agricultural loans substantially in light of the high level of debt to
September 2011 Scenario 1 Scenario 2
Actual 1/
Residential mortgage exposures: assume the shares of the 3 highest risk categories at the levels of Irish banks
Scenario 1 plus increases of LGD and RW by 1½ times
Credit exposure Residential mortgages 158,235 158,235 158,235 Total 359,638 359,638 359,638
Residential mortgages PD (%) 2/ 2.7 10.6 10.6 LGD (%) 2/ 21.6 22.0 33.1 Risk weight (%) 2/ 28.7 37.2 55.8
Risk weighted assets Residential mortgages 46,580 58,880 88,319 Total 183,693 195,993 225,432
Capital Tier 1 18,507 17,548 16,197 Total 23,111 21,192 18,983 Provisions 2,501 2,501 2,501 Estimated loss 1,073 4,420 6,629 Total loss to capital … 1,919 4,128
Capital adequacy ratio Tier 1 (%) 2/ 10.1 9.0 7.2 Total (%) 2/ 12.6 10.8 8.4
Sources: Banks' disclosure statements and IMF staff estimates.1/ Includes Australia and New Zealand Bank, ASB Bank, Bank of New Zealand, and Westpac.2/ Weighted averages.
Table 7. New Zealand's Four Largest Banks: Impact on Capital of Shocks to Residential Mortgages
(In millions of New Zealand dollars, unless otherwise indicated)

17
agricultural output (Figure 26). Some signs of stress in the business sector have emerged with a sharp pick up in nonperforming loans since 2009 although the situation has started improving recently (Figure 27).
25. To assess the risks to banks of corporate lending, this section simulates a shock to the four banks’ corporate lending, using data published on their risk exposure. The data show that corporate lending has been classified as much riskier than mortgage. For corporate lending, we shift the risk categories up by one category to a higher risk. In other words, the probability of default and LGD for category I loans are assumed to be changed to them for category II loans, and so forth.
0
100
200
300
400
500
600
700
0
100
200
300
400
500
600
700
Mar-90 Mar-93 Mar-96 Mar-99 Mar-02 Mar-05 Mar-08 Mar-11
Residential
Rural
Figure 25. Property Prices(1990=100)
Source: RBNZ: Financial Stability Report.
0
50
100
150
200
250
300
350
400
450
0
50
100
150
200
250
300
350
400
450
2001 2002 2003 2004 2005 2006 2007 2008 2009 2010 2011 2012
Diary
Forestry
Meat, skin & wool
Figure 26. Export Commodity Price Index(Jan 1986=100)
Source: ANZ.
Westpac ANZ BNZ ASB Total % of total
Corporate 10,694 45,580 31,247 11,443 98,964 27.5
Residential mortgages 39,414 46,597 30,129 42,095 158,235 44.0
Other retail/Small business 6,405 8,947 4,972 3,005 23,329 6.5
Sovereign 4,123 8,989 4,858 4,766 22,736 6.3
Bank 2,384 13,612 4,018 6,521 26,535 7.4
Other 9,635 10,629 5,355 4,220 29,839 8.3
Total 72,655 134,354 80,579 72,050 359,638 100.0
Sources: banks' disclosure statements.
Table 8. Credit Exposures by Portfolio Type
(As of September 30, 2011; in millions of New Zealand dollars)
0
1
2
3
4
5
0
1
2
3
4
5
Rural Commercialproperty
SME Corporate Housing
Mar-09 Mar-10 Mar-11
Mar-12
Figure 27. Sectoral Nonperforming Loans(In percent of sectoral lending)
Source: RBNZ: Financial Stability Report.Note: Includes impaired and 90-day past due assets. Data are not standardized and definitions may vary across banks.
0.0
0.5
1.0
1.5
2.0
2.5
3.0
0.0
0.5
1.0
1.5
2.0
2.5
3.0
1991 1994 1997 2000 2003 2006 2009
Figure 24. Agricultural Debt to Agricultural Export Earnings(In ratio)
Source: RBNZ: Financial Stability Report.
18
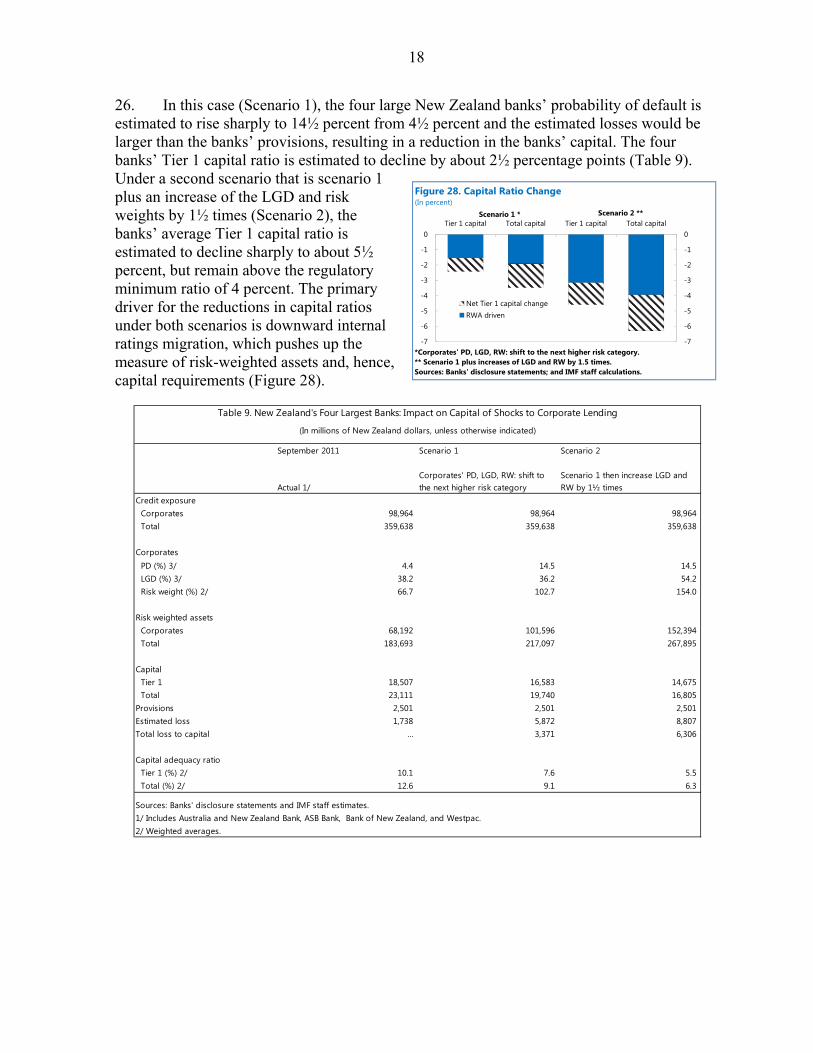
26. In this case (Scenario 1), the four large New Zealand banks’ probability of default is estimated to rise sharply to 14½ percent from 4½ percent and the estimated losses would be larger than the banks’ provisions, resulting in a reduction in the banks’ capital. The four banks’ Tier 1 capital ratio is estimated to decline by about 2½ percentage points (Table 9). Under a second scenario that is scenario 1 plus an increase of the LGD and risk weights by 1½ times (Scenario 2), the banks’ average Tier 1 capital ratio is estimated to decline sharply to about 5½ percent, but remain above the regulatory minimum ratio of 4 percent. The primary driver for the reductions in capital ratios under both scenarios is downward internal ratings migration, which pushes up the measure of risk-weighted assets and, hence, capital requirements (Figure 28).
September 2011 Scenario 1 Scenario 2
Actual 1/Corporates' PD, LGD, RW: shift tothe next higher risk category
Scenario 1 then increase LGD andRW by 1½ times
Credit exposure Corporates 98,964 98,964 98,964 Total 359,638 359,638 359,638
Corporates PD (%) 3/ 4.4 14.5 14.5 LGD (%) 3/ 38.2 36.2 54.2 Risk weight (%) 2/ 66.7 102.7 154.0
Risk weighted assets Corporates 68,192 101,596 152,394 Total 183,693 217,097 267,895
Capital Tier 1 18,507 16,583 14,675 Total 23,111 19,740 16,805 Provisions 2,501 2,501 2,501 Estimated loss 1,738 5,872 8,807 Total loss to capital … 3,371 6,306
Capital adequacy ratio Tier 1 (%) 2/ 10.1 7.6 5.5 Total (%) 2/ 12.6 9.1 6.3
Sources: Banks' disclosure statements and IMF staff estimates.1/ Includes Australia and New Zealand Bank, ASB Bank, Bank of New Zealand, and Westpac.2/ Weighted averages.
Table 9. New Zealand's Four Largest Banks: Impact on Capital of Shocks to Corporate Lending
(In millions of New Zealand dollars, unless otherwise indicated)
-7
-6
-5
-4
-3
-2
-1
0
-7
-6
-5
-4
-3
-2
-1
0Tier 1 capital Total capital Tier 1 capital Total capital
Net Tier 1 capital changeRWA driven
Figure 28. Capital Ratio Change(In percent)
*Corporates' PD, LGD, RW: shift to the next higher risk category.** Scenario 1 plus increases of LGD and RW by 1.5 times.Sources: Banks' disclosure statements; and IMF staff calculations.
Scenario 1 * Scenario 2 **

19
C. Combined Shocks
27. The above exercise indicates that New Zealand’s systemically important four banks can withstand sizable stand-alone shocks to either mortgage or corporate lending. The risks are highly linked, however, and sizable combined shocks to both mortgages and corporate lending would put more pressure on the banks’ capital (Table 10). For example, a hard landing in China, and thus Australia, would consequently reduce demand for New Zealand exports, worsen terms of trade, and could trigger a sudden decline in house prices. This could in turn weaken consumer demand and growth, and negatively affect banks’ balance sheets. The downside macroeconomic impact of such a scenario could be substantial.
28. The RBNZ undertook stress tests jointly with the Australian Prudential Regulatory Authority in 2012 to assess the four large banks’ resilience to severe shocks, including a 40 percent drop in the world price of New Zealand’s commodity exports, a six-month freeze in wholesale debt markets, a cumulative output loss of four percent, a rise in unemployment to 11.4 percent, a fall in house, farm and commercial property prices of about 30 percent.11 This scenario resulted in Tier 1 capital ratios falling from over 10 percent to around 6 percent over three years, which is broadly similar to the result of the combined shocks to both residential mortgages and corporate lending (Scenario 1) in Table 10.
29. While New Zealand’s bank regulatory norms are more conservative than in many other countries, banking sector vulnerability should be assessed on an ongoing basis to minimize the risk that systemically important banks pose to the economy. In light of other countries’ experiences (Figure 29) and New Zealand banks’ high exposure to residential mortgages, future stress test scenarios could consider a longer time horizon to take into account the impact of sustained high unemployment. The risk horizons of the recent FSAP stress tests for the United Kingdom, Germany, and Netherlands are five years (Table 11). In light of New Zealand banks’ dependence on offshore funding, future stress tests could also consider a jump in global longer-term interest rates, which could come from a rise in global rates and an increase in New Zealand banks’ risk premium.
11 See RBNZ (November, 2012), pp. 28-29.
Actual Scenario 1 Scenario 2Tier 1 10.1 6.3 3.3Total capital 12.6 6.7 3.3Source: IMF staff estimates.
(In percent)
Table10. New Zealad's Four Largest Banks:Impact of Combined Shocks on Capital
0 10 20 30 40 50
Ireland (2007)
USA (2006)
UK (2007)
Spain (2008)
Finland (1989)
Greece (2008)
Sweden (1990)
Switzerland (1989)
Japan (1991)
Figure 29. Real Estate Prices in Recent Crises
Sources: BIS; OECD; CSO; and IMF Country Report No. 12/264.* Ongoing.
82*
17*
20*
18*
Duration(quarters)
16*
17
23
14*
30
20
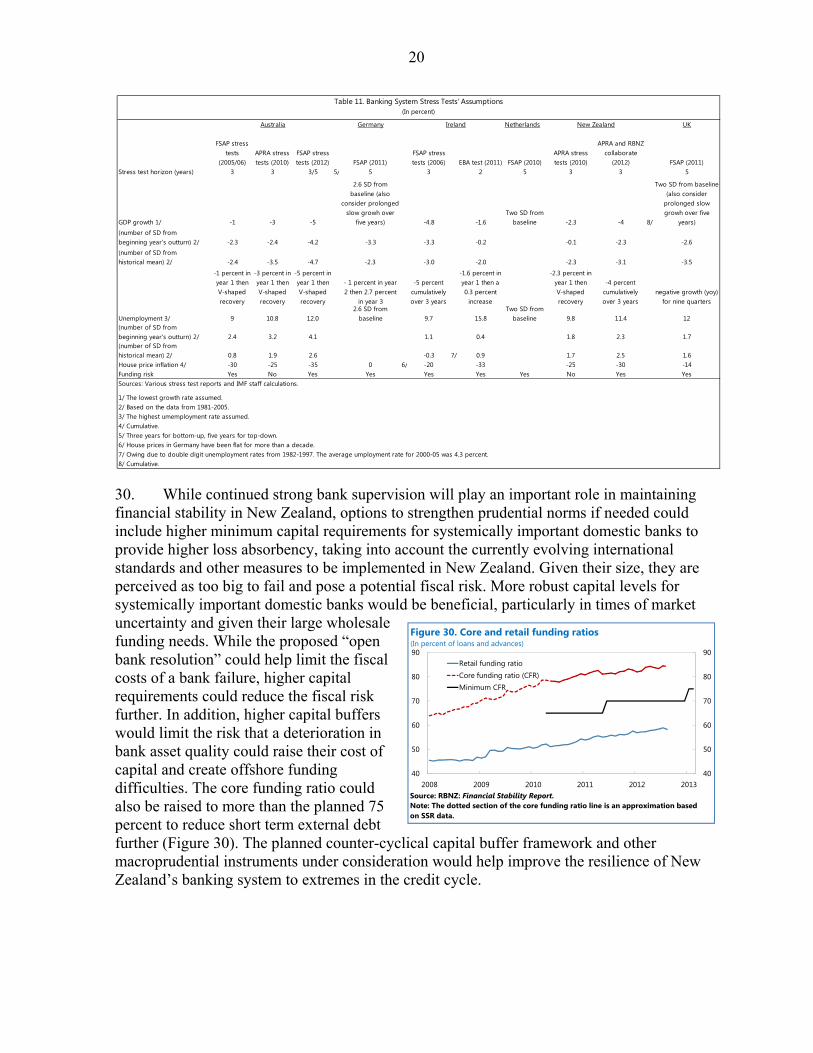
30. While continued strong bank supervision will play an important role in maintaining financial stability in New Zealand, options to strengthen prudential norms if needed could include higher minimum capital requirements for systemically important domestic banks to provide higher loss absorbency, taking into account the currently evolving international standards and other measures to be implemented in New Zealand. Given their size, they are perceived as too big to fail and pose a potential fiscal risk. More robust capital levels for systemically important domestic banks would be beneficial, particularly in times of market uncertainty and given their large wholesale funding needs. While the proposed “open bank resolution” could help limit the fiscal costs of a bank failure, higher capital requirements could reduce the fiscal risk further. In addition, higher capital buffers would limit the risk that a deterioration in bank asset quality could raise their cost of capital and create offshore funding difficulties. The core funding ratio could also be raised to more than the planned 75 percent to reduce short term external debt further (Figure 30). The planned counter-cyclical capital buffer framework and other macroprudential instruments under consideration would help improve the resilience of New Zealand’s banking system to extremes in the credit cycle.
Germany Netherlands UK
FSAP stress tests
(2005/06)APRA stress tests (2010)
FSAP stress tests (2012) FSAP (2011)
FSAP stress tests (2006) EBA test (2011) FSAP (2010)
APRA stress tests (2010)
APRA and RBNZ collaborate
(2012) FSAP (2011)Stress test horizon (years) 3 3 3/5 5/ 5 3 2 5 3 3 5
GDP growth 1/ -1 -3 -5
2.6 SD from baseline (also
consider prolonged slow growh over
five years) -4.8 -1.6Two SD from
baseline -2.3 -4 8/
Two SD from baseline (also consider
prolonged slow growh over five
years)(number of SD from beginning year's outturn) 2/ -2.3 -2.4 -4.2 -3.3 -3.3 -0.2 -0.1 -2.3 -2.6(number of SD from historical mean) 2/ -2.4 -3.5 -4.7 -2.3 -3.0 -2.0 -2.3 -3.1 -3.5
-1 percent in year 1 then V-shaped recovery
-3 percent in year 1 then V-shaped recovery
-5 percent in year 1 then V-shaped recovery
- 1 percent in year 2 then 2.7 percent
in year 3
-5 percent cumulatively over 3 years
-1.6 percent in year 1 then a 0.3 percent
increase
-2.3 percent in year 1 then V-shaped recovery
-4 percent cumulatively over 3 years
negative growth (yoy) for nine quarters
Unemployment 3/ 9 10.8 12.02.6 SD from
baseline 9.7 15.8Two SD from
baseline 9.8 11.4 12(number of SD from beginning year's outturn) 2/ 2.4 3.2 4.1 1.1 0.4 1.8 2.3 1.7(number of SD from historical mean) 2/ 0.8 1.9 2.6 -0.3 7/ 0.9 1.7 2.5 1.6House price inflation 4/ -30 -25 -35 0 6/ -20 -33 -25 -30 -14Funding risk Yes No Yes Yes Yes Yes Yes No Yes YesSources: Various stress test reports and IMF staff calculations.
1/ The lowest growth rate assumed.2/ Based on the data from 1981-2005.3/ The highest umemployment rate assumed.4/ Cumulative.5/ Three years for bottom-up, five years for top-down.6/ House prices in Germany have been flat for more than a decade.7/ Owing due to double digit unemployment rates from 1982-1997. The average umployment rate for 2000-05 was 4.3 percent. 8/ Cumulative.
Ireland
Table 11. Banking System Stress Tests' Assumptions(In percent)
Australia New Zealand
40
50
60
70
80
90
40
50
60
70
80
90
2008 2009 2010 2011 2012 2013
Retail funding ratioCore funding ratio (CFR)Minimum CFR
Figure 30. Core and retail funding ratios(In percent of loans and advances)
Source: RBNZ: Financial Stability Report.Note: The dotted section of the core funding ratio line is an approximation based on SSR data.

21
References
Australian Bankers’ Association Inc., 2009, Comparison of Regulatory Capital Frameworks: APRA and the UK FSA.
Australian Prudential Regulation Authority, 2010, Insight, Issue 2. Basel Committee on Banking Supervision (BCBS), 2006, International Convergence of
Capital Measurement and Capital Standards: A Revised Framework. ____________, 2009, Strengthening the Resilience of the Banking Sector. ____________, 2011, Global Systemically Important Banks: Assessment Methodology and
the Additional Loss Absorbency Requirement. Brooks, R., and R. Cubero, 2009, “New Zealand Bank Vulnerabilities in International
Perspective,” IMF Working Paper No. 09/224 (Washington: International Monetary Fund).
European Banking Authority, 2011, 2011 EU-Wide Stress Test: Methodological Note. Financil Stability Board, 2010, Intensity and Effectiveness of SIFI Supervision:
Recommendations for Enhanced Supervision. Hargreaves, D., and G. Williamson, 2011,“Stress Testing New Zealand Banks’ Dairy
Portfolios,” RBNZ Bulletin, Vol. 74, No. 2. Harrison, I., and C. Mathew, 2008, “Project TUI: A Structural Approach to the Understanding
and Measurement of Residential Mortgage Lending Risk” mimeo (Wellington: Reserve Bank of New Zealand).
Hoskin, K., and S. Irvine, 2009,“Quality of Bank Capital in New Zealand,” RBNZ Bulletin,
Vol. 72, No. 3. International Monetary Fund, 2012, Australia: Financial System Stability Assessment, IMF
Country Report No. 12/308. ____________, 2012, Ireland: 2012 Article IV and Seventh Review Under the Extended
Arrangement—Staff Report, IMF Country Report No. 12/264 (Washington: International Monetary Fund) .
Jang, B. K., and N. Sheridan, 2012, “Bank Capital Adequacy in Australia,” IMF Working
Paper No. 12/25 (Washington: International Monetary Fund).

22
Kiff, John, 2010, “Canada’s Housing Finance System: Policy Backdrop,” in Canada: Selected Issues Paper, IMF Country Report No. 10/378 (Washington: International Monetary Fund).
Reserve Bank of New Zealand, 2012, Financial Stability Report, May and November. ____________, 2011, Financial Stability Report, November.