Embed Size (px)
Citation preview
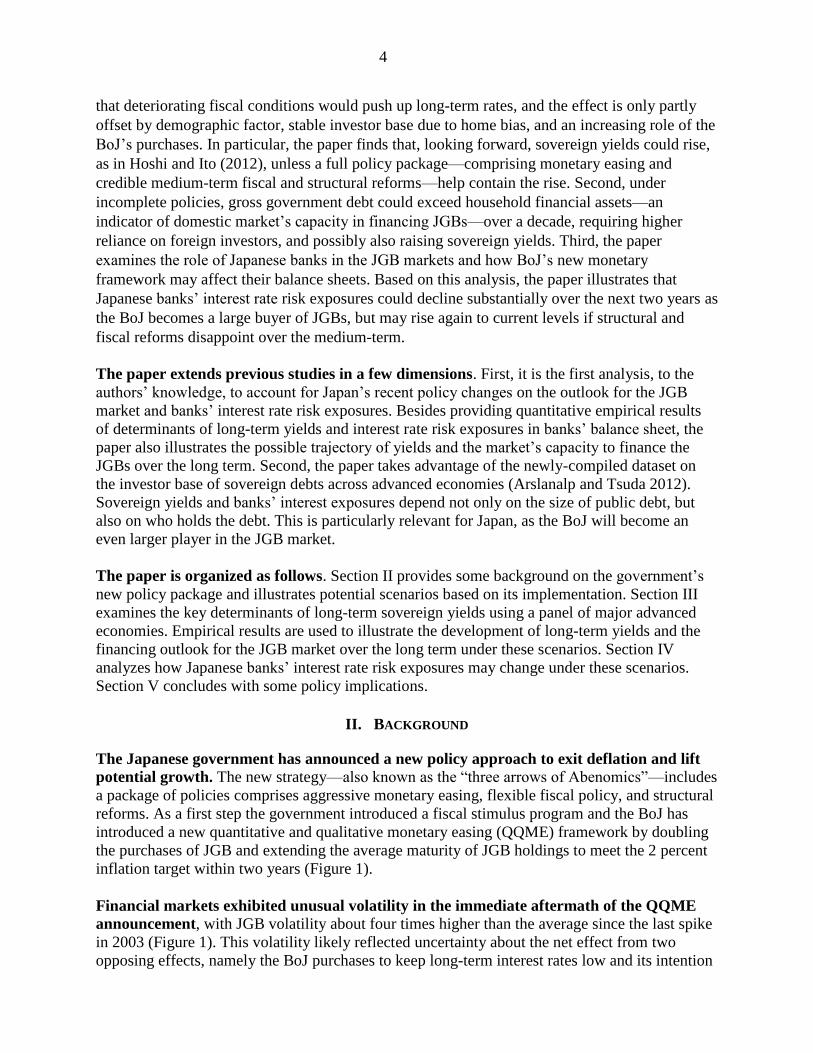
WP/13/213
Outlook for Interest Rates and Japanese Banks’
Risk Exposures under Abenomics
Serkan Arslanalp and W. Raphael Lam
© 2013 International Monetary Fund WP/13/213
IMF Working Paper
Asia and Pacific Department and Monetary and Capital Markets Department
Outlook for Interest Rates and Japanese Banks’ Risk Exposures under Abenomics
Prepared by Serkan Arslanalp and W. Raphael Lam1
Authorized for distribution by Stephan Danninger and Luc Everaert
October 2013
Abstract
This paper examines how Japan’s long-term interest rates and Japanese banks’ interest rate
risk exposures may evolve under Abenomics. Results from a panel regression analysis for
major advanced economies shows that long-term government bond yields in Japan are
determined to a large extent by growth and inflation outlook, fiscal conditions, demography,
and the investor base of government securities. A further deterioration of fiscal conditions
would push up long-term rates by about 2 percentage points over the medium term, but the
rise is partly offset by higher demand for safe assets amid population aging and increased
purchases by the Bank of Japan. At the same time, illustrative scenarios suggest the interest
rate risk exposure of Japanese banks could decline substantially over the next two years.
However, if structural and fiscal reforms are incomplete, both long-tem yields and interest-risk
exposures of Japanese banks could increase over the medium term.
JEL Classification Numbers: E4, E6, G1
Keywords: Abenomics, interest rate risks; sovereign yields, unconventional monetary policy,
Japanese government bonds (JGB).
Author’s E-Mail Address: [email protected]; [email protected]
1 We would like to thank the seminar participants at the Bank of Japan, Federal Reserve Board, and International
Monetary Fund. The authors are grateful for constructive comments from Hibiki Ichiue, Toshi Kurosawa, Alasdair
Scott, Noburo Sugimoto, Hideyuki Tanimoto, Kiichi Tokuoka, and Kazuaki Washimi.
This Working Paper should not be reported as representing the views of the IMF.
The views expressed in this Working Paper are those of the author(s) and do not necessarily
represent those of the IMF or IMF policy. Working Papers describe research in progress by the
author(s) and are published to elicit comments and to further debate.
2
Contents Page
Abstract .................................................................................................................................................. 1
I. Introduction ......................................................................................................................................... 3
II. Background ........................................................................................................................................ 4
III. Outlook For Interest Rates Under Abenomics ................................................................................. 6
A. Literature Review ................................................................................................................. 6
B. A Panel Analysis on the Determinants of Long-Term Interest Rates ................................... 9
C. Scenario Analysis ............................................................................................................... 13
IV. Outlook For Interest Rate Risk Exposures of Japanese Banks under Abenomics ......................... 16
A. The Role of Japanese Banks in the JGB Market ................................................................ 16
B. Scenario Analysis ............................................................................................................... 18
C. Additional Risk Factors ...................................................................................................... 21
V. Conclusion and Policy Implications ................................................................................................ 22
References ............................................................................................................................................ 24
Tables
1. Description of Analytical Scenarios on the Policy Package under Abenomics.....................6
2. Descriptive Statistics for Selected Countries in the Panel ...................................................10 3. Estimation of Determinants of Long-Term Interest Rates ...................................................12 4. Projected Net Purchases of JGBs, 2013–17 .......................................................................199
Figures
1. JGB Market under Abenomics...............................................................................................5 2. Public Debt and Factors Contributing to Low Interest Rates ................................................7
3. Decomposition of Long-Term Interest Rates ......................................................................14 4. Outlook for the Household’s Capacity in Financing JGBs ..................................................15
5. Demand and Supply Balance in the JGB Market ................................................................17 6. Domestic Bond Holdings of Major and Regional Banks.....................................................19 7. Japanese Banks’ Sensitivity to a 100-Basis-Point Interest Rate Shock ...............................21
3
I. INTRODUCTION
Despite the rise in public debts and widening deficits, Japanese government bond (JGB)
yields have remained low and stable. Long-term JGB yields have declined steadily from
7 percent in the 1990s to below 1 percent now, while net public debt has risen from 20 percent of
GDP to 134 percent of GDP in 2012. With public deficits expected to stay above 5 percent up
until 2015, net public debt will likely be close to 150 percent by 2020, the highest among major
advanced economies. Low and stable yields in JGBs are often attributed to Japan’s sizeable pool
of household savings, steady inflows from corporate surpluses, a stable domestic investor base,
higher risk aversion as the population ages, and until recently, safe-haven flows from heightened
global risks.
At the same time, large JGB holdings of Japanese banks imply that even a modest rise in
interest rates can have important implication for financial stability. The large issuance of
JGBs over the last two decades has been financed mostly through the domestic financial sector,
with banks’ JGB holdings currently around 20 percent of total assets and representing an
important exposure to interest rate risk. If interest rates were to rise sharply, losses from such
exposures could reduce capital ratios across a range of financial institutions. For instance, a 100
basis point parallel rise in domestic bond yields could lead to mark-to-market losses of
13 percent of Tier I capital for major banks and 21 percent for regional banks based on latest
available data (Bank of Japan 2013).
This paper studies how Japan’s new macroeconomic policies may affect bond yields and
financial stability. Japan embarked in 2013 on a new policy strategy—the ‘three arrows of
Abenomics’—in an effort to lift growth and exit deflation.2 Financial markets exhibited high
volatility in the immediate aftermath of the monetary easing framework adopted by the Bank of
Japan (BoJ), but have settled down in the following months. The longer-term impact of the
policy package on financial markets is, however, uncertain and depends on whether all the
measures are fully implemented. Given the fundamental change in Japan’s policy framework this
paper studies three key questions:
Can the policy package of Abenomics continue to hold down JGB yields in the face of rising
public debt?
How will the policy package change the outlook on public debt?
Will the policy package, including BoJ’s asset purchases, help reduce banks’ JGB holdings
and interest rate risk exposure over the medium-term?
Based on empirical and scenario analyses, the paper finds supporting evidence for these
questions, but the results are conditional on all three arrows being implemented. First, the
paper examines the key determinants of long-term sovereign yields using a panel of advanced
economies and identifies the key contributing factors to project Japan’s long-term yields. It finds
2 The government’s three-pronged approach to revitalize Japan—known as Abenomics—includes flexible fiscal
policy, aggressive monetary easing, and structural reforms. In that context, the Bank of Japan has introduced a new
quantitative and qualitative monetary easing (QQME) framework by doubling the purchase size of JGBs and
extending the average maturity of JGB holdings to meet the 2 percent inflation target within two years.
4
that deteriorating fiscal conditions would push up long-term rates, and the effect is only partly
offset by demographic factor, stable investor base due to home bias, and an increasing role of the
BoJ’s purchases. In particular, the paper finds that, looking forward, sovereign yields could rise,
as in Hoshi and Ito (2012), unless a full policy package—comprising monetary easing and
credible medium-term fiscal and structural reforms—help contain the rise. Second, under
incomplete policies, gross government debt could exceed household financial assets—an
indicator of domestic market’s capacity in financing JGBs—over a decade, requiring higher
reliance on foreign investors, and possibly also raising sovereign yields. Third, the paper
examines the role of Japanese banks in the JGB markets and how BoJ’s new monetary
framework may affect their balance sheets. Based on this analysis, the paper illustrates that
Japanese banks’ interest rate risk exposures could decline substantially over the next two years as
the BoJ becomes a large buyer of JGBs, but may rise again to current levels if structural and
fiscal reforms disappoint over the medium-term.
The paper extends previous studies in a few dimensions. First, it is the first analysis, to the
authors’ knowledge, to account for Japan’s recent policy changes on the outlook for the JGB
market and banks’ interest rate risk exposures. Besides providing quantitative empirical results
of determinants of long-term yields and interest rate risk exposures in banks’ balance sheet, the
paper also illustrates the possible trajectory of yields and the market’s capacity to finance the
JGBs over the long term. Second, the paper takes advantage of the newly-compiled dataset on
the investor base of sovereign debts across advanced economies (Arslanalp and Tsuda 2012).
Sovereign yields and banks’ interest exposures depend not only on the size of public debt, but
also on who holds the debt. This is particularly relevant for Japan, as the BoJ will become an
even larger player in the JGB market.
The paper is organized as follows. Section II provides some background on the government’s
new policy package and illustrates potential scenarios based on its implementation. Section III
examines the key determinants of long-term sovereign yields using a panel of major advanced
economies. Empirical results are used to illustrate the development of long-term yields and the
financing outlook for the JGB market over the long term under these scenarios. Section IV
analyzes how Japanese banks’ interest rate risk exposures may change under these scenarios.
Section V concludes with some policy implications.
II. BACKGROUND
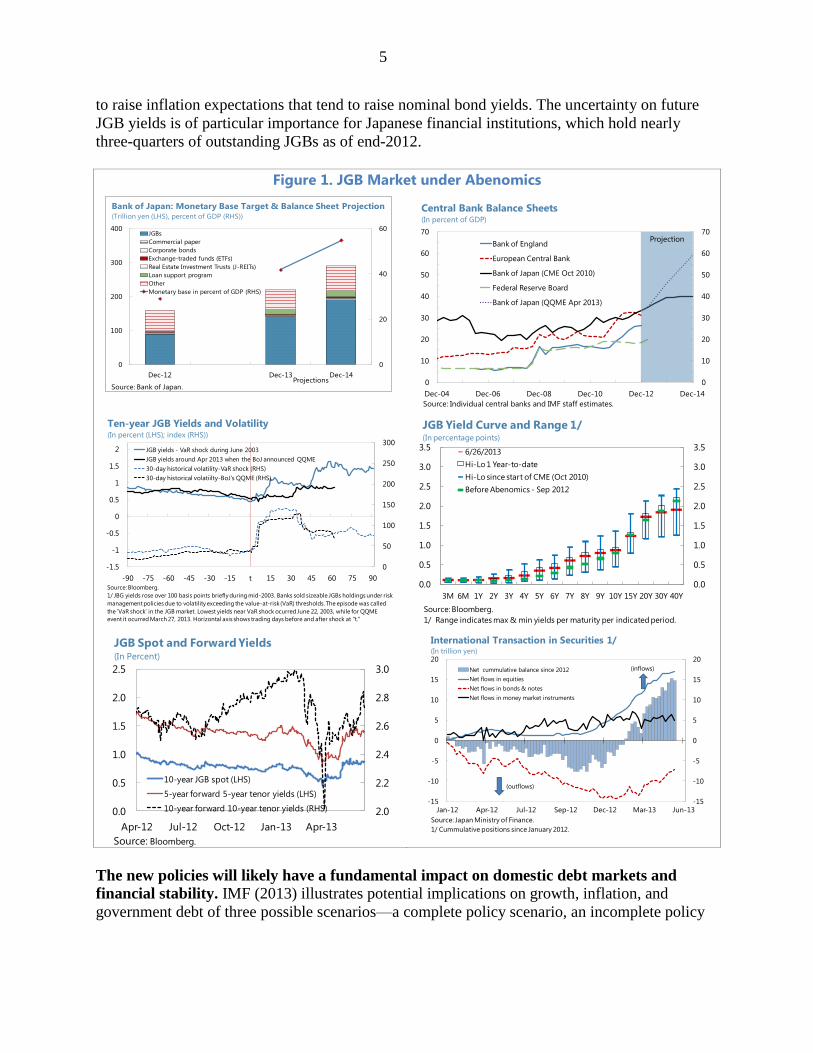
The Japanese government has announced a new policy approach to exit deflation and lift
potential growth. The new strategy—also known as the “three arrows of Abenomics”—includes
a package of policies comprises aggressive monetary easing, flexible fiscal policy, and structural
reforms. As a first step the government introduced a fiscal stimulus program and the BoJ has
introduced a new quantitative and qualitative monetary easing (QQME) framework by doubling
the purchases of JGB and extending the average maturity of JGB holdings to meet the 2 percent
inflation target within two years (Figure 1).
Financial markets exhibited unusual volatility in the immediate aftermath of the QQME
announcement, with JGB volatility about four times higher than the average since the last spike
in 2003 (Figure 1). This volatility likely reflected uncertainty about the net effect from two
opposing effects, namely the BoJ purchases to keep long-term interest rates low and its intention
5
to raise inflation expectations that tend to raise nominal bond yields. The uncertainty on future
JGB yields is of particular importance for Japanese financial institutions, which hold nearly
three-quarters of outstanding JGBs as of end-2012.
Figure 1. JGB Market under Abenomics
The new policies will likely have a fundamental impact on domestic debt markets and
financial stability. IMF (2013) illustrates potential implications on growth, inflation, and
government debt of three possible scenarios—a complete policy scenario, an incomplete policy
0
10
20
30
40
50
60
70
0
10
20
30
40
50
60
70
Dec-04 Dec-06 Dec-08 Dec-10 Dec-12 Dec-14
Bank of England
European Central Bank
Bank of Japan (CME Oct 2010)
Federal Reserve Board
Bank of Japan (QQME Apr 2013)
Projection
Central Bank Balance Sheets(In percent of GDP)
Source: Individual central banks and IMF staff estimates.
0
50
100
150
200
250
300
-1.5
-1
-0.5
0
0.5
1
1.5
2
-90 -75 -60 -45 -30 -15 t 15 30 45 60 75 90
JGB yields - VaR shock during June 2003
JGB yields around Apr 2013 when the BoJ announced QQME
30-day historical volatility-VaR shock (RHS)
30-day historical volatiilty-BoJ's QQME (RHS)
Ten-year JGB Yields and Volatility(In percent (LHS); index (RHS))
Source: Bloomberg.
1/ JBG yields rose over 100 basis points briefly during mid-2003. Banks sold sizeable JGBs holdings under risk
management policies due to volatility exceeding the value-at-risk (VaR) thresholds. The episode was called
the 'VaR shock' in the JGB market. Lowest yields near VaR shock ocurred June 22, 2003, while for QQME
event it ocurred March 27, 2013. Horizontal axis shows trading days before and after shock at "t."
0.0
0.5
1.0
1.5
2.0
2.5
3.0
3.5
0.0
0.5
1.0
1.5
2.0
2.5
3.0
3.5
3M 6M 1Y 2Y 3Y 4Y 5Y 6Y 7Y 8Y 9Y 10Y 15Y 20Y 30Y 40Y
6/26/2013
Hi-Lo 1 Year-to-date
Hi-Lo since start of CME (Oct 2010)
Before Abenomics - Sep 2012
Source: Bloomberg.
1/ Range indicates max & min yields per maturity per indicated period.
JGB Yield Curve and Range 1/(In percentage points)
2.0
2.2
2.4
2.6
2.8
3.0
0.0
0.5
1.0
1.5
2.0
2.5
Apr-12 Jul-12 Oct-12 Jan-13 Apr-13
10-year JGB spot (LHS)
5-year forward 5-year tenor yields (LHS)
10-year forward 10-year tenor yields (RHS)
JGB Spot and Forward Yields(In Percent)
Source: Bloomberg.
-15
-10
-5
0
5
10
15
20
-15
-10
-5
0
5
10
15
20
Jan-12 Apr-12 Jul-12 Sep-12 Dec-12 Mar-13 Jun-13
Net cummulative balance since 2012
Net flows in equities
Net flows in bonds & notes
Net flows in money market instruments
International Transaction in Securities 1/ (In trillion yen)
Source: Japan Ministry of Finance.
1/ Cummulative positions since January 2012.
(outflows)
(inflows)
0
20
40
60
0
100
200
300
400
Dec-12 Dec-13 Dec-14
JGBs
Commercial paper
Corporate bonds
Exchange-traded funds (ETFs)
Real Estate Investment Trusts (J-REITs)
Loan support program
Other
Monetary base in percent of GDP (RHS)
Source: Bank of Japan.Projections
Bank of Japan: Monetary Base Target & Balance Sheet Projection(Trillion yen (LHS), percent of GDP (RHS))
6
scenario, and a pre-Abenomics baseline scenario.3 Under the complete policy scenario, the
authorities adopt ambitious structural reforms that raise trend growth from 1 to 2 percent over the
next decade. Along with QQME and medium-term fiscal consolidation, the complete package
would align inflation expectations quickly, leading to lower government funding needs. In
contrast, under the incomplete package scenario, inflation expectations adjust in a sluggish
manner to QQME, possibly because of the lack of a structural reform program, requiring further
fiscal stimulus to close the output gap and boost inflation in the near term. The lack of medium-
term fiscal adjustment and a rising risk premium result in higher government debt and the
eventual decline in output to below the pre-Abenomics baseline (Table 1). Based on the same
scenarios, the paper explores the implications of complete and incomplete policy packages on
long-term interest rates and banks’ balance sheet exposures.
Table 1. Description of Analytical Scenarios on the Policy Package under Abenomics
Scenarios Description
1. Baseline The pre-Abenomics baseline is taken as the December 2012 forecasts in
the World Economic Outlook.
2. Complete policy
package
Ambitious structural reforms are taken to raise the trend long-term
growth to 2 percent (IMF 2013).
Inflation expectations are aligned to the inflation target quickly within
the timeframe forecast by the BoJ.
Medium-term fiscal adjustments are undertaken to bring down debt in a
downward trajectory.
3. Incomplete policy
package
Long-term growth remains stagnant without structural reforms.
Inflation expectations align only gradually in a sluggish manner.
Further fiscal stimulus is taken to stimulate the near-term growth, but a
lack of medium-term fiscal adjustment leads to rising risk premium.
III. OUTLOOK FOR INTEREST RATES UNDER ABENOMICS
A. Literature Review
Several studies have tried to explain the seemingly weak empirical relationship between
public debt and long-term yields in Japan resorting to a number of different temporary
causes. Tokuoka (2010) argues that, although several factors (see below) have contributed to low
JGB yields, the market’s capacity to absorb public debt is likely to diminish as the population
ages. Gross household financial assets could fall short of the rising public debt by FY2015-
FY2020. In a follow-up paper, Lam and Tokuoka (2011) examine financial risks and possible
triggers in the JGB market. Hoshi and Ito (2012) illustrate various scenarios on how long-term
JGB yields can remain low and stable (defying gravity) and conclude that, as JGB financing will
have to rely more on foreign investors, yields will likely rise unless drastic fiscal adjustments are
put in place. Baba (2012) argues that the turning of Japan’s current account balance from
surpluses into deficits will exert upward pressures on JGB yields. Ichiue and Shimizu (2012)
3 See IMF Country Report No. 13/253 (Box 1) for a detailed discussion of the potential effects of these scenarios on
growth, inflation and debt.
7
estimate factors driving long-term interest rates across advanced economies and apply the results
to Japan and the United States. They find that demography and growth play a key role in
determining long-term rates but their analysis does not fully account for recent policy changes
and how those factors may evolve over the long term.
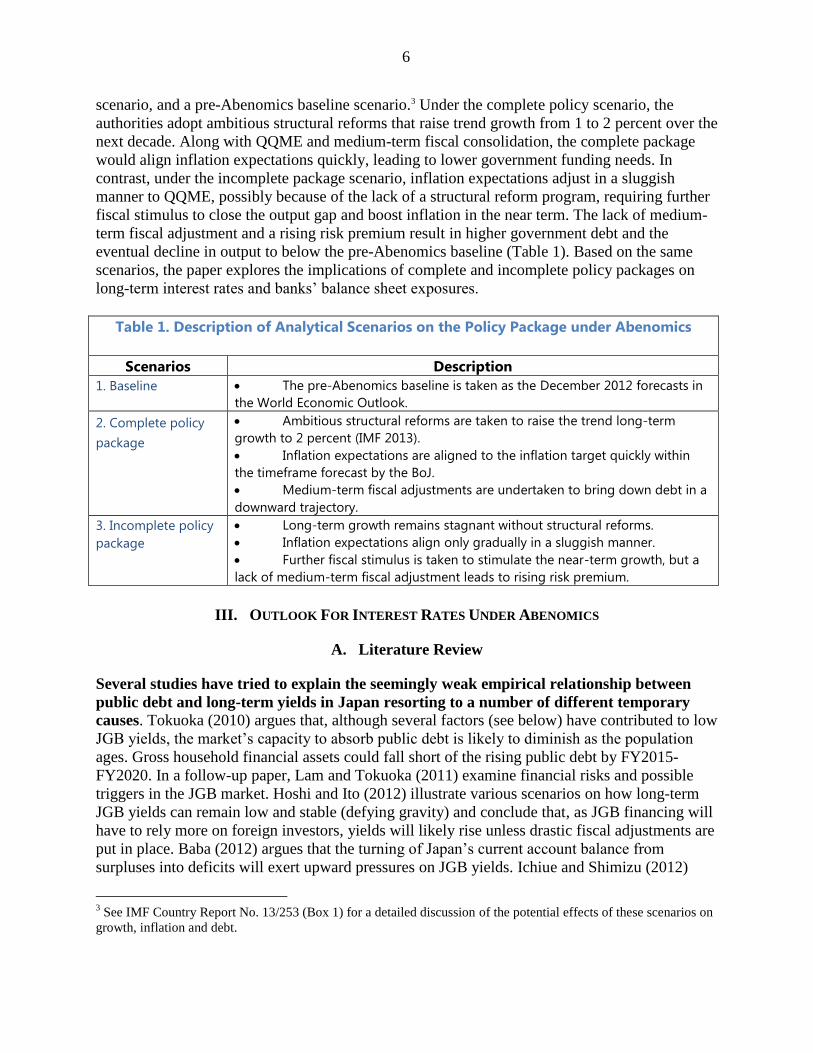
The most common factors cited as contributing to low and stable JGB yields are (Figure 2):
Sustained deflation and low potential growth.
The outlook of long-term JGBs financing is influenced by real growth and inflation
dynamics. Persistent deflation and sluggish growth over the last two decades have
contributed to a sharp decline of nominal yields and kept real yields relatively higher. In
addition, policies that strengthen or weaken the growth and inflation paths would likely affect
long-term yields.
Figure 2. Public Debt and Factors Contributing to Low Interest Rates
0.0
0.5
1.0
1.5
2.0
2.5
3.0
3.5
4.0
4.5
0
20
40
60
80
100
120
140
160
1995 1998 2001 2004 2007 2010
Net public sector debt to GDP (LHS)
Average nominal interest rate on public debt (RHS)
Net Debt Ratio and Interest Rate on Public Debt(In percent of GDP (LHS); in percent (RHS))
Source: IMF staff estimates.
-10
-8
-6
-4
-2
0
2
4
6
8
10
19
81
Q1
19
82
Q1
19
83
Q1
19
84
Q1
19
85
Q1
19
86
Q1
19
87
Q1
19
88
Q1
19
89
Q1
19
90
Q1
19
91
Q1
19
92
Q1
19
93
Q1
19
94
Q1
19
95
Q1
19
96
Q1
19
97
Q1
19
98
Q1
19
99
Q1
20
00
Q1
20
01
Q1
20
02
Q1
20
03
Q1
20
04
Q1
20
05
Q1
20
06
Q1
20
07
Q1
20
08
Q1
20
09
Q1
20
10
Q1
20
11
Q1
20
12
Q1
Inflation Real GDP growth
Japan: Quarter-on-quarter Annualized Growth and Inflation
(in percent; 4-quarter moving average)
Sources: WEO; IFS
-14
-12
-10
-8
-6
-4
-2
0
Au
stra
lia
Can
ad
a
Fra
nce
Germ
an
y
Italy
Jap
an
New
Zeala
nd
No
rway
Sw
ed
en
Sw
itze
rlan
d
Un
ited
Kin
gd
om
Un
ited
Sta
tes
Cumulative Decline of Working-Age Population
Ratio (between 2010-2050)(in percent)
Source: United Nation
960
12.0%
8.7%
0%
5%
10%
15%
20%
0
200
400
600
800
1000
1200
2001 2002 2003 2004 2005 2006 2007 2008 2009 2010 2011 2012
Banks Insurance Public Pension Funds
BOJ Foreigners Others
Share of BOJ (RHS) Share of Foreigners (RHS)
Holdings of JGBs, by Investor Base(in trillions of yen and in percent of total outstanding JGBs as of end-2012)
Sources: BOJ Flow of Funds
Notes: JGBs include FILP bonds and T-bills. Post Bank is included in "Banks."
-100
-50
0
50
100
150
200
Sw
itze
rlan
d
No
rway
Jap
an
Germ
an
y
Un
ited
Kin
gd
om
Eu
ro A
rea
Sw
ed
en
Can
ad
a
Fra
nce
Un
ited
Sta
tes
Italy
Au
stra
lia
New
Zeala
nd
International Investment Position--Net Assets(in percent of GDP; end-2012)
Sources: IFS.
1/ Data as of end-2012 if available, otherwise it is an average of quarterly data available for 2012.
0
10
20
30
40
50
60
70
80
90
100
Jap
an
Ko
rea
Czech
Rep
ub
lic
Can
ad
a
Un
ited
Kin
gd
om
Sp
ain
Au
stra
lia
Un
ited
Sta
tes
Den
mark
No
rway
Italy
Sw
ed
en
New
Zeala
nd
Slo
ven
ia
Belg
ium
Neth
erl
an
ds
Fra
nce
Gre
ece
Po
rtu
gal
Germ
an
y
Irela
nd
Au
stri
a
Fin
lan
d
Share of General Government Securities Held by Domestic Sector
(in percent of total public securities)
Source: Arslanalp and Tsuda (2012).Source: United Nations.
8
Expectations of future fiscal adjustments—The total tax-to-GDP ratio for Japan is still low at
around 30 percent (including payment into the social security system) and has room to
increase to a level comparable to European countries to narrow the financing gap in
government finance. This might create the public perception that although deteriorating fiscal
conditions are likely to exert an upward pressure on long-term rates, drastic fiscal reforms
could be taken to restore fiscal sustainability before the public debt exceeds private sector
savings.
External surpluses—Unlike most other advanced economies, Japan has sizeable net foreign
assets (over 50 percent of GDP) and has run a current account surplus over the past decade,
supported by steady and large net-income flows. This reduces the reliance on foreign
investors in financing JGBs, and combined with stable investor base (see below), tend to
keep yields low and stable.
Large private stock of savings—Japan had enjoyed high household saving rates (over
10 percent) until around 1999 when they began to decline sharply. This contributed to a large
accumulation of household financial assets, helping to finance the build-up of public debt. In
addition recent large surpluses in the corporate sector have played a supporting role in
channeling funds to finance JGBs.
Population aging—Population aging will reduce labor force participation and potential
growth. At the same time, elderly households tend to have a higher risk aversion and home
bias and prefer holding safe assets such as JGBs, although the elderly tend to have lower
saving rates.4 More than half of the households’ financial assets are held in the form of
currency and deposits. This is likely to exert downward pressure on long-term interest rates.
Stable investor base—Over 90 percent of JGBs are held by domestic investors, which has not
changed substantially during the global financial crisis. This is in contrast to other advanced
economies, where rising sovereign debt has been met with an increasing reliance on foreign
investors, possibly posing a higher refinancing risk. This advantage, however, needs to be
weighed against potential vulnerabilities from increasing sovereign-financial linkages in
Japan.
The development of long-term sovereign yields has also been a key area in policy
discussions in other major advanced economies. There is a growing concern that long-term
yields across advanced economies (e.g., United Kingdom, and the United States) have been at
historical lows that diverge from the levels consistent with economic fundamentals, largely
attributed to the unconventional monetary policies of central banks. Andritzky (2012) and
Arslanalp and Poghosyan (2013) find that net foreign sales and purchases of government debt
have played a key role in determining long-term sovereign bond yields. The impact of fiscal
positions on sovereign yields after the global financial crisis appears to be more modest in cross-
4 Hasegawa and Lam (2011) examines the saving behavior across age and cohort groups using household survey
data and finds that over the medium term, the effect of risk aversion on asset allocation toward government
securities among the elderly is likely to exceed the impact of a reduction of elderly saving rates.
9
country empirical studies (Laubach 2003, Ardagna, Caselli, and Lane 2004, Alper and Forni
2011, Poghosyan 2012, Ichiue and Shimizu 2012). 5
B. A Panel Analysis on the Determinants of Long-Term Interest Rates
The empirical analysis builds on the current literature on the determinants of long-term
yields across advanced economies. Countries in the panel estimation include Australia, Canada,
France, Italy, Germany, Japan, New Zealand, Norway, Sweden, Switzerland, the United
Kingdom, and the United States. Euro area countries other than Germany are excluded as interest
rates across euro area were aligned until the euro area debt crisis broke out (in some
specification, France and Italy are included as well for robustness check on the estimated
results).6 The sample period spans from 1990 to 2012 using annual data. The dynamic panel
estimation is expressed as:
with variables expressing expectations at time t for period ahead; j denotes country in the cross-
section group. The dependent variable is the nominal forward rate of 5–10 years ahead
(that is, 5-year forward of 5-year tenor rates).7 EXT and FIS are vectors of variables related to
external and fiscal conditions both in terms of flows and stocks. Variables for external conditions
include the current account balance and the net external balance as a percent of GDP. Fiscal
variables include (i) net government debt and/or public assets as a percent of GDP as stock
variables; and (ii) primary balance or cyclical fiscal balance as a percent of GDP as flow
variables. A dummy variable is introduced to interact with fiscal variables to assess whether
structural differences occurred after the global financial crisis given that sovereign bonds in
some countries were perceived as safe haven assets. DG is the demographic factor measured by
the (annualized) growth rate of the working-age population ratio. Variables y and refer to real
growth and inflation. The regression extends beyond other empirical studies by analyzing the
role of the investor base in affecting long-term sovereign yields. InvBase refers to the portion of
sovereign bonds held by central banks, foreign nonofficial entities, or domestic financial
institutions depending on the specification.
5 Earlier empirical studies on the impact of fiscal deficits include Baldacci, Gupta, and Mati (2009) on emerging
markets; Faini (2006) on Europe; Hauner and Kumar (2006) on G7 countries; Engen and Hubbard (2004) and
Laubach (2003) on the United States; Kinoshita (2006), and Ardagna, Caselli, and Lane (2004) on OECD countries.
Brook (2003) provides a comprehensive list of studies with estimates. These empirical studies, which examined the
impact of deficits or debt on long-term government bond yields, find that a 1 percentage point increase in the fiscal
deficits to GDP ratio would raise long-term yields by 10-60 basis points. Studies based on general equilibrium
structural models find that a 1 percentage point rise in the public debt to GDP ratio would raise yields by 10 basis
points at most. 6 Regression estimates for two groups of countries are included. Group 1 includes all countries except France and
Italy as they are in the euro area broadly represented by Germany, while Group 2 includes both France and Italy. 7 Data on 5-year forward of 10-year tenor rates or 10-year forward of 10-year tenor rates are not available for long
periods dating back to 1990 and are difficult to be estimated without 15-year or 20-year sovereign bonds in several
countries.
10
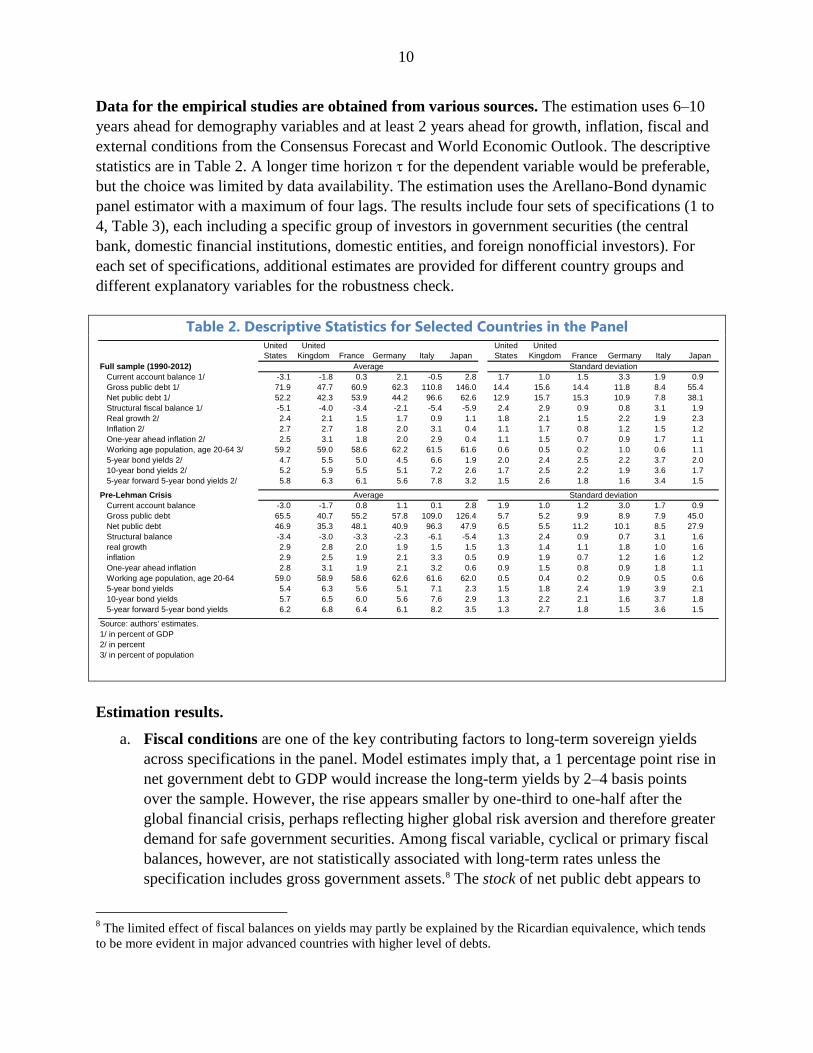
Data for the empirical studies are obtained from various sources. The estimation uses 6–10
years ahead for demography variables and at least 2 years ahead for growth, inflation, fiscal and
external conditions from the Consensus Forecast and World Economic Outlook. The descriptive
statistics are in Table 2. A longer time horizon for the dependent variable would be preferable,
but the choice was limited by data availability. The estimation uses the Arellano-Bond dynamic
panel estimator with a maximum of four lags. The results include four sets of specifications (1 to
4, Table 3), each including a specific group of investors in government securities (the central
bank, domestic financial institutions, domestic entities, and foreign nonofficial investors). For
each set of specifications, additional estimates are provided for different country groups and
different explanatory variables for the robustness check.
Table 2. Descriptive Statistics for Selected Countries in the Panel
Estimation results.
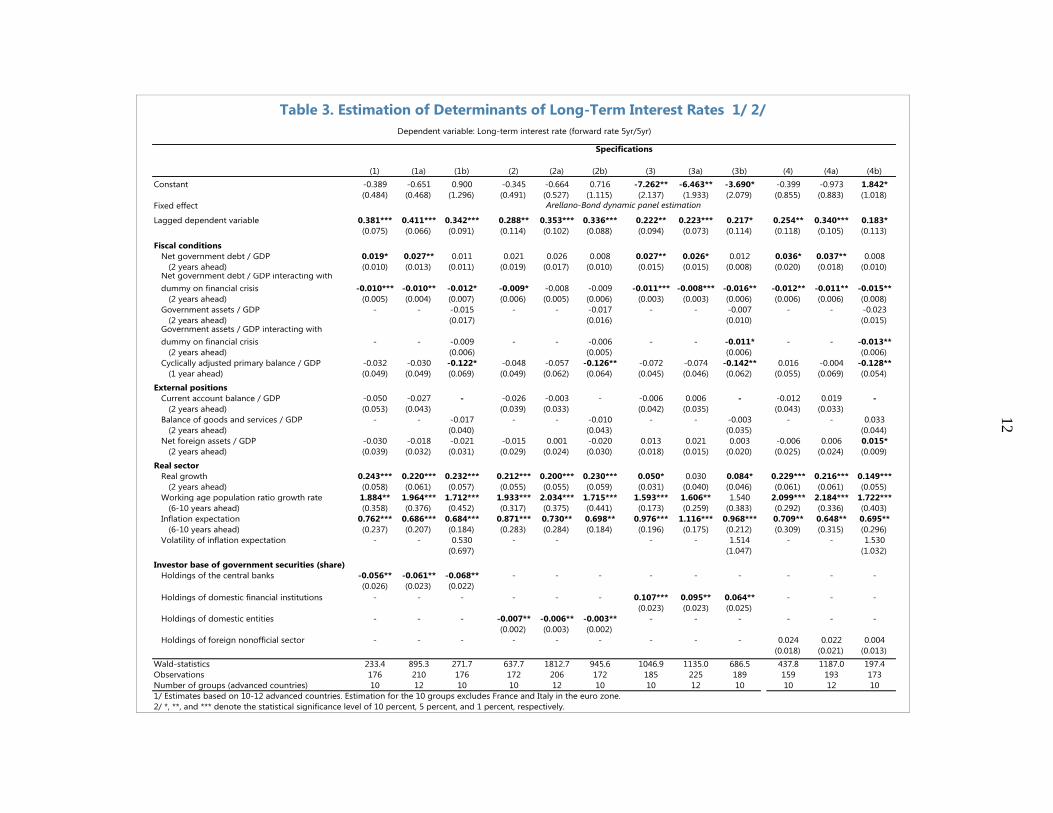
a. Fiscal conditions are one of the key contributing factors to long-term sovereign yields
across specifications in the panel. Model estimates imply that, a 1 percentage point rise in
net government debt to GDP would increase the long-term yields by 2–4 basis points
over the sample. However, the rise appears smaller by one-third to one-half after the
global financial crisis, perhaps reflecting higher global risk aversion and therefore greater
demand for safe government securities. Among fiscal variable, cyclical or primary fiscal
balances, however, are not statistically associated with long-term rates unless the
specification includes gross government assets.8 The stock of net public debt appears to
8 The limited effect of fiscal balances on yields may partly be explained by the Ricardian equivalence, which tends
to be more evident in major advanced countries with higher level of debts.
United
States
United
Kingdom France Germany Italy Japan
United
States
United
Kingdom France Germany Italy Japan
Full sample (1990-2012)
Current account balance 1/ -3.1 -1.8 0.3 2.1 -0.5 2.8 1.7 1.0 1.5 3.3 1.9 0.9
Gross public debt 1/ 71.9 47.7 60.9 62.3 110.8 146.0 14.4 15.6 14.4 11.8 8.4 55.4
Net public debt 1/ 52.2 42.3 53.9 44.2 96.6 62.6 12.9 15.7 15.3 10.9 7.8 38.1
Structural fiscal balance 1/ -5.1 -4.0 -3.4 -2.1 -5.4 -5.9 2.4 2.9 0.9 0.8 3.1 1.9
Real growth 2/ 2.4 2.1 1.5 1.7 0.9 1.1 1.8 2.1 1.5 2.2 1.9 2.3
Inflation 2/ 2.7 2.7 1.8 2.0 3.1 0.4 1.1 1.7 0.8 1.2 1.5 1.2
One-year ahead inflation 2/ 2.5 3.1 1.8 2.0 2.9 0.4 1.1 1.5 0.7 0.9 1.7 1.1
Working age population, age 20-64 3/ 59.2 59.0 58.6 62.2 61.5 61.6 0.6 0.5 0.2 1.0 0.6 1.1
5-year bond yields 2/ 4.7 5.5 5.0 4.5 6.6 1.9 2.0 2.4 2.5 2.2 3.7 2.0
10-year bond yields 2/ 5.2 5.9 5.5 5.1 7.2 2.6 1.7 2.5 2.2 1.9 3.6 1.7
5-year forward 5-year bond yields 2/ 5.8 6.3 6.1 5.6 7.8 3.2 1.5 2.6 1.8 1.6 3.4 1.5
Pre-Lehman Crisis
Current account balance -3.0 -1.7 0.8 1.1 0.1 2.8 1.9 1.0 1.2 3.0 1.7 0.9
Gross public debt 65.5 40.7 55.2 57.8 109.0 126.4 5.7 5.2 9.9 8.9 7.9 45.0
Net public debt 46.9 35.3 48.1 40.9 96.3 47.9 6.5 5.5 11.2 10.1 8.5 27.9
Structural balance -3.4 -3.0 -3.3 -2.3 -6.1 -5.4 1.3 2.4 0.9 0.7 3.1 1.6
real growth 2.9 2.8 2.0 1.9 1.5 1.5 1.3 1.4 1.1 1.8 1.0 1.6
inflation 2.9 2.5 1.9 2.1 3.3 0.5 0.9 1.9 0.7 1.2 1.6 1.2
One-year ahead inflation 2.8 3.1 1.9 2.1 3.2 0.6 0.9 1.5 0.8 0.9 1.8 1.1
Working age population, age 20-64 59.0 58.9 58.6 62.6 61.6 62.0 0.5 0.4 0.2 0.9 0.5 0.6
5-year bond yields 5.4 6.3 5.6 5.1 7.1 2.3 1.5 1.8 2.4 1.9 3.9 2.1
10-year bond yields 5.7 6.5 6.0 5.6 7.6 2.9 1.3 2.2 2.1 1.6 3.7 1.8
5-year forward 5-year bond yields 6.2 6.8 6.4 6.1 8.2 3.5 1.3 2.7 1.8 1.5 3.6 1.5
Source: authors' estimates.
1/ in percent of GDP
2/ in percent
3/ in percent of population
Average
Average
Standard deviation
Standard deviation
11
be more influential in determining long-term interest rates, but the effect is likely to be
nonlinear depending on the level of public debt (see caveats below).
b. External conditions appear to affect long-term rates but are seldom statistically
significant. This runs counter to the idea that Japan would run into a fiscal crisis when the
current account moves into deficits. The estimates suggest that government debt may
become unsustainable even when the current account stays in surplus if domestic savers
refuse to finance the public debt at a low rate. On the contrary, a fiscal crisis may not
happen even when the current account moves into deficits, if the change is the result of
strong direct investment inflows that raise growth potential. Despite limited evidence on
the role of trade deficits on long-term interest rates, deteriorating external conditions in
Japan would imply a heavier reliance of foreign investors in financing public debt.
c. Inflation and growth expectations are also key factors in affecting long-term rates. The
estimated coefficients for inflation expectations are strongly significant, as expected, and
in many specifications the coefficients are not statistically different from one, which is
consistent with economic theory. In that context, real forward rates (nominal net of
inflation expectations) are also used as dependent variable for robustness purposes. The
sign of coefficients for most explanatory variables remain broadly similar. Volatility of
inflation expectations does not appear to affect the level of long-term rates. Coefficients
on real growth expectations across specifications are also statistically significant and
have an expected positive sign. As Abenomics aims to exit deflation and raise long-term
growth, a successful policy package could likely raise growth and inflation expectations
that would increase the long-term nominal yields. Nonetheless, higher growth would also
help mitigate the rise in public debts, offsetting some of the rise in nominal yields.
d. A reduction in the working-age population tends to reduce the long-term interest rates,
possibly due to preference towards safer assets as the population ages.9 The magnitude
appears to be significant and its contribution to the level of the interest rate is large.
e. The composition of the investor base for government securities is important for long-
term interest rates. Higher holdings by domestic entities tend to lower interest rates, but
the cross-country estimates show that this reduction is mostly driven by central banks’
holdings rather than holdings by domestic financial institutions. On the other hand, higher
holdings of government securities by the foreign nonofficial sector tend to raise yields,
but this does not seem to be statistically significant.
In sum, empirical results suggest that the upward pressure on long-term JGB yields from
deteriorating fiscal conditions has been offset so far by other factors, including a stable domestic
investor base with a preference for safe assets and increased purchases by the BoJ, but these
effects are likely to decline over the medium term.
9 Population aging could lead to an aggregate increase in the rate of time preference, given the remaining life
expectancy as a whole is declining, but that effect may be more than offset by the higher preference on safer assets.
1
2
Table 3. Estimation of Determinants of Long-Term Interest Rates 1/ 2/
(1) (1a) (1b) (2) (2a) (2b) (3) (3a) (3b) (4) (4a) (4b)
Constant -0.389 -0.651 0.900 -0.345 -0.664 0.716 -7.262** -6.463** -3.690* -0.399 -0.973 1.842*
(0.484) (0.468) (1.296) (0.491) (0.527) (1.115) (2.137) (1.933) (2.079) (0.855) (0.883) (1.018)
Fixed effect
Lagged dependent variable 0.381*** 0.411*** 0.342*** 0.288** 0.353*** 0.336*** 0.222** 0.223*** 0.217* 0.254** 0.340*** 0.183*
(0.075) (0.066) (0.091) (0.114) (0.102) (0.088) (0.094) (0.073) (0.114) (0.118) (0.105) (0.113)
Fiscal conditions
Net government debt / GDP 0.019* 0.027** 0.011 0.021 0.026 0.008 0.027** 0.026* 0.012 0.036* 0.037** 0.008
(2 years ahead) (0.010) (0.013) (0.011) (0.019) (0.017) (0.010) (0.015) (0.015) (0.008) (0.020) (0.018) (0.010)Net government debt / GDP interacting with
dummy on financial crisis -0.010*** -0.010** -0.012* -0.009* -0.008 -0.009 -0.011*** -0.008*** -0.016** -0.012** -0.011** -0.015**
(2 years ahead) (0.005) (0.004) (0.007) (0.006) (0.005) (0.006) (0.003) (0.003) (0.006) (0.006) (0.006) (0.008)
Government assets / GDP - - -0.015 - - -0.017 - - -0.007 - - -0.023
(2 years ahead) (0.017) (0.016) (0.010) (0.015)Government assets / GDP interacting with
dummy on financial crisis - - -0.009 - - -0.006 - - -0.011* - - -0.013**
(2 years ahead) (0.006) (0.005) (0.006) (0.006)
Cyclically adjusted primary balance / GDP -0.032 -0.030 -0.122* -0.048 -0.057 -0.126** -0.072 -0.074 -0.142** 0.016 -0.004 -0.128**
(1 year ahead) (0.049) (0.049) (0.069) (0.049) (0.062) (0.064) (0.045) (0.046) (0.062) (0.055) (0.069) (0.054)
External positions
Current account balance / GDP -0.050 -0.027 - -0.026 -0.003 - -0.006 0.006 - -0.012 0.019 -
(2 years ahead) (0.053) (0.043) (0.039) (0.033) (0.042) (0.035) (0.043) (0.033)
Balance of goods and services / GDP - - -0.017 - - -0.010 - - -0.003 - - 0.033
(2 years ahead) (0.040) (0.043) (0.035) (0.044)
Net foreign assets / GDP -0.030 -0.018 -0.021 -0.015 0.001 -0.020 0.013 0.021 0.003 -0.006 0.006 0.015*
(2 years ahead) (0.039) (0.032) (0.031) (0.029) (0.024) (0.030) (0.018) (0.015) (0.020) (0.025) (0.024) (0.009)
Real sector
Real growth 0.243*** 0.220*** 0.232*** 0.212*** 0.200*** 0.230*** 0.050* 0.030 0.084* 0.229*** 0.216*** 0.149***
(2 years ahead) (0.058) (0.061) (0.057) (0.055) (0.055) (0.059) (0.031) (0.040) (0.046) (0.061) (0.061) (0.055)
Working age population ratio growth rate 1.884** 1.964*** 1.712*** 1.933*** 2.034*** 1.715*** 1.593*** 1.606** 1.540 2.099*** 2.184*** 1.722***
(6-10 years ahead) (0.358) (0.376) (0.452) (0.317) (0.375) (0.441) (0.173) (0.259) (0.383) (0.292) (0.336) (0.403)
Inflation expectation 0.762*** 0.686*** 0.684*** 0.871*** 0.730** 0.698** 0.976*** 1.116*** 0.968*** 0.709** 0.648** 0.695**
(6-10 years ahead) (0.237) (0.207) (0.184) (0.283) (0.284) (0.184) (0.196) (0.175) (0.212) (0.309) (0.315) (0.296)
Volatility of inflation expectation - - 0.530 - - - - 1.514 - - 1.530
(0.697) (1.047) (1.032)
Investor base of government securities (share)
Holdings of the central banks -0.056** -0.061** -0.068** - - - - - - - - -
(0.026) (0.023) (0.022)
Holdings of domestic financial institutions - - - - - - 0.107*** 0.095** 0.064** - - -
(0.023) (0.023) (0.025)
Holdings of domestic entities - - - -0.007** -0.006** -0.003** - - - - - -
(0.002) (0.003) (0.002)
Holdings of foreign nonofficial sector - - - - - - - - - 0.024 0.022 0.004
(0.018) (0.021) (0.013)
Wald-statistics 233.4 895.3 271.7 637.7 1812.7 945.6 1046.9 1135.0 686.5 437.8 1187.0 197.4
Observations 176 210 176 172 206 172 185 225 189 159 193 173
Number of groups (advanced countries) 10 12 10 10 12 10 10 12 10 10 12 10
1/ Estimates based on 10-12 advanced countries. Estimation for the 10 groups excludes France and Italy in the euro zone.
2/ *, **, and *** denote the statistical significance level of 10 percent, 5 percent, and 1 percent, respectively.
Arellano-Bond dynamic panel estimation
Specifications
Dependent variable: Long-term interest rate (forward rate 5yr/5yr)
13
C. Scenario Analysis
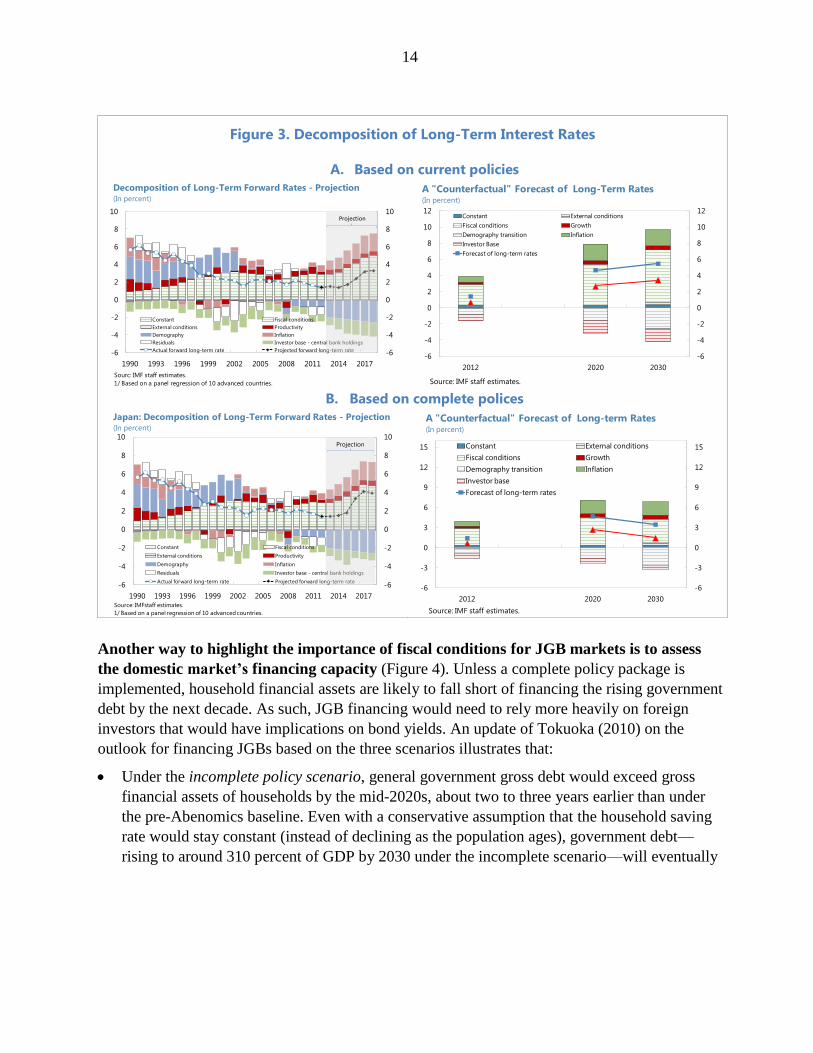
The estimates allow a quantitative assessment of the extent to which each factor drives long-
term rates over time (Figure 3). As the primary interest is the evolution of long-term rates under
the QQME and rising public debts, estimates from specification (1) are used to obtain the
contributions of each factor. The analysis uses the baseline growth and inflation forecasts from
the December 2012 World Economic Outlook, which forecast potential growth and inflation
reaching 1 percent and 2 percent, respectively, under the baseline. Medium-term external
positions are also obtained from the World Economic Outlook, while long-term forecast of
current account balances are taken from Hoshi and Ito (2012). The fiscal deficits and debt profiles
are obtained from the IMF’s estimates under the debt sustainability analysis as in IMF (2013).
Demographic projections are taken from the United Nations.
Based on current policies, deteriorating fiscal conditions over the medium term are likely to
exert upward pressures on long-term interest rates (Figure 3 upper charts). The
decomposition suggests that low growth, disinflation, and aging of the population since the mid-
2000s have contributed to the low and stable long-term rates, which have more than offset the
impact of the deterioration in fiscal conditions. The sizeable purchases by the BoJ are likely to
keep long-term rates lower by 70–150 basis points for the next few years under the QQME.
Long-term rates, however, are expected to rise to 4½ percent by 2020 and nearly 5½ percent by
2030. This represents a 4 percentage points increase in long-term yields from 2012 to 2030, to
which deterioration in fiscal conditions would contribute 3½ percentage points (about
3 percentage points from the projected rise in the net public debt ratio from 134 percent in 2012
to near 210 percent of GDP by 2030 and another ½ percentage point from larger fiscal deficits).
Inflation and higher growth would add another 2 percentage points and shrinking external
surpluses a further ½ percentage points. The net increase, however, would be much smaller
because of population aging (-1¼ percentage points), BoJ purchases (-¾ percentage points), and
other factors.
Under a complete policy package, the long-term interest rates are likely to remain stable in
the long run (Figure 3 lower charts). As discussed in Section II, the complete policy package
assumes credible fiscal policy adjustments and structural reforms that will achieve a declining
public debt trajectory and higher potential growth (IMF 2013).10 In addition, this analysis further
assumes no further monetary easing by the BoJ after achieving the inflation target. In this regard,
higher growth and lower holdings by the BoJ would push interest rates up slightly over the
medium term, relative to the baseline, while the near-term interest rates remain low and stable.
Notably, lower public debt ratios, together with long-term primary surpluses, would keep long-
term nominal interest rates at stable levels at about 3-4 percent over the long term. This implies
that real interest rates would be in the range of 1.2–1.9 percent.
10
Structural reform measures include addressing labor market duality, raising labor participation of women and the
elderly, advancing SME restructuring through less barriers of firm entries and phasing out excessive credit
guarantees, and providing more risk capital for start-ups.
14
Figure 3. Decomposition of Long-Term Interest Rates
A. Based on current policies
B. Based on complete polices
Another way to highlight the importance of fiscal conditions for JGB markets is to assess
the domestic market’s financing capacity (Figure 4). Unless a complete policy package is
implemented, household financial assets are likely to fall short of financing the rising government
debt by the next decade. As such, JGB financing would need to rely more heavily on foreign
investors that would have implications on bond yields. An update of Tokuoka (2010) on the
outlook for financing JGBs based on the three scenarios illustrates that:
Under the incomplete policy scenario, general government gross debt would exceed gross
financial assets of households by the mid-2020s, about two to three years earlier than under
the pre-Abenomics baseline. Even with a conservative assumption that the household saving
rate would stay constant (instead of declining as the population ages), government debt—
rising to around 310 percent of GDP by 2030 under the incomplete scenario—will eventually
-6
-4
-2
0
2
4
6
8
10
-6
-4
-2
0
2
4
6
8
10
1990 1993 1996 1999 2002 2005 2008 2011 2014 2017
Constant Fiscal conditions
External conditions Productivity
Demography Inflation
Residuals Investor base - central bank holdings
Actual forward long-term rate Projected forward long-term rate
Decomposition of Long-Term Forward Rates - Projection(In percent)
Sourc: IMF staff estimates.
1/ Based on a panel regression of 10 advanced countries.
Projection
-6
-4
-2
0
2
4
6
8
10
12
-6
-4
-2
0
2
4
6
8
10
12
2012 2020 2030
Constant External conditions
Fiscal conditions Growth
Demography transition Inflation
Investor Base
Forecast of long-term rates
A "Counterfactual" Forecast of Long-Term Rates(In percent)
Source: IMF staff estimates.
-6
-4
-2
0
2
4
6
8
10
-6
-4
-2
0
2
4
6
8
10
1990 1993 1996 1999 2002 2005 2008 2011 2014 2017
Constant Fiscal conditions
External conditions Productivity
Demography Inflation
Residuals Investor base - central bank holdings
Actual forward long-term rate Projected forward long-term rate
Japan: Decomposition of Long-Term Forward Rates - Projection(In percent)
Source: IMFstaff estimates.
1/ Based on a panel regression of 10 advanced countries.
Projection
-6
-3
0
3
6
9
12
15
-6
-3
0
3
6
9
12
15
2012 2020 2030
Constant External conditions
Fiscal conditions Growth
Demography transition Inflation
Investor base
Forecast of long-term rates
A "Counterfactual" Forecast of Long-term Rates(In percent)
Source: IMF staff estimates.
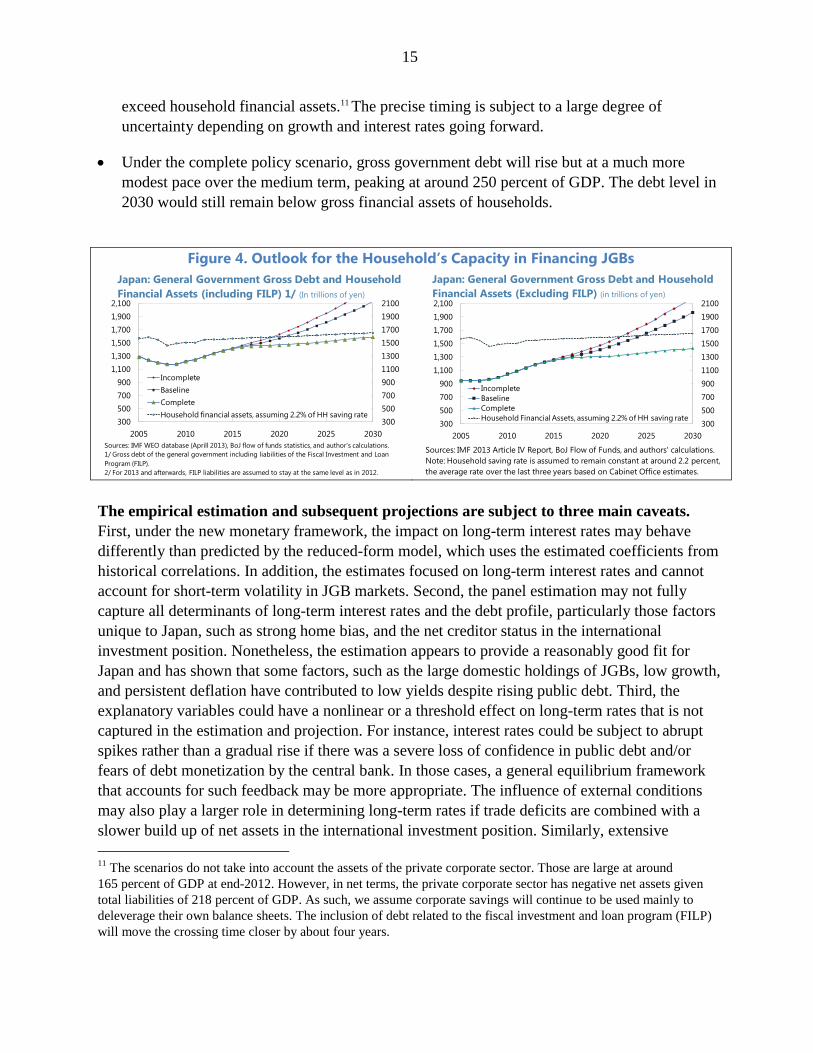
15
exceed household financial assets.11 The precise timing is subject to a large degree of
uncertainty depending on growth and interest rates going forward.
Under the complete policy scenario, gross government debt will rise but at a much more
modest pace over the medium term, peaking at around 250 percent of GDP. The debt level in
2030 would still remain below gross financial assets of households.
Figure 4. Outlook for the Household’s Capacity in Financing JGBs
The empirical estimation and subsequent projections are subject to three main caveats.
First, under the new monetary framework, the impact on long-term interest rates may behave
differently than predicted by the reduced-form model, which uses the estimated coefficients from
historical correlations. In addition, the estimates focused on long-term interest rates and cannot
account for short-term volatility in JGB markets. Second, the panel estimation may not fully
capture all determinants of long-term interest rates and the debt profile, particularly those factors
unique to Japan, such as strong home bias, and the net creditor status in the international
investment position. Nonetheless, the estimation appears to provide a reasonably good fit for
Japan and has shown that some factors, such as the large domestic holdings of JGBs, low growth,
and persistent deflation have contributed to low yields despite rising public debt. Third, the
explanatory variables could have a nonlinear or a threshold effect on long-term rates that is not
captured in the estimation and projection. For instance, interest rates could be subject to abrupt
spikes rather than a gradual rise if there was a severe loss of confidence in public debt and/or
fears of debt monetization by the central bank. In those cases, a general equilibrium framework
that accounts for such feedback may be more appropriate. The influence of external conditions
may also play a larger role in determining long-term rates if trade deficits are combined with a
slower build up of net assets in the international investment position. Similarly, extensive
11
The scenarios do not take into account the assets of the private corporate sector. Those are large at around
165 percent of GDP at end-2012. However, in net terms, the private corporate sector has negative net assets given
total liabilities of 218 percent of GDP. As such, we assume corporate savings will continue to be used mainly to
deleverage their own balance sheets. The inclusion of debt related to the fiscal investment and loan program (FILP)
will move the crossing time closer by about four years.
300
500
700
900
1100
1300
1500
1700
1900
2100
300
500
700
900
1,100
1,300
1,500
1,700
1,900
2,100
2005 2010 2015 2020 2025 2030
Incomplete
Baseline
Complete
Household financial assets, assuming 2.2% of HH saving rate
Sources: IMF WEO database (Aprill 2013), BoJ flow of funds statistics, and author's calculations.
1/ Gross debt of the general government including liabilities of the Fiscal Investment and Loan
Program (FILP).
2/ For 2013 and afterwards, FILP liabilities are assumed to stay at the same level as in 2012.
Japan: General Government Gross Debt and Household
Financial Assets (including FILP) 1/ (In trillions of yen)
300
500
700
900
1100
1300
1500
1700
1900
2100
300
500
700
900
1,100
1,300
1,500
1,700
1,900
2,100
2005 2010 2015 2020 2025 2030
Incomplete
Baseline
Complete
Household Financial Assets, assuming 2.2% of HH saving rate
Sources: IMF 2013 Article IV Report, BoJ Flow of Funds, and authors' calculations.
Note: Household saving rate is assumed to remain constant at around 2.2 percent,
the average rate over the last three years based on Cabinet Office estimates.
Japan: General Government Gross Debt and Household
Financial Assets (Excluding FILP) (in trillions of yen)
16
holdings of government bonds by domestic financial institutions may add to higher fiscal and
financial linkages that would eventually add to the risk premium.
IV. OUTLOOK FOR INTEREST RATE RISK EXPOSURES OF JAPANESE BANKS UNDER
ABENOMICS
A. The Role of Japanese Banks in the JGB Market
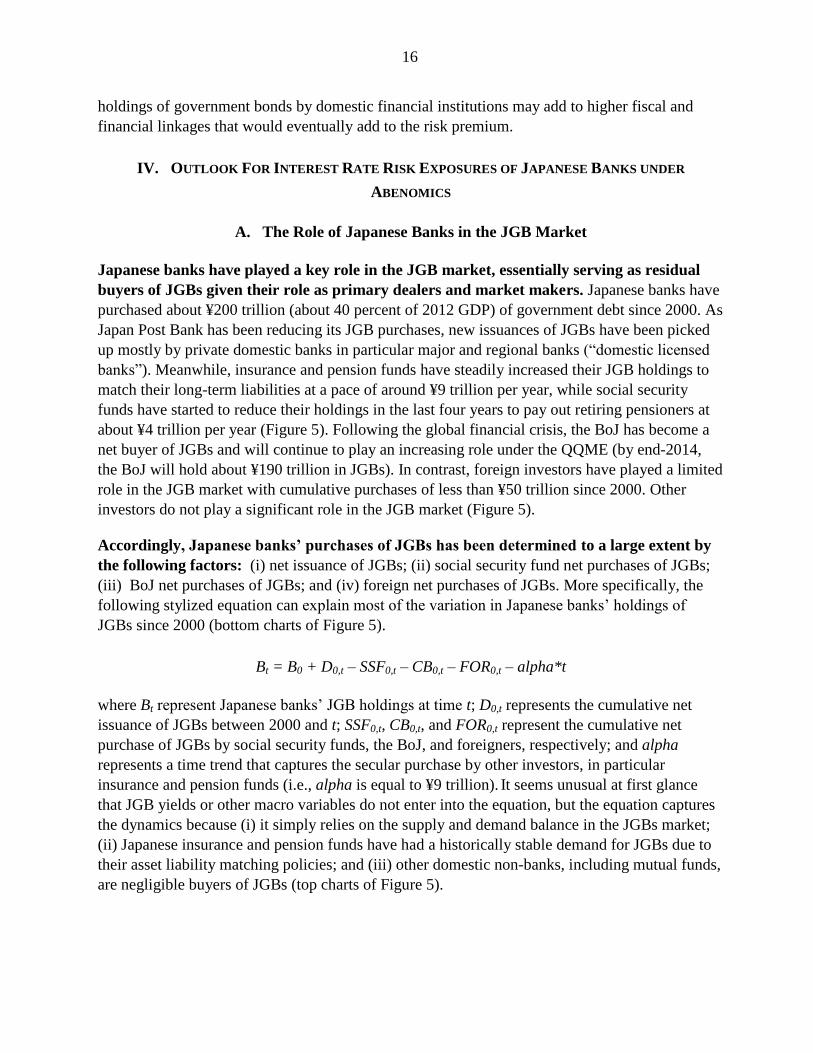
Japanese banks have played a key role in the JGB market, essentially serving as residual
buyers of JGBs given their role as primary dealers and market makers. Japanese banks have
purchased about ¥200 trillion (about 40 percent of 2012 GDP) of government debt since 2000. As
Japan Post Bank has been reducing its JGB purchases, new issuances of JGBs have been picked
up mostly by private domestic banks in particular major and regional banks (“domestic licensed
banks”). Meanwhile, insurance and pension funds have steadily increased their JGB holdings to
match their long-term liabilities at a pace of around ¥9 trillion per year, while social security
funds have started to reduce their holdings in the last four years to pay out retiring pensioners at
about ¥4 trillion per year (Figure 5). Following the global financial crisis, the BoJ has become a
net buyer of JGBs and will continue to play an increasing role under the QQME (by end-2014,
the BoJ will hold about ¥190 trillion in JGBs). In contrast, foreign investors have played a limited
role in the JGB market with cumulative purchases of less than ¥50 trillion since 2000. Other
investors do not play a significant role in the JGB market (Figure 5).
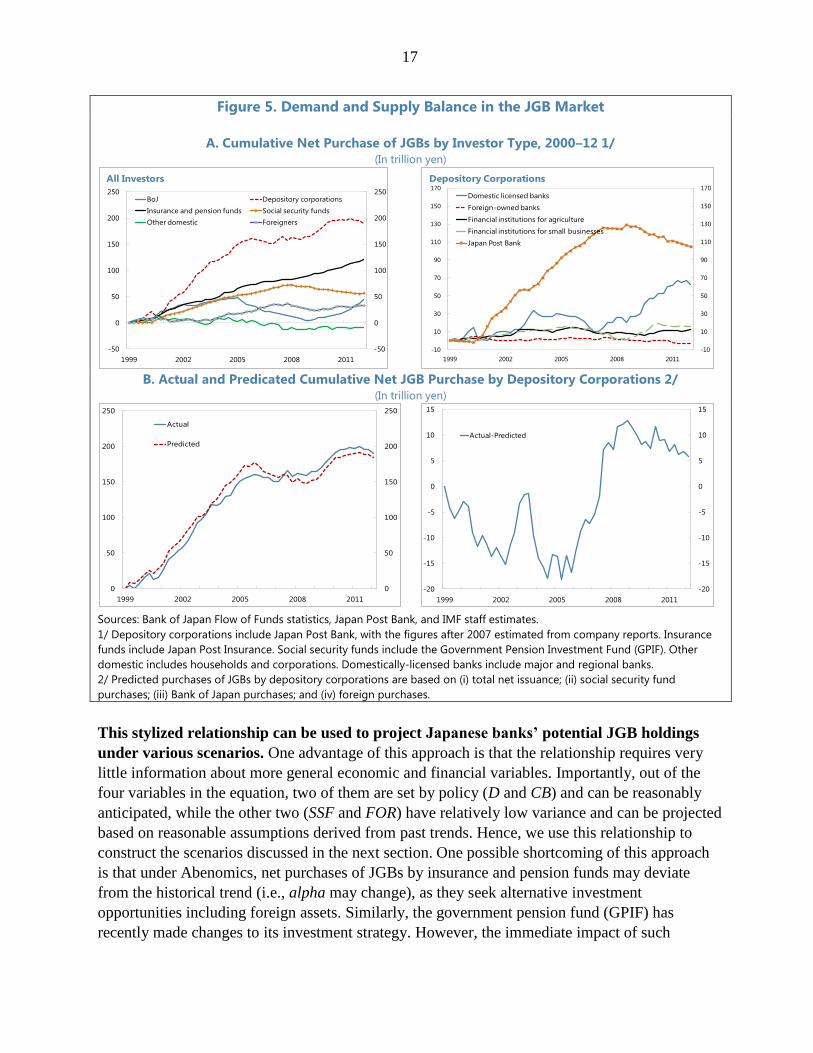
Accordingly, Japanese banks’ purchases of JGBs has been determined to a large extent by
the following factors: (i) net issuance of JGBs; (ii) social security fund net purchases of JGBs;
(iii) BoJ net purchases of JGBs; and (iv) foreign net purchases of JGBs. More specifically, the
following stylized equation can explain most of the variation in Japanese banks’ holdings of
JGBs since 2000 (bottom charts of Figure 5).
Bt = B0 + D0,t – SSF0,t – CB0,t – FOR0,t – alpha*t
where Bt represent Japanese banks’ JGB holdings at time t; D0,t represents the cumulative net
issuance of JGBs between 2000 and t; SSF0,t, CB0,t, and FOR0,t represent the cumulative net
purchase of JGBs by social security funds, the BoJ, and foreigners, respectively; and alpha
represents a time trend that captures the secular purchase by other investors, in particular
insurance and pension funds (i.e., alpha is equal to ¥9 trillion). It seems unusual at first glance
that JGB yields or other macro variables do not enter into the equation, but the equation captures
the dynamics because (i) it simply relies on the supply and demand balance in the JGBs market;
(ii) Japanese insurance and pension funds have had a historically stable demand for JGBs due to
their asset liability matching policies; and (iii) other domestic non-banks, including mutual funds,
are negligible buyers of JGBs (top charts of Figure 5).
17
Figure 5. Demand and Supply Balance in the JGB Market
A. Cumulative Net Purchase of JGBs by Investor Type, 2000–12 1/
(In trillion yen)
B. Actual and Predicated Cumulative Net JGB Purchase by Depository Corporations 2/
(In trillion yen)
Sources: Bank of Japan Flow of Funds statistics, Japan Post Bank, and IMF staff estimates.
1/ Depository corporations include Japan Post Bank, with the figures after 2007 estimated from company reports. Insurance
funds include Japan Post Insurance. Social security funds include the Government Pension Investment Fund (GPIF). Other
domestic includes households and corporations. Domestically-licensed banks include major and regional banks.
2/ Predicted purchases of JGBs by depository corporations are based on (i) total net issuance; (ii) social security fund
purchases; (iii) Bank of Japan purchases; and (iv) foreign purchases.
This stylized relationship can be used to project Japanese banks’ potential JGB holdings
under various scenarios. One advantage of this approach is that the relationship requires very
little information about more general economic and financial variables. Importantly, out of the
four variables in the equation, two of them are set by policy (D and CB) and can be reasonably
anticipated, while the other two (SSF and FOR) have relatively low variance and can be projected
based on reasonable assumptions derived from past trends. Hence, we use this relationship to
construct the scenarios discussed in the next section. One possible shortcoming of this approach
is that under Abenomics, net purchases of JGBs by insurance and pension funds may deviate
from the historical trend (i.e., alpha may change), as they seek alternative investment
opportunities including foreign assets. Similarly, the government pension fund (GPIF) has
recently made changes to its investment strategy. However, the immediate impact of such
-50
0
50
100
150
200
250
-50
0
50
100
150
200
250
1999 2002 2005 2008 2011
BoJ Depository corporations
Insurance and pension funds Social security funds
Other domestic Foreigners
All Investors
-10
10
30
50
70
90
110
130
150
170
-10
10
30
50
70
90
110
130
150
170
1999 2002 2005 2008 2011
Domestic licensed banks
Foreign-owned banks
Financial institutions for agriculture
Financial institutions for small businesses
Japan Post Bank
Depository Corporations
0
50
100
150
200
250
0
50
100
150
200
250
1999 2002 2005 2008 2011
Actual
Predicted
-20
-15
-10
-5
0
5
10
15
-20
-15
-10
-5
0
5
10
15
1999 2002 2005 2008 2011
Actual-Predicted
18
changes appears to be small and the demand for JGBs by these investors are likely to remain
strong given their investment mandates of asset-liability management.
B. Scenario Analysis
Illustrative scenarios are presented to highlight how Japanese banks’ JGB holdings and
interest rate risk exposures may change. As discussed in Section II (Table 1), three scenarios
are considered: (i) a baseline pre-Abenomics scenario; (ii) a complete Abenomics package under
which QQME, fiscal consolidation, and ambitious structural reforms lead to lower government
funding needs and higher growth; and (iii) an incomplete Abenomics package under which
inflation expectations adjust in a sluggish manner, possibly because of the lack of a structural
reform program, requiring further fiscal stimulus to close the output gap and boost inflation in the
near term. Based on these scenarios and the JGB supply-demand relationship discussed earlier,
Japanese banks’ holdings of JGBs are projected based on the assumed fiscal policy path (D),
BoJ’s QQME announcements (CB), and assumptions on the investment behavior of social
security funds (SSF) and foreigners (FOR).
In particular, Japanese banks’ JGB holdings are projected for 2013–17 as follows (Table 4):
D. Cumulative net issuance of JGBs over the medium term is based on IMF general
government gross debt projections under the three scenarios (Table 1). In all scenarios,
general government debt is assumed to be issued as follows: 75 percent in JGBs, 20 percent in
treasury bills, and 5 percent in local government bonds, in line with the broad pattern of debt
issuance in recent years.
CB. The BoJ’s net JGB purchases over 2013-14 are projected based on the April 2013 policy
announcement (¥50 trillion each in 2013 and 2014), and its holdings are assumed to be
constant thereafter (i.e. we assume the BoJ will roll over any JGBs maturing in their portfolio
over the following three years). Under the pre-Abenomics scenario, BoJ’s JGB purchases are
projected based on the Open-Ended Asset Purchasing Method introduced in January 2013.
SSF. Social security funds are assumed to remain net sellers of JGBs under current
demographic trends by ¥4 trillion per year.
FOR. The foreign share of JGBs is projected to increase from 4½ percent at end-2012 to
7 percent by end-2017 under complete policies, but fall to 2 percent under incomplete
policies, as foreign investors become more concerned about fiscal sustainability. The figures
of 7 percent and 2 percent represent the highest and lowest foreign share registered in the JGB
market since 2000, respectively.
19
0
20
40
60
80
100
120
140
160
180
0
20
40
60
80
100
120
140
160
180
FY00 FY02 FY04 FY06 FY08 FY10 FY12 FY14 FY16
JGBs
Local government bonds
Corporate bonds
Pre-Abenomics
projection
Major Banks
0
10
20
30
40
50
60
70
80
90
100
0
10
20
30
40
50
60
70
80
90
100
FY00 FY02 FY04 FY06 FY08 FY10 FY12 FY14 FY16
JGBs
Local government bonds
Corporate bonds
Pre-Abenomics
projection
Regional Banks
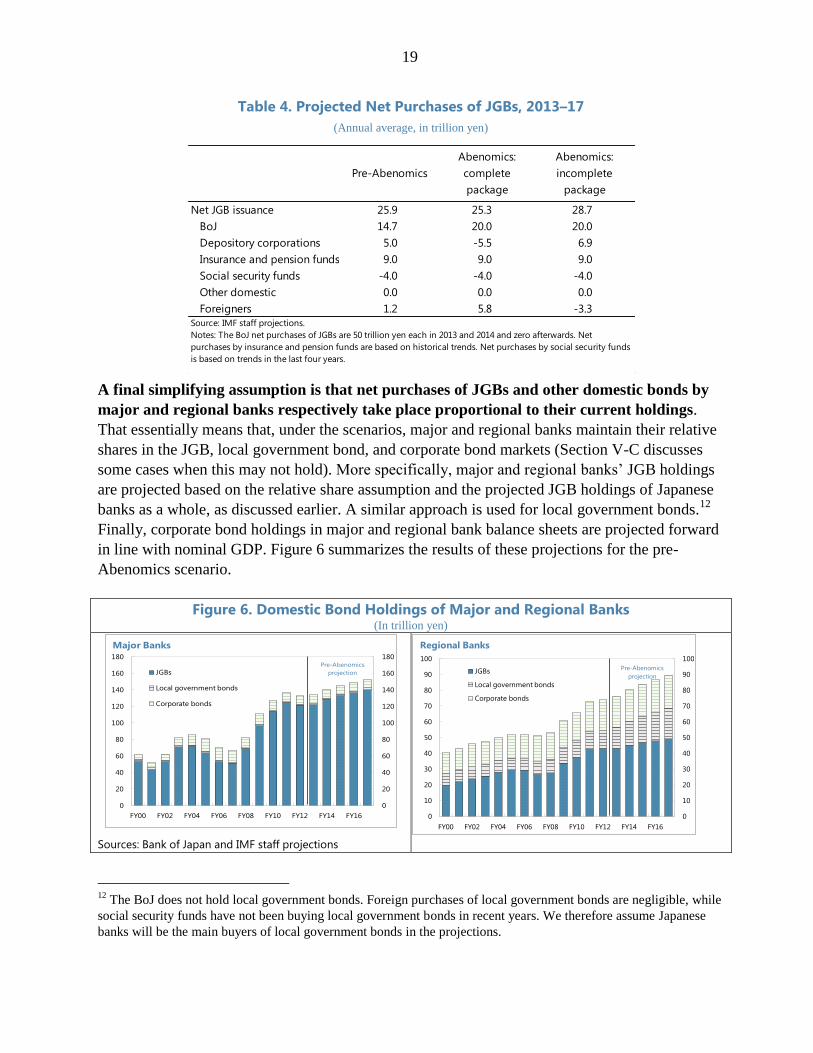
Table 4. Projected Net Purchases of JGBs, 2013–17
(Annual average, in trillion yen)
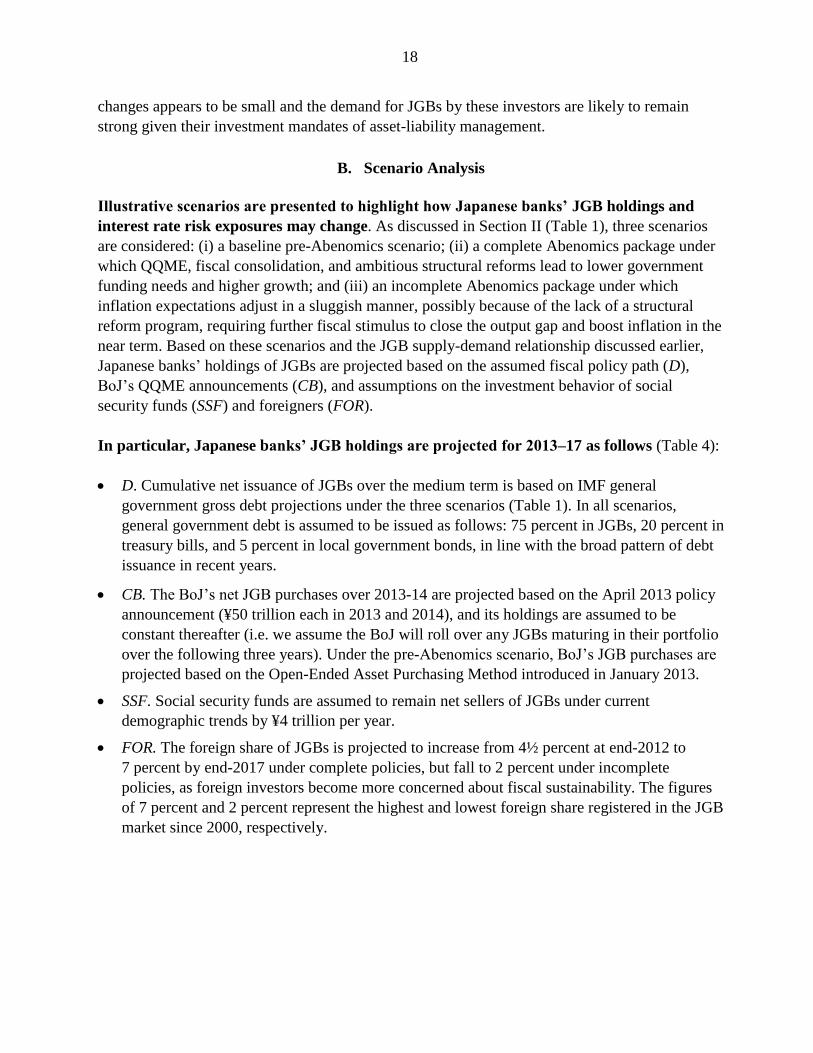
A final simplifying assumption is that net purchases of JGBs and other domestic bonds by
major and regional banks respectively take place proportional to their current holdings.
That essentially means that, under the scenarios, major and regional banks maintain their relative
shares in the JGB, local government bond, and corporate bond markets (Section V-C discusses
some cases when this may not hold). More specifically, major and regional banks’ JGB holdings
are projected based on the relative share assumption and the projected JGB holdings of Japanese
banks as a whole, as discussed earlier. A similar approach is used for local government bonds.12
Finally, corporate bond holdings in major and regional bank balance sheets are projected forward
in line with nominal GDP. Figure 6 summarizes the results of these projections for the pre-
Abenomics scenario.
Figure 6. Domestic Bond Holdings of Major and Regional Banks (In trillion yen)
Sources: Bank of Japan and IMF staff projections
12
The BoJ does not hold local government bonds. Foreign purchases of local government bonds are negligible, while
social security funds have not been buying local government bonds in recent years. We therefore assume Japanese
banks will be the main buyers of local government bonds in the projections.
Pre-Abenomics
Abenomics:
complete
package
Abenomics:
incomplete
package
Net JGB issuance 25.9 25.3 28.7
BoJ 14.7 20.0 20.0
Depository corporations 5.0 -5.5 6.9
Insurance and pension funds 9.0 9.0 9.0
Social security funds -4.0 -4.0 -4.0
Other domestic 0.0 0.0 0.0
Foreigners 1.2 5.8 -3.3
Source: IMF staff projections.
Notes: The BoJ net purchases of JGBs are 50 trillion yen each in 2013 and 2014 and zero afterwards. Net
purchases by insurance and pension funds are based on historical trends. Net purchases by social security funds
is based on trends in the last four years.
20
The interest rate risk exposure of Japanese banks is calculated as mark-to-market losses to
Tier I capital from a hypothetical 100-basis-point parallel rise in the domestic yield curve, in
line with the methodology of the BoJ in the Financial System Report.13
This is reflected in the
equation below. Going forward, we assume a gradual reduction in the duration of bank holdings
of JGBs given the BoJ is expected to expand their duration of JGB holdings under the QQME.14
(a reasonable assumption for major banks and a conservative one for regional banks based on past
trends). We also assume that Tier I capital of domestic banks will grow in line with nominal GDP
(i.e., mainly through bank profits, not new capital raising).15
Interest rate risk exposure =
Results
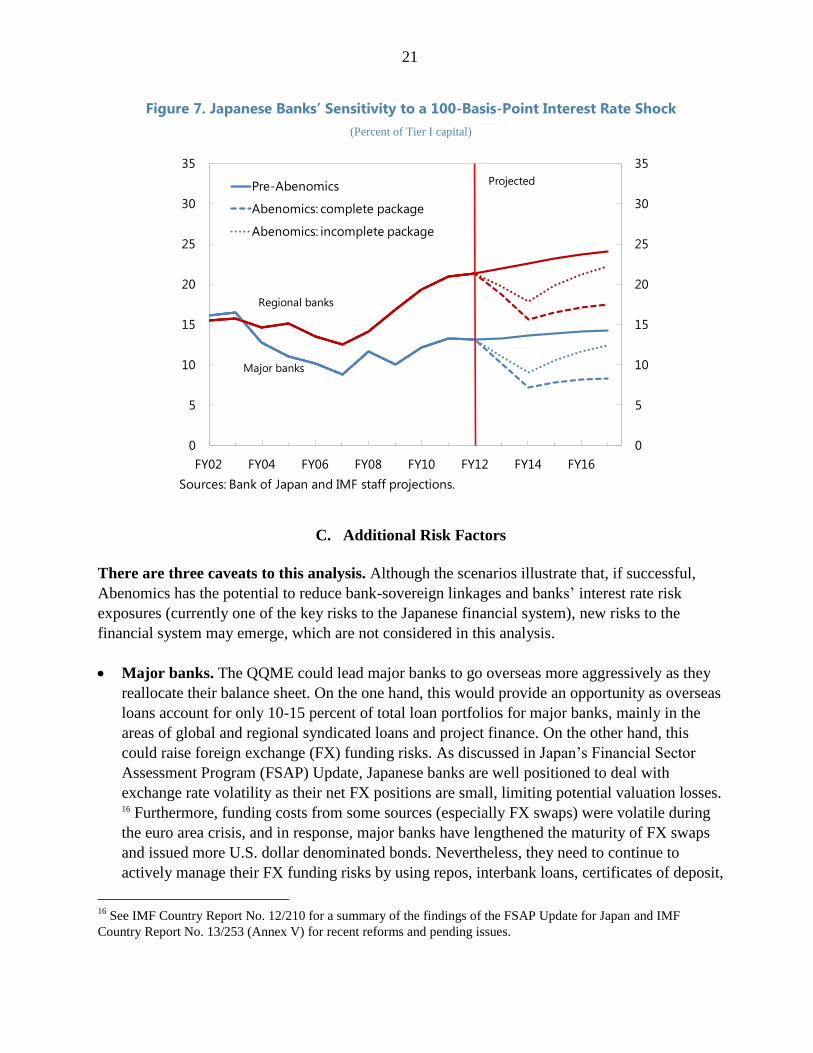
In the near term, both Abenomics scenarios show a substantial decline of the interest rate
risk exposures of major and regional banks, mostly on account of BoJ purchases (Figure 7).
Under the pre-Abenomics baseline, the interest rate risk exposures of major and regional banks
would have risen over the medium term, highlighting growing financial stability risks. In
contrast, under both complete and incomplete policy scenarios, they could decline substantially
over the next two years, as the QQME is projected to reduce Japanese banks’ JGB holdings
despite higher government financing needs compared the pre-Abenomics baseline.
Over the medium-term, however, whether financial stability risks remain lower depends
critically on whether a complete policy package is implemented (Figure 7). If the policy
package is complete, banks’ interest rate risk exposures may remain limited over the medium-
term on account of (i) slow growth in banks’ JGB holdings due to fiscal consolidation and (ii)
higher profitability and Tier I capital growth due to structural reforms. However, if the policy
package is incomplete because structural reforms do not materialize or sluggish inflation
expectations require further fiscal stimulus, bank’s JGB holdings and interest rate risk exposure
may rise quickly after the QQME, as banks may have to, once again, absorb large government
financing needs and their profitability and Tier I capital growth may decline due to lower growth.
13
Accounting losses may be lower, as mark-to-market losses could be partly offset by existing unrealized gains on
domestic bond holdings. Rising interest rates may also improve the net interest margins on loans but these effects are
not considered. 14
In particular we assume the average remaining maturity of domestic bond holdings will decline from 2.5 to 2 years
for major banks and from 4 to 3.5 years for regional banks over 2013-14. 15
Alternatively, we can assume that Tier I capital will grow at a constant rate, say at 4.2 percent. This would take
into account the fact that the average return on equity of Japanese banks is around 6 percent and the average dividend
payout ratio of Tokyo Stock Exchange listed companies is around 30 percent. The results are broadly the same.
21
Figure 7. Japanese Banks’ Sensitivity to a 100-Basis-Point Interest Rate Shock
(Percent of Tier I capital)
C. Additional Risk Factors
There are three caveats to this analysis. Although the scenarios illustrate that, if successful,
Abenomics has the potential to reduce bank-sovereign linkages and banks’ interest rate risk
exposures (currently one of the key risks to the Japanese financial system), new risks to the
financial system may emerge, which are not considered in this analysis.
Major banks. The QQME could lead major banks to go overseas more aggressively as they
reallocate their balance sheet. On the one hand, this would provide an opportunity as overseas
loans account for only 10-15 percent of total loan portfolios for major banks, mainly in the
areas of global and regional syndicated loans and project finance. On the other hand, this
could raise foreign exchange (FX) funding risks. As discussed in Japan’s Financial Sector
Assessment Program (FSAP) Update, Japanese banks are well positioned to deal with
exchange rate volatility as their net FX positions are small, limiting potential valuation losses.
16 Furthermore, funding costs from some sources (especially FX swaps) were volatile during
the euro area crisis, and in response, major banks have lengthened the maturity of FX swaps
and issued more U.S. dollar denominated bonds. Nevertheless, they need to continue to
actively manage their FX funding risks by using repos, interbank loans, certificates of deposit,
16
See IMF Country Report No. 12/210 for a summary of the findings of the FSAP Update for Japan and IMF
Country Report No. 13/253 (Annex V) for recent reforms and pending issues.
0
5
10
15
20
25
30
35
0
5
10
15
20
25
30
35
FY02 FY04 FY06 FY08 FY10 FY12 FY14 FY16
Pre-Abenomics
Abenomics: complete package
Abenomics: incomplete package
Sources: Bank of Japan and IMF staff projections.
Projected
Major banks
Regional banks
22
and FX swaps (mostly in U.S. dollar). Sudden exchange rate movements may also create
counterparty risk in FX swap markets, as most of these transactions are settled over the
counter.
Regional banks. A key risk factor for regional banks is low profitability stemming from
weak loan demand in their core business areas. As a result, an important source of income for
these banks is interest generated from long-term domestic bonds. In that context, if credit
demand in the regional economies is slow to pickup, regional banks may decide to maintain
their JGB holdings or, even, extend their maturity further, making them more susceptible to
interest rate risk. This could happen especially if there is no credible growth plan and the
policy package is incomplete. Though regional banks individually are small, as a group they
are systemically important (with about 40 percent of banking system assets excluding Japan
Post Bank and agricultural cooperatives).
Rising risk premium. The scenarios focus on banks’ sensitivity to a hypothetical interest rate
shock. In other words, they do not attempt to capture the likelihood or severity of a shock
under different scenarios. As discussed in Section III, the likelihood of a sharp rise in interest
rates would likely be higher under incomplete policies.
V. CONCLUSION AND POLICY IMPLICATIONS
The paper examines how the policy package of Abenomics may affect the development of
long-term sovereign yields and banks’ exposures to interest rate risk. Empirical results
suggest that the upward pressure on long-term JGB yields from deteriorating fiscal conditions has
been offset so far by other factors, including a stable investor base with a preference for safe
assets and increased purchases by the BoJ, but these effects are likely to decline over the medium
term. Long-term interest rates could rise and the market’s capacity to finance JGBs could further
narrow unless fiscal and structural reforms are implemented to stimulate growth and reduce the
public debt-to-GDP ratio. At the same time, the BoJ is set to take up large amounts of interest rate
risk from Japanese banks to its own balance sheet in the near term, which could help banks
provide more risk capital and support the government’s growth objectives. In the medium term,
however, the absence of sufficiently ambitious structural reforms and medium-term fiscal
consolidation could push Japanese banks’ JGB holdings and related interest rate risk exposure
back to the baseline levels.
These findings have several policy implications. In particular:
Monetary policy. Monetary policy alone cannot counter a potentially rising fiscal risk
premium under current policies. Even if the BoJ expands its balance sheet to about 60 percent
of GDP by 2014 under the QQME, our estimates indicate that long-term rates in Japan going
forward are likely to be dominated by other factors, including deteriorating fiscal conditions.
Accelerating the pace of inflation to reach the 2 percent target may help revive growth and
23
contribute to a “normalization” of long-term rates, but without ambitious growth and fiscal
reforms in train, the BoJ could face difficulties in maintaining stable long-term rates.
Fiscal and structural reforms. More ambitious medium-term fiscal adjustments and/or
structural reforms will be necessary to contain the risk of a surge in long-term rates, which is
critical for fiscal debt dynamics. Our analysis shows that, since 2007, worsening fiscal
conditions have contributed to an underlying interest rate increase of more than 1 percentage
point. Based on the estimates, credible fiscal adjustments and structural reforms that lower
medium-term projections of public debt and deficits can have an impact on the current level
of long-term rates through a change in expectations. Successful implementation of
Abenomics—including ambitious medium-term fiscal consolidation and growth reforms in
addition to aggressive monetary easing—will be essential to keep long-term interest rates low
and stable at levels broadly similar to nominal GDP growth rates.
Financial stability. While the BoJ asset purchases could take up significant amount of interest
rate risk from Japanese banks in the next two years, their JGB holdings and related interest
rate risk exposures could rise again in the absence of accompanying fiscal and structural
reforms. As recommended in the Japan’s FSAP Update, strengthening capital requirements
for domestically active banks and private sector-led consolidation in the regional banking
sector could help mitigate downside risks of incomplete policies on the more vulnerable parts
of the banking sector. By strengthening their capital base, such policies could also allow these
banks to take better advantage of the potential reduction in their interest rate risk exposure
and increase lending to small and medium enterprises (SMEs) and other corporations. That
could, in turn, support the authorities’ growth objectives.
24
REFERENCES
Alper, E. and F. Lorenzo, 2011, “Public Debt in Advanced Economies and its Spillover Effects on
Long-term Yields,” IMF Working Paper No. 11/210 (Washington: International Monetary
Fund).
Andritzky, J.R., 2012, “Government Bonds and Their Investors: What Are the Facts and Do They
Matter?” IMF Working Paper No. 12/158 (Washington: International Monetary Fund).
Ardagna, S., F. Caselli, and T. Lane, 2004, “Fiscal Discipline and the Cost of Public Debt Service:
Some Estimates from OECD Countries,” NBER Working Paper Series No. 10788 (Cambridge,
Massachusetts: National Bureau of Economic Research).
Arslanalp, S., and T. Poghosyan, 2013, “Foreign Investor Base and Long-term Sovereign Bond
Yields in Advanced Countries,” forthcoming in IMF Working Paper.
Arslanalp, S., and T. Tsuda, 2012, “Tracking Global Demand for Sovereign Debt for Advanced
Economy Sovereign Debt,” IMF Working Paper No. 12/284 (Washington: International
Monetary Fund).
Baba, N., 2012, “Sustainability of Debt Financing in Japan and the JGB Enigma,” Global Economics
Paper No. 215 (New York: Goldman Sachs).
Baldacci, E., S. Gupta, and A. Mati, 2009, “Is it (Still) Mostly Fiscal? Determinants of Sovereign
Spreads in Emerging Markets,” IMF Working Paper No.09/259 (Washington: International
Monetary Fund).
Bank of Japan, 2012, Financial System Reports, October 2012. Available via the internet:
https://www.boj.or.jp/en/research/brp/fsr/fsr121019.htm/.
Bank of Japan, 2013, Financial System Reports, April 2013. Available via the internet:
http://www.boj.or.jp/en/research/brp/fsr/index.htm/
Brook, A., 2003, “Recent and Prospective Trends in Real Long-Term Interest Rates: Fiscal Policy and
Other Drivers,” OECD Economics Department Working Paper No. 367.
Engen, E. and R. Hubbard, 2004, “Federal Government Debts and Interest Rates,” NBER Working
Paper No. 10681 (Cambridge, Massachusetts: National Bureau of Economic Research).
Faini, R., 2006, “Fisal Policy and Interest Rates in Europe,” Economic Policy, Vol.21, No.47,
pp.443–89.
Hasegawa, T., and W.R. Lam, 2011, “Financial Asset Allocation of Japanese Households,” mimeo.
25
Hauner, D. and M. Kumar, 2006, “Fiscal Policy and Interest Rates: How Sustainable is the ‘New
Economy’?” IMF Working Paper No.06/112 (Washington: International Monetary Fund).
Hoshi, T., and T. Ito, 2012, “Defying Gravity: How Long Will Japanese Government Bond Prices
Remain High?” NBER Working Paper No. 18287 (Cambridge, Massachusetts: National Bureau
of Economic Research).
Ichiue, H., and Y. Shimizu, 2012, “Determinants of Long-term Yields: A Panel Data Analysis of
Major Countries and Decomposition of Yields of Japan and the U.S.,” Bank of Japan Working
Paper, No. 12-E-7, May.
International Monetary Fund, 2013, “Japan: Article IV Consultation Report,” IMF Country Report
No.13/253. (www.imf.org/external/pubs/ft/scr/2013/cr13253.pdf)
Kinoshita, N., 2006, “Government Debt and Long-term Interest,” IMF working Paper No.06/63
(Washington: International Monetary Fund).
Lam, W. R., and K. Tokuoka, 2011, “Assessing Risks in the Japanese Government Bond Market,”
IMF Working Paper No. 11/292 (Washington: International Monetary Fund).
Laubach, T., 2003, “New Evidence on the Interest Rate Effects of Budget Deficits and Debt,” Federal
Reserve Board Working Paper, April (Washington: Federal Reserve Board).
Poghosyan T., 2012, “Long-Run and Short-Run Determinants of Sovereign Bond Yields in Advanced
Economies,” IMF Working Paper No. 12/271 (Washington: International Monetary Fund).
Tokuoka K., 2010, “Long-Term Outlook of JGB Financing,” IMF Working Paper No. 10/19
(Washington: International Monetary Fund).


![FY2019 and FY2020 Economic Outlook - mizuho-ri.co.jp · [ Outlook on the Japanese economy (major economic indicators) ] 19 Japan: the CPI excluding fresh food (y-o-y change) should](https://img.pdfslide.net/doc/110x75/5e1607b43def7f0bc744faa5/fy2019-and-fy2020-economic-outlook-mizuho-ricojp-outlook-on-the-japanese-economy.jpg)