Embed Size (px)
Citation preview

New Zealand Private Capital Monitor 2021Full year review

2 | New Zealand Private Capital Monitor 2021

New Zealand Private Capital Monitor 2021 | 3
We are delighted to bring you the eighteenth full year edition of the New Zealand Private Capital Monitor.
This edition of the New Zealand Private Capital Monitor consolidates the findings from previous surveys and provides a more detailed review of 2020 including commentary on the industry from the New Zealand Private Capital Association’s Chair.
2020 was another year of record activity, with $2.53 billion of combined investments and divestments across private equity and venture capital transactions, weighted heavily towards investment activity. Buy-out activity in particular showed significant growth on the prior year driven by the EQT Infrastructure acquisition of Metlifecare.
Total investment activity continued to be strong in 2020 totalling $2,419 million, a strong increase from 2019, driven by a higher number of investments in 2020 (128) compared to 2019 (77). There was an increase in average transaction value in 2020 ($18.9 million) compared to 2019 ($14.9 million) whilst still being significantly higher than the 10 year average of $10.3 million.
Private equity investment excluding venture capital reached $2,292 million, compared with $1,034 million in 2019 and $824 million in 2018.
Venture and early stage investment in 2020 totalled $127.2m an increase from $112.2m in 2019.
International investment in software / technology companies continues the theme seen in recent years.
The commitment to growing New Zealand’s businesses has been clear in responses to the Monitor, with the continued plans for their investee companies focussing on growth in exports and new markets, increased capital expenditure and market acquisitions.
Fund-raising activity in 2020 by New Zealand funds raised over $765 million of capital and further fundraisings are anticipated for 2021.
New Zealand capital markets showed decreased activity in 2020 with respect to new listings, however significant capital raises were undertaken by existing public companies in response to Covid-19. The outlook for future years appears positive as New Zealand and the global economy recovers from the Covid-19 pandemic, and portfolio companies assess options for new capital raising.
Private capital is a significant contributor to the New Zealand capital market eco-system. With a global recovery from Covid-19 still in progress, private equity and venture capital fund managers can provide much needed expertise and assistance to founders and managers, as well as additional capital support.
We see private capital continuing to play an important role throughout the coming year in helping many New Zealand businesses stabilise and grow as the New Zealand and ultimately global economies return to a sense of normality.
NZ Private Capital promotes the growth story with targeted communications that feature business owners’ experience working with private equity and venture capital managers.
Colin McKinnonExecutive Director NZ Private Capital
Foreword

4 | New Zealand Private Capital Monitor 2021

New Zealand Private Capital Monitor 2021 | 5
The year to 31 December 2020 was characterised by a record level of overall activity of NZ$2,531m, an increase of $351m from 2019 ($2,180m) driven by record levels of activity in the Mid-market category. Overall activity in 2020 is also significantly higher than the historical 10-year average of $1,315m.
Mid-market investment activity in 2020 totalled $735.8m, an increase from $337.1m achieved in 2019 which was the previous record. Divestment activity with disclosed deal values in 2020 was $111.9m, higher than the $91.9m recorded in 2019.
Meanwhile, 2020 continued to be a strong year in the Venture space, total investment activity of $127.2m represents an increase on 2019 investment of $112.2m.
Overall Buy-out activity in 2020 was $1,556.0m, broadly inline with the $1,570.6m recorded in 2019. However, 2020 activity was entirely investment related and driven by EQT Infrastructure’s $1.3bn acquisition of Metlifecare.
Investments• Total investment value in 2020
was $2,419.0m spread across 128 transactions.
• The total number of investments with known values has increased from 77 in 2019 to 128 in 2020.
• The total average transaction value increased from $14.9m to $18.9m, with Venture average transaction value decreasing from $2.4m to $1.4m and the buy-out average increasing from $317.5m in 2019 to $778.0m in 2020 as a result of the EQT transaction.
• Mid-market investment activity has increased from $398.9m in 2019 to $735.8m, a record year in 2020 and is significantly higher than the historical 10 year average of $284.9m.
• Average investment value for mid-market investments in 2020 was $21.6m which is higher than 2019 ($13.8m).
• Total Venture investment increased from $127.2m from $112.2m in 2019.
Divestments• Total divestment value in 2020
decreased significantly to $111.9m from $1,034.2m in 2019.
• Divestment activity in 2020 included Archer Capital’s divestment of New Zealand Pharmaceuticals Ltd, Champ Ventures’ divestment of TR Group Limited and Direct Capital’s divestment of Bayley Corporation Limited.
Brad WheelerPartnerStrategy and Transactions EY New Zealand
Colin McKinnonExecutive DirectorNZ Private Capital
Executive summary
Overall activity summary 2010 to 2020
NZ$
mill
ion
Investment Divestment
FY100
500
1000
1500
2000
2500
3000
FY12 FY14 FY16 FY18 FY20FY11 FY13 FY15 FY17 FY19
6 | New Zealand Private Capital Monitor 2021
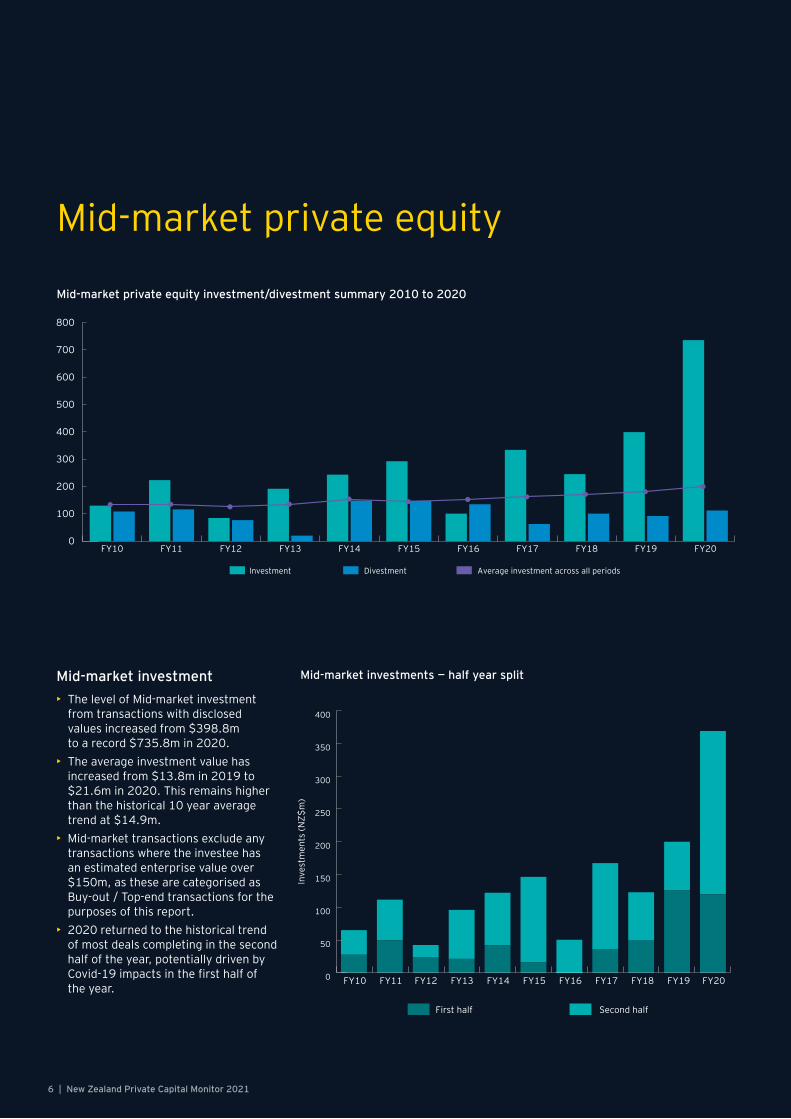
Mid-market investment• The level of Mid-market investment
from transactions with disclosed values increased from $398.8m to a record $735.8m in 2020.
• The average investment value has increased from $13.8m in 2019 to $21.6m in 2020. This remains higher than the historical 10 year average trend at $14.9m.
• Mid-market transactions exclude any transactions where the investee has an estimated enterprise value over $150m, as these are categorised as Buy-out / Top-end transactions for the purposes of this report.
• 2020 returned to the historical trend of most deals completing in the second half of the year, potentially driven by Covid-19 impacts in the first half of the year.
Mid-market private equity
Mid-market private equity investment/divestment summary 2010 to 2020
0
100
200
300
400
500
600
700
800
Investment Divestment Average investment across all periods
FY10 FY12 FY14 FY16 FY18 FY20FY11 FY13 FY15 FY17 FY19
Mid-market investments — half year split
0
50
100
150
200
250
300
350
400
First half Second half
FY10 FY12 FY14 FY16 FY18 FY20FY11 FY13 FY15 FY17 FY19
Inve
stm
ents
(NZ$
m)
New Zealand Private Capital Monitor 2021 | 7
It was great to see New Zealand businesses supported by so many
funds through such an uncertain time.Andrew Frankham
NZ Private Capital Chair
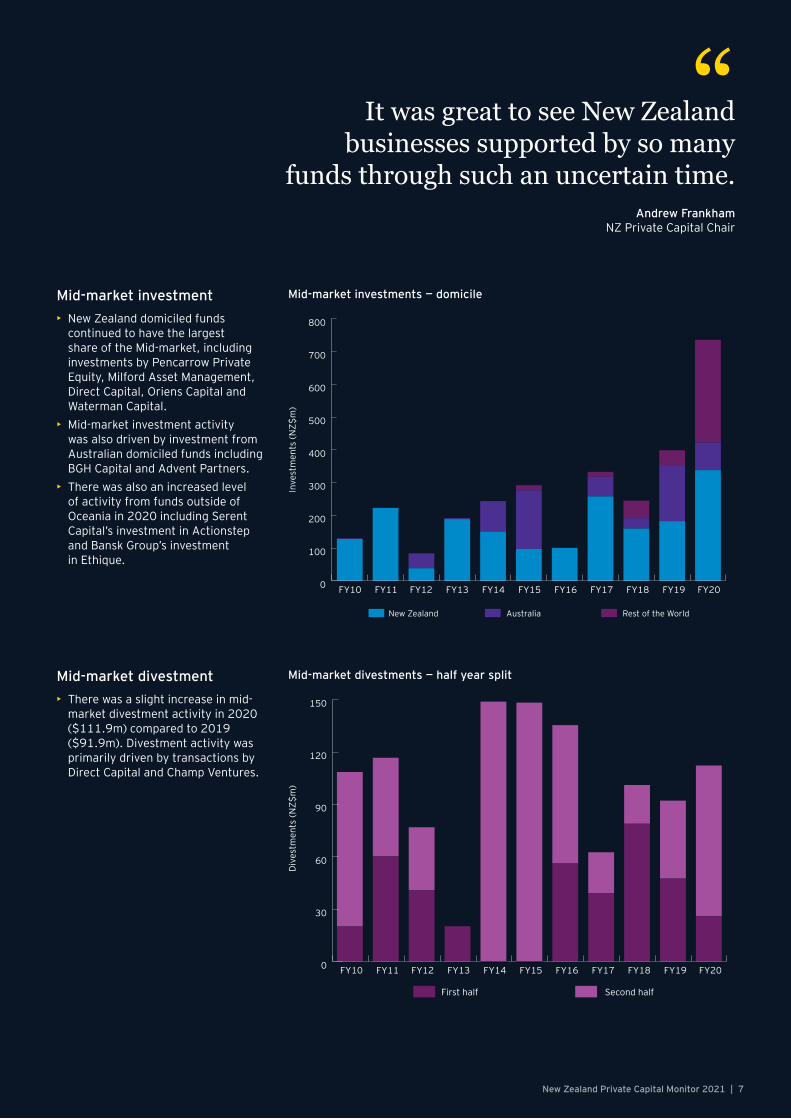
“Mid-market investment• New Zealand domiciled funds
continued to have the largest share of the Mid-market, including investments by Pencarrow Private Equity, Milford Asset Management, Direct Capital, Oriens Capital and Waterman Capital.
• Mid-market investment activity was also driven by investment from Australian domiciled funds including BGH Capital and Advent Partners.
• There was also an increased level of activity from funds outside of Oceania in 2020 including Serent Capital’s investment in Actionstep and Bansk Group’s investment in Ethique.
Mid-market investments — domicile
New Zealand Australia Rest of the World
FY10 FY12 FY14 FY16 FY18 FY20FY11 FY13 FY15 FY17 FY19
Inve
stm
ents
(NZ$
m)
0
100
200
300
400
500
600
700
800
Mid-market divestment• There was a slight increase in mid-
market divestment activity in 2020 ($111.9m) compared to 2019 ($91.9m). Divestment activity was primarily driven by transactions by Direct Capital and Champ Ventures.
Mid-market divestments — half year split
Div
estm
ents
(NZ$
m)
First half Second half
FY10 FY12 FY14 FY16 FY18 FY20FY11 FY13 FY15 FY17 FY190
30
60
90
120
150

8 | New Zealand Private Capital Monitor 2021
OverviewSince 2009 our survey results for venture capital activity have been supplemented by deal information from New Zealand Growth Capital Partners (formerly NZVIF). This has led to broader data capture, and the inclusion of early stage investment activity within the Venture segment. Early stage investment includes activity of fund managers, angel networks and individuals. We have included only activity of fund managers (who employ a General Partner / Limited Partner structure) in our dataset.
Fund managers or General Partners manage capital provided by investors. Fund managers have investment programmes to attract investor’s capital prior to deploying the capital. Their activity is distinct from angel networks that help individuals to invest their own capital usually on a deal by deal basis.
The size of early stage funds varies from large venture capital funds (greater than $50m funds under management) to small and micro Venture ($2m-10m funds under management). The stage of investment describes the path from seed/early stage to expansion.
Venture & early stage capital
Venture & early stage investment• Total investment value of disclosed Venture activity in NZ was $127.2m in
2020 (compared to $112.2m in 2019). This increase is driven by an increase in the number of transactions from 46 in 2019 to 92 in 2020.
Venture & early stage investment summary
0
50
100
150
200
250
300
First half Second half
FY10 FY12 FY14 FY16 FY18 FY20FY11 FY13 FY15 FY17 FY19
Tota
l act
ivity
(NZ$
m)
New Zealand Private Capital Monitor 2021 | 9
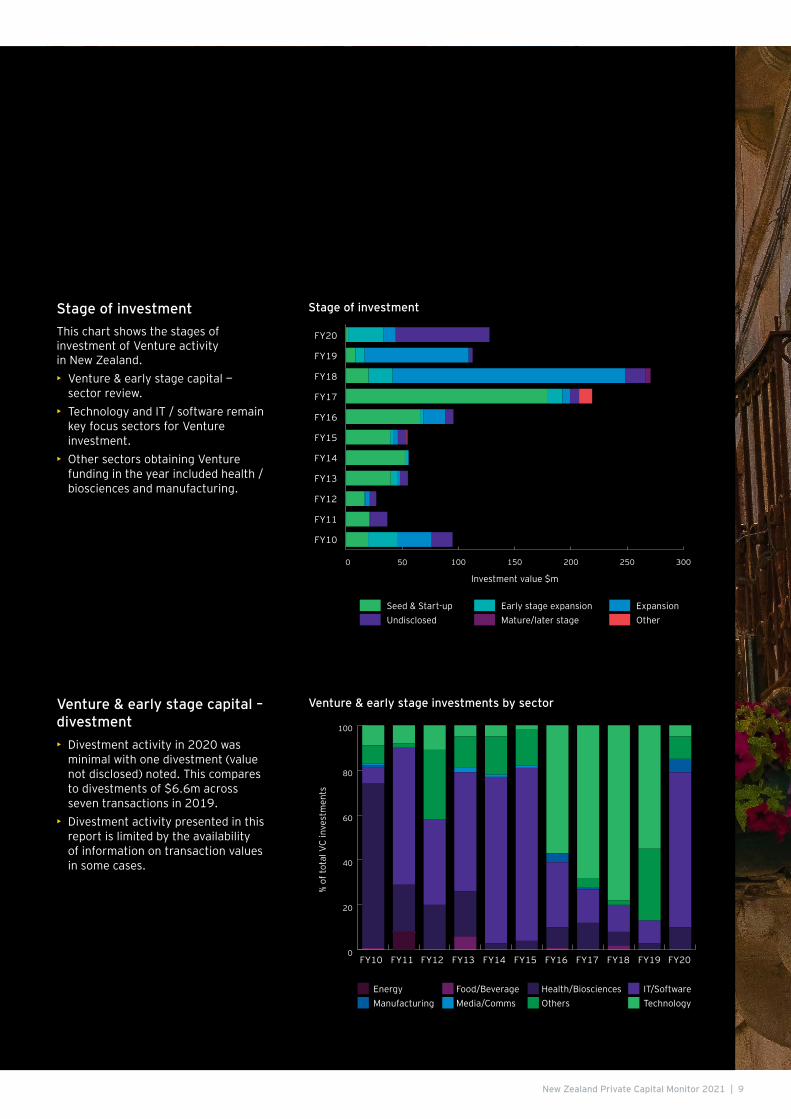
Stage of investmentThis chart shows the stages of investment of Venture activity in New Zealand.• Venture & early stage capital —
sector review.• Technology and IT / software remain
key focus sectors for Venture investment.
• Other sectors obtaining Venture funding in the year included health / biosciences and manufacturing.
Stage of investment
Seed & Start-up ExpansionMature/later stageEarly stage expansion
Undisclosed Other
FY10
FY11
FY12
FY13
FY14
FY15
FY16
FY17
FY18
FY19
FY20
Investment value $m
100 150 200 250 3000 50
Venture & early stage capital – divestment• Divestment activity in 2020 was
minimal with one divestment (value not disclosed) noted. This compares to divestments of $6.6m across seven transactions in 2019.
• Divestment activity presented in this report is limited by the availability of information on transaction values in some cases.
Venture & early stage investments by sector
FY10 FY12 FY14 FY16 FY18 FY20FY11 FY13 FY15 FY17 FY19
% of
tota
l VC
inve
stm
ents
Energy IT/SoftwareMedia/CommsFood/Beverage
ManufacturingHealth/BiosciencesOthers Technology
0
20
40
60
80
100

10 | New Zealand Private Capital Monitor 2021
New Zealand Private Capital Monitor 2021 | 11
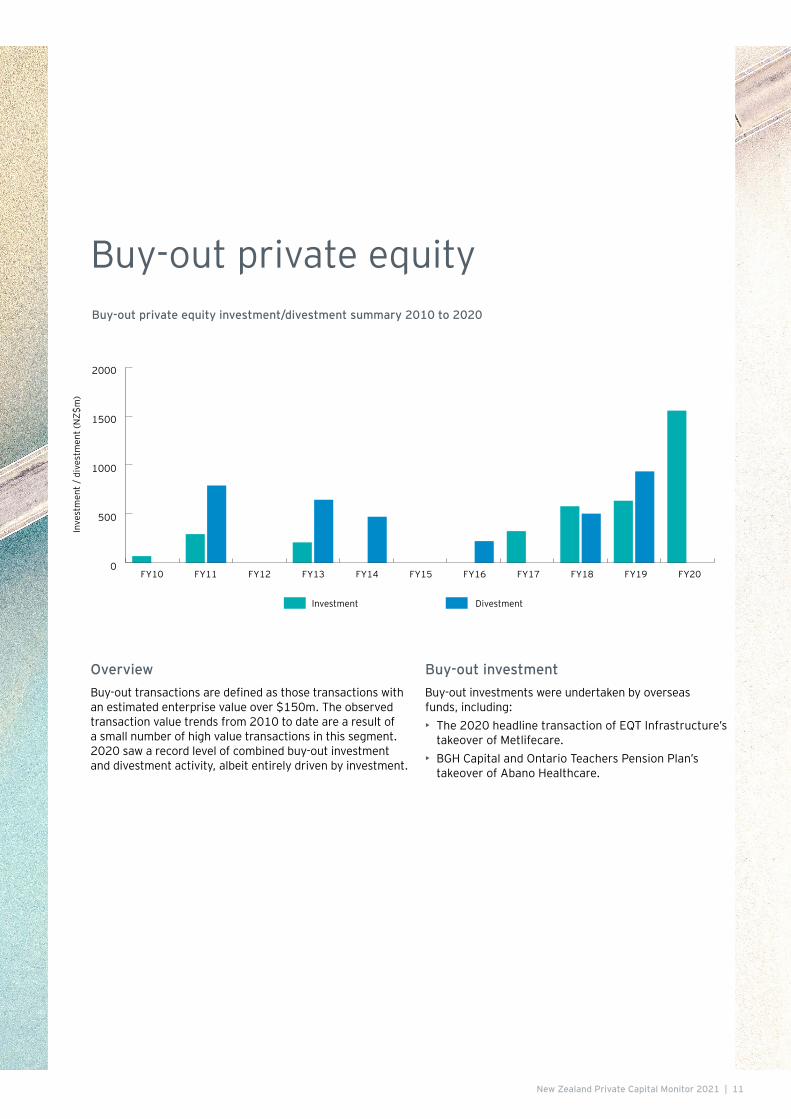
OverviewBuy-out transactions are defined as those transactions with an estimated enterprise value over $150m. The observed transaction value trends from 2010 to date are a result of a small number of high value transactions in this segment. 2020 saw a record level of combined buy-out investment and divestment activity, albeit entirely driven by investment.
Buy-out investment►Buy-out investments were undertaken by overseas funds, including:• The 2020 headline transaction of EQT Infrastructure’s
takeover of Metlifecare. • BGH Capital and Ontario Teachers Pension Plan’s
takeover of Abano Healthcare.
Buy-out private equityBuy-out private equity investment/divestment summary 2010 to 2020
0
500
1000
1500
2000
FY10 FY12 FY14 FY16 FY18 FY20FY11 FY13 FY15 FY17 FY19
Investment Divestment
Inve
stm
ent /
div
estm
ent (
NZ$
m)

12 | New Zealand Private Capital Monitor 2021
Trans-Tasman TR Group welcomes new investors to support growthIn 2020, Direct Capital, NZ Super Fund and iwi investment vehicle Te Pūia Tāpapa together acquired a 31 percent shareholding in TR Group alongside founders, Managing Director Andrew Carpenter and the Carpenter family. TR Group is New Zealand’s largest heavy vehicle rental and lease company. It was established in 1992 and today serves over 1,300 customers with a fleet of more than 6,500 vehicles from 15 branches throughout NZ and Australia. The company employs over 150 dedicated staff members and is headquartered in Auckland.TR Group has a differentiated service offering from other market participants, giving customers the ability to outsource key areas of fleet management including: residual risk, driver training and safety, compliance, maintenance and fleet redundancy. The customer experience is focused on providing the best possible vehicles for the work required and ongoing support to optimise vehicle and fleet performance throughout their contracted lives. The new investors have come on-board to support TR Group’s growth – both in NZ and Australia. “We look forward to working with Andrew and his team and supporting TR Group’s growth. We are particularly excited about the opportunity to expand into Australia, which is from TR’s perspective an untapped market” said Direct Capital’s Hugh Cotterill.Direct Capital was established in 1994 and is New Zealand’s largest private equity firm, having raised $1.7 billion in capital for investment into private companies.Direct Capital has partnered with some of New Zealand’s best-known and most successful businesses, including Beca, AS Colour, Mondiale VGL, and the now-NZX-listed Ryman Healthcare, Scales Corporation and New Zealand King Salmon.The New Zealand Superannuation Fund invests money on behalf of the New Zealand Government to help pay for the increased cost of universal pension entitlements in the future. A long-term, growth-oriented investor, the Fund has around NZ$57 billion in assets, including $7 billion invested in New Zealand.The Te Pūia Tāpapa Investment Fund is made up of 26 Iwi and Māori entities. Its investors represent diversity of scale and geography comprising Iwi and Māori entities.
Case Studies
New Zealand Private Capital Monitor 2021 | 13
Mint Innovation raises expansion capitalMint Innovation has developed a unique patented bio metallurgical approach to recover precious metals (gold, palladium and copper) from electronic waste and other feedstock. A $20 million Series B round in 2020 was raised to build two ‘build to operate’ plants before roll out of a licencing model.Mint Innovation CEO, Will Barker had concern about trying to raise $20 million in a Covid world but had little trouble getting the money with support from existing investor Movac. About 20% of the capital came from overseas investors with most of the remainder from existing Kiwi investors. Mint was co-founded in 2016 by former LanzaTech staffers Will Barker and Matthew Rowe along with Ollie Crush (Chief Scientific Officer).Mint Innovation was incubated at the deep tech hub Level Two in Auckland’s Parnell that was also home in the early days to LanzaTech and Rocket Lab. Mint Innovation started with $1m in seed money from Ice Angels and WNT Ventures and then, in 2018, raised $5.2m in a Series A round to build their current premises and demonstration scale plant in East Tamaki, Auckland.Mint Innovation’s process breaks down e-waste, like computer circuit boards, and uses micro-organisms that suck up precious metals like gold and palladium.Mint’s next step is building two commercial plants, in Australia and the UK, in cities where the scale of e-waste collection allows low-cost processing of the waste. The company will also expand its 20 staff to about 30 once the plants are built.Will Barker said that: “There’s an opportunity for us to deploy these plants in every city in the world essentially, but the first step for us is deploying reasonably locally – we’re exploring how to get this into Australia and we’re also looking at the UK, which are both really attractive environments for rolling out our first commercial offerings.”Barker thinks there will eventually be an opportunity to build a commercial scale plant in New Zealand.
About MovacMovac is a full lifecycle technology investor, from Seed to Series B/C onwards. They are high support, high conviction and bring Kiwi capital and global talent to grow businesses. With 100+ years collective experience commercialising and growing businesses, Movac also share the collective networks and functional experience of their extensive Operating Partner and Executive in Residence team.
First AML accelerates with Icehouse VenturesIn September 2020, anti-money laundering tech startup First AML raised NZ$8 million in a Series A funding round led by US-based Bedrock Capital, with support from Pushpay founder Chris Heaslip and Icehouse Ventures.First AML Co-founder Milan Cooper formed First AML in 2017 with his two co-founders, Bion Behdin and Chris Caigou, who were working as corporate bankers when the first phase of AML regulations was introduced for banks in 2013. At the start of 2019, First AML took a $200k seed investment from Icehouse Ventures. Later that year they raised $2.5 million in angel funding, predominantly from Chris Heaslip and Eliot Crowther. Mr Cooper credits the Icehouse Ventures team for inspiring the company’s co-founders to think big from the outset.First AML’s regulatory technology platform streamlines AML anti-money laundering compliance for financial service providers, law firms, real estate agencies and accountants. The company’s end-to-end Customer Due Diligence platform automates the identity verification of customers, giving companies complete visibility and management oversight of the process, minimising money laundering risk.First AML plans to accelerate global market expansion and product development.Milan Cooper said that: “Interest from customers in countries like Australia and the US is heating up as businesses look to prepare for new regulatory requirements, and we are now well placed to capture these opportunities and offer the world’s best AML compliance platform thanks to our new investment partners at Bedrock. This is a $184 billion global market — there’s massive opportunity out there.”Icehouse Ventures funds represent more than $140m funds under management. Each fund has a distinct approach and set of investors, but they all share a common mission: back New Zealand’s bravest founders.
14 | New Zealand Private Capital Monitor 2021
The year 2020 was a year of unprecedented disruption caused by the protracted impact of the global pandemic although some industries and sectors were more impacted than others. Many businesses supported by private capital funds were able to recover to new business levels and adjust practices. The economic recovery will take time but business outlook is optimistic. Investor appetite for private markets is healthy including the New Zealand early-stage funds.It was a busy year for Private Capital investment in New Zealand, with a record $2.4 billion of capital deployed into accelerating the growth of New Zealand companies and reflects a strong and healthy private capital market. Mid-market activity nearly doubled on the prior year to a record $736m invested. In 2020, investment in early stage and Venture Capital totalled $127m consistent with the long-term trend, however the volume of Venture Capital transactions doubled from 46 to 92 investments.Over the last decade more than $8.5 billion has been invested in growing New Zealand companies. In that same time, over $4.6 billion has been returned to investors for reinvestment in new investment opportunities, or into the wider economy. The mid-market continues to be a strong performer with over $2.8 billion invested in the last decade and $1.0 billion returned to investors. Capital currently invested continues to accelerate the ambitions of exciting companies in fund portfolios. Investment from disclosed transactions increased significantly (82%) from $399m in 2019 to $726m, as average transaction size increased from $13.8m to $21.6m. Venture and early-stage investment activity was $127m across 92 transactions in 2020 compared to $112m across 46 transaction in 2019. A feature of venture and early-stage activity is the growing number of new funds raising capital and investing in new technology companies. Over the decade to December 2020, $1.0 billion has been invested in 587 early-stage transactions. In 2019, the average transaction size was $2.4 million, but in 2020 the average transaction size was $1.4m. The commercialisation of deep-tech and science innovation continues to attract investors leading to more funds with a specialist sector focus.The EY New Zealand Private Capital Monitor measures the level of professional investment activity in New Zealand’s private markets. Private markets are important in New Zealand as privately-owned businesses represent a greater portion of the total market than is the case in other comparable countries. The Monitor is important research for our industry and we are grateful to EY for its production.
Opinion — NZ Private Capital Chair
Andrew FrankhamNZ Private Capital Chair
New Zealand Private Capital Monitor 2021 | 15
The 2021 Monitor reports on a year that, in spite of global pandemic
disruption, recovered to achieve new records.
The availability of private capital in New Zealand
plays an important part in growth ambitions for
New Zealand businesses.Andrew Frankham
NZ Private Capital Chair
Capital availableThere continues to be a significant amount of capital available from domestic and international funds providing alternatives for companies raising capital. We estimate that domestic fund managers have over $1.4 billion of capital looking for investment opportunities. Most of this capital is with mid-market managers investing in medium-sized businesses. Whilst Covid lockdowns impacted some fund-raising processes, other funds were raised relatively quickly as investors continued to seek access to private capital opportunities with proven Managers. An encouraging development has been the opening presence of KiwiSaver funds in recently raised funds.The Government Elevate Fund was established for a launch in early 2020 to support the early-stage Series A/B venture domestic private capital market. At the time of this report, Elevate had announced commitments to four fund managers representing approximately 30% of the fund. Several new venture funds have launched fund-raising adding to the prospect of further Series A/B capital available for early-stage companies.
OutlookThe positive outlook of survey participants is optimistic compared to the prior year survey. The post-Covid recovery growth offers new Investment opportunities in private New Zealand companies and good prospects for experienced managers to accelerate growth and build capability. Institutional investors to continue to support mandates targeting private capital.
Industry developmentWe are actively engaged with Government as a voice for private capital. We were able to contribute private capital views to the government during the development of Covid related programmes for New Zealand businesses.Lack of access to internationally capable senior executives in technical roles is a current issue impacting businesses. We continue to share our concerns with Government. The view of the private market community is clear that growth equity transactions are never just about capital – there are numerous additional benefits alongside the money. Private capital investors offer a range of skills and disciplines to complement and support a company so that opportunities are maximised.An important ambition is to improve our capacity to connect business owners with the capital they need and to help businesses navigate and understand the world of private capital, and to dispel some of the negative myths.As an industry body, we continue to explore ways to promote excellent outcomes for all stakeholders. Our focus is on being more vocal about the combined strength of investors, fund managers and company owners in building strong and enduring New Zealand companies.Professional development best practice workshops for members include governance requirements (i.e., AML, CRS, FATCA) and increased focus on ESG and Climate Risk.I encourage you to support the Association’s efforts and wherever possible, to contribute to the conversation around accelerating growth and improving productivity through the continued development of New Zealand’s private capital markets.
“
16 | New Zealand Private Capital Monitor 2021
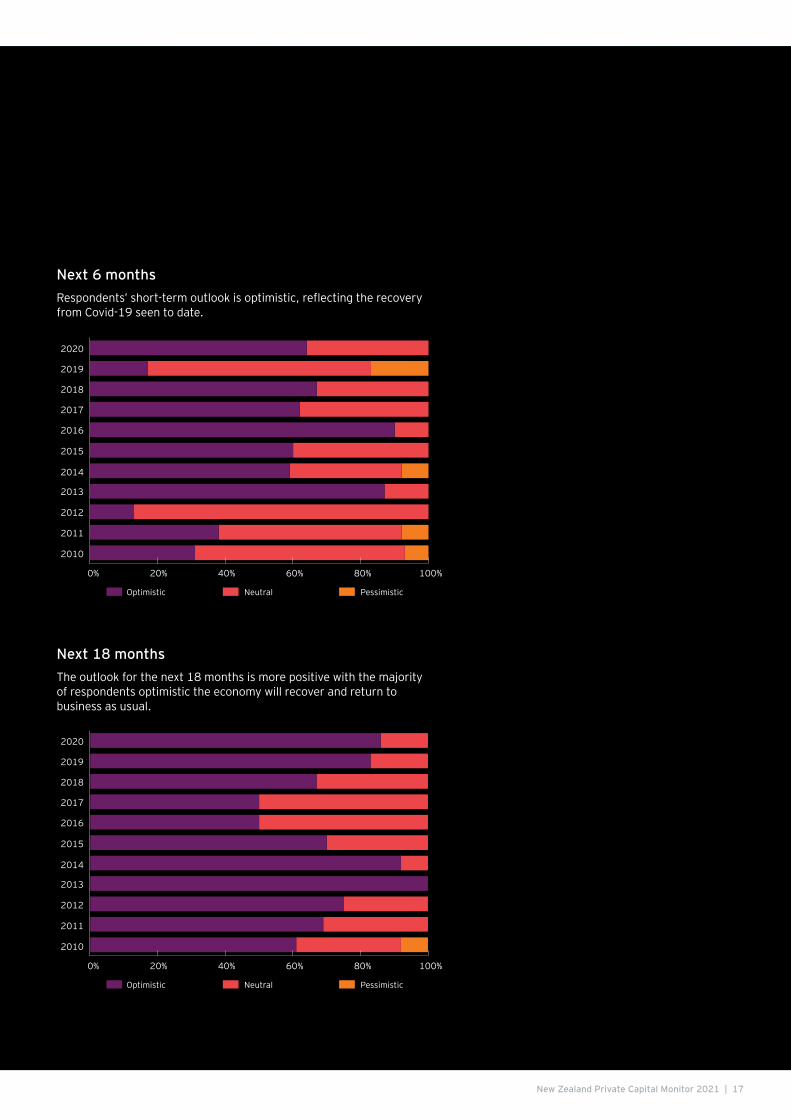
Industry outlookEach year we ask respondents about their outlook for New Zealand Private Capital. The outlook for the New Zealand private capital market is optimistic compared to 2019 due to the recovery from COVID-19 both in New Zealand and across the global economy. Fund managers highlighted key factors affecting portfolio companies as a result of the pandemic, including ongoing global disruption including supply chain issues, challenges of meeting growth plans in a period of global economic uncertainty, and availability of debt funding.
Plans for investee companiesRespondents were asked their plans in relation to new investee companies. In 2020 these plans included:• Expanding into new markets• Increasing headcount• Increasing capital expenditure• Launching new products• Market acquisitions
Challenges & opportunitiesRespondents identified the following factors which they consider will impact venture capital and private equity activity in New Zealand over the next 12 months.Venture capital respondents noted: • Challenges include: lack of software development talent, shortage of human
capital, rising labour costs, valuation expectations of vendors and market conditions in 3-5years.
• Opportunities include low interest rate environment and multiple choice of investment opportunities/exit options.
Private equity respondents highlighted the following:• Challenges include: strong competition with continued pricing pressure, debt
appetite from Australian banks, shortage of human capital, sustainability/climate change concerns, high level of dry power, ongoing effects of Covid-19, border policy and supply chain constraints.
• Many new Venture funds emerging bringing challenges as well — competing for deals and attracting capital.
• Opportunities include low interest rate environment investment opportunities accelerating shift to digital.
Outlook
The outlook for the New Zealand
private capital market is optimistic
compared to 2019 due to the recovery from
COVID-19 both in New Zealand and across the global economy. Private capital funds are
well-placed to help accelerate the ambition of
many New Zealand businesses.
Brad Wheeler Partner, EY New Zealand
“
New Zealand Private Capital Monitor 2021 | 17
Next 6 monthsRespondents’ short-term outlook is optimistic, reflecting the recovery from Covid-19 seen to date.
2020
2019
2018
2017
2016
2015
2014
2013
2012
2011
2010
0% 20% 40% 60% 80% 100%
Optimistic Neutral Pessimistic
2020
2019
2018
2017
2016
2015
2014
2013
2012
2011
2010
0% 20% 40% 60% 80% 100%
Optimistic Neutral Pessimistic
Next 18 monthsThe outlook for the next 18 months is more positive with the majority of respondents optimistic the economy will recover and return to business as usual.
18 | New Zealand Private Capital Monitor 2021
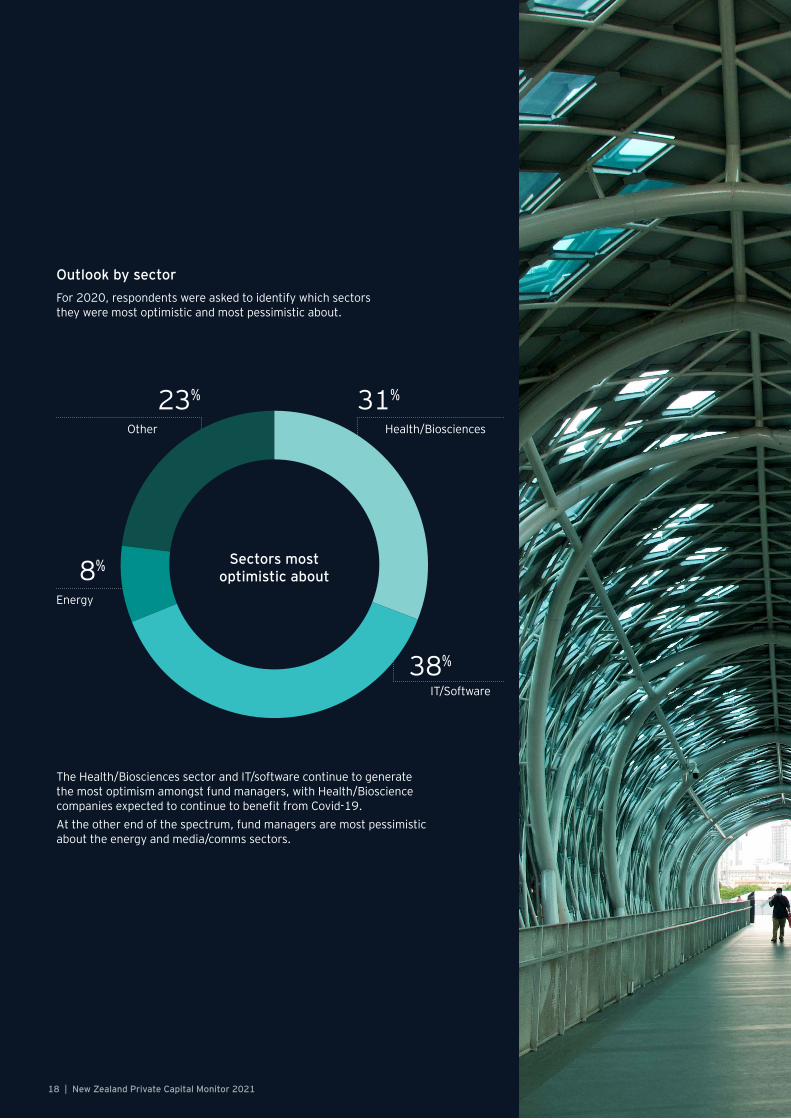
Outlook by sectorFor 2020, respondents were asked to identify which sectors they were most optimistic and most pessimistic about.
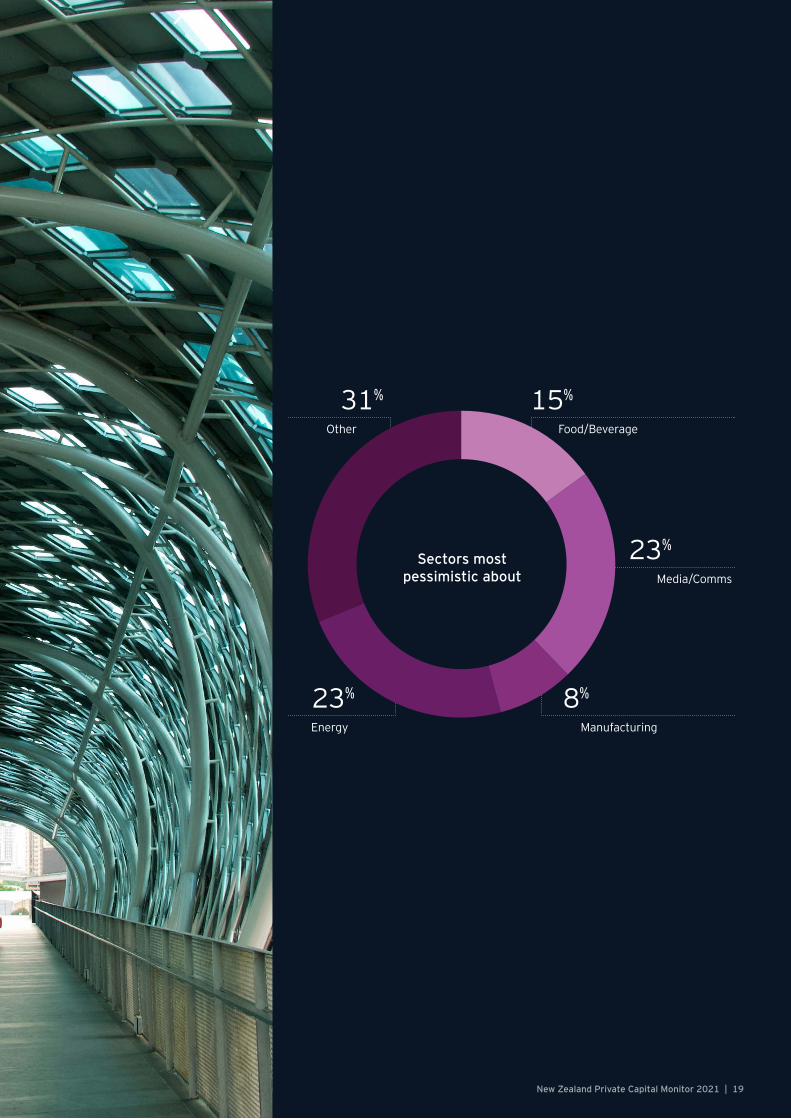
The Health/Biosciences sector and IT/software continue to generate the most optimism amongst fund managers, with Health/Bioscience companies expected to continue to benefit from Covid-19. At the other end of the spectrum, fund managers are most pessimistic about the energy and media/comms sectors.
31%23%
38%
Health/BiosciencesOther
IT/Software
8%
Energy
Sectors most optimistic about
New Zealand Private Capital Monitor 2021 | 19
15%31%
23%
8%23%
Food/BeverageOther
Media/Comms
ManufacturingEnergy
Sectors most pessimistic about

20 | New Zealand Private Capital Monitor 2021
FY10 FY11 FY12 FY13 FY14 FY15 FY16 FY17 FY18 FY19 FY20
Investment
Venture capital 94.4 36.6 26.8 54.8 55.8 54.5 95.2 217.3 269.7 112.2 127.2
Mid-market PE 130.0 223.0 84.6 191.5 243.5 292.1 100.8 333.7 245.0 398.8 735.8
Buy-out 70.0 294.5 0.0 210.0 0.0 0.0 1,005.6 323.0 579.0 635.0 1,556.0
294.4 554.0 111.4 456.2 299.3 346.6 1,201.6 876.0 1,093.6 1,145.9 2,419.0
Investment (transactions of known values only)
Venture capital 67.0 70.0 50.0 66.0 62.0 68.0 53.0 50.0 41.0 46.0 92
Mid-market PE 14.0 12.0 12.0 15.0 19.0 18.0 11.0 17.0 19.0 29.0 34
Buy-out 1.0 2.0 0.0 1.0 0.0 0.0 5.0 3.0 3.0 2.0 2
82.0 84.0 62.0 82.0 81.0 86.0 69.0 70.0 63.0 77.0 128
Divestment
Venture capital 1.8 0.0 0.0 0.0 0.4 0.0 0.0 51.2 1.1 6.6 0.0
Mid-market PE 108.2 116.3 76.7 20.2 148.3 147.8 134.9 62.4 100.8 91.9 111.9
Buy-out 0.0 791.6 0.0 645.2 471.6 0.0 223.4 0.0 503.4 935.6 0
110.0 907.9 76.7 665.4 620.3 147.8 358.3 113.6 605.3 1,034.2 111.9
Divestment (no. of transactions)
Venture capital 2.0 0.0 0.0 1.0 2.0 0.0 0.0 3.0 1.0 7.0 1
Mid-market PE 5.0 7.0 5.0 3.0 5.0 4.0 5.0 4.0 4.0 4.0 4
Buy-out 0.0 3.0 0.0 3.0 2.0 0.0 4.0 0.0 3.0 3.0 0
7.0 10.0 5.0 7.0 9.0 4.0 9.0 7.0 8.0 14.0 5
Total activity (Investments and divestments) NZ$ millions
Venture capital 96.2 36.6 26.8 54.8 56.2 54.5 95.2 269.3 271.1 118.8 127.2
Mid-market PE 238.2 339.2 161.3 211.7 391.7 439.9 235.7 396.1 345.7 490.7 847.7
Buy-out 70.0 1,086.1 0.0 855.2 471.6 0.0 1,229.0 325.0 1,082.4 1,570.6 1,556.0
404.4 1,461.9 188.1 1,121.7 919.5 494.4 1,559.0 990.4 1,699.93 2,180.1 2,530.9
Average invest transaction size
Venture capital 1.4 0.5 0.5 0.8 0.9 0.8 1.8 4.4 6.6 2.4 1.4
Mid-market PE 9.3 18.6 7.0 12.8 12.8 16.2 9.2 19.6 12.9 13.8 21.6
Buy-out 70.0 147.2 0.0 210.0 0.0 0.0 201.1 108.3 193.0 317.5 778.0
Average for all 3.6 6.6 1.8 5.6 3.7 4.0 17.4 12.5 17.4 14.9 18.9
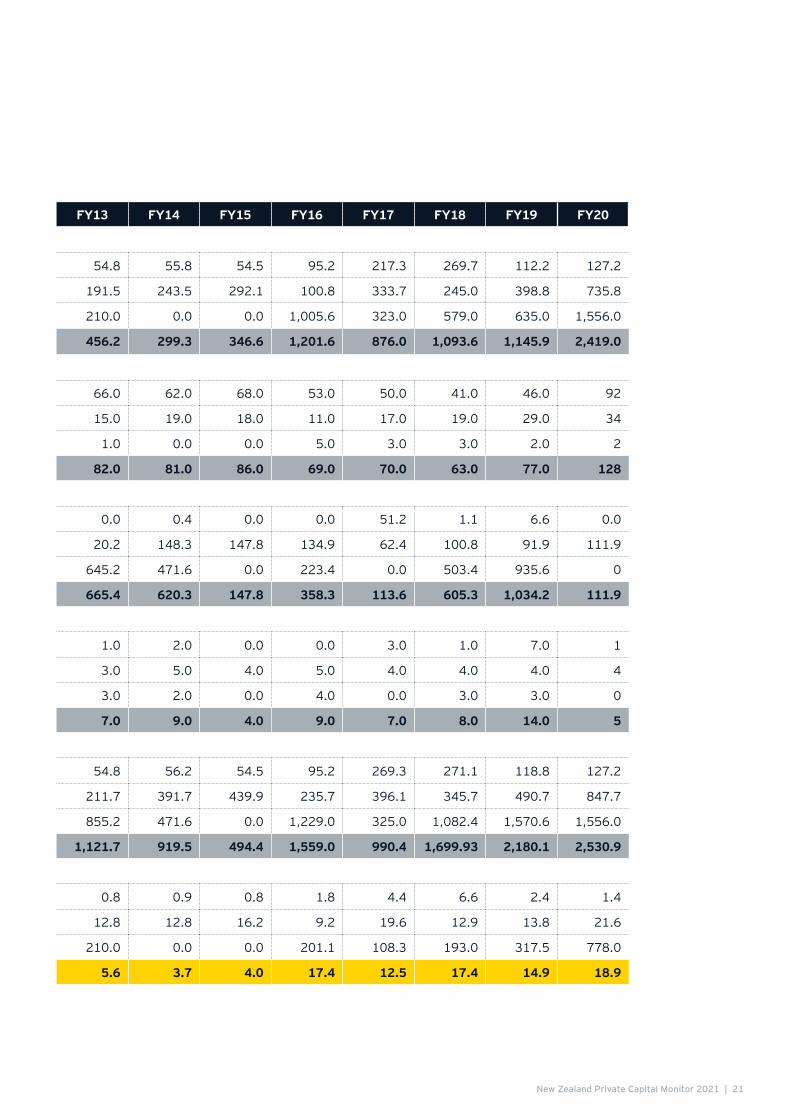
Activity summary
New Zealand Private Capital Monitor 2021 | 21
FY10 FY11 FY12 FY13 FY14 FY15 FY16 FY17 FY18 FY19 FY20
Investment
Venture capital 94.4 36.6 26.8 54.8 55.8 54.5 95.2 217.3 269.7 112.2 127.2
Mid-market PE 130.0 223.0 84.6 191.5 243.5 292.1 100.8 333.7 245.0 398.8 735.8
Buy-out 70.0 294.5 0.0 210.0 0.0 0.0 1,005.6 323.0 579.0 635.0 1,556.0
294.4 554.0 111.4 456.2 299.3 346.6 1,201.6 876.0 1,093.6 1,145.9 2,419.0
Investment (transactions of known values only)
Venture capital 67.0 70.0 50.0 66.0 62.0 68.0 53.0 50.0 41.0 46.0 92
Mid-market PE 14.0 12.0 12.0 15.0 19.0 18.0 11.0 17.0 19.0 29.0 34
Buy-out 1.0 2.0 0.0 1.0 0.0 0.0 5.0 3.0 3.0 2.0 2
82.0 84.0 62.0 82.0 81.0 86.0 69.0 70.0 63.0 77.0 128
Divestment
Venture capital 1.8 0.0 0.0 0.0 0.4 0.0 0.0 51.2 1.1 6.6 0.0
Mid-market PE 108.2 116.3 76.7 20.2 148.3 147.8 134.9 62.4 100.8 91.9 111.9
Buy-out 0.0 791.6 0.0 645.2 471.6 0.0 223.4 0.0 503.4 935.6 0
110.0 907.9 76.7 665.4 620.3 147.8 358.3 113.6 605.3 1,034.2 111.9
Divestment (no. of transactions)
Venture capital 2.0 0.0 0.0 1.0 2.0 0.0 0.0 3.0 1.0 7.0 1
Mid-market PE 5.0 7.0 5.0 3.0 5.0 4.0 5.0 4.0 4.0 4.0 4
Buy-out 0.0 3.0 0.0 3.0 2.0 0.0 4.0 0.0 3.0 3.0 0
7.0 10.0 5.0 7.0 9.0 4.0 9.0 7.0 8.0 14.0 5
Total activity (Investments and divestments) NZ$ millions
Venture capital 96.2 36.6 26.8 54.8 56.2 54.5 95.2 269.3 271.1 118.8 127.2
Mid-market PE 238.2 339.2 161.3 211.7 391.7 439.9 235.7 396.1 345.7 490.7 847.7
Buy-out 70.0 1,086.1 0.0 855.2 471.6 0.0 1,229.0 325.0 1,082.4 1,570.6 1,556.0
404.4 1,461.9 188.1 1,121.7 919.5 494.4 1,559.0 990.4 1,699.93 2,180.1 2,530.9
Average invest transaction size
Venture capital 1.4 0.5 0.5 0.8 0.9 0.8 1.8 4.4 6.6 2.4 1.4
Mid-market PE 9.3 18.6 7.0 12.8 12.8 16.2 9.2 19.6 12.9 13.8 21.6
Buy-out 70.0 147.2 0.0 210.0 0.0 0.0 201.1 108.3 193.0 317.5 778.0
Average for all 3.6 6.6 1.8 5.6 3.7 4.0 17.4 12.5 17.4 14.9 18.9

22 | New Zealand Private Capital Monitor 2021
The surveyThe New Zealand Private Capital survey is based on responses received from venture capital and private equity participants in the New Zealand market, including firms from both New Zealand and Australia. The values reported represent the equity component of transactions only. We have also included in our analysis any publicly announced information, acknowledging S&P Capital IQ as a source of data, in addition to venture capital activity as reported in Start Up Investment magazine including data collected by NZ Growth Capital Partners We do note that there are a small number of industry participants that elect not to participate.
Data integrity/privacy policyAll data received through The New Zealand Private Capital survey process is the property of the NZ Private Capital and EY. Other than for use in the monitor document, all data is subject to the principles of EY’s Privacy Policy and will not be sold or released to any other parties.If you are aware of a colleague that did not receive a copy of the New Zealand Private Capital Monitor or if you would like to participate in future surveys, please contact either Brad Wheeler or Tom Goad at EY or Colin McKinnon at NZ Private Capital. Contact details are provided below.
About EY Strategy and Transactions (SaT)How organisations manage their capital agenda today will define their competitive position tomorrow. We work with our clients to help them make better and more informed decisions about how they strategically manage capital and transactions in a changing world. Whether you’re preserving, optimising, raising or investing capital, EY’s Strategy and Transactions bring together a unique combination of skills, insight and experience to deliver tailored advice attuned to your needs — helping you drive competitive advantage and increased shareholder returns through improved decision making across all aspects of your capital agenda.
For more information about the New Zealand Private Capital Monitor or to find out more about EY, please contact one of the specialists noted below:
Brad WheelerPartnerEY New Zealand Mob: +64 21 228 [email protected]
Andrew Taylor PartnerEY New Zealand Mob: +64 27 289 [email protected]
Tom GoadPartnerEY New Zealand Mob: +64 27 489 [email protected]
About the survey

New Zealand Private Capital Monitor 2021 | 23
About the NZ Private Capital Association NZ Private Capital is a not-for-profit industry body committed to developing the venture capital and private equity industry in New Zealand. Its core objectives include the promotion of the industry and the asset class on both a domestic and international basis and working to create a world-class venture capital and private equity environment.Members include venture capital and private equity investors, financial organisations, professional advisors, academic organisations and government or quasi-government agencies.For further information about the NZ Private Capital please contact:
Colin McKinnonExecutive DirectorNZ Private CapitalMob: +64 27 640 [email protected]
Andrew FrankhamChair NZ Private Capital [email protected]
EY | Building a better working world
EY exists to build a better working world, helping to create long-term value for clients, people and society and build trust in the capital markets.
Enabled by data and technology, diverse EY teams in over 150 countries provide trust through assurance and help clients grow, transform and operate.
Working across assurance, consulting, law, strategy, tax and transactions, EY teams ask better questions to find new answers for the complex issues facing our world today.
EY refers to the global organization, and may refer to one or more, of the member firms of Ernst & Young Global Limited, each of which is a separate legal entity. Ernst & Young Global Limited, a UK company limited by guarantee, does not provide services to clients. Information about how EY collects and uses personal data and a description of the rights individuals have under data protection legislation are available via ey.com/privacy. EY member firms do not practice law where prohibited by local laws. For more information about our organization, please visit ey.com.
© 2021 Ernst & Young New Zealand. All Rights Reserved.
APAC No. NZ00001185NZ20215-000676ED None
This communication provides general information which is current at the time of production. The information contained in this communication does not constitute advice and should not be relied on as such. Professional advice should be sought prior to any action being taken in reliance on any of the information. Ernst & Young disclaims all responsibility and liability (including, without limitation, for any direct or indirect or consequential costs, loss or damage or loss of profits) arising from anything done or omitted to be done by any party in reliance, whether wholly or partially, on any of the information. Any party that relies on the information does so at its own risk. The views expressed in this article are the views of the author, not Ernst & Young.
ey.com