Embed Size (px)
Citation preview
New Zealand’s Preferential Trading
Arrangements: Implications for the New Zealand Dairy Industry
Sam Howard1, Hamish Gow, and Hatice Ozer-Balli
Massey University [email protected]
Paper presented at the 2011 NZARES Conference
Tahuna Conference Centre – Nelson, New Zealand. August 25-26, 2011
Copyright by author(s). Readers may make copies of this document for non-commercial purposes only, provided that this copyright notice appears on all such copies

New Zealand’s preferential trading arrangements: Implications
for the New Zealand dairy industry.
Sam Howard1, Massey University
Supervisors: Prof. Hamish Gow and Dr. Hatice Ozer-Balli, Massey University.
August 2011
This paper discusses the economic implications of the preferential trade agreements that New
Zealand is currently negotiating, using a computable general equilibrium modelling
framework. The New Zealand dairy industry is a particular focus in the results, which come
from the GTAP model produced by Purdue University. Results are discussed from the
independent simulations of preferential trade agreements between New Zealand and Korea,
New Zealand and India, New Zealand and Russia, Belarus and Kazakhstan, New Zealand and
the Gulf Cooperation Council, and expansion of the Trans-Pacific Partnership to include
Australia, Peru, Viet Nam, Malaysia, and the United States of America.
Key words: New Zealand, dairy industry, preferential trade agreements.
I would like to acknowledge the advice of Professor Allan Rae regarding the methodology of
this study.

1. Introduction
The global movement towards trade liberalisation has increasingly focused on the negotiation
of bilateral and regional trade agreements among two or more countries. New Zealand, as a
small open economy that is heavily dependent on international trade, is particularly active in
conducting such negotiations. Preferential trading arrangements may have both positive and
negative effects, depending on the perspective of those viewing such an agreement.
The aim of this study is to analyse the economic effects of the preferential trade agreements
that New Zealand is currently negotiating, from the perspective of New Zealand‟s dairy
industry. Five agreements are examined: New Zealand‟s negotiations with Russia, Belarus
and Kazakhstan; Korea; India; and the Gulf Cooperation Council; as well as the possible
expansion of the Trans-Pacific Partnership. This study makes use of the GTAP computable
general equilibrium model to estimate the effects of these agreements. The implications of
each agreement on prices, output, and the volume and value of exports of the New Zealand
dairy industry are discussed, as well as the overall effects on welfare for New Zealand. From
the simulation results, it can be seen that positive overall welfare results will be seen for New
Zealand from all of the preferential trade agreements under negotiation, while the largest
benefit for New Zealand‟s dairy industry will come from the expansion of the Trans-Pacific
Partnership, so long as the expansion includes the United States of America.
The paper is structured as follows: A brief discussion of trade policy, both of a theoretical
nature and specific to New Zealand, provides the context for this study. The GTAP model is
then introduced, followed by a fairly detailed description of the methodology employed in
this study. Both the construction of the baseline and the simulations are covered so that
readers may have the information needed to replicate the results. Limitations are then
discussed, before an exploration of the simulation results. The listing of aggregations used in
the GTAP model rounds out the information needed to replicate this study.
2. Trade Policy
There is wide support for the notion that universally free trade is the first best Pareto outcome
in trade policy (Bhagwati, 2008; Koo & Lynn Kennedy, 2005; Rae, Chatterjee, & Shakur,
2001).
Empirical research shows that an open domestic market (i.e. one with few or no
impediments to trade) focuses individuals and businesses into areas of specialisation
and exchange where they have a comparative advantage (Bagrie, Goh, Williams,
Croy, Zollner, Edwards, Smith, et al., 2011, p. 2).
If individuals and businesses operate in the areas in which they hold comparative advantage,
that is, where theirs is the lowest opportunity cost of production, allocative efficiency is
maximised. Improvements in allocative efficiency result in economic growth, since resources
are being used more efficiently. Free trade will thus, in theory, maximise economic growth in
comparison to other trade policy agendas.

McConnell et al. (2009) describe how trade barriers lessen or eliminate gains from
specialisation. Due to the diverse wants of consumers, countries that uphold trade barriers
must shift resources from efficient to inefficient production, thus reducing the benefits from
specialisation and trade. LeClair (1997) points out that the costs of trade protection exceed
the benefits of that protection to domestic producers. An additional benefit of free trade is the
tendency to promote competition and innovation amongst producers, thus increasing
efficiency and promoting economic growth (McConnell et al., 2009).
All nations accept the importance of free trade to improve production efficiency and
consumer utility, and to obtain benefits from free trade by increasing their exports
(Koo & Lynn Kennedy, 2005, p. 96).
Nations looking to generate trade growth through the liberalisation of international trade are
presented with two main options. Much importance is placed on multilateral negotiations
under the World Trade Organisation, while many countries are increasingly negotiating
towards implementing bilateral and regional free trade agreements. A bilateral free trade
agreement is an agreement between two nations that improves their ability to trade with each
other, through breaking down the barriers involved in such transactions. As such, a free trade
agreement improves market access and strengthens trade flows (Siriwardana & Yang, 2008),
and may eventually lead to closer economic integration between the two nations2 (Ministry of
Foreign Affairs and Trade, 2009). A regional trade agreement is a similar concept, although
may include more than two countries. There is the possibility that a free trade agreement may
include more than two countries who are not strictly regional partners, or that, at least in the
short-term, trade is not totally free of duties, so preferential trade agreement (PTA) is perhaps
a more suitable term to describe these policies.
It should be noted at this stage that Bhagwati (2008) is unwavering in the distinction he draws
between universal free trade as desired in WTO multilateral negotiations, and the version of
free(r) trade that PTAs offer. Bhagwati does not believe that PTAs offer a movement towards
free trade, he rather believes that PTAs have a distortionary effect on world trade, and are
therefore undesirable. Rae, Chatterjee and Shakur (2001, p. 305) highlight that assessing the
impacts of discriminatory trade liberalisation “is an exercise in the theory of the second best
as it is only universal free trade that offers the first best Pareto optimum”.
New Zealand actively seeks to progress its trade agenda through the negotiation of
preferential trade agreements, while still placing great importance on multilateral WTO
negotiations. New Zealand currently has eight bilateral and regional free trade agreements in
place (Ministry of Foreign Affairs and Trade, 2011). These agreements are championed as
the success story of New Zealand‟s trade policy:
2 An example is provided by Australia and New Zealand’s Closer Economic Relations, where the two countries
have moved from liberalising trade in goods and services towards deeper cooperation in policies, laws and regulatory regimes (Ministry of Foreign Affairs and Trade, 2005).
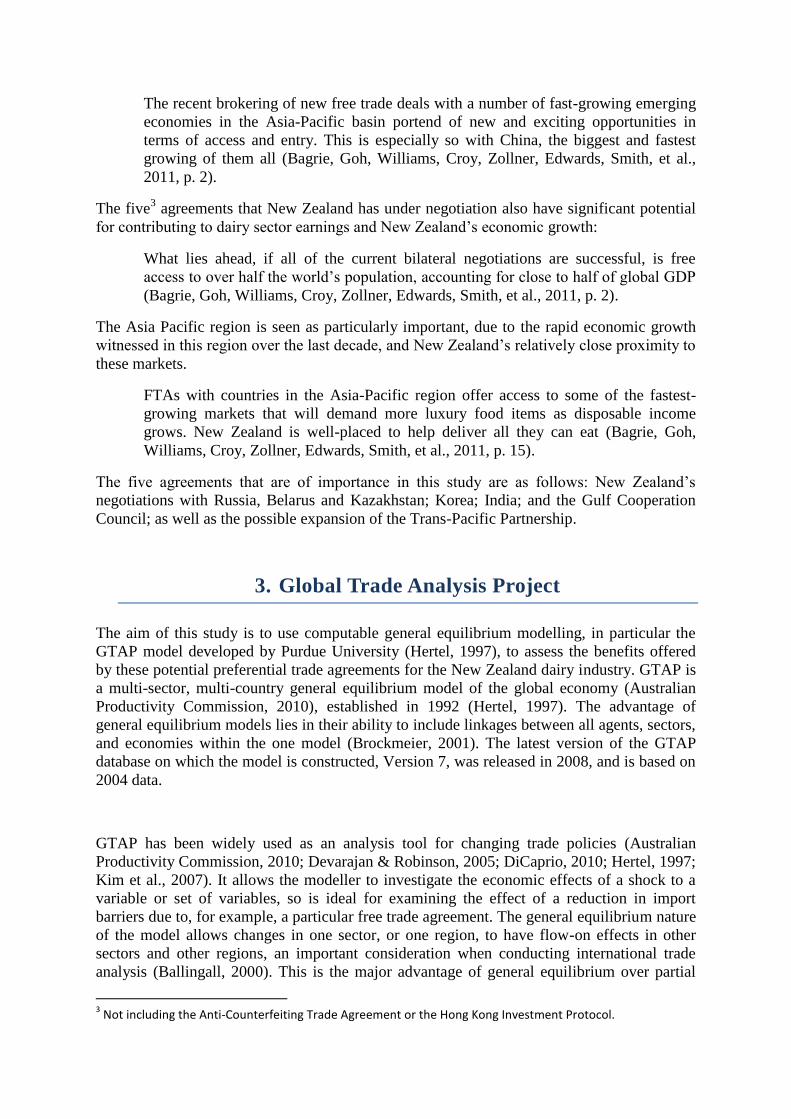
The recent brokering of new free trade deals with a number of fast-growing emerging
economies in the Asia-Pacific basin portend of new and exciting opportunities in
terms of access and entry. This is especially so with China, the biggest and fastest
growing of them all (Bagrie, Goh, Williams, Croy, Zollner, Edwards, Smith, et al.,
2011, p. 2).
The five3 agreements that New Zealand has under negotiation also have significant potential
for contributing to dairy sector earnings and New Zealand‟s economic growth:
What lies ahead, if all of the current bilateral negotiations are successful, is free
access to over half the world‟s population, accounting for close to half of global GDP
(Bagrie, Goh, Williams, Croy, Zollner, Edwards, Smith, et al., 2011, p. 2).
The Asia Pacific region is seen as particularly important, due to the rapid economic growth
witnessed in this region over the last decade, and New Zealand‟s relatively close proximity to
these markets.
FTAs with countries in the Asia-Pacific region offer access to some of the fastest-
growing markets that will demand more luxury food items as disposable income
grows. New Zealand is well-placed to help deliver all they can eat (Bagrie, Goh,
Williams, Croy, Zollner, Edwards, Smith, et al., 2011, p. 15).
The five agreements that are of importance in this study are as follows: New Zealand‟s
negotiations with Russia, Belarus and Kazakhstan; Korea; India; and the Gulf Cooperation
Council; as well as the possible expansion of the Trans-Pacific Partnership.
3. Global Trade Analysis Project
The aim of this study is to use computable general equilibrium modelling, in particular the
GTAP model developed by Purdue University (Hertel, 1997), to assess the benefits offered
by these potential preferential trade agreements for the New Zealand dairy industry. GTAP is
a multi-sector, multi-country general equilibrium model of the global economy (Australian
Productivity Commission, 2010), established in 1992 (Hertel, 1997). The advantage of
general equilibrium models lies in their ability to include linkages between all agents, sectors,
and economies within the one model (Brockmeier, 2001). The latest version of the GTAP
database on which the model is constructed, Version 7, was released in 2008, and is based on
2004 data.
GTAP has been widely used as an analysis tool for changing trade policies (Australian
Productivity Commission, 2010; Devarajan & Robinson, 2005; DiCaprio, 2010; Hertel, 1997;
Kim et al., 2007). It allows the modeller to investigate the economic effects of a shock to a
variable or set of variables, so is ideal for examining the effect of a reduction in import
barriers due to, for example, a particular free trade agreement. The general equilibrium nature
of the model allows changes in one sector, or one region, to have flow-on effects in other
sectors and other regions, an important consideration when conducting international trade
analysis (Ballingall, 2000). This is the major advantage of general equilibrium over partial
3 Not including the Anti-Counterfeiting Trade Agreement or the Hong Kong Investment Protocol.

equilibrium analysis, which will only consider effects in the one sector or region, and ignore
the linkages to other sectors and regions (Anderson, 2005).
Computable general equilibrium models are of course just a stylised model of the global
economy, a simplification of reality. They rely upon assumptions about economic parameters,
behaviour, and relationships. While CGE models can quantitatively indicate whether a PTA
will have a positive or negative outcome, and the magnitude of such an outcome, there are
also numerous other considerations, qualitative and geopolitical, that are important in
determining whether a PTA will be suitable for the countries involved (Kim et al., 2007).
A brief report on the GTAP analysis conducted for the possible New Zealand – India Free
Trade Agreement is published in the joint feasibility study of the respective governments,
released in 2009 (Government of India & New Zealand Government, 2009). Likewise, a joint
research report on the feasibility of the New Zealand – Korea Free Trade Agreement includes
a brief analysis of the results of a GTAP simulation of that agreement (Kim et al., 2007),
although the main modelling focus in that report seems to the Centre for International
Economics‟ dynamic GCubed model. Where this study differs is the attempt to bring together
all of New Zealand‟s potential preferential trade agreements in one study, while providing a
more in-depth analysis of the implications for the New Zealand dairy industry.
4. Methodology
Due to the age of the seventh version of the GTAP database, this study follows the approach
set out by Anderson, Hoekman and Strutt (2001). Their study of the potential benefits
existing from further trade liberalisation following the implementation of Uruguay Round
commitments took place before these commitments were fully implemented. The study,
undertaken in 2001, simulated further trade liberalisation taking place in 2005. Further, the
study used version 3 of the GTAP database, which was based upon 1992 data. In order to
overcome these difficulties, the modellers sourced both historical data and projections on the
growth rates of factors of production and real GDP, and used these to update the version 3
database. Thus, the database was projected forward from 1992 to 2005, assuming no changes
to existing trade and other policies. From this 2005 base, adjustments were made representing
the full implementation of Uruguay Round commitments, providing a baseline for their
simulations of further trade liberalisation occurring post Uruguay Round.
In this study, 2004 data will be used to simulate the effects of changes in trade policy
occurring in the years following 2011. Thus, the database should be updated according to the
growth rates of factors of production and real GDP between 2004 and 2010 (the most
recently available data), and import protection data updated to 2010. Then, since New
Zealand has existing PTAs for which tariff reduction and elimination commitments are not
fully completed, these tariffs must be removed to provide a baseline for the simulation of
New Zealand‟s PTAs under negotiation. This suggests that some point in the future will be a
better base for simulations than the current year. A future year baseline is reinforced when
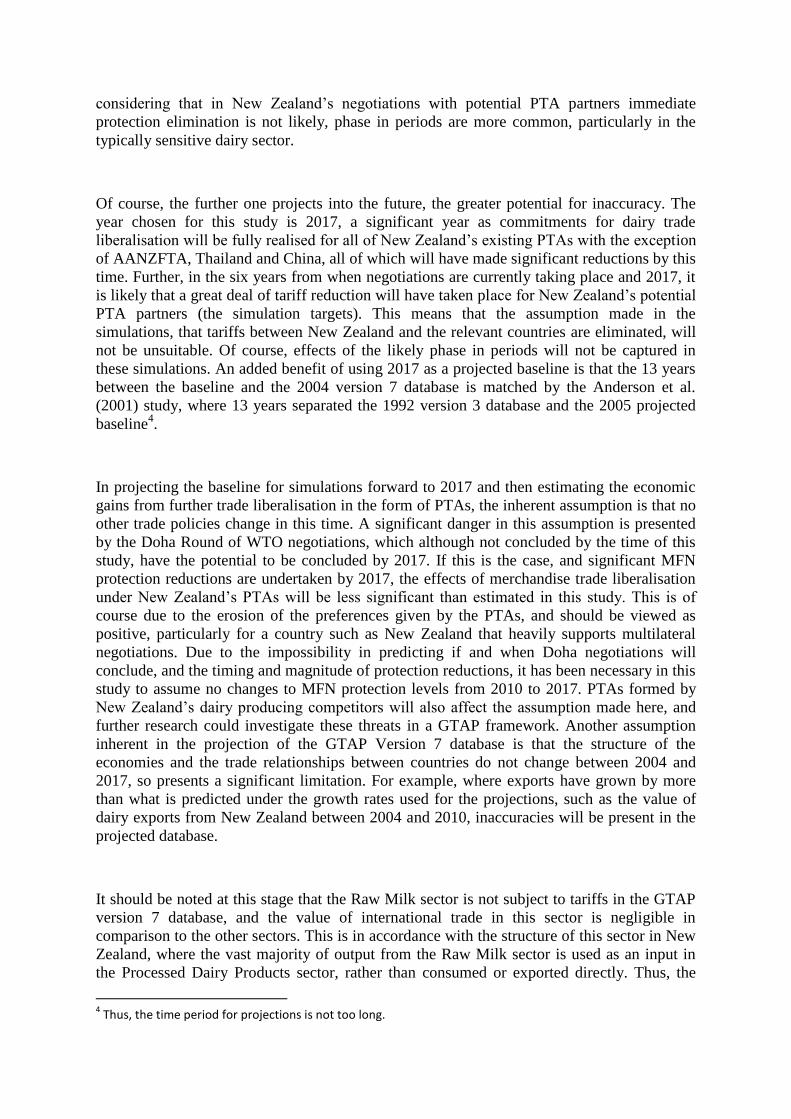
considering that in New Zealand‟s negotiations with potential PTA partners immediate
protection elimination is not likely, phase in periods are more common, particularly in the
typically sensitive dairy sector.
Of course, the further one projects into the future, the greater potential for inaccuracy. The
year chosen for this study is 2017, a significant year as commitments for dairy trade
liberalisation will be fully realised for all of New Zealand‟s existing PTAs with the exception
of AANZFTA, Thailand and China, all of which will have made significant reductions by this
time. Further, in the six years from when negotiations are currently taking place and 2017, it
is likely that a great deal of tariff reduction will have taken place for New Zealand‟s potential
PTA partners (the simulation targets). This means that the assumption made in the
simulations, that tariffs between New Zealand and the relevant countries are eliminated, will
not be unsuitable. Of course, effects of the likely phase in periods will not be captured in
these simulations. An added benefit of using 2017 as a projected baseline is that the 13 years
between the baseline and the 2004 version 7 database is matched by the Anderson et al.
(2001) study, where 13 years separated the 1992 version 3 database and the 2005 projected
baseline4.
In projecting the baseline for simulations forward to 2017 and then estimating the economic
gains from further trade liberalisation in the form of PTAs, the inherent assumption is that no
other trade policies change in this time. A significant danger in this assumption is presented
by the Doha Round of WTO negotiations, which although not concluded by the time of this
study, have the potential to be concluded by 2017. If this is the case, and significant MFN
protection reductions are undertaken by 2017, the effects of merchandise trade liberalisation
under New Zealand‟s PTAs will be less significant than estimated in this study. This is of
course due to the erosion of the preferences given by the PTAs, and should be viewed as
positive, particularly for a country such as New Zealand that heavily supports multilateral
negotiations. Due to the impossibility in predicting if and when Doha negotiations will
conclude, and the timing and magnitude of protection reductions, it has been necessary in this
study to assume no changes to MFN protection levels from 2010 to 2017. PTAs formed by
New Zealand‟s dairy producing competitors will also affect the assumption made here, and
further research could investigate these threats in a GTAP framework. Another assumption
inherent in the projection of the GTAP Version 7 database is that the structure of the
economies and the trade relationships between countries do not change between 2004 and
2017, so presents a significant limitation. For example, where exports have grown by more
than what is predicted under the growth rates used for the projections, such as the value of
dairy exports from New Zealand between 2004 and 2010, inaccuracies will be present in the
projected database.
It should be noted at this stage that the Raw Milk sector is not subject to tariffs in the GTAP
version 7 database, and the value of international trade in this sector is negligible in
comparison to the other sectors. This is in accordance with the structure of this sector in New
Zealand, where the vast majority of output from the Raw Milk sector is used as an input in
the Processed Dairy Products sector, rather than consumed or exported directly. Thus, the
4 Thus, the time period for projections is not too long.

Raw Milk sector does not play a direct part in the trade liberalisation simulations of this
study, rather acting as an input for the Processed Dairy Products sector.
In order to project the GTAP version 7 database forward to 2017, various assumptions are of
course necessary. It is vital for the levels of the endowment commodities (land, natural
resources5, skilled and unskilled labour, and capital) to change at a reasonable rate, as with
total factor productivity (TFP). Production, and therefore output, in the GTAP model depends
upon these assumptions. This study draws on the growth rates developed by Valenzuela and
Anderson (2011), in their projection of the world economy to 2050 using the GTAP model.
Any CGE simulation of trade liberalisation relies upon the accuracy of tariff levels found in
the underlying database. This study has used three steps to ensure the accuracy of those tariff
levels. Firstly, 2004 tariffs6 can be found from UNCTAD‟s TRAINS database using the
WITS software (The World Bank, 2011), and any significant discrepancies corrected7 using
the AlterTax tool in RunGTAP. Fortunately, it is possible to generate trade weighted tariffs
that match up to the GTAP aggregations used in this study, since WITS includes a country
and product group generator (according to HS code). A projection to 2010 can then be
formed using both the WITS software for 2010 tariff levels, and the growth rates as discussed
above from Valenzuela and Anderson (2011). From 2010, Valenzuela and Anderson‟s
projections for population, skilled and unskilled labour, capital and TFP growth can again be
used to shock the model, this time for seven years (2010 to 2017). Any additional trade
liberalisation that should occur as a part of one of New Zealand‟s existing PTAs, where
phase-ins have meant that elimination of tariffs was not complete in 2010, should also be
conducted in the projection to 2017. Thus, all tariffs between New Zealand and its current
PTA partners will be zero following this projection.
As well as the tariff levels relating to New Zealand trade being reduced where a preferential
trade agreement exists, this step has also been taken for PTAs external to New Zealand. This
includes both trade between other members of New Zealand‟s PTAs (such as between
Australia and Malaysia under AANZFTA), and trade under PTAs that do not include New
Zealand (such as Australia and the United States).
Following the projection to 2017, the appropriate baseline for the simulations of the
preferential trade agreements that New Zealand has under negotiation is reached. Independent
simulations for each of these agreements have then been formulated, removing tariffs on all
trade8 between New Zealand and Russia, Belarus and Kazakhstan; New Zealand and Korea;
5 Land and natural resources are here assumed not to change over time.
6 Ad valorem equivalent tariffs.
7 Significant is defined here as greater than 1 percentage point.
8 Since tariff rates are calculated in the GTAP model using a ratio of the value of imports at markets prices in
comparison to the value of imports at world prices, their elimination also represents the removal of non-tariff barriers that drive a wedge between the world price and the market price in the importing country, such as quotas. No relevant export subsidies existed in the agricultural and food sectors in the projected GTAP
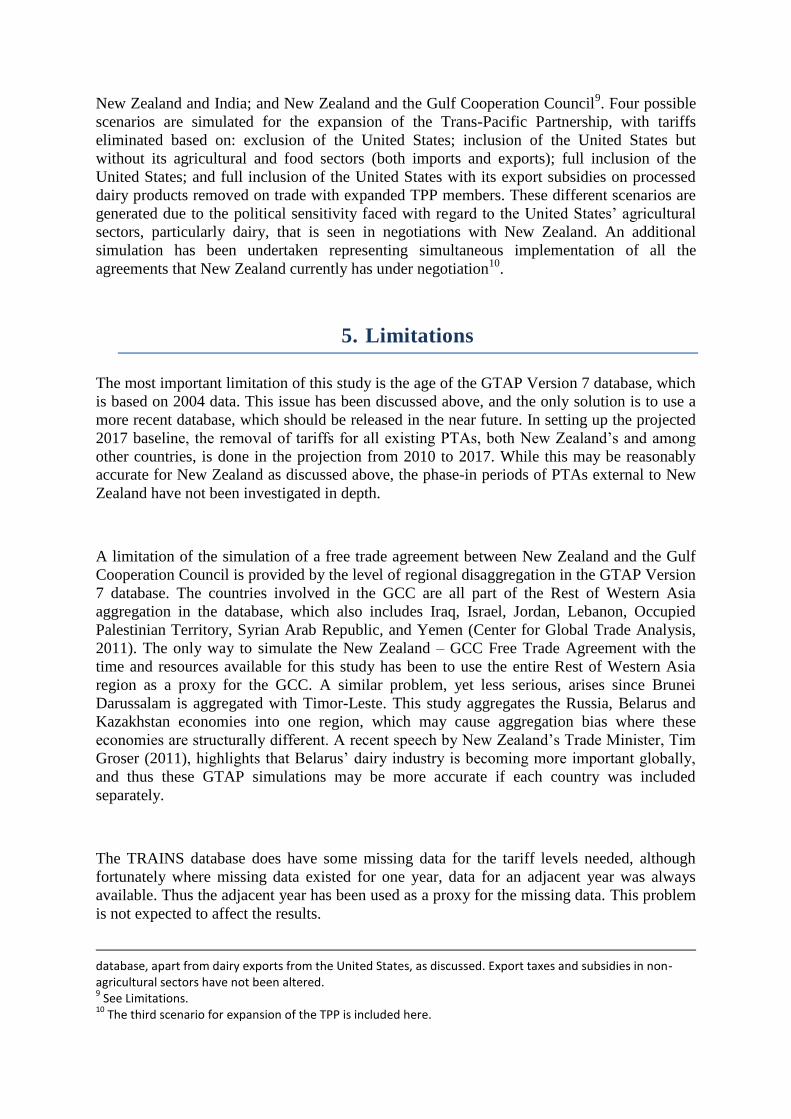
New Zealand and India; and New Zealand and the Gulf Cooperation Council9. Four possible
scenarios are simulated for the expansion of the Trans-Pacific Partnership, with tariffs
eliminated based on: exclusion of the United States; inclusion of the United States but
without its agricultural and food sectors (both imports and exports); full inclusion of the
United States; and full inclusion of the United States with its export subsidies on processed
dairy products removed on trade with expanded TPP members. These different scenarios are
generated due to the political sensitivity faced with regard to the United States‟ agricultural
sectors, particularly dairy, that is seen in negotiations with New Zealand. An additional
simulation has been undertaken representing simultaneous implementation of all the
agreements that New Zealand currently has under negotiation10
.
5. Limitations
The most important limitation of this study is the age of the GTAP Version 7 database, which
is based on 2004 data. This issue has been discussed above, and the only solution is to use a
more recent database, which should be released in the near future. In setting up the projected
2017 baseline, the removal of tariffs for all existing PTAs, both New Zealand‟s and among
other countries, is done in the projection from 2010 to 2017. While this may be reasonably
accurate for New Zealand as discussed above, the phase-in periods of PTAs external to New
Zealand have not been investigated in depth.
A limitation of the simulation of a free trade agreement between New Zealand and the Gulf
Cooperation Council is provided by the level of regional disaggregation in the GTAP Version
7 database. The countries involved in the GCC are all part of the Rest of Western Asia
aggregation in the database, which also includes Iraq, Israel, Jordan, Lebanon, Occupied
Palestinian Territory, Syrian Arab Republic, and Yemen (Center for Global Trade Analysis,
2011). The only way to simulate the New Zealand – GCC Free Trade Agreement with the
time and resources available for this study has been to use the entire Rest of Western Asia
region as a proxy for the GCC. A similar problem, yet less serious, arises since Brunei
Darussalam is aggregated with Timor-Leste. This study aggregates the Russia, Belarus and
Kazakhstan economies into one region, which may cause aggregation bias where these
economies are structurally different. A recent speech by New Zealand‟s Trade Minister, Tim
Groser (2011), highlights that Belarus‟ dairy industry is becoming more important globally,
and thus these GTAP simulations may be more accurate if each country was included
separately.
The TRAINS database does have some missing data for the tariff levels needed, although
fortunately where missing data existed for one year, data for an adjacent year was always
available. Thus the adjacent year has been used as a proxy for the missing data. This problem
is not expected to affect the results.
database, apart from dairy exports from the United States, as discussed. Export taxes and subsidies in non-agricultural sectors have not been altered. 9 See Limitations.
10 The third scenario for expansion of the TPP is included here.

6. Results
It is important that it is recognised that these results reflect economic effects in the long-run,
once adjustment processes have been allowed to move through the economy. They do not
represent over-night changes. The movement from baseline to simulated data shows how the
economy would be different in 2017, had the specific trade liberalisation policies been
enforced by that date, relative to if they had not been implemented (while ignoring phase-in
periods). This is the reason behind the baseline chosen in this study being the year 2017. Of
course, a ceteris paribus assumption is implicit, so that any changes outside of the
adjustments to trade policy modelled will have influences on the accuracy of these results. As
discussed in the Methodology section, the database on which this study‟s projected baseline
is constructed is now seven years old, and as a result dollar figures should not be considered
totally accurate. Proportionate changes are more relevant, after considering the importance of
the various industries and trade linkages as a part of the overall economic system. Also,
services and the dynamic nature of gains from investment are not modelled well in the
standard GTAP model, and also any strategic benefits from an agreement outside of the gains
from liberalised merchandise trade are not recognised. The results presented here should thus
be viewed as an understatement of the effects of any preferential trade agreement.
Overall
The preferential trade agreements that New Zealand has under negotiation show
significant potential benefit for New Zealand, the welfare gain of implementing all
potential PTAs estimated to be US$366 million using the equivalent variation
measure. GDP is estimated to increase by 1.2%.
Implementing all of New Zealand‟s currently under negotiation potential PTAs drives
an almost 4% growth in output of the dairy sectors in New Zealand, with the value of
processed dairy exports increasing by US$284 million (7.6%). The price received by
farmers for their milk increases by almost 3%, while the price of processed dairy
products increases by almost 2%.
The independent implementation of each of New Zealand‟s potential PTAs is
estimated to have positive welfare effects on New Zealand, with the only negative
effects for New Zealand‟s dairy industry seen in the TPP expansion with the United
States‟ agricultural sectors excluded and the agreement between New Zealand and
India.
The largest positive effect on the New Zealand dairy industry comes from expansion
of the Trans-Pacific Partnership when the United States‟ agricultural sectors are
included in tariff elimination and its dairy export subsidies to the TPP partners are
removed. Even if the United States‟ dairy export subsidies are not removed this
agreement still has the greatest benefit for the New Zealand dairy industry. The value
of New Zealand‟s exports of processed dairy products increases by US$111 million in
this case, or US$123 million if the United States‟ export subsidies on processed dairy
are removed as well.
Prices in both the raw milk and processed dairy sectors increase in every simulation,
with the largest increases seen in TPP expansion with the United States‟ agricultural

sectors included in tariff eliminations, and in the agreement between New Zealand
and Korea.
The greatest overall welfare gain for New Zealand comes from the New Zealand –
Korea Free Trade Agreement (US$148 million), closely followed by expansion of the
TPP when the United States removes its tariffs in all sectors and export subsidies for
processed dairy with regard to the expanded TPP partners (US$139 million).
Global welfare declines in all of the simulations with the only exceptions being the
free trade agreements between New Zealand and Russia, Belarus and Kazakhstan,
New Zealand and Korea, and the expansion of the TPP without the United States‟
involvement.
Expansion of the Trans-Pacific Partnership
The expansion of the TPP without the United States‟ involvement has a negligible
impact on New Zealand‟s dairy industry and on total welfare.
When tariffs on exports to the United States are removed for just non-agricultural
sectors, New Zealand slightly shifts its production focus towards forestry and
manufacturing, so that the dairy industry sees a small decline in output and export
volumes. This form of „trade liberalisation‟ therefore slightly moves New Zealand‟s
production away from the areas where it has natural advantage and is an illustration of
the theory of the second best at work. A small welfare gain is however seen from the
agreement.
When the United States‟ agricultural and food sectors are also included in tariff
removal, the welfare gain to New Zealand is over ten times as large, with a US$135
million welfare gain shown. GDP increases by almost half a percent.
The welfare loss experienced by the United States declines by almost half as a result
of including its agricultural and food sectors in tariff eliminations (to US$219
million).
Output in the dairy sector in New Zealand increases by over one and a half percent
when tariffs are removed on exports to the United States. Exports to the United States
increase by 49%, while the value of New Zealand‟s exports of processed dairy
products increases by almost 3%, or around US$111 million.
The global welfare effect of the expanded TPP when the United States is fully
included in tariff elimination is negative, resulting from a significant allocative
efficiency loss. There is an overall welfare gain amongst the countries involved, but
losses to China and the highly aggregated Rest of World region outweigh this.
Preferences given to TPP partners when large import barriers still exist for these other
regions may therefore lead to trade diversion. If more countries were to join, this
external welfare loss would likely become smaller and the agreement would likely
become more beneficial.
When the United States also removes its export subsidy on processed dairy products
exported to the expanded TPP members, New Zealand‟s dairy industry benefits more,
with an almost 2% rise in production and 3.3% rise in the value of its exports
(US$123 million).
The greatest gain for New Zealand from the expansion of the TPP is seen in scenario
4, when the United States removes all its tariffs and export subsidies on processed
dairy. Conversely, the only positive effect on global welfare from expansion of the
TPP comes when the United States is excluded from the agreement.
In all of the simulations of the expanded TPP including the United States, all
countries included in the agreement have experienced an allocative efficiency gain,

with the exception of Singapore which suffers a small loss in each. This provides
evidence that the creation of a free trade „region‟ or trading bloc such as the expanded
TPP would provide has benefits for the allocation of resources within the economies
involved. As expected, these countries largely gain from the increased production
specialisation and international trade that such arrangements encourage.
It is interesting to note that Singapore has suffered a welfare loss in all four of the
TPP expansion scenarios. While this may initially appear to be concerning, the reason
for this must be considered. Singapore is a member of the existing Trans-Pacific
Partnership, and as such has a preferential trade agreement in place with New Zealand
(as well as a separate agreement between the two nations), Chile, and Brunei
Darussalam. Negotiations to expand the TPP include the United States, Australia,
Peru, Viet Nam, and Malaysia. Singapore has a bilateral free trade agreement in place
with both the United States and Peru (Ministry of Foreign Affairs Singapore, 2011), is
a part of the ASEAN free trade area with Viet Nam and Malaysia, and its trade with
Australia is covered under AANZFTA. This means that in the simulations of the
expanded TPP scenarios above, the tariffs faced by Singaporean exports are not
affected11
. Thus, the only effects on Singapore come when its trade with certain
partners is influenced by the erosion of the trade preferences established under its
existing trade policy agenda. However, since Singapore is a small, open economy that
thrives on international trade and as such heavily supports free trade, the strategic
benefits for Singapore of establishing an expanded TPP must surely outweigh the
welfare losses seen in the GTAP simulations above.
New Zealand – Russia – Belarus – Kazakhstan Free Trade Agreement
New Zealand experiences a small welfare gain of US$12 million from the
implementation of a free trade agreement with Russia and its Customs Union partners
Belarus and Kazakhstan.
Following this agreement, the value of New Zealand‟s exports of processed dairy to
Russia, Belarus and Kazakhstan increases by approximately US$52 million (262%).
Output and price increase in the dairy sectors in New Zealand, making dairy farming
in New Zealand more profitable. The total value of New Zealand‟s exports of
processed dairy products increases by US$37 million (1%).
New Zealand – Korea Free Trade Agreement
A free trade agreement with Korea is estimated to result in a US$148 million increase
in welfare for New Zealand, with GDP expected to increase by around half a percent.
Price and output in the dairy sectors in New Zealand increase by around 1% as a
result of the agreement. The value of New Zealand‟s exports of processed dairy to
Korea increases by US$219 million (545%), and by around US$84 million overall
(2.3%).
New Zealand – India Free Trade Agreement
A welfare gain for New Zealand of US$50 million is seen from a free trade agreement
with India, although the estimated effect for India is negative.
Interestingly, output and export volumes in the dairy sectors decline with this
agreement, with production increasing in the cropping, forestry and light
11
Singapore does not practice import protection, as seen in the data collected from the TRAINS database using WITS software.

manufacturing sectors instead. New Zealand‟s cropping exports to India show the
greatest gain in value of the agricultural sectors, while forestry and light
manufacturing are New Zealand‟s two most important exports to India in the
projected GTAP database12
.
New Zealand – Gulf Cooperation Council Free Trade Agreement
A free trade agreement with the Gulf Cooperation Council13
results in a US$29
million welfare gain for New Zealand. The GCC sees a welfare loss, since the influx
of processed dairy products from New Zealand drives down domestic production
while tariffs still remain in New Zealand‟s other export markets, where production
could perhaps be more efficiently reduced (such as Russia, Belarus, Kazakhstan,
India, Korea, or the United States).
Output increases in the New Zealand dairy sectors by over 1%, while the value of
exports to the GCC increases by almost US$100 million (427%). Total growth in the
value of New Zealand‟s dairy exports is around US$67 million (1.8%).
7. Conclusions
The implementation of the preferential trade agreements that New Zealand has under
negotiation is likely to bring significant benefits to the New Zealand economy and the New
Zealand dairy industry. The implementation of all these agreements together sees a US$366
million welfare gain, and a 1.2% higher GDP, in 2017 compared to if the agreements were
not implemented. An estimated 4% larger output in the dairy sectors (both on-farm and in
processed products) and higher prices contribute to a higher export volume and a value for
New Zealand‟s processed dairy exports that is 7.6% higher than without the agreements.
Individually, each of the agreements results in an overall welfare gain for New Zealand.
However, negative effects are seen for the New Zealand dairy industry in the implementation
of a preferential trade agreement with India, and in the expansion of the Trans-Pacific
Partnership if the United States‟ agricultural sectors are excluded from the terms of the
agreement. Due to the limitations of the methods used in this study, these negative effects do
not take into account any possible gains from liberalisation of services trade, investment
rules, or any dynamic effects of such an agreement, while ignoring any changes to the trade
relationships between New Zealand and its relevant trading partners that have occurred since
2004. The largest benefits for the New Zealand dairy industry are seen in the expansion of the
Trans-Pacific Partnership when the United States‟ agricultural sectors are included in tariff
elimination, whether or not its export subsidies to the TPP partners are removed. New
Zealand‟s 2017 export value for processed dairy products is expected to be 3% higher in the
former case, and 3.3% higher in the latter.
12
This seems to be backed up by the profile of New Zealand’s exports to India (Government of India & New Zealand Government, 2009). 13
See Limitations.

Generally, the preferential trade agreements that New Zealand is currently negotiating are
expected to be beneficial for both New Zealand as a nation, and the New Zealand dairy
industry. The very small negative effects seen for the dairy industry of the New Zealand –
India free trade agreement are likely to be more than outweighed by dynamic gains resulting
from the agreement, particularly as the Indian economy continues to develop. Further
research in this area could be targeted at resolving the regional aggregation issues discussed,
and at disaggregating the dairy sector and accounting for joint production possibilities in the
CGE methodology (see Charteris & Winchester, 2010).

GTAP Sectoral Aggregations
Sector GTAP Notation Commodities Covered
Raw Milk RawMilk RMK Raw Milk.
Processed Dairy
Products
DairyProc MIL Dairy Products.
Drystock Farming Lvstock_Wool CTL Bovine cattle, sheep and goats,
horses; OAP Animal products nec; WOL
Wool, silk-worm cocoons.
Meat Products MeatProducts CMT Bovine meat products; OMT Meat
products nec.
Cropping Cropping PDR Paddy rice; WHT Wheat; GRO
Cereal grains nec; V_F Vegetables, fruit,
nuts; OSD Oil seeds; C_B Sugar cane,
sugar beet; PFB Plant-based fibres; OCR
Crops nec.
Other Food OtherFood FSH Fishing; VOL Vegetable oils and
fats; PCR Processed rice; SGR Sugar;
OFD Food products nec; B_T Beverages
and tobacco products.
Forestry Forestry FRS Forestry.
Mining and Extraction Extraction COA Coal; OIL Oil; GAS Gas; OMN
Minerals nec.
Light Manufacturing LightMnfc TEX Textiles; WAP Wearing apparel;
LEA Leather products; LUM Wood
products; PPP Paper products, publishing;
OMF Manufactures nec.
Heavy Manufacturing HeavyMnfc P_C Petroleum, coal products; CRP
Chemical, rubber, plastic products; NMM
Mineral products nec; I_S Ferrous metals;
NFM Metals nec; FMP Metal products;
MVH Motor vehicles and parts; OTN
Transport equipment nec; ELE Electronic
equipment; OME Machinery and
equipment nec.
Services Services ELY Electricity; GDT Gas manufacture,
distribution; WTR Water; CNS
Construction; TRD Trade; OTP Transport
nec; WTP Water transport; ATP Air
transport; CMN Communication; OFI
Financial services nec; ISR Insurance;
OBS Business services nec; ROS
Recreational and other services; OSG
Public administration, defense, education,
health; DWE Dwellings.
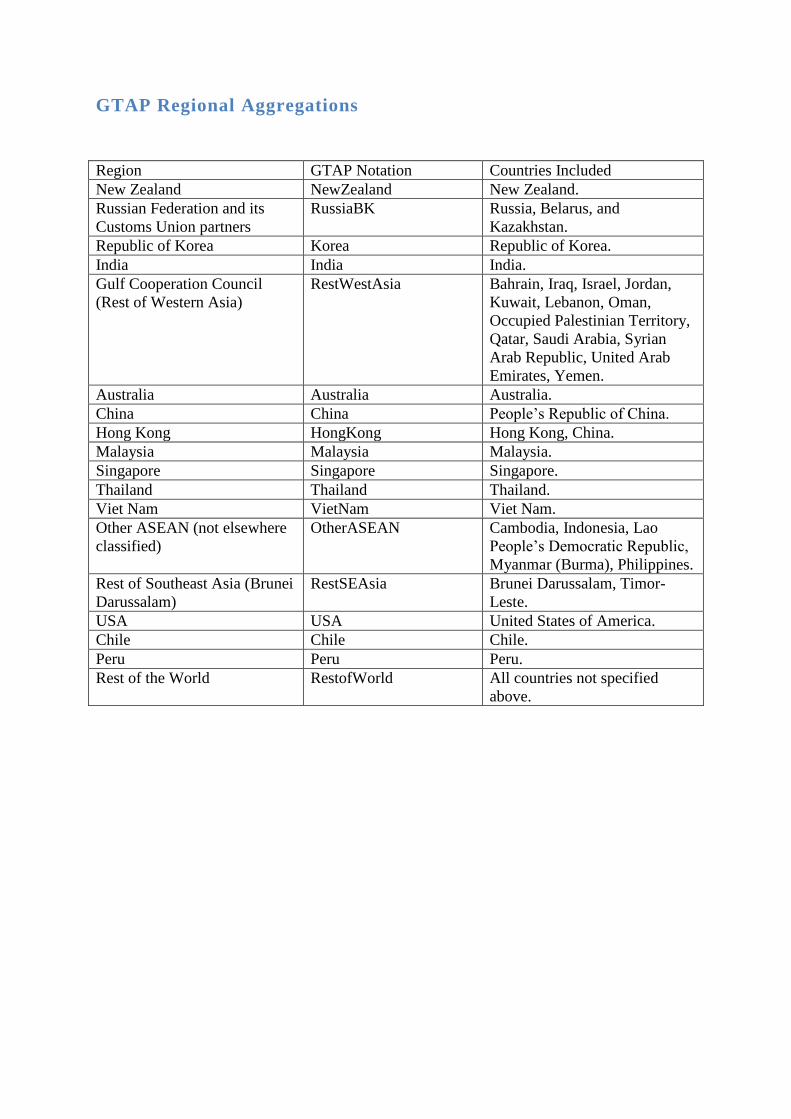
GTAP Regional Aggregations
Region GTAP Notation Countries Included
New Zealand NewZealand New Zealand.
Russian Federation and its
Customs Union partners
RussiaBK Russia, Belarus, and
Kazakhstan.
Republic of Korea Korea Republic of Korea.
India India India.
Gulf Cooperation Council
(Rest of Western Asia)
RestWestAsia Bahrain, Iraq, Israel, Jordan,
Kuwait, Lebanon, Oman,
Occupied Palestinian Territory,
Qatar, Saudi Arabia, Syrian
Arab Republic, United Arab
Emirates, Yemen.
Australia Australia Australia.
China China People‟s Republic of China.
Hong Kong HongKong Hong Kong, China.
Malaysia Malaysia Malaysia.
Singapore Singapore Singapore.
Thailand Thailand Thailand.
Viet Nam VietNam Viet Nam.
Other ASEAN (not elsewhere
classified)
OtherASEAN Cambodia, Indonesia, Lao
People‟s Democratic Republic,
Myanmar (Burma), Philippines.
Rest of Southeast Asia (Brunei
Darussalam)
RestSEAsia Brunei Darussalam, Timor-
Leste.
USA USA United States of America.
Chile Chile Chile.
Peru Peru Peru.
Rest of the World RestofWorld All countries not specified
above.

HS Code Aggregations
The HS codes have been allocated to the GTAP groups as defined by the product
concordance reference within the WITS software: https://wits.worldbank.org/WITS/
GTAP Sector HS Codes
RawMilk According to WITS product concordance, there are no HS codes
corresponding to the Raw Milk sector in GTAP
DairyProc 0401-0406, 170210-170211, 170219, 2105, 350110
Lvstock_Wool 0101-0106, 020820, 030760, 0407, 0409-0410, 0502-0507, 0510,
051110, 051199, 152190, 4101-4103, 4301, 5001, 510111, 510119,
5102
MeatProducts 0201-0207, 020810, 020830, 020840, 020850, 020890, 0209-0210,
1501-1506, 160100, 160220, 160231-160232, 160239, 160241-
160242, 160249-160250, 160290, 1603, 230110
Cropping 0601-0603, 0701-0709, 0713-0714, 0801-0810, 0813, 090111,
090220, 090240, 0903-0910, 1001-1005, 100610, 100620, 1007-1008,
1201-1207, 1209-1211, 121210, 121291-121292, 121299, 1213-1214,
140310, 140390, 1801, 2308, 2401, 5201, 530110, 530210, 530310,
530410, 530511, 530521, 530591
OtherFood 0301-0306, 030710-030759, 030791, 030799, 0408, 0508-0509,
051191, 0710-0712, 0811-0812, 0814, 090112-090190, 090210,
090230, 100630, 100640, 1101-1109, 1208, 121220, 121230, 1302,
140420, 1507-1517, 152110, 152200, 160210, 1604-1605, 1701,
170220-170290, 1703-1704, 1802-1806, 19-20, 2101-2104, 2106, 22,
230120, 2302-2307, 2309, 2402-2403, 350210-350211, 350219,
350510, 710110, 710121
Forestry 0604, 1301, 1401-1402, 140300, 140390, 140410, 140490, 400130,
440110, 440320-440399, 4404, 450110
Extraction 2501-2517, 251810, 2519, 252010, 252100, 2524-2530, 260111-
260112, 2602-2617, 2621, 2701-2703, 2709, 271111, 271121, 2714,
310410, 710210, 710221, 710231, 710310
LightMnfc 0501, 3406, 3605-3606, 3704-3706, 3804, 4104-4115, 42, 4302-4304,
440121-440122, 440130, 440310, 4405-4421, 450190, 4502-4504, 46-
49, 5002-5007, 510121, 510129-510130, 5103-5113, 5202-5212,
530121, 530129-530130, 530290, 530390, 530490, 530519, 530529,
530590, 530599, 5306-5311, 54-58, 5901-5903, 5904-5905, 590699,
5907-5911, 60-62, 630120-630190, 6302-6310, 64, 6501-6505,
650692, 650699-650700, 66-67, 710122, 710229, 710239, 710391,
710399, 710490, 7105, 7113-7114, 711590, 7116-7118, 844250,
871500, 8804, 902300, 911390, 9401, 9403-9404, 95-96, 9701-9703,
9705-9706
HeavyMnfc 1518-1520, 251820, 251830, 252020, 2522-2523, 260120, 2618-2620,
2704, 2706-2708, 2710, 271112-271114, 271119, 271129, 2712-2713,
2715, 28-30, 3101-3103, 310420, 310430, 310490, 3105, 32-33, 3401-
3405, 3407, 350190, 350220, 350290, 3503-3504, 350520, 3506-
3507, 3601-3604, 3701-3703, 3707, 3801-3803, 3805-3825, 39,
400110, 400121-400122, 400129, 4002-4017, 440200, 590610,
590691, 590699, 630110, 650610, 650691, 68-70, 710410, 710420,
7106-7112, 711510, 72-76, 78-83, 8401-8441, 844210-844240, 8443-

8485, 85-86, 8701-8714, 8716, 8801-8803, 8805, 89, 9001-9022,
9024-9033, 9101-9112, 911310, 911320, 9114, 92-93, 9402, 9405-
9406, 9704
Services Nil
References
Anderson, K. (2005). On the virtues of multilateral trade negotiations. The Economic Record,
81(255).
Anderson, K., Hoekman, B., & Strutt, A. (2001). Agriculture and the WTO: Next steps.
Review of International Economics, 9(2).
Australian Productivity Commission. (2010). A CGE analysis of some economic effects of
trade agreements. Canberra: Australian Productivity Commission.
Bagrie, C., Goh, K., Williams, C., Croy, D., Zollner, S., Edwards, S., et al. (2011). New
Zealand economics: Golden year. ANZ Agri Focus, May.
Bagrie, C., Goh, K., Williams, C., Croy, D., Zollner, S., Edwards, S., et al. (2011). New
Zealand economics: Super sized autumn. ANZ Rural Focus, March.
Ballingall, J. S. (2000). A computable general equilibrium analysis of the expansion of the
Closer Economic Relations preferential trading agreement: Economic implications
for New Zealand. Master of Applied Economics, Massey University, Palmerston
North.
Bhagwati, J. (2008). Termites in the Trading System: How Preferential Agreements
Undermine Free Trade. New York: Oxford University Press.
Brockmeier, M. (2001). A graphical exposition of the GTAP model. GTAP Technical Paper
No. 8: Center for Global Trade Analysis, Purdue University.
Center for Global Trade Analysis. (2011). GTAP data bases: GTAP 7 data base final release
1 release candidate 1 regions. Retrieved 21 July, 2011, from
https://www.gtap.agecon.purdue.edu/databases/regions.asp?Version=7.211
Charteris, A., & Winchester, N. (2010). Dairy disaggregation and joint production in an
economy-wide model. The Australian Journal of Agricultural and Resource
Economics, 54.
Devarajan, S., & Robinson, S. (2005). The Influence of Computable General Equilibrium
Models on Policy. In T. J. Kehoe, T. N. Srinivasan & J. Whalley (Eds.), Frontiers in
Applied General Equilibrium Modeling (pp. 402-428). New York: Cambridge
University Press.
DiCaprio, A. (2010). US free trade agreements and policy flexibility: Will new rules hinder
industrialisation? Development Policy Review, 28(4).
Government of India, & New Zealand Government. (2009) India - New Zealand joint study
for a free trade agreement/comprehensive economic cooperation agreement. Indian
Ministry of Commerce & Industry, New Zealand Ministry of Foreign Affairs and
Trade.
Groser, T. (2011). NZ Dairy Business Conference. Retrieved 14 April, 2011, from
http://www.beehive.govt.nz/speech/nz-dairy-business-conference
Hertel, T. W. (1997). Introduction. In T. W. Hertel (Ed.), Global Trade Analysis: Modeling
and Applications (pp. 3-10). New York: Cambridge University Press.
Kim, H., Lee, H., Stephenson, J., de Raad, J.-P., Davis, L., & Hanslow, K. (2007). Benefits
and feasibility of a Korea-New Zealand free trade agreement. Joint Research Report:
NZIER, Korea Institute for International Economic Policy, Centre for International
Economics.
Koo, W. W., & Lynn Kennedy, P. (2005). International Trade and Agriculture. Cornwall:
Blackwell Publishing.
LeClair, M. S. (1997). Regional Integration and Global Free Trade: Addressing the
fundamental conflicts. Hants, England: Ashgate Publishing.
McConnell, C. R., Brue, S. L., & Flynn, S. M. (2009). Macroeconomics: Principles,
Problems, and Policies. New York: McGraw-Hill/Irwin.
Ministry of Foreign Affairs and Trade. (2005). The Australia - New Zealand Closer
Economic Relationship. Wellington: Ministry of Foreign Affairs and Trade.
Ministry of Foreign Affairs and Trade. (2009). The New Zealand - Malaysia free trade
agreement. Wellington: Ministry of Foreign Affairs and Trade.
Ministry of Foreign Affairs and Trade. (2011). Trade relationships and agreements.
Retrieved 25 February, 2011, from http://www.mfat.govt.nz/Trade-and-Economic-
Relations/Trade-Relationships-and-Agreements/index.php
Ministry of Foreign Affairs Singapore. (2011). Foreign policy: Americas. Retrieved 11
August, 2011, from http://www.mfa.gov.sg/
Rae, A. N., Chatterjee, S., & Shakur, S. (2001). The sectoral approach to trade liberalization:
Should we try to do better? The International Trade Journal, XV(3).
Siriwardana, M., & Yang, J. (2008). GTAP model analysis of the economic effects of an
Australia-China FTA: Welfare and sectoral aspects. Global Economic Review, 37(3).
The World Bank. (2011). World Integrated Trade Solution. Retrieved 21 June, 2011, from
https://wits.worldbank.org/WITS/
Valenzuela, E., & Anderson, K. (2011) Projecting the world economy to 2050: Agriculture in
the economy-wide GTAP model. Discussion Paper No. 1101: Centre for International
Economic Studies.