Embed Size (px)
Citation preview

News Release Media Contact: Ron Rogers Investor Contact: Scott Gleason (801) 584-3065 (801) 584-1143 [email protected] [email protected]
NEWS ALERT: Myriad Genetics Reports Fiscal Fourth-Quarter and Full Year 2015
Financial Results
Total Revenues of $189.9 Million
Adjusted Diluted EPS of $0.41 and Diluted EPS of $0.26
myRisk™ Hereditary Cancer Panel Ended Fourth Quarter at 72 Percent Conversion
Company Provides Fiscal Year 2016 and Fiscal First-Quarter 2016 Financial Guidance
SALT LAKE CITY, UTAH, August 11, 2015 – Myriad Genetics, Inc. (NASDAQ: MYGN) today announced
financial results for its fiscal fourth-quarter and fiscal full year ended June 30, 2015, provided an update on
recent business highlights and provided fiscal year 2016 and fiscal first-quarter 2016 financial guidance.
"We delivered sequential growth in the fourth quarter and made significant progress towards
completing the conversion of our targeted physician base to myRisk Hereditary Cancer testing,” said
Mark C. Capone, president and chief executive officer of Myriad. “As we look forward to fiscal year
2016, we are confident that we are poised to generate top- and bottom-line growth beginning a trend
that reflects increased investments in our product pipeline and international expansion. Over the next
several years, we expect that these investments will drive revenue growth and operating leverage as
we look to transform Myriad into a worldwide personalized medicine company.”
Financial Highlights
Below are tables summarizing the financial results for our fiscal fourth-quarter 2015 and fiscal year
2015 revenue by product class.

2
Fiscal Fourth Quarter Fiscal Year
($ in millions) 2015 2014 %
Change 2015 2014 %
Change
Molecular Diagnostic Testing Revenue
Hereditary cancer testing revenue $ 163.8 $ 168.4 (3%) $ 638.3 $ 720.1 (11%)
Vectra DA testing revenue 11.8 10.8 9% 43.7 14.0 212%
Other testing revenue 3.3 3.6 (8%) 13.5 14.1 (4%)
Total molecular diagnostic testing revenue 178.8 182.9 (2%) 695.5 748.2 (7%)
Pharmaceutical and clinical service revenue 11.1 5.9 88% 27.6 30.0 (8%)
Total Revenue $ 189.9 $ 188.8 1% $ 723.1 $ 778.2 (7%)
Fiscal Fourth Quarter Fiscal Year
($ in millions) 2015 2014 %
Change 2015 2014 %
Change
Total Revenue $ 189.9 $ 188.8 1% $ 723.1 $ 778.2 (7%)
Gross Profit 152.4 157.8 (3%) 575.7 669.0 (14%)
Gross Margin 80.3% 83.6% 79.6% 86.0%
Operating Expenses 116.2 104.5 11% 441.5 394.6 12%
Operating Income 36.2 53.3 (32%) 134.2 274.4 (51%)
Operating Margin 19.1% 28.2% 18.6% 35.3%
Adjusted Operating Income 48.2 56.3 (14%) 167.3 291.6 (43%)
Adjusted Operating Margin 25.4% 29.8% 23.1% 37.5%
Net Income 18.7 33.7 (45%) 80.2 176.2 (54%)
Diluted EPS 0.26 0.43 (40%) 1.08 2.25 (52%)
Adjusted EPS $ 0.41 $ 0.48 (15%) $ 1.45 $ 2.43 (40%)
myRisk Hereditary Cancer testing revenue increased to $100.9 million in the fourth quarter of
fiscal 2015 from $27.3 million in the fourth quarter of the prior year, and the Company exited the
quarter with 72 percent of incoming hereditary cancer samples ordered as myRisk.
The decline in both adjusted operating and net income in the fiscal fourth quarter 2015 relative
to the prior year is attributable to lower gross margins associated with the transition costs of

3
myRisk Hereditary Cancer testing and incremental product launch expenses for Prolaris®, myPath®
Melanoma and myPlan® Lung Cancer tests.
During the quarter, the Company repurchased approximately 1.3 million shares, or $45 million, of
common stock under its share repurchase program and ended the quarter with approximately $155
million remaining on its current share repurchase authorization. Fiscal fourth-quarter diluted
weighted average shares outstanding were 72.4 million compared to 77.7 million in the same
period last year.
Business Highlights
Myriad presented data on 19 abstracts at the American Society of Clinical Oncology including:
o Results from the Geparsixto study that showed the ability of the myChoice™ HRD test to
predict response to carboplatin containing chemotherapy in 193 patients with triple
negative breast cancer. The highest response rate of 64 percent was seen in patients
with a positive HRD score who received both carboplatin and standard of care
chemotherapy, compared to 30 percent in patients with a negative HRD score.
o Data demonstrating the ability of myChoice HRD to identify responders to Tesaro’s novel
therapeutic drug candidate niraparib. In a study of 106 patients with advanced ovarian
cancer, myChoice HRD identified 100 percent of responders to the investigational drug.
o A study of almost 77,000 patients tested with myRisk Hereditary Cancer demonstrated
that the detection rate for mutations increased 130 percent relative to BRCA1/BRCA2
testing alone. We also presented a study on endometrial cancer demonstrating that over
9 percent of patients carried a deleterious mutation in one of the myRisk genes, which
we believe justifies broad testing for this population consistent with recent National
Comprehensive Cancer Network (NCCN) recommendations.
Vectra DA volumes increased to a new record in the fiscal fourth quarter, growing 12 percent
sequentially to just under 40,000 tests ordered with revenue up 12 percent sequentially to $11.8
million.
Presented data at the America Urological Association (AUA) meeting including:
o Key data defining an active surveillance threshold for our Prolaris™ test. The active
surveillance threshold sets a defined cutoff for patients and has been clinically validated
to show patients with scores below the cutoff have a 10-year prostate cancer specific
mortality of less than 3 percent.
o The final results of the PROCEDE 1,000 clinical utility study that evaluated the impact of
the Prolaris score on treatment recommendations for 1,206 prostate cancer patients.

4
The final data showed that physicians had a 48 percent change in treatment
recommendations in which 35 percent of patients saw a reduction in therapy and 13
percent saw an increase in therapy.
Fiscal First-Quarter and Fiscal Full Year 2016 Financial Guidance
Below is a table summarizing Myriad’s fiscal year 2016 and fiscal first-quarter 2016 financial
guidance:
These projections are forward-looking statements and are subject to the risks summarized in
the safe harbor statement at the end of this press release. The Company will provide further details on
its business outlook during the conference call it is holding today to discuss its fiscal fourth quarter and
full year 2015 financial results and fiscal year 2016 financial guidance.
Conference Call and Webcast
A conference call will be held today, Tuesday, August 11, 2015, at 4:30 p.m. Eastern Time to
discuss Myriad’s financial results for the fiscal fourth quarter and full year 2015, business developments
and financial guidance. The dial-in number for domestic callers is (800) 410-1397. International callers
may dial (303) 223-2680. All callers will be asked to reference reservation number 21772056. An
archived replay of the call will be available for seven days by dialing (800) 633-8284 and entering the
reservation number above. The conference call along with a slide presentation will also will be
available through a live Webcast at www.myriad.com.
About Myriad Genetics
Myriad Genetics Inc., is a leading personalized medicine company dedicated to being a trusted
advisor transforming patient lives worldwide with pioneering molecular diagnostics. Myriad discovers
and commercializes molecular diagnostic tests that: determine the risk of developing disease,
accurately diagnose disease, assess the risk of disease progression, and guide treatment decisions
across six major medical specialties where molecular diagnostics can significantly improve patient care
and lower healthcare costs. Myriad is focused on three strategic imperatives: transitioning and
expanding its hereditary cancer testing markets, diversifying its product portfolio through the
Revenue
Adjusted Earnings
Per Share
GAAP Diluted
Earnings Per Share
Fiscal Year 2016 $750-$770 million $1.60-$1.65 $1.45-$1.50
Fiscal First Quarter 2016 $176-$178 million $0.34-$0.36 $0.30-$0.32

5
introduction of new products and increasing the revenue contribution from international markets. For
more information on how Myriad is making a difference, please visit the Company's website:
www.myriad.com.
Myriad, the Myriad logo, BART, BRACAnalysis, Colaris, Colaris AP, myPath, myRisk, myRisk
Hereditary Cancer, myChoice, myPlan, BRACAnalysis CDx, Tumor BRACAnalysis CDx, myChoice
HRD, Vectra and Prolaris are trademarks or registered trademarks of Myriad Genetics, Inc. or its wholly
owned subsidiaries in the United States and foreign countries. MYGN-F, MYGN-G
(in millions, except per share amounts) Three Months Ended Twelve Months Ended
Jun. 30, 2015 Jun. 30, 2014 Jun. 30, 2015 Jun. 30, 2014
Molecular diagnostic testing $ 178.8 $ 182.9 $ 695.5 $ 748.2
Pharmaceutical and clinical services 11.1 5.9 27.6 30.0
Total revenue 189.9 188.8 723.1 778.2
Costs and expenses:
Cost of molecular diagnostic testing 32.0 28.3 132.8 96.1
Cost of pharmaceutical and clinical services 5.5 2.7 14.6 13.1
Research and development expense 18.7 20.2 75.5 67.5
Selling, general, and administrative expense 97.5 84.3 366.0 327.1
Total costs and expenses 153.7 135.5 588.9 503.8
Operating income 36.2 53.3 134.2 274.4
Other income (expense):
Interest income 0.1 0.2 0.4 5.4
Other (0.8) (0.9) 0.3 (2.0)
Total other income (expense) (0.7) (0.7) 0.7 3.4
Income before income taxes 35.5 52.6 134.9 277.8
Income tax provision 16.8 18.9 54.7 101.6
Net income $ 18.7 $ 33.7 $ 80.2 $ 176.2
Earnings per share:
Basic $ 0.27 $ 0.45 $ 1.12 $ 2.33
Diluted $ 0.26 $ 0.43 $ 1.08 $ 2.25
Weighted average shares outstanding
Basic 69.4 74.4 71.3 75.7
Diluted 72.4 77.7 74.5 78.2
MYRIAD GENETICS, INC. AND SUBSIDIARIES
CONSOLIDATED INCOME STATEMENTS (Unaudited)

6
(in millions) Jun. 30, 2015 Jun. 30, 2014
Current assets:
Cash and cash equivalents $ 64.1 $ 64.8
Marketable investment securities 80.7 121.6
Prepaid expenses 12.5 6.9
Inventory 25.1 23.9
Trade accounts receivable, less allowance for doubtful
accounts of $7.6 in 2015 and $9.0 in 2014 85.8 81.9
Deferred taxes 13.5 6.5
Prepaid taxes — 13.6
Other receivables 1.9 3.2
Total current assets 283.6 322.4
Property, plant and equipment, net 67.2 34.6
Long-term marketable investment securities 40.6 84.1
Long-term deferred taxes — 3.2
Intangibles, net 192.6 205.3
Goodwill 177.2 169.2
Other assets 5.0 5.0
Total assets $ 766.2 $ 823.8
Current liabilities:
Accounts payable $ 21.1 $ 23.1
Accrued liabilities 46.1 56.4
Deferred revenue 1.5 1.1
Total current liabilities 68.7 80.6
Unrecognized tax benefits 26.4 24.2
Other long-term liabilities 8.8 —
Long-term deferred taxes 0.2 —
Total liabilities 104.1 104.8
Stockholders' equity:
Common stock, 68.9 and 73.5 shares outstanding at
June 30, 2015 and 2014 respectively 0.7 0.7
Additional paid-in capital 745.4 717.8
Accumulated other comprehensive loss (7.0) (1.5)
Retained earnings (accumulated deficit) (77.0) 2.0
Total stockholders' equity 662.1 719.0
Total liabilities and stockholders' equity $ 766.2 $ 823.8
Consolidated Balance Sheets (Unaudited)

7
(in millions) Jun. 30, 2015 Jun. 30, 2014 Jun. 30, 2013
Cash flows from operating activities:
Net income $ 80.2 $ 176.2 $ 147.2
Adjustments to reconcile net income to net cash provided by
operating activities:
Depreciation and amortization 25.0 13.8 8.9
Loss on disposition of assets 0.5 0.9 -
Share-based compensation expense 45.7 27.1 26.6
Bad debt expense 31.5 39.2 33.3
Impairment of intangible assets - - 1.5
Deferred income taxes (0.4) 8.1 7.4
Unrecognized tax benefits 2.1 (0.7) 0.7
Accreted interest on note receivable - (3.3) (2.7)
Excess tax benefit from share-based compensation (3.4) (11.1) (7.9)
Gain on sale of marketable investment securities - - (0.2)
Changes in assets and liabilities:
Prepaid expenses (5.5) (5.5) 0.8
Trade accounts receivable (34.4) (24.4) (67.2)
Other receivables 2.5 (1.9) (0.7)
Inventory (0.8) (15.8) 6.6
Prepaid taxes 13.6 (12.9) -
Accounts payable (3.1) (1.5) 8.0
Accrued liabilities (13.4) 3.1 11.6
Deferred revenue 0.4 (1.1) -
Net cash provided by operating activities 140.5 190.2 173.9
Cash flows from investing activities:
Capital expenditure (23.9) (14.3) (11.4)
Acquisitions, net of cash acquired (20.1) (223.5) -
Equity investment - - (5.0)
Purchases of marketable investment securities (80.7) (161.8) (443.8)
Proceeds from maturities and sales marketable investment securities 165.6 382.5 385.3
Net cash used in investing activities 40.9 (17.1) (74.9)
Cash flows from financing activities:
Net proceeds from common stock issued under
share-based compensation plans 30.0 64.8 57.8
Excess tax benefit from share-based compensation 3.4 11.1 7.9
Repurchase and retirement of common stock (210.7) (287.7) (146.3)
Net cash used in financing activities (177.3) (211.8) (80.6)
Effect of foreign exchange rates on cash and cash equivalents (4.8) (0.6) (0.7)
Net increase (decrease) in cash and cash equivalents (0.7) (39.3) 17.7
Cash and cash equivalents at beginning of year 64.8 104.1 86.4
Cash and cash equivalents at end of year $ 64.1 $ 64.8 $ 104.1
Consolidated Statement of Cash Flows (Unaudited)

8
Safe Harbor Statement
This press release contains "forward-looking statements" within the meaning of the Private Securities
Litigation Reform Act of 1995, including statements relating to our progress towards completing the
conversion of our targeted physician base to myRisk Hereditary Cancer testing; our belief that we are
poised to generate top- and bottom-line growth that reflects increased investments in our product
pipeline and international expansion; our investments driving revenue growth and operating leverage
over the next several years as we look to transform the Company into a worldwide personalized
medicine company; the Company's fiscal first quarter 2016 and fiscal full year 2016 financial guidance
under the caption "Fiscal First-Quarter and Fiscal Full Year 2016 Financial Guidance"; and the
Company's strategic directives under the caption "About Myriad Genetics." These "forward-looking
statements" are based on management's current expectations of future events and are subject to a
number of risks and uncertainties that could cause actual results to differ materially and adversely from
those set forth in or implied by forward-looking statements. These risks and uncertainties include, but
are not limited to: the risk that sales and profit margins of our molecular diagnostic tests and
pharmaceutical and clinical services may decline; risks related to our ability to transition from our
existing product portfolio to our new tests, including unexpected costs and delays; risks related to
decisions or changes in governmental or private insurers’ reimbursement levels for our tests or our
ability to obtain reimbursement for our new tests at comparable levels to our existing tests; risks related
to increased competition and the development of new competing tests and services; the risk that we
may be unable to develop or achieve commercial success for additional molecular diagnostic tests and
pharmaceutical and clinical services in a timely manner, or at all; the risk that we may not successfully
develop new markets for our molecular diagnostic tests and pharmaceutical and clinical services,
including our ability to successfully generate revenue outside the United States; the risk that licenses to
the technology underlying our molecular diagnostic tests and pharmaceutical and clinical services and
any future tests and services are terminated or cannot be maintained on satisfactory terms; risks
related to delays or other problems with operating our laboratory testing facilities and our healthcare
clinic; risks related to public concern over genetic testing in general or our tests in particular; risks
related to regulatory requirements or enforcement in the United States and foreign countries and
changes in the structure of the healthcare system or healthcare payment systems; risks related to our
ability to obtain new corporate collaborations or licenses and acquire new technologies or businesses
on satisfactory terms, if at all; risks related to our ability to successfully integrate and derive benefits
from any technologies or businesses that we license or acquire; risks related to our projections about
our business, results of operations and financial condition; risks related to the potential market
opportunity for our products and services; the risk that we or our licensors may be unable to protect or

9
that third parties will infringe the proprietary technologies underlying our tests; the risk of patent-
infringement claims or challenges to the validity of our patents or other intellectual property; risks
related to changes in intellectual property laws covering our molecular diagnostic tests and
pharmaceutical and clinical services and patents or enforcement in the United States and foreign
countries, such as the Supreme Court decision in the lawsuit brought against us by the Association for
Molecular Pathology et al; risks of new, changing and competitive technologies and regulations in the
United States and internationally; and other factors discussed under the heading "Risk Factors"
contained in Item 1A of in our most recent Annual Report on Form 10-K for the fiscal year ended June
30, 2014, which has been filed with the Securities and Exchange Commission, as well as any updates
to those risk factors filed from time to time in our Quarterly Reports on Form 10-Q or Current Reports
on Form 8-K. All information in this press release is as of the date of the release, and Myriad
undertakes no duty to update this information unless required by law.
Statement regarding use of non-GAAP financial measures
In this press release, the Company’s financial results and financial guidance are provided in
accordance with accounting principles generally accepted in the United States (GAAP) and using
certain non-GAAP financial measures. Management believes that presentation of operating results
using non-GAAP financial measures provides useful supplemental information to investors and
facilitates the analysis of the Company’s core operating results and comparison of operating results
across reporting periods. Management also uses non-GAAP financial measures to establish budgets
and to manage the Company’s business. A reconciliation of the GAAP financial results to non-GAAP
financial results is included in the attached financial statements.
Following is a description of the adjustments made to GAAP financial measures:
Acquisition -- change of control payments: Represents payments to reward Crescendo
employees for efforts that led to and facilitated the completion of the company’s acquisition by
Myriad. The payout was instituted and approved by Crescendo immediately prior to the close of
the acquisition, and was paid for out of the acquisition purchase price. Given the proximity of
the change of control payout and the closing of the merger, the change of control expense was
recorded in Myriad’s post-acquisition financial results.
Acquisition -- accelerated share-based compensation: Represents stock-based compensation
expense resulting from the accelerated vesting of Crescendo employee options immediately
prior to the acquisition that was recorded in Myriad post-acquisition financial results.
10
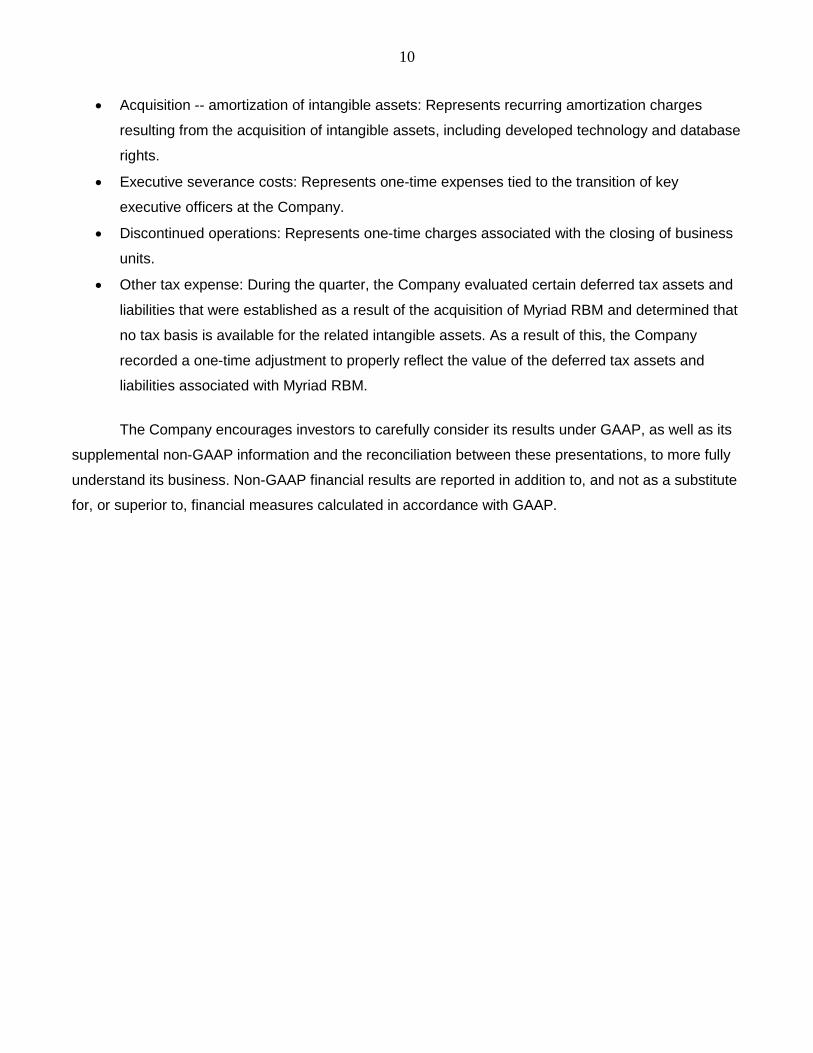
Acquisition -- amortization of intangible assets: Represents recurring amortization charges
resulting from the acquisition of intangible assets, including developed technology and database
rights.
Executive severance costs: Represents one-time expenses tied to the transition of key
executive officers at the Company.
Discontinued operations: Represents one-time charges associated with the closing of business
units.
Other tax expense: During the quarter, the Company evaluated certain deferred tax assets and
liabilities that were established as a result of the acquisition of Myriad RBM and determined that
no tax basis is available for the related intangible assets. As a result of this, the Company
recorded a one-time adjustment to properly reflect the value of the deferred tax assets and
liabilities associated with Myriad RBM.
The Company encourages investors to carefully consider its results under GAAP, as well as its
supplemental non-GAAP information and the reconciliation between these presentations, to more fully
understand its business. Non-GAAP financial results are reported in addition to, and not as a substitute
for, or superior to, financial measures calculated in accordance with GAAP.

11
Reconciliation of GAAP to Non-GAAP Financial Measures
for the Three and Twelve Months ended June 30, 2015 and 2014
(Unaudited data in millions, except per share amount)
Jun. 30, 2015 Jun. 30, 2014 Jun. 30, 2015 Jun. 30, 2014
GAAP Cost of molecular diagnostic testing 32.0$ 28.3$ 132.8$ 96.1$
GAAP Cost of pharmaceutical and clinical services 5.5 2.7 14.6 13.1
Acquisition - change of control payments - - - (0.2)
Acquisition - accelerated share-based compensation - - - (0.2)
Acquisition - amortization of intangible assets - - - -
Non-GAAP COGS 37.5$ 31.0$ 147.4$ 108.8$
Non-GAAP Gross Margin 80% 84% 80% 86%
GAAP Research and Development 18.7$ 20.2$ 75.5$ 67.5$
Acquisition - change of control payments - - - (1.7)
Acquisition - accelerated share-based compensation - - - (2.1)
Acquisition - amortization of intangible assets (0.1) (0.1) (0.3) (0.3)
Executive transition costs - - (0.4) -
Discontinued operations (0.1) - (0.3) -
Non-GAAP R&D 18.5$ 20.1$ 74.5$ 63.4$
GAAP Selling, General and Administrative 97.5$ 84.3$ 366.0$ 327.1$
Acquisition - change of control payments - - - (3.7)
Acquisition - accelerated share-based compensation - - - (4.7)
Acquisition - amortization of intangible assets (3.1) (2.9) (12.2) (4.3)
Executive transition costs (8.3) - (19.5) -
Discontinued operations (0.4) - (0.4) -
Non-GAAP SG&A 85.7$ 81.4$ 333.9$ 314.4$
GAAP Operating Income 36.2$ 53.3$ 134.2$ 274.4$
Acquisition - change of control payments - - - 5.7
Acquisition - accelerated share-based compensation - - - 6.9
Acquisition - amortization of intangible assets 3.2 3.0 12.5 4.6
Executive transition costs 8.3 - 19.9 -
Discontinued operations 0.5 - 0.7 -
Non-GAAP Operating Income 48.2$ 56.3$ 167.3$ 291.6$
Non-GAAP Operating Margin 25% 30% 23% 37%
GAAP Net Income 18.7$ 33.7$ 80.2$ 176.2$
Acquisition - change of control payments - - - 5.7
Acquisition - accelerated share-based compensation - - - 6.9
Acquisition - amortization of intangible assets 3.2 3.0 12.5 4.6
Executive transition costs 8.3 - 19.9 -
Discontinued operations 0.8 0.8 1.0 0.8
Other tax expense 2.1 - 2.1 -
Tax expense associated with non-GAAP adjustments (3.7) (0.3) (7.7) (4.6)
Non-GAAP Net Income 29.4$ 37.2$ 108.0$ 189.6$
GAAP Diluted EPS 0.26$ 0.43$ 1.08$ 2.25$
Non-GAAP Diluted EPS 0.41$ 0.48$ 1.45$ 2.43$
Three Months Ended Twelve Months Ended

12
Reconciliation of GAAP to Non-GAAP for Fiscal Year 2016 and Fiscal First Quarter 2016
Financial Guidance
The Company’s future performance and financial results are subject to risks and uncertainties, and
actual results could differ materially from guidance set forth below. Some of the factors that could affect
the Company’s financial results are stated in the safe harbor statement of this press release. More
information on potential factors that could affect the Company’s financial results are included under the
heading "Risk Factors" contained in Item 1A in the Company’s most recent Annual Report on Form 10-
K filed with the Securities and Exchange Commission, as well as any updates to those risk factors filed
from time to time in the Company’s Quarterly Reports on Form 10-Q or Current Reports on Form 8-K.
Free Cash Flow Reconciliation(Unaudited data in thousands)
Jun. 30, 2015 Jun. 30, 2014 Jun. 30, 2015 Jun. 30, 2014
GAAP cash flow from operations 51.0$ 40.9$ 140.5$ 190.2$
Capital expenditures (2.0) (4.6) (23.9) (14.3)
Free cash flow 49.0$ 36.3$ 116.6$ 175.9$
Three Months Ended Twelve Months Ended
Fiscal Year 2016
Diluted net income per share
GAAP diluted net income per share $1.45 - $1.50
Acquisition - amortization of intangible assets 0.15
Non-GAAP diluted net income per share $1.60 - $1.65
Fiscal First Quarter 2016
Diluted net income per share
GAAP diluted net income per share $0.30 - $0.32
Acquisition - amortization of intangible assets 0.04
Non-GAAP diluted net income per share $0.34 - $0.36