Embed Size (px)
Citation preview

1
NEWS RELEASE
Shaw Announces Third Quarter and Year-to-Date Results
Cable TV subscribers grow for the first time since 2010, with Consumer and Wireless
divisions gaining 58,000 subscribers
Addition of low-band spectrum is a significant milestone towards improving network
coverage and quality across Alberta, British Columbia and Ontario
Enhanced financial flexibility going forward with pro forma net debt to operating income
before restructuring costs and amortization below 2.0x
Calgary, Alberta (June 28, 2017) – Shaw Communications Inc. today announced consolidated financial
and operating results for the quarter ended May 31, 2017. Revenue from continuing operations for the
quarter of $1.31 billion increased by 2.8% over the comparable period. Operating income before
restructuring costs and amortization1 for the quarter of $550 million decreased 0.5% over the comparable
period.
Chief Executive Officer, Brad Shaw said, “Strong subscriber growth in both cable video and Internet
reflects our continued focus on delivering leading customer service and innovative products to the market
including WideOpen Internet 150 and BlueSky TV. The recently announced acquisition of spectrum will
add critical wireless capacity and capability to our network, adding to our foundation that will make us
Canada’s leading connectivity provider.”
Mr. Shaw added, “We are confident that the acquisition of 700 MHz and 2500 MHz spectrum from
Quebecor Media Inc., combined with Freedom’s current portfolio of assets, will materially improve our
customer experience and will further enable our ability to offer best-in-class converged network solutions.
With our customers’ future connectivity needs at the heart of every strategic decision we make, we are
excited about the opportunity this additional spectrum presents and the compelling wireless experience we
will continue to create for our existing and future customers.”
In the quarter, Shaw delivered a net gain of over 38,000 revenue generating units (“RGUs”) in the Consumer
division representing a substantial improvement over the approximately 47,000 RGU losses in the third
quarter of fiscal 2016. The Consumer division’s net gains in the quarter included the addition of
approximately 20,000 Internet RGUs, 12,000 cable video RGUs, and 6,000 satellite video RGUs. This
trend of year-over-year improvement is attributed to strong Internet subscriber growth led by WideOpen
Internet 150, compelling bundle and value plan offerings driving notable reductions in disconnects, and by
the launch of BlueSky TV across Shaw’s entire cable video footprint. This quarter’s subscriber result also
represents the division’s first positive net video RGU quarter since the fourth quarter of fiscal 2010.
In Wireless, the Company continued to grow postpaid and prepaid wireless subscribers, gaining a combined
20,000 RGUs in the quarter, as compared to approximately 22,000 RGUs in the third quarter of fiscal 2016.
The LTE-A network deployment continued ahead of schedule, with upgrades now complete in the GTA,
Hamilton, Vancouver, Edmonton and Calgary and with LTE roaming launched in Canada and in the
U.S. The handset lineup has continued to expand, with a total of nine handsets compatible with the AWS-
3 LTE network, including LG, Samsung, Sony and ZTE. On April 25, 2017, Freedom Mobile launched
another key enhancement with Wi-Fi calling, which enables calls to be made at no cost from outside the
cellular calling area, or at indoor locations.

2
Selected Financial Highlights
Three months ended May 31,
Nine months ended May 31,
(millions of Canadian dollars except per share amounts)
2017
2016
Change
%
2017
2016
Change
%
Revenue 1,311 1,275 2.8 3,912 3,553 10.1
Operating income before restructuring costs and amortization 1 550 553 (0.5) 1,625 1,558 4.3
Operating margin 1 42.0% 43.4% (1.4pts) 41.5% 43.9% (2.4pts)
Free cash flow 1 132 182 (27.5) 436 473 (7.8) Net income from continuing operations 164 74 >100.0 400 326 22.7
Net income (loss) from discontinued
operations, net of tax (31) 630 (30) 760 Net income 133 704 (81.1) 370 1,086 (65.9)
Basic earnings per share 0.27 1.44 0.74 2.21
Diluted earnings per share 0.27 1.44 0.74 2.20 (1) See definitions and discussion under “Non-IFRS and additional GAAP measures in the accompanying MD&A.”
Operating income before restructuring costs and amortization for the three and nine month periods of $550
million and $1.63 billion, respectively, compared to $553 million and $1.56 billion in fiscal 2016. The
slight decrease in the quarter is attributed primarily to higher operating expenses in the Consumer division
driven by costs related to marketing the launch of BlueSky TV and other corporate related costs. Increases
in the Wireless, Business Network Services and Business Infrastructure Services divisions substantially
offset the year-over-year decline in the Consumer division.
Free cash flow for the three and nine month periods of $132 million and $436 million, respectively,
compared to $182 million and $473 million in fiscal 2016. The decrease in free cash flow was largely due
to higher planned capital expenditures and by the loss of free cash flow generated in the prior year by the
former Media division which was sold on April 1, 2016.
Net income for the current quarter of $133 million decreased $571 million relative to $704 million in the
third quarter of fiscal 2016 mainly due to prior year income from the discontinued Media and fleet tracking
operations, and the gain on the sale of the Media operation in the amount of $630 million. Excluding
discontinued operations, net income from continuing operations increased by $90 million compared to the
third quarter of fiscal 2016 driven primarily by lower non-operating costs.
On June 13, 2017, Shaw announced that it entered a share purchase agreement with GI Partners portfolio
company Peak 10 Holding Corporation to sell 100% of its wholly owned subsidiary, ViaWest, Inc. for
US$1.675 billion (approximately C$2.3 billion). The transaction is subject to customary conditions,
including U.S. regulatory approval, and is expected to close by the end of fiscal 2017.
On June 13, 2017, Shaw also announced that it entered a definitive agreement with Quebecor Media Inc.
to acquire 700 MHz and 2500 MHz wireless spectrum licences held by Quebecor’s subsidiary, Videotron,
for $430 million. The spectrum transaction is subject to customary closing conditions including necessary
regulatory approvals and is expected to close in the summer of 2017. The Company estimates capital
expenditures associated with the deployment of the acquired spectrum to be approximately $350 million.
The Company expects the majority of the capital related to the network build to be incurred during fiscal
2018, which reinforces Shaw’s commitment to the wireless space, and improves its long-term wireless
growth prospects.
Heading into the final quarter of fiscal 2017, the Company is refining its full year fiscal 2017 financial
guidance for operating income before restructuring costs and amortization to range between $2.135 and
$2.160 billion, capital investment of approximately $1.35 billion and free cash flow of approximately $400
million. These refinements include the results of the Business Infrastructure Services division, comprised
primarily of ViaWest, Inc., through the end of fiscal 2017 and reflect a modest acceleration of capital spend
associated primarily with strategic network enhancements and the evolving wireless platform. Providing

3
both the sale of ViaWest, Inc. and the acquisition of spectrum are completed in the near term, the Company
expects its ratio of debt to operating income before restructuring costs and amortization1 to be below the
low end of its target 2.0 to 2.5x and the $1.5 billion credit facility to be fully undrawn.
Mr. Shaw concluded, “We have built a long term strategy to serve the connectivity needs of Canadians and
will continue to focus on execution. Our first step was the launch of WideOpen Internet 150, which
transformed the marketplace by offering significantly faster speeds at affordable prices across 99% of our
wireline footprint. Our next step was becoming the first in Canada to launch BlueSky TV, a truly
revolutionary viewing experience featuring "TV you can talk to." And earlier this month, we took a bold
step forward for our wireless business in acquiring spectrum that will enhance our network capabilities and
our capacity to offer affordable wireless service on a more robust network. Shaw’s business performance
coupled with the recent announcements showcase an unwavering commitment to our growth strategy.”
Shaw Communications Inc. is an enhanced connectivity provider. Our Consumer division serves
consumers with broadband Internet, Shaw Go WiFi, video and digital phone. Our Wireless division
provides wireless voice and data services through an expanding and improving mobile wireless network
infrastructure. The Business Network Services division provides business customers with Internet, data,
WiFi, telephony, and video services. The Business Infrastructure Services division, through ViaWest,
provides hybrid IT solutions including colocation, cloud computing and security and compliance for North
American enterprises.
Shaw is traded on the Toronto and New York stock exchanges and is included in the S&P/TSX 60 Index
(Symbol: TSX - SJR.B, SJR.PR.A, SJR.PR.B, NYSE – SJR, and TSXV – SJR.A). For more information,
please visit www.shaw.ca
The accompanying Management’s Discussion and Analysis (“MD&A”) forms part of this news release and
the “Caution concerning forward-looking statements” applies to all the forward-looking statements made
in this news release.

Shaw Communications Inc.
4
MANAGEMENT’S DISCUSSION AND ANALYSIS
For the three and nine months ended May 31, 2017
June 28, 2017
Contents
Introduction 7
Selected financial and operational highlights 9
Overview 11
Outlook 13
Non-IFRS and additional GAAP measures 13
Discussion of operations 17
Supplementary quarterly financial information 20
Other income and expense items 21
Financial position 22
Liquidity and capital resources 23
Accounting standards 25
Related party transactions 26
Financial instruments and other instruments 26
Risk and uncertainties 26
Advisories
The following Management’s Discussion and Analysis (“MD&A”), dated June 28, 2017, should be read
in conjunction with the unaudited interim Consolidated Financial Statements and Notes thereto for the
quarter ended May 31, 2017 and the 2016 Annual Consolidated Financial Statements, the Notes thereto
and related MD&A included in the Company’s 2016 Annual Report. The financial information presented
herein has been prepared on the basis of International Financial Reporting Standards (“IFRS”) for interim
financial statements and is expressed in Canadian dollars unless otherwise indicated. References to
“Shaw”, the “Company”, “we”, “us” or “our” mean Shaw Communications Inc. and its subsidiaries and
consolidated entities, unless the context otherwise requires.
Caution concerning forward-looking statements
Statements included in this MD&A that are not historic constitute “forward-looking statements” within
the meaning of applicable securities laws. Such statements include, but are not limited to:
• statements about future capital expenditures;
• asset acquisitions and dispositions;
• cost efficiencies;
• financial guidance for future performance;
• business and technology strategies and measures to implement strategies;
• statements about the Company’s equity investments, joint ventures and partnership arrangements
including any statements about write-downs, losses and liabilities;
• competitive strengths; and
• expansion and growth of the Company’s business and operations and other goals and plans.

Shaw Communications Inc.
5
They can generally be identified by words such as “anticipate”, “believe”, “expect”, “plan”, “intend”,
“target”, “goal” and similar expressions (although not all forward-looking statements contain such words).
All of the forward-looking statements made in this report are qualified by these cautionary statements.
Forward-looking statements are based on assumptions and analyses made by the Company in light of its
experience and its perception of historical trends, current conditions and expected future developments as
well as other factors it believes are appropriate in the circumstances as of the current date. The Company’s
management believes that its assumptions and analysis in this MD&A are reasonable and that the
expectations reflected in the forward looking statements contained herein are also reasonable based on the
information available on the date such statements are made and the process used to prepare the information.
These assumptions, many of which are confidential, include but are not limited to:
• general economic conditions;
• interest;
• income tax and exchange rates;
• technology deployment;
• content and equipment costs;
• industry structure;
• conditions and stability;
• government regulation;
• the completion of any pending transactions (including the receipt of any regulatory approvals to
complete any transactions); and
• the integration of recent acquisitions.
You should not place undue reliance on any forward-looking statements. Many factors, including those
not within the Company's control, may cause the Company's actual results to be materially different from
the views expressed or implied by such forward-looking statements, including but not limited to:
• general economic, market and business conditions;
• changes in the competitive environment in the markets in which the Company operates and from
the development of new markets for emerging technologies;
• industry trends, technological developments, and other changing conditions in the entertainment,
information and communications industries;
• the Company’s ability to execute its strategic plans and capital projects;
• the Company’s ability to close any transactions;
• the Company’s ability to achieve cost efficiencies;
• technology, cyber security and reputational risks;
• opportunities that may be presented to and pursued by the Company;
• changes in laws, regulations and decisions by regulators that affect the Company or the markets
in which it operates;
• the Company’s status as a holding company with separate operating subsidiaries; and
• other factors described in this report under the heading “Known events, trends, risks and
uncertainties.”
The foregoing is not an exhaustive list of all possible factors.
Should one or more of these risks materialize, or should assumptions underlying the forward-looking
statements prove incorrect, actual results may vary materially from those described herein.
The Company provides certain financial guidance for future performance as the Company believes that
certain investors, analysts and others utilize this and other forward-looking information in order to assess
the Company's expected operational and financial performance and as an indicator of its ability to service

Shaw Communications Inc.
6
debt and pay dividends to shareholders. The Company's financial guidance may not be appropriate for this
or other purposes.
Any forward-looking statement speaks only as of the date on which it was originally made and, except as
required by law, the Company expressly disclaims any obligation or undertaking to disseminate any
updates or revisions to any forward-looking statement to reflect any change in related assumptions, events,
conditions or circumstances. All forward looking statements contained in this MD&A are expressly
qualified by this statement.
Non-IFRS and additional GAAP measures
Certain measures in this MD&A do not have standard meanings prescribed by IFRS and are therefore
considered non-IFRS measures. These measures are provided to enhance the reader’s overall
understanding of our financial performance or current financial condition. They are included to provide
investors and management with an alternative method for assessing our operating results in a manner that
is focused on the performance of our ongoing operations and to provide a more consistent basis for
comparison between periods. These measures are not in accordance with, or an alternative to, IFRS and
do not have standardized meanings. Therefore, they are unlikely to be comparable to similar measures
presented by other entities.
Please refer to “Non-IFRS and additional GAAP measures” in this MD&A for a discussion and
reconciliation of non-IFRS measures, including operating income before restructuring costs and
amortization and free cash flow.

Shaw Communications Inc.
7
Introduction
Strategic update
Shaw is focused to deliver long term growth and connect customers to the world through a best-in-class
seamless connectivity experience. In 2016, Shaw positioned itself as a leading enhanced connectivity
provider through the acquisition of Freedom Mobile (formerly, WIND Mobile). The addition of a wireless
business enabled the Company to combine the power of fibre, coax, Wi-Fi and wireless networks to deliver
a seamless experience of anytime and anywhere enhanced connectivity within its operating footprint. On
June 13, 2017, Shaw announced that it has entered into a definitive agreement with Quebecor Media Inc.
(“Quebecor”) to acquire 700 MHz and 2500 MHz wireless spectrum licences, the Company’s next step in
executing on its long-term strategic plan which is centered on delivering exceptional customer experiences
by leveraging and further developing a world-class converged network and providing leading technology
through best-in-class strategic partners.
Spectrum acquisition
The spectrum licences are being acquired for $430 million and comprise Quebecor’s 10 MHz licences of
700 MHz spectrum in each of British Columbia, Alberta, and Southern Ontario, as well as 20 MHz licences
of 2500 MHz spectrum in each of Vancouver, Edmonton, Calgary, and Toronto. The acquisition is subject
to customary closing conditions and all necessary regulatory approvals from the Ministry of Innovation,
Science and Economic Development Canada (ISED), and under the Competition Act. The acquisition will
be funded using a combination of cash on hand and Shaw’s existing credit facility, and is expected to close
in the summer of 2017.
Shaw believes this incremental investment in the wireless business, particularly with the addition of the
700 MHz spectrum, will materially improve the long-term wireless customer experience, and will further
enable its ability to offer converged network solutions. Considering the acquisition of Freedom Mobile
(formerly, WIND Mobile) in 2016, Shaw now has more synergistic investment opportunities as a leading
enhanced connectivity provider within its Canadian footprint.
Capital expenditures associated with the deployment of the acquired spectrum are estimated to be
approximately $350 million. The Company expects most of the capital related to the network build to be
incurred during fiscal 2018, which reinforces Shaw’s commitment to the wireless space, and improves its
long-term wireless growth prospects.
Sale of ViaWest, Inc.
On June 13, 2017, Shaw also announced that it entered a share purchase agreement with GI Partners
portfolio company Peak 10 Holding Corporation (“Peak 10”) to sell 100% of its wholly-owned subsidiary
ViaWest, Inc. (“ViaWest”). The purchase price of US$1.675 billion (approximately $2.3 billion) is
comprised of all cash.
ViaWest was acquired by Shaw in 2014 marking a pivotal moment in Shaw’s history and provided a
growth engine which has delivered, and continues to deliver, strong results. The North American
colocation and managed services industry is consolidating and scale is becoming an important factor for
continued long-term success.

Shaw Communications Inc.
8
The transaction is subject to customary conditions, including U.S. regulatory approval and is expected to
close by the end of fiscal 2017. The transaction is not subject to financing. Shaw expects to realize net
cash proceeds from the sale of approximately $900 million after the repayment of ViaWest level
indebtedness of approximately US$580 million, repayment of the US$380 million Shaw credit facility
borrowings associated with the original investment and subsequent INetU acquisition, and estimated
transaction expenses and taxes.
Shaw’s Business Infrastructure Services division, through ViaWest, provides hybrid IT solutions including
colocation, cloud computing and security and compliance for North American enterprises. See selected
financial and operational highlights of the Business Infrastructure Services division under “Discussion of
Operations.”
See “Outlook” for a discussion of the financial condition of the Company following the completion of the
two transactions.
Shaw’s world-class converged network
Shaw’s broadband network strategy provides flexibility, cost efficiency and a speed advantage that
continues to support the success of its Internet offerings, including WideOpen Internet 150, the fastest
widely available Internet speed provided in nearly every neighborhood across Shaw’s wireline footprint.
The combination of this exceptional service with the tremendous value and pricing stability offered
through value plans have had a positive impact on customer retention. Shaw’s wireline and wireless
network roadmap continues to progress with the DOCSIS 3.1 and the LTE-Advanced network upgrades
targeted for completion by the end of fiscal 2017.
LTE is now live across the Greater Toronto area, Hamilton, Vancouver, Edmonton and Calgary and LTE
roaming recently launched in Canada and in the U.S. The handset lineup has continued to expand, with a
total of nine handsets compatible with the AWS-3 LTE network, including LG, Samsung, Sony and ZTE.
On April 25, 2017 Freedom Mobile launched another key enhancement with Wi-Fi calling, which enables
calls to be made at no cost from outside its cellular calling area, or at indoor locations.
Global technology leader
BlueSky TV is now available everywhere Shaw offers cable video. Western Canadians are now able to
enjoy a revolutionary TV experience made possible by Shaw’s strategic partnership with Comcast. The
Company’s partnerships with global technology leaders, such as Comcast, will allow it to continue to
access leading-edge technology in the global communications industry.
The BlueSky TV experience is more than just a new guide and set-top-box, it is an elegant system that
listens, learns and curates content to provide an exceptional viewing experience. Shaw is optimistic that
BlueSky TV combined with WideOpen 150 and flexible TV packages will provide a compelling reason
for consumers to stay and switch to Shaw.
Organizational initiatives
In the quarter, the Company incurred a non-recurring restructuring charge in the amount of $43 million.
These charges were attributed primarily to employee related costs associated with the integration of
Freedom Mobile and other organization rationalization initiatives. These initiatives included the
announced closure of Shaw TV stations in Vancouver, Calgary and Edmonton and a planned realignment
to integrate certain operational activities within the Consumer and Business Network Services divisions.

Shaw Communications Inc.
9
Selected financial and operational highlights
Basis of presentation
During the current quarter, the Company entered an agreement to sell a group of assets comprising the
operations of Shaw Tracking, a fleet tracking operation reported within the Company’s Business Network
Services segment, to an external party. The Company determined that the assets and liabilities of the Shaw
Tracking business met the criteria to be classified as a disposal group held for sale for the period ended
May 31, 2017. On April 1, 2016, Shaw sold 100% of its wholly owned subsidiary Shaw Media Inc. to
Corus Entertainment Inc. Accordingly, the operating results and operating cash flows for the previously
reported Shaw Tracking business and Media division are presented as discontinued operations separate
from the Company’s continuing operations. This MD&A reflects the results of continuing operations,
unless otherwise noted.
Financial Highlights Three months ended May 31, Nine months ended May 31
(millions of Canadian dollars except per share amounts)
2017
2016
Change
%
2017 2016
Change
%
Operations: Revenue 1,311 1,275 2.8 3,912 3,553 10.1
Operating income before restructuring
costs and amortization (1) 550 553 (0.5) 1,625 1,558 4.3 Operating margin (1) 42.0% 43.4% (1.4pts) 41.5% 43.9% (2.4pts)
Net income from continuing operations 164 74 >100.0 400 326 22.7
Income (loss) from discontinued operations, net of tax (31) 630 (30) 760
Net income 133 704 (81.1) 370 1,086 (65.9)
Per share data:
Basic earnings per share
Continuing operations 0.33 0.14 0.80 0.66 Discontinued operations (0.06) 1.30 (0.06) 1.55
0.27 1.44 0.74 2.21
Diluted earnings per share
Continuing operations 0.33 0.14 0.80 0.66 Discontinued operations (0.06) 1.30 (0.06) 1.54
0.27 1.44 0.74 2.20
Weighted average participating shares
outstanding during period (millions) 492 482
490 478
Funds flow from continuing operations (2) 392 402 (2.5) 1,227 1,110 10.5
Free cash flow(1) 132 182 (27.5) 436 473 (7.8)
(1) See definitions and discussion under “Non-IFRS and additional GAAP measures.” (2) Funds flow from operations is before changes in non-cash balances related to operations as presented in the unaudited
interim Consolidated Statements of Cash Flows.

Shaw Communications Inc.
10
Subscriber (or revenue generating unit (“RGU”)) highlights
Change Change
Three months ended Nine months ended
May 31,
2017
August 31, 2016
May 31,
2017
May 31, 2016
May 31,
2017
May 31, 2016
Consumer
Video – Cable 1,663,710 1,671,059 12,921 (27,482) (7,349) (71,293)
Video – Satellite 776,825 790,574 6,531 3,847 (13,749) (15,082) Internet 1,838,964 1,787,642 20,892 (8,760) 51,322 5,008
Phone 930,066 956,763 (1,827) (14,861) (26,697) (51,561)
Total Consumer 5,209,565 5,206,038 38,517 (47,256) 3,527 (132,928)
Business Network Services
Video – Cable 53,522 61,153 47 1,489 (7,631) (14,954) Video – Satellite 30,991 30,994 (1,009) (2,734) (3) 7
Internet 172,709 179,867 (435) 458 (7,158) (2,104)
Phone 319,637 301,328 7,253 5,094 18,309 10,695
Total Business Network
Services 576,859 573,342 5,856 4,307
3,517 (6,356)
Wireless
Postpaid 735,002 667,028 20,085 639,997 67,974 639,997
Prepaid 371,157 376,260 (111) 363,472 (5,103) 363,472
Total Wireless 1,106,159 1,043,288 19,974 1,003,469 62,871 1,003,469
Total Subscribers 6,892,583 6,822,668 64,347 960,520 69,915 864,185
In the quarter, the Company continued its momentum of improving subscriber trends with consolidated
RGU net gains of 64,347.
Consumer RGUs in the third quarter of fiscal 2017 increased by 38,517, a substantial improvement over
the 47,256 RGU losses in the third quarter of fiscal 2016. The Consumer division’s net gains in the quarter
included the addition of 12,921 cable video RGUs, 20,892 internet RGUs and 6,531 satellite video RGUs.
The trend of year-over-year improvement is attributed to strong Internet subscriber growth led by
WideOpen Internet 150, compelling bundle and value plan offerings driving notable reductions in
disconnects, and by the launch of BlueSky TV across Shaw’s entire cable video footprint. This quarter’s
subscriber result also represents the division’s first positive net video RGU quarter since the fourth quarter
of fiscal 2010.
In Wireless, the Company added a combined 19,974 postpaid and prepaid subscribers as compared to
33,427 RGUs gained in the second quarter of fiscal 2017 and approximately 22,000 RGUs gained in the
third quarter of fiscal 2016, finishing the period with a total 1,106,159 RGUs. Strong RGU results in
consecutive quarters reflect the compelling value proposition of Freedom Mobile’s offering to thousands
of value-conscious Canadians.

Shaw Communications Inc.
11
Overview
Our fiscal 2017 third quarter financial results represent improvements in consolidated revenue over the
third quarter of fiscal 2016. For further discussion of divisional performance see “Discussion of
operations.”
Highlights of the third quarter financial results are as follows.
Revenue
Revenue for the quarter of $1.31 billion increased $36 million or 2.8% from $1.28 billion for the third
quarter of 2016, highlighted by the following:
The year-over-year improvement in revenue was primarily due to growth in the Wireless
division, contributing an incremental $22 million or 16.3% in revenue driven by higher postpaid
and prepaid RGUs, increased handset sales and improved average revenue per unit (“ARPU”).
The Business Network Services and Business Infrastructure Services divisions contributed a
combined $19 million to the consolidated revenue improvements for the quarter driven primarily
by customer growth. Consumer division revenue for the period decreased $5 million or 0.5%
compared to the third quarter of fiscal 2016.
Compared to the second quarter of fiscal 2017, consolidated revenue for the quarter increased 1.2% or by
$15 million. The increase in revenue over the prior quarter relates primarily to growth in the Wireless
division driven by higher handset sales, added RGUs and improved ARPU.
Revenue for the nine-month period of $3.91 billion increased $359 million or 10.1% from $3.55 billion
for the comparable period in fiscal 2016, highlighted by the following:
The year-over-year improvement in revenue was primarily due to the Wireless division
contributing revenues of $433 million for the nine-month period in fiscal 2017 as compared to
$132 million in the three-month period for fiscal 2016 following the acquisition of Freedom
Mobile (formerly, WIND) on March 1, 2016.
Excluding the results of the Wireless division, revenue for the nine-month period from the
combined Consumer, Business Network Services and Business Infrastructure Services divisions
was up $52 million or 1.5%. Customer acquisition was the primary driver of revenue growth in
the Business Network Services and Business Infrastructure Services divisions. The Consumer
division’s revenue was comparable to the prior year.
Operating income before restructuring costs and amortization
Third quarter operating income before restructuring costs and amortization of $550 million decreased
slightly by $3 million or 0.5% from $553 million for the third quarter of 2016, highlighted by the following:
The year-over-year improvements from the Wireless, Business Network Services and Business
Infrastructure Services divisions were fully offset by the $26 million or 6.1% decrease from the
Consumer division driven by higher sales and marketing costs associated with the launch of
BlueSky TV, promotional discounts, programming costs and lower RGUs as compared to the prior
year.
Consolidated operating margin for the third quarter of 42.0% was down from 43.4% in the third quarter of
fiscal 2016 due primarily to the impact of the lower Consumer division margin driven by higher costs in
the quarter.

Shaw Communications Inc.
12
Compared to the second quarter of fiscal 2017, operating income before restructuring costs and
amortization for the current quarter was up $12 million driven primarily by the Wireless division operating
results.
For the nine-month period, operating income before restructuring costs and amortization of $1.63 billion
increased $67 million or 4.3% from $1.56 billion for the comparable period, highlighted by the following:
The year-over-year improvement was primarily due to the Wireless division contributing $101
million over the nine-month period as compared to $29 million in fiscal 2016 over the three-month
period following the acquisition of Freedom Mobile (formerly, WIND) on March 1, 2016.
The combined operating income before restructuring costs and amortization increase of $35
million for the nine-month period in the Business Network Services and Business Infrastructure
Services divisions was more than fully offset by $40 million of lower operating income before
restructuring costs and amortization in the Consumer division.
Free cash flow
Free cash flow for the third quarter of $132 million decreased $50 million from $182 million for the third
quarter of 2016.
Free cash flow decreased in the quarter as a result of higher planned capital expenditures of $36
million and $29 million lower free cash flow from discontinued operations primarily related to the
former Media operations. The decreases were partially offset by higher dividends from Corus of
$8 million, $6 million lower interest and $3 million lower cash taxes.
Net Income
Net income of $133 million and $370 million for the three and nine months ended May 31, 2017,
respectively, compared to $704 million and $1.09 billion for the same periods in fiscal 2016. The changes
in net income are outlined in the following table.
May 31, 2017 net income compared to:
Three months ended Nine months ended
(millions of Canadian dollars)
February 28,
2017
May 31,
2016
May 31,
2016
Increased (decreased) operating income before restructuring
costs
and amortization (1) 12 (3)
67
Decreased (increased) restructuring costs (43) (20) (32)
Increased amortization (8) (24) (90)
Decreased (increased) interest expense 1 5 7
Change in net other costs and revenue (2) 38 155 135
Decreased (increased) income taxes 18 (23) (13)
Decreased income from discontinued operations, net of tax (32) (661) (790)
(14) (571) (716)
(1) See definitions and discussion under “Non-IFRS and additional GAAP measures.” (2) Net other costs and revenue includes business acquisition costs, accretion of long-term liabilities and provisions, debt
retirement costs, equity income and losses of an associate or joint venture and other losses as detailed in the unaudited
Consolidated Statements of Income.
Change in net other costs and revenue in the third quarter had a $38 million favourable impact on net
income compared to the second quarter of fiscal 2017 primarily due to a $15 provision reversal related to
the wind down of shomi and $17 million higher equity income from our investment in Corus.
Change in net other costs and revenue in the third quarter had a $155 million favourable impact on net
income compared to the third quarter of fiscal 2016 primarily due to a decrease in year-over-year non-

Shaw Communications Inc.
13
operating costs including the following; i) prior year write-down and equity loss on the investment in
shomi in the amount of $66 million, ii) prior year write-down of $20 million in respect of a private portfolio
investment, and iii) $12 million business acquisition costs related to the acquisition of Freedom Mobile
(formerly, WIND). Also, in the current quarter, the company recorded a $15 million provision reversal
related to the wind down of shomi and $36 million increase in the year-over-year equity income from our
investment in Corus.
Outlook
Heading into the final quarter of fiscal 2017, the Company is refining its full year fiscal 2017 financial
guidance for operating income before restructuring costs and amortization to range between $2.135 and
$2.160 billion, capital investment of approximately $1.35 billion and free cash flow of approximately $400
million.
These refinements include the results of the Business Infrastructure Services division, comprised primarily
of ViaWest, Inc., through the end of fiscal 2017 and reflect a modest acceleration of capital spend
associated primarily with strategic network enhancements and the evolving wireless platform.
Providing both the sale of ViaWest and the acquisition of spectrum are completed in the near term, the
Company expects its ratio of debt to operating income before restructuring costs and amortization to be
below the low end of its target 2.0 to 2.5 times and the $1.5 billion credit facility to be fully undrawn.
See “Caution concerning forward-looking statements.”
Non-IFRS and additional GAAP measures
The Company’s continuous disclosure documents may provide discussion and analysis of non-IFRS
financial measures. These financial measures do not have standard definitions prescribed by IFRS and
therefore may not be comparable to similar measures disclosed by other companies. The Company’s
continuous disclosure documents may also provide discussion and analysis of additional GAAP measures.
Additional GAAP measures include line items, headings, and sub-totals included in the financial
statements.
The Company utilizes these measures in making operating decisions and assessing its performance. Certain
investors, analysts and others utilize these measures in assessing the Company’s operational and financial
performance and as an indicator of its ability to service debt and return cash to shareholders. The non-
IFRS financial measures and additional GAAP measures have not been presented as an alternative to net
income or any other measure of performance required by IFRS.
Below is a discussion of the non-IFRS financial measures and additional GAAP measures used by the
Company and provides a reconciliation to the nearest IFRS measure or provides a reference to such
reconciliation.

Shaw Communications Inc.
14
Operating income before restructuring costs and amortization
Operating income before restructuring costs and amortization is calculated as revenue less operating,
general and administrative expenses. It is intended to indicate the Company’s ongoing ability to service
and/or incur debt, and is therefore calculated before one-time items such as restructuring costs,
amortization (a non-cash expense) and interest. Operating income before restructuring costs and
amortization is also one of the measures used by the investing community to value the business.
Three months ended May 31, Nine months ended May 31,
(millions of Canadian dollars)
2017
2016
2017
2016
Operating income from continuing operations 235 282 780 835
Add back (deduct):
Restructuring costs 43 22 54 22 Amortization:
Deferred equipment revenue (10) (13) (31) (43)
Deferred equipment costs 30 33 90 104 Property, plant and equipment, intangibles and other 252 229 732 640
Operating income before restructuring costs and
amortization 550 553
1,625 1,558
Operating margin
Operating margin is calculated by dividing operating income before restructuring costs and amortization
by revenue.
Three months ended May 31, Nine months ended May 31,
2017
2016
Change
%
2017
2016
Change
%
Consumer 43.1% 45.7% (2.6pts) 43.0% 44.4% (1.4pts)
Business Network Services 51.1% 50.0% 1.1pts 51.5% 49.2% 2.3pts
Business Infrastructure Services 38.5% 38.4% 0.1pts 37.5% 36.7% 0.8pts
Wireless 27.3% 22.0% 5.3pts 23.3% 22.0% 1.3pts
Income from discontinued operations before restructuring costs, amortization, taxes and other non-
operating items
Income from discontinued operations before restructuring costs, amortization, taxes and other non-
operating items is calculated as revenue less operating, general and administrative expenses from
discontinued operations. This measure is used in the determination of free cash flow.
Three months ended May 31, Nine months ended May 31,
(millions of Canadian dollars)
2017
2016
2017 2016
Income from discontinued operations, net of tax (31) 630 (30) 760
Add back (deduct):
Gain on divestiture, net of tax - (615) - (615) Income taxes - 10 1 58
Amortization:
Property, plant and equipment, intangibles and other 1 1 2 14 Other non-operating items 32 16 32 19
Income from discontinued operations before restructuring
costs, amortization, taxes and other non-operating items 2 42
5 236

Shaw Communications Inc.
15
Free cash flow
The Company utilizes this measure to assess the Company’s ability to repay debt and pay dividends to
shareholders. Free cash flow is calculated as free cash flow from continuing operations and free cash flow
from discontinued operations.
Free cash flow from continuing operations is comprised of operating income before restructuring costs
and amortization adding dividends from equity accounted associates, changes in receivable related
balances with respect to customer equipment financing transactions as a cash item and deducting capital
expenditures (on an accrual basis and net of proceeds on capital dispositions) and equipment costs (net),
interest, cash taxes paid or payable, dividends paid on the preferred shares, recurring cash funding of
pension amounts net of pension expense and adjusted to exclude share-based compensation expense.
Free cash flow from continuing operations has not been reported on a segmented basis. Certain components
of free cash flow from continuing operations, including operating income before restructuring costs and
amortization continue to be reported on a segmented basis. Capital expenditures and equipment costs (net)
are reported on a combined basis for Consumer and Business Network Services due to the common
infrastructure and separately for Business Infrastructure Services and Wireless. Other items, including
interest and cash taxes, are not generally directly attributable to a segment, and are reported on a
consolidated basis.
Free cash flow from discontinued operations is comprised of income from discontinued operations
before restructuring costs, amortization, taxes and other non-operating items after deducting capital
expenditures (on an accrual basis and net of proceeds on capital dispositions), cash taxes paid or payable,
program rights amortization on assets held for sale, cash amounts associated with funding CRTC benefit
obligations related to media acquisitions, recurring cash funding of pension amounts net of pension
expense and excludes non-controlling interest amounts that are included in the income from discontinued
operations before restructuring costs, amortization, taxes and other non-operating items.

Shaw Communications Inc.
16
Free cash flow is calculated as follows:
Three months ended May 31, Nine months ended May 31,
(millions of Canadian dollars)
2017
2016
Change
%
2017
2016
Change
%
Revenue Consumer 930 935 (0.5) 2,810 2,813 (0.1)
Business Network Services 137 128 7.0 410 384 6.8
Business Infrastructure Services 96 86 11.6 277 248 11.7 Wireless 154 132 16.7 433 132 228.0
1,317 1,281 2.8 3,930 3,577 9.9
Intersegment eliminations (6) (6) - (18) (24) (25.0)
1,311 1,275 2.8 3,912 3,553 10.1
Operating income before restructuring
costs and amortization (1)
Consumer 401 427 (6.1) 1,209 1,249 (3.2)
Business Network Services 70 64 9.4 211 189 11.6
Business Infrastructure Services 37 33 12.1 104 91 14.3
Wireless 42 29 44.8 101 29 248.3
550 553 (0.5) 1,625 1,558 4.3
Capital expenditures and equipment
costs (net):(2)
Consumer and Business Network Services 232 201 15.4 651 651 -
Business Infrastructure Services 33 35 (5.7) 84 105 (20.0)
Wireless 58 51 13.7 176 51 245.1
323 287 12.5 911 807 12.9
Free cash flow before the following 227 266 (14.7) 714 751 (4.9)
Less:
Interest (73) (79) (7.6) (221) (227) (2.6) Cash taxes (52) (55) (5.5) (139) (186) (25.3)
Other adjustments:
Dividends from equity accounted associates 22
14 57.1 65 14 364.3
Non-cash share-based compensation 1 1 - 3 2 50.0
Pension adjustment 4 3 33.3 8 (17) (147.1) Customer equipment financing 2 3 (33.3) 6 7 (14.3)
Preferred share dividends (2) (3) (33.3) (6) (10) (40.0)
Free cash flow from continuing
operations 129 150 (14.0) 430 334 28.7
Income from discontinued operations
before restructuring costs, amortization,
taxes and other non-operating items 2 42
5 236
Less:
Capital expenditures 1 (1) 2 (3) Cash taxes - 12 (1) (28)
Program Rights - (14) - (33)
CRTC benefit obligation funding - (3) - (11) Non-controlling interests - (4) - (20)
Pension adjustment - - - (2)
Free cash flow from discontinued
operations 3 32 6 139
Free cash flow 132 182 (27.5) 436 473 (7.8)
(1) See definitions and discussion under “Non-IFRS and additional GAAP measures.” (2) Per Note 4 to the unaudited interim Consolidated Financial Statements.

Shaw Communications Inc.
17
Discussion of operations
Consumer
Three months ended May 31,
Nine months ended May 31,
(millions of Canadian dollars)
2017
2016
Change %
2017 2016 Change
%
Revenue 930 935 (0.5) 2,810 2,813 (0.1)
Operating income before restructuring costs and amortization (1) 401 427 (6.1)
1,209
1,249
(3.2)
Operating margin (1) 43.1% 45.7% (2.6pts) 43.0% 44.4% (1.4pts)
(1) See definitions and discussion under “Non-IFRS and additional GAAP measures.”
Consumer RGUs in the second quarter increased by 38,517, a substantial improvement over the 47,256
RGU loss in the third quarter of fiscal 2016. This quarter’s Consumer RGU result represents the division’s
first positive net video RGU quarter since the fourth quarter of fiscal 2010. The trend of year-over-year
subscriber improvement continues to be driven by strong Internet subscriber growth linked to the
WideOpen Internet 150 offering combined with our new BlueSky TV offering and by notable reductions
in disconnects. The Company’s network strength, strong value plan offerings and positive customer
retention are also contributing positively to subscriber gains.
Revenue
Consumer revenue for the third quarter of fiscal 2017 decreased slightly by 0.5% compared to the
third quarter of fiscal 2016. Higher revenue generated by August 2016 rate increases and
incremental Internet RGUs were fully offset by the impact of overall year-over-year reductions to
phone, cable and satellite video RGUs.
As compared to the second quarter of fiscal 2017, the current quarter revenue decreased $3 million
or 0.3%. The quarter-over-quarter decrease was primarily due to the impact of increased
promotional discounts.
Operating income before restructuring costs and amortization
Operating income before restructuring costs and amortization for the quarter of $401 million was
down 6.1% or $26 million from $427 million in the third quarter of fiscal 2016. Higher revenue
from August 2016 rate increases was more than fully offset by the impact of higher sales and
marketing costs associated with the launch of BlueSky TV, promotional discounts, programming
costs and lower RGUs as compared to the prior year.
As compared to the second quarter of fiscal 2017, operating income before restructuring costs and
amortization for the current quarter was $2 million or 0.5% lower as the impact of increased RGUs
and rate increases in satellite video was more than fully offset by sales and marketing costs, and
promotional discounts.

Shaw Communications Inc.
18
Business Network Services
Three months ended May 31, Nine months ended May 31,
(millions of Canadian dollars)
2017
2016
Change %
2017
2016
Change %
Revenue 137 128 7.0 410 384 6.8
Operating income before restructuring
costs and amortization (1) 70 64 9.4 211 189 11.6
Operating margin (1) 51.1% 50.0% 1.1pts 51.5% 49.2% 2.3pts
(1) See definitions and discussion under “Non-IFRS and additional GAAP measures.”
Revenue
Revenue of $137 million for the quarter was up $9 million or 7.0% over the comparable period.
The core business, excluding satellite services, increased revenues 10.0% in the current quarter
primarily due to continued growth across the entire customer base.
As compared to the second quarter of fiscal 2017, excluding the impact of discontinued operations,
revenue was comparable reflecting continued organic customer growth offset by price adjustments
relating to our legacy phone product.
Operating income before restructuring costs and amortization
Operating income before restructuring costs and amortization of $70 million for the quarter
improved by $6 million or 9.4% over the comparable period. The improvements were driven
primarily by increased revenue from customer growth and migration from legacy products to
higher margin Smart suite offerings.
As compared to the second quarter of fiscal 2017, operating income before restructuring costs and
amortization for the quarter decreased by $2 million primarily driven by increased sales and
marketing related costs.
Business Infrastructure Services
Three months ended May 31, Nine months ended May 31,
(millions of Canadian dollars)
2017
2016
Change
%
2017 2016
Change
%
Revenue 96 86 11.6 277 248 11.7
Operating income before restructuring
costs and amortization (1) 37 33 12.1 104 91 14.3
Operating margin (1) 38.5% 38.4% 0.1pts 37.5% 36.7% 0.8pts
(1) See definitions and discussion under “Non-IFRS and additional GAAP measures.”
Revenue
Revenue for the quarter increased $10 million or 11.6% over the third quarter of fiscal 2016.
Excluding the effect of foreign exchange, revenue for the U.S. based operations increased by 6.9%
to US$71 million for the three-month period primarily due to continued organically generated
customer growth.
As compared to the second quarter of fiscal 2017, revenue for the quarter increased slightly by $5
million or 5.5%. Excluding the effect of foreign exchange, revenue in the third quarter of fiscal
2017 for the U.S. based operations increased by 2.3% over the second quarter of fiscal 2017.

Shaw Communications Inc.
19
Operating income before restructuring costs and amortization
Operating income before restructuring costs and amortization for the quarter improved $4 million
or 12.1% over the comparable period. Excluding the effect of foreign exchange, operating income
before restructuring costs and amortization for the U.S. based operations increased by 7.3% to
US$28 million for the three-month period. Year-over-year improvement was due primarily to
customer growth.
As compared to the second quarter of fiscal 2017, operating income before restructuring costs and
amortization for the current quarter was up 5.7% or $2 million driven by increased revenue and
the impact of higher seasonal costs incurred in the second quarter of fiscal 2017. Excluding the
effect of foreign exchange, operating income before restructuring costs and amortization in the
third quarter of fiscal 2017 for the U.S. based operations increased by 3.1% over the second quarter
of fiscal 2017.
Wireless
Three months ended May 31, Nine months ended May 31,
(millions of Canadian dollars)
2017
2016
Change
%
2017 2016
Change
%
Revenue 154 132 16.7 433 132 >100.0
Operating income before restructuring costs and amortization (1) 42 29 44.8 101 29 >100.0
Operating margin (1) 27.3% 22.0% 5.3pts 23.3% 22.0% 1.3pts
(1) See definitions and discussion under “Non-IFRS and additional GAAP measures.”
The Wireless division added nearly 20,000 RGUs in the quarter as compared to approximately 22,000
RGUs gained in the third quarter of fiscal 2016.
Revenue
Revenue of $154 million for the quarter was up $22 million or 16.7% over the comparable period.
The increase in revenue was driven primarily by year-over-year growth in each postpaid and
prepaid RGUs and due to improved ARPU of $37.05 as compared to $36.30 in the third quarter
of fiscal 2016.
As compared to the second quarter of fiscal 2017, revenue for the quarter increased by $14 million
or 10% over the second quarter of fiscal 2017, the result of added RGUs and improved ARPU on
higher rate plan mix as compared to $36.44 ARPU in the prior quarter.
Operating income before restructuring costs and amortization
Operating income before restructuring costs and amortization of $42 million for the quarter
improved by $13 million or 44.8% over the third quarter of fiscal 2016. The improvements were
driven primarily by increased revenue from added RGUs and improved ARPU in addition to
reduced employee related costs offset partially by an increase in marketing, network and other
commercial costs.
As compared to the second quarter of fiscal 2017, operating income before restructuring costs and
amortization increased by $13 million or 44.8% over the second quarter of fiscal 2017, an
improvement driven by the increase in revenue and by higher prior quarter seasonal commercial

Shaw Communications Inc.
20
costs, costs associated with the branding transition to Freedom Mobile and other promotional
related costs.
Capital expenditures and equipment costs
Three months ended May 31, Nine months ended May 31,
(millions of Canadian dollars) 2017 2016
Change
%
2017 2016
Change
%
Consumer and Business Network
Services
New housing development 27 29 (6.9) 74 79 (6.3)
Success based 77 61 26.2 219 203 7.9 Upgrades and enhancements 102 80 27.5 275 277 (0.7)
Replacement 6 12 50.0 19 30 (36.7)
Building and other 20 19 5.3 64 62 3.2
Total as per Note 4 to the unaudited interim
consolidated financial statements 232 201 15.4
651 651 -
Business Infrastructure Services Total as per Note 4 to the unaudited interim
consolidated financial statements 33 35 (5.7)
84 105 (20.0)
Wireless Total as per Note 4 to the unaudited interim
consolidated financial statements 58 51 13.7
176 51 245.1
Consolidated total as per Note 4 to the unaudited interim consolidated financial
statements 323 287 12.5
911 807 12.9
Third quarter capital investment was $323 million, a $36 million or 12.5% increase over the comparable
period, driven by added capital expenditures of $21 million in broadband capacity expansion, $16 million
in success based equipment and $7 million in the Wireless division. The increases were partially offset by
$6 million of reduced network replacement activity.
Consumer and Business Network Services
Success based capital for the quarter of $77 million was $16 million higher than in the third quarter
of fiscal 2016. The increase was driven by higher equipment costs in video associated with the
BlueSky TV product, purchases of advanced Internet Wi-Fi modems, and satellite digital network
upgrade (“DNU”). The increases were partially offset by reduced installation costs in all product
lines.
For the quarter, investment in the combined upgrades and enhancement and replacement
categories was $108 million, a $16 million or 17.4% increase over the prior year driven by
increased spend on network capacity upgrades in support of enhanced broadband capacity,
DOCSIS 3.1, and satellite DNU.
Business Infrastructure Services
Capital investment of $33 million for the quarter was comparable to the prior year with customer
installation costs in existing facilities the main driver of investment.
Wireless
Capital investment of $176 million for the year and $58 million in the third quarter related
primarily to investment for the continued improvement in network infrastructure, specifically the
LTE-Advanced network rollout readiness project across the network as well as capital investments
in the upgrade of back office systems.

Shaw Communications Inc.
21
Discontinued operations
Shaw Tracking
During the current quarter, the Company entered an agreement to sell a group of assets comprising the
operations of Shaw Tracking, a fleet tracking operation reported within the Company’s Business Network
Services segment. The Company determined that the assets and liabilities of the Shaw Tracking business
met the criteria to be classified as a disposal group held for sale for the period ended May 31, 2017.
Accordingly, the assets and liabilities of the Shaw Tracking business were reclassified in the consolidated
balance sheet at May 31, 2017 to current assets held for sale or current liabilities held for sale, respectively,
as the sale of such assets and liabilities is expected within one year. In addition, the operating results and
operating cash flows of the business are presented as discontinued operations separate from the Company’s
continuing operations.
In connection with the reclassification of assets and liabilities of the Shaw Tracking business as held for
sale, the Company reviewed the carrying value of the resulting disposal group and determined it exceeded
its fair value less cost to sell at May 31, 2017. Accordingly, an impairment charge of $32 million was
recorded during the quarter.
Three months ended May 31, Nine months ended May 31,
(millions of Canadian dollars)
2017
2016
2017
2016
Revenue 8 8
25 25
Operating, general and administrative expenses
Employee salaries and benefits 2 2 5 5 Purchases of goods and services 4 4 15 13
6 6 20 18
Amortization 1 1 2 3 Impairment of goodwill / disposal group 32 17 32 17
Income (loss) from discontinued operations before tax (31) (16) (29) (13)
Income taxes - - 1 1
Income (loss) from discontinued operations, net of tax (31) (16) (30) (12)

Shaw Communications Inc.
22
Shaw Media
On April 1, 2016, Shaw sold 100% of its wholly owned subsidiary Shaw Media Inc. to Corus, a related
party subject to common voting control for $2.65 billion, comprised of $1.85 billion in cash and 71,364,853
Corus Class B non-voting participating shares. Accordingly, the operating results and operating cash flows
for the previously reported Media division are presented as discontinued operations separate from the
Company’s continuing operations.
Three months ended May 31, Nine months ended May 31,
(millions of Canadian dollars)
2017
2016
2017
2016
Revenue - 88 - 610
Eliminations (1) - (7) - (46)
- 81 - 564
Operating, general and administrative expenses
Employee salaries and benefits - 16 - 109
Purchases of goods and services - 32 - 272
- 48 - 381
Eliminations (1) - (7) - (46)
- 41 - 335 Amortization - - - 11
Accretion of long-term liabilities and provisions - - - 2
Other losses - (1) - -
Income from discontinued operations before tax and
gain on divestiture
-
41
- 216
Income taxes - 10 - 57
Income (loss) from discontinued operations, net of tax - 31 - 159
Gain on Divesture - 662 - 662
Income taxes or gain - 47 - 47
Income (loss) from discontinued operations, net of tax - 646 - 774
(1) Eliminations relate to intercompany transactions between continuing and discontinued operations. The costs are included
in continuing operations as they are expected to continue to be incurred subsequent to the disposition.
Supplementary quarterly financial information
Quarter
Revenue
Operating
income before
restructuring
costs and
amortization (1)
Net income from
continuing
operations
attributable to
equity shareholders
Net income
attributable
to equity
shareholders
Net income (2)
Basic and
Diluted earnings
per share from
continuing
operations
Basic and
Diluted
earnings per
share
(millions of Canadian dollars except per share amounts)
2017
Third 1,311 550 164 133 133 0.33 0.27
Second 1,296 538 146 147 147 0.29 0.30
First 1,305 537 89 89 89 0.18 0.18
2016
Fourth 1,297 547 143 154 154 0.29 0.31
Third 1,275 553 74 700 704 0.14 1.44
Second 1,143 500 115 156 164 0.23 0.32
First 1,135 505 137 209 218 0.28 0.43
2015
Fourth 1,123 524 248 272 276 0.52 0.57
(1) See definition and discussion under “Non-IFRS and additional GAAP measures.” (2) Net income attributable to both equity shareholders and non-controlling interests

Shaw Communications Inc.
23
In the third quarter of fiscal 2017, net income decreased $14 million compared to the second quarter of
fiscal 2017 mainly due to current quarter restructuring costs and losses on discontinued operations, net of
tax, as well as increased amortization. The decrease was partially offset by an increase in operating income
before restructuring costs and amortization, higher equity income from our investment in Corus and lower
income taxes. See “Other income and expense items” for further detail on non-operating items.
In the second quarter of fiscal 2017, net income increased $58 million compared to the first quarter of
fiscal 2017 mainly due to a non-recurring provision related to the wind down of shomi operations recorded
in the first quarter, partially offset by an increase in amortization and income taxes. Also contributing to
the increased net income were lower restructuring costs, partially offset by lower equity income from our
investment in Corus. See “Other income and expense items” for further detail on non-operating items.
In the first quarter of fiscal 2017, net income decreased $65 million compared to the fourth quarter of fiscal
2016 mainly due to a non-recurring provision related to the wind down of shomi operations included in
net other costs and revenue for the current quarter. Also contributing to the decreased net income was
lower operating income before restructuring costs and amortization, higher restructuring charges and lower
income from discontinued operations, partially offset by $27 million equity income from our investment
in Corus and lower income taxes. See “Other income and expense items” for further detail on non-
operating items.
In the fourth quarter of fiscal 2016 net income decreased $550 million compared to the third quarter of
fiscal 2016 mainly due to lower income from discontinued operations, net of tax, relating primarily to the
gain on the divestiture of the former Media division recorded in the third quarter, decreased operating
income before restructuring costs and amortization, and higher income taxes. Partly offsetting the decrease
in net income were decreases in net other costs and revenue and restructuring costs. Net other costs and
revenue decreased primarily due to non-recurring charges recorded in the third quarter, including a $17
million impairment of goodwill relating to the Tracking business, a $51 million impairment of the
Company’s joint venture investment in shomi, a $20 million write-down of a private portfolio investment,
$12 million acquisition related costs and a $10 million loss from an equity accounted associate.
Net income for the third quarter of fiscal 2016 increased $540 million compared to the second quarter of
fiscal 2016 mainly due to higher income from discontinued operations, net of tax, relating primarily to the
gain on the divestiture of the former Media division, increased operating income before restructuring costs
and amortization and lower income taxes. Partly offsetting the net income improvement in the quarter
were: i) decreased net other costs and revenue; ii) increased restructuring charges; and iii) increased
amortization. Net other costs and revenue decreased primarily due to a $17 million impairment of goodwill
relating to the Shaw Tracking operations in the Business Network Services division, a $51 million
impairment of the Company’s shomi joint venture investment, a $20 million write-down of a private
portfolio investment and a $10 million loss from an equity accounted associate.
In the second quarter of fiscal 2016, net income decreased $54 million compared to the first quarter of
fiscal 2016 mainly due to decreased income from discontinued operations, net of tax, of $32 million,
primarily due to the seasonality of the Media business reflected in income from discontinued operations,
net of tax, and net other costs and revenue of $13 million. Net other costs and revenue decreased primarily
due to $8 million of costs recorded in the quarter related to the acquisition of Freedom Mobile (formerly,
WIND) and INetU.
In the first quarter of fiscal 2016, net income decreased $58 million compared to the fourth quarter of 2015
mainly due to a change in net other costs and revenues of $140 million and decrease in operating income
before restructuring costs and amortization of $17 million offset by an increase in income from
discontinued operations, net of tax, of $51 million and a decrease in income taxes of $50 million. Net
other costs and revenue decreased primarily due to a fourth quarter fiscal 2015 gain on the sale of wireless

Shaw Communications Inc.
24
spectrum of $158 million less the impact of a $27 million write-down of a private portfolio investment in
the same period offset by an increase in the equity loss of a joint venture interest in shomi of $5 million in
the first quarter of fiscal 2016.
In the fourth quarter of fiscal 2015, net income increased $67 million primarily due to improved net other
costs and revenue of $191 million partially offset by lower income from discontinued operations, net of
tax, of $44 million and higher income tax expense of $70 million. The improvement in net other costs and
revenue items was due to the combined effect of the aforementioned sale of spectrum licenses and write-
down of a private portfolio investment during the fourth quarter and the $59 million net charge arising in
the third quarter related to an impairment of goodwill, write-down of IPTV assets and proceeds received
from the Shaw Court insurance claim.
Other income and expense items
Amortization
Three months ended May 31, Nine months ended May 31,
(millions of Canadian dollars) 2017
2016
Change %
2017 2016 Change
%
Amortization revenue (expense)
Deferred equipment revenue 10 13 (23.1) 31 43 (27.9) Deferred equipment costs (30) (33) (9.0) (90) (104) (13.5)
Property, plant and equipment,
intangibles and other (252) (229) 10.0
(732) (640) 14.4
Amortization of property, plant and equipment, intangibles and other increased 10.0% and 14.4% for the
three and nine months ended May 31, 2017 over the comparable periods due to amortization of new
expenditures exceeding the amortization of assets that became fully amortized during the periods, and only
three months of Wireless division amortization included in the prior year subsequent to the acquisition of
Freedom Mobile (formerly WIND Mobile) on March 1, 2016.
Amortization of financing costs and Interest expense
Three months ended May 31, Nine Months ended May 31,
(millions of Canadian dollars) 2017 2016
Change
% 2017 2016
Change
%
Amortization of financing costs – long-term debt 1
1
-
4 4 -
Interest expense 74 79 (6.3) 222 229 (3.1)
Interest expense for the three and nine month periods ended May 31, 2017 was lower than the comparable
periods due to lower average outstanding debt balances in the current year.
Equity income (loss) of an associate or joint venture
For the three and nine month periods ended May 31, 2017 the Company recorded equity income of $26
million and $62 million related to its interest in Corus, compared to equity losses of $10 million for the
comparable periods. In the comparable periods, the Company also recorded equity losses of $15 million
and $51 million, respectively, related to its interest in shomi.
Other losses
This category generally includes realized and unrealized foreign exchange gains and losses on U.S. dollar
denominated current assets and liabilities, gains and losses on disposal of property, plant and equipment

Shaw Communications Inc.
25
and minor investments, and the Company’s share of the operations of Burrard Landing Lot 2 Holdings
Partnership. For the nine months ended May 31, 2017, the category also includes a net $92 million
provision in respect of the Company’s investment in shomi which announced a wind down of operations
during the first quarter. In the comparable year, the category includes a write-down of $51 million in
respect of the Company’s investment in shomi, a write-down of $20 million in respect of a private portfolio
investment and asset write-downs of $6 million.
Income taxes
Income taxes are higher in the current year mainly due to an increase in net income from continuing
operations and the impact of other adjustments.
Financial position
Total assets were $15.4 billion at May 31, 2017 and August 31, 2016. Following is a discussion of
significant changes in the consolidated statement of financial position since August 31, 2016.
Current assets decreased $148 million due to decreases in cash of $230 million and account receivable of
$25 million, offset by increases in inventories of $24 million, other current assets of $22 million and assets
held for sale of $61 million. Cash decreased as the cash outlay for investing activities and financing
activities exceeded the funds provided by operations. Inventories increased due to the acquisition of
additional customer equipment to support the newly-launched BlueSky TV service. Other current assets
increased due to the timing of payments related to prepaid expenses. Assets held for sale include the assets
of the Shaw Tracking business for which the sale is expected to be completed within a year.
Investments and other assets increased $69 million primarily due to equity income and other
comprehensive income of associates related to the Company’s investment in Corus. Property, plant and
equipment increased $124 million due to capital investment in excess of amortization and the effect of
foreign exchange rates on the translation of ViaWest. Intangibles and goodwill decreased $25 million due
to Shaw Tracking goodwill reclassified as held for sale partially offset by net software intangible additions
and the ongoing effect of foreign exchange arising on translation of ViaWest.
Current liabilities decreased $463 million during the year due to decreases in current portion of long-term
debt of $400 million, accounts payable and accrued liabilities of $69 million and income taxes payable of
$87 million, partially offset by increases of $59 million in current provisions and $35 million in liabilities
held for sale. Current portion of long-term debt decreased due to the repayment of $400 million 5.7%
senior note at maturity on March 2, 2017. Accounts payable and accruals decreased due to the timing of
payment and fluctuations in various payables including capital expenditures and interest. Income taxes
payable decreased due to tax installment payments, partially offset by the current period provision. Current
provisions increased primarily due to unpaid amounts relating to the provision for the wind down of the
shomi investment and restructuring.
Long-term debt increased $356 million due to the issuance of $300 million fixed rate senior notes at a rate
of 3.80% due March 1, 2027, additional U.S. dollar borrowings by ViaWest under its bank credit facilities
and the effect of foreign exchange rates on ViaWest’s debt and the Company’s U.S. dollar borrowings
under its credit facility. The $300 million proceeds from the issuance of the fixed rate senior notes, together
with cash on hand, was used to repay the $400 million senior note due on March 2, 2017.
Shareholders’ equity increased $138 million primarily due to an increase in share capital of $194 million
and decrease in accumulated other comprehensive loss of $23 million, partly offset by a decrease in
retained earnings of $75 million. Share capital increased due to the issuance of 7,123,282 Class B non-

Shaw Communications Inc.
26
voting participating shares (“Class B Non-Voting Shares”) under the Company’s option plan and Dividend
Reinvestment Plan (“DRIP”). As at June 15, 2017, share capital is as reported at May 31, 2017 with the
exception of the issuance of a total of 65,460 Class B Non-Voting Shares upon exercise of options under
the Company’s option plan. Retained earnings decreased due to dividends of $445 million, partially offset
by current year earnings of $370 million. Accumulated other comprehensive loss decreased due to the net
effect of exchange differences arising on the translation of ViaWest and U.S. dollar denominated debt
designated as a hedge of the Company’s net investment in those foreign operations as well as re-
measurements recorded on employee benefit plans and the Company’s share of other comprehensive
income of associates.
Liquidity and capital resources
In the nine-month period ended May 31, 2017, the Company generated $436 million of free cash flow.
Shaw used its free cash flow along with cash of $230 million, $300 million proceeds from a senior note
issuance, borrowings of $33 million under ViaWest’s credit facility and proceeds on issuance of Class B
Non-Voting Shares of $37 million to repay at maturity $400 million 5.7% senior notes, fund the net
working capital change of $180 million, pay common share dividends of $286 million, make $115 million
in financial investments, pay $45 million in restructuring costs and pay $10 million in other net items.
As at May 31, 2017, the Company had $175 million of cash on hand, as well as approximately $980 million
of available credit under its $1.5 billion bank credit facility. On December 15, 2016, the Company amended
the terms of this bank credit facility to extend the maturity date from December 2019 to December 2021.
The facility is used for working capital and general corporate purposes.
The Company issued Class B Non-Voting Shares from treasury under its DRIP which resulted in cash
savings and incremental Class B Non-Voting Shares of $149 million during the nine months ending May
31, 2017. On December 16, 2016, the Company amended its DRIP to permit eligible shareholders who
are residents of the United States to enroll their Class A Participating Shares and Class B Non-voting
Participating Shares in the DRIP. Prior to this amendment, the DRIP was only available to eligible
shareholders who were residents of Canada.
Shaw’s and ViaWest’s credit facilities are subject to customary covenants which include maintaining
minimum or maximum financial ratios.
Covenant Limit
Shaw Credit Facilities
Total Debt to Operating Cash Flow (1) Ratio < 5.00:1
Operating Cash Flow (1) to Fixed Charges (2) Ratio > 2.00:1
ViaWest Credit Facilities
Total Net Leverage Ratio (3) ≤ 6.50:1 (1) Operating Cash Flow, for the purposes of the covenants, is calculated as net earnings before interest expense, depreciation, amortization
and current and deferred income taxes, excluding profit or loss from investments accounted for on an equity basis, for the most recently
completed fiscal quarter multiplied by four, plus cash dividends and other cash distributions received in the most recently completed
four fiscal quarters from investments accounted for on an equity basis. (2) Fixed Charges are defined as the aggregate interest expense for the most recently completed fiscal quarter multiplied by four. (3) Total Net Leverage Ratio is calculated as the ratio of consolidated total debt under the facility as of the last day of the most recent
completed four fiscal quarters to Consolidated Adjusted EBITDA of ViaWest for the same period. Consolidated Adjusted EBITDA, for the purposes of the covenants, is calculated similar to Operating income before restructuring and amortization with adjustments for
certain items such as one-time expenses and extraordinary items.
At May 31, 2017, Shaw is in compliance with these covenants and based on current business plans, the
Company is not aware of any condition or event that would give rise to non-compliance with the covenants
over the life of the borrowings.

Shaw Communications Inc.
27
Based on the aforementioned financing activities, available credit facilities and forecasted free cash flow,
the Company expects to have sufficient liquidity to fund operations and obligations, including maturing
debt, during the upcoming fiscal year. On a longer-term basis, Shaw expects to generate free cash flow
and have borrowing capacity sufficient to finance foreseeable future business plans and refinance maturing
debt.
Cash Flow from Operations
Operating Activities
Three months ended May 31, Nine months ended May 31,
(millions of Canadian dollars)
2017 2016 Change
%
2017 2016 Change
%
Funds flow from operations 392 402 (2.5) 1,227 1,110 10.5
Net change in non-cash balances related to
operations 45 22 >100.0 (86) (27) (>100.0)
Operating activities of discontinued
operations 1 3 4 111
438 427 2.6 1,145 1,194 (4.1)
For the three months ended May 31, 2017, funds flow from operations decreased over the comparable
periods primarily due to higher restructuring costs and lower operating income before restructuring costs
and amortization and lower income tax expense, partially offset by lower business acquisition costs. For
the nine months ended May 31, 2017, funds flow from operations increased over the comparable periods
primarily due to higher operating income before restructuring costs and amortization, lower income tax
expense and lower business acquisition costs, partially offset by higher restructuring costs in the current
year. For the nine-month period, funds flow from operations also included the impact of lower pension
funding during the current year. The net change in non-cash working capital balances related to operations
fluctuated over the comparative periods due to changes in other current asset balances and the timing of
payment of current income taxes payable and accounts payable and accrued liabilities.
Investing Activities Three months ended May 31, Nine months ended May 31,
(millions of Canadian dollars)
2017
2016 Increase
2017 2016 Increase
Cash flow used in investing activities (395) (65) 330 (1,040) (910) 130
The cash used in investing activities increased over the comparable periods due primarily to the $246
million net impact of the acquisition of Freedom Mobile (formerly, WIND Mobile) and sale of Media in
the prior year, and higher cash outlays for inventory and capital expenditures in the current year. The nine-
month period also includes the $223 acquisition of INetU in the prior year.

Shaw Communications Inc.
28
Financing Activities
The changes in financing activities during the comparative periods were as follows: Three months ended May 31, Nine months ended May 31,
(millions of Canadian dollars) 2017
2016
2017
2016
Bank loans – net borrowings - (25) - 69 ViaWest’s credit facility and finance lease obligations 4 (3) 27 172
Repay 5.70% Senior unsecured notes (400) - (400) -
Issuance of 3.80% Senior unsecured notes - 300 - Repay CDN variable rate Senior notes - - - (300)
Issuance of 3.15% Senior unsecured notes - - - 300 Repay 6.15% Senior unsecured notes - (300) - (300)
Senior notes issuance cost - - (2) (2)
Freedom Mobile finance lease obligations - - (1) - Bank facility arrangement costs (1) (5) (4) (11)
Dividends (98) (100) (292) (296)
Issuance of Class B Non-Voting Shares 7 10 37 22
Financing activities of discontinued operations - (12) - (12)
(488) (435) 335 (358)
Accounting standards
The MD&A included in the Company’s August 31, 2016 Annual Report outlined critical accounting
policies, including key estimates and assumptions that management has made under these policies, and
how they affect the amounts reported in the Consolidated Financial Statements. The MD&A also describes
significant accounting policies where alternatives exist. The condensed interim consolidated financial
statements follow the same accounting policies and methods of application as the most recent annual
consolidated financial statements except as described below.
Standards and amendments to standards issued but not yet effective
The Company has not yet adopted certain standards and amendments that have been issued but are not yet
effective. The following pronouncements are being assessed to determine their impact on the Company’s
results and financial position.
IFRIC 23, Uncertainty over Income Tax Treatments was issued in 2017 to clarify how to apply
the recognition and measurement requirements in IAS 12 when there is uncertainty over income
tax treatments. It is required to be applied for annual periods commencing January 1, 2019.
Change in accounting policy
In November 2016, the IFRS Interpretations Committee (“the Committee”) published a summary of its
meeting discussion regarding a request to clarify how an entity determines the expected manner of recovery
of an intangible asset with an indefinite useful life for the purposes of measuring deferred tax in accordance
with IAS 12 Income Taxes. Although the Committee decided not to add this issue to its agenda, the
Committee noted that an intangible asset with an indefinite useful life is not a non-depreciable asset
because a non-depreciable asset has an unlimited (or infinite) life, and that indefinite does not mean
infinite. Consequently, the fact that an entity does not amortize an intangible asset with an indefinite useful
life does not necessarily mean that the entity will recover the carrying amount of that asset only through
sale and not through use. As such, the Company changed retrospectively its accounting policy for the
accounting of deferred tax on intangible assets with indefinite useful lives to be in line with the Committee
discussions.

Shaw Communications Inc.
29
The following table summarizes the impact of this change of accounting policy on previously reported
consolidated statements of financial position. The change of accounting policy did not have an impact on
the previously reported consolidated statements of income or consolidated statements of cash flows.
Increase (decrease) to previously reported amounts: As at August 31,
(millions of Canadian dollars) 2016 2015
Goodwill 143 182 Deferred income tax liabilities 740 779
Retained earnings (1) (597) (597) (1) Included in Shareholders’ equity - Common and preferred shareholders
Related Party Transactions
The Company’s transactions with related parties are discussed in its Management’s Discussion and
Analysis for the year ended August 31, 2016 under “Related Party Transactions” and under Note 27 of the
Consolidated Financial Statements of the Company for the year ended August 31, 2016. There has been
no material change in the Company’s transactions with related parties between August 31, 2016 and May
31, 2017.
Financial Instruments
There has been no material change in the Company’s risk management practices with respect to financial
instruments between August 31, 2016 and May 31, 2017. See “Known Events, Trends and Uncertainties
– Interest Rates, Foreign Exchange Rates and Capital Markets” in the Company’s Management’s
Discussion and Analysis for the year ended August 31, 2016 and the section entitled “Risk Management”
under Note 28 of the Consolidated Financial Statements of the Company for the year ended August 31,
2016.
Risks and Uncertainties
The significant risks and uncertainties affecting the Company and its business are discussed in the
Company’s August 31, 2016 Annual Report under “Known Events, Trends, Risks and Uncertainties” in
Management’s Discussion and Analysis.

Shaw Communications Inc.
30
CONSOLIDATED STATEMENTS OF FINANCIAL POSITION (unaudited)
(millions of Canadian dollars) May 31, 2017
August 31, 2016
August 31, 2015
(restated, note 2) (restated, note 2)
ASSETS
Current
Cash 175 405 398
Accounts receivable 243 268 468
Inventories 89 65 60
Other current assets 160 138 78
Assets held for sale [notes 3] 61 - 5
728 876 1,009
Investments and other assets [notes 12 and 13] 922 853 97
Property, plant and equipment 4,731 4,607 4,220
Other long-term assets 263 275 259
Deferred income tax assets 4 6 14
Intangibles 7,457 7,450 7,459
Goodwill 1,283 1,315 1,688
15,388 15,382 14,746
LIABILITIES AND SHAREHOLDERS’ EQUITY
Current
Accounts payable and accrued liabilities 875 944 887
Provisions 92 33 52
Income taxes payable 128 215 195
Unearned revenue 214 215 196
Current portion of long-term debt [notes 7 and 12] 12 412 608
Liabilities held for sale [note 3] 35 - -
1,356 1,819 1,938
Long-term debt [notes 7 and 12] 5,556 5,200 5,061
Other long-term liabilities 144 135 186
Provisions 57 53 10
Deferred credits 512 563 588
Deferred income tax liabilities 1,927 1,914 1,914
9,552 9,684 9,697
Shareholders’ equity [notes 8 and 10]
Common and preferred shareholders 5,835 5,697 4,812
Non-controlling interests in subsidiaries 1 1 237
5,836 5,698 5,049
15,388 15,382 14,746
See accompanying notes.

Shaw Communications Inc.
31
CONSOLIDATED STATEMENTS OF INCOME (unaudited)
Three months ended May 31, Nine months ended May 31,
(millions of Canadian dollars) 2017 2016 2017 2016
Revenue [note 4] 1,311 1,275 3,912 3,553
Operating, general and administrative expenses [note 6] (761) (722) (2,287) (1,995)
Restructuring costs [notes 6 and 14] (43) (22) (54) (22) Amortization:
Deferred equipment revenue 10 13 31 43
Deferred equipment costs (30) (33) (90) (104) Property, plant and equipment, intangibles and other (252) (229) (732) (640)
Operating income from continuing operations 235 282 780 835
Amortization of financing costs – long-term debt (1) (1) (4) (4) Interest expense (74) (79) (222) (229)
Business acquisition costs - (12) - (21)
Equity income (loss) of an associate or joint venture 26 (25) 62 (61) Other gains (losses) [note 15] 18 (74) (91) (82)
Income from continuing operations before income taxes 204 91 525 438
Current income tax expense [note 4] 41 44 115 164 Deferred income tax expense (recovery) (1) (27) 10 (52)
Net income from continuing operations 164 74 400 326
Income (loss) from discontinued operations, net of tax [note 3] (31) 630 (30) 760
Net income 133 704 370 1,086
Net income from continuing operations attributable to:
Equity shareholders 164 74 400 326
Income (loss) from discontinued operations attributable to:
Equity shareholders (31) 626 (30) 740 Non-controlling interests in subsidiaries held for sale - 4 - 20
(31) 630 (30) 760
Basic earnings per share [note 9]
Continuing operations 0.33 0.14 0.80 0.66 Discontinued operations (0.06) 1.30 (0.06) 1.55
0.27 1.44 0.74 2.21
Diluted earnings per share [note 9] Continuing operations 0.33 0.14 0.80 0.66
Discontinued operations (0.06) 1.30 (0.06) 1.54
0.27 1.44 0.74 2.20
See accompanying notes.

Shaw Communications Inc.
32
CONSOLIDATED STATEMENTS OF COMPREHENSIVE INCOME (unaudited)
Three months ended May 31, Nine months ended May 31,
(millions of Canadian dollars)
2017
2016
2017
2016
Net income 133 704 370 1,086
Other comprehensive income (loss) [note 10]
Items that may subsequently be reclassified to income:
Change in unrealized fair value of derivatives designated as cash flow hedges 1 1
2 1
Adjustment for hedged items recognized in the period (1) - (2) -
Share of other comprehensive income (loss) of associates (3) (1) 7 (1) Exchange differences on translation of a foreign operation 14 (36) 28 (8)
Exchange differences on US denominated debt hedging
a foreign operation (6) 16
(12) 5
5 (20) 23 (3)
Items that will not subsequently be reclassified to income:
Remeasurements on employee benefit plans: Continuing operations (17) (11) - (17)
Discontinued operations - 3 - 2
(12) (28) 23 (18)
Comprehensive income 121 676 393 1,068
Comprehensive income attributable to:
Equity shareholders 121 672 393 1,048
Non-controlling interests in subsidiaries - 4 - 20
121 676 393 1,068
See accompanying notes.

Shaw Communications Inc.
33
CONSOLIDATED STATEMENTS OF CHANGES IN SHAREHOLDERS’ EQUITY (unaudited)
Nine months ended May 31, 2017
Attributable to equity shareholders
[millions of Canadian dollars]
Share
capital
Contributed
surplus
Retained earnings
(restated,
note 2)
Accumulated other
comprehensive
loss
Total
Equity attributable to
non-controlling
interests
Total
equity
Balance as at September 1, 2016 3,799 42 1,908 (52) 5,697 1 5,698
Net income - - 370 - 370 - 370
Other comprehensive income - - - 23 23 - 23
Comprehensive income - - 370 23 393 - 393
Dividends - - (296) - (296) - (296)
Dividend reinvestment plan 149 - (149) - - - -
Shares issued under stock option plan 45 (7) - - 38 - 38
Share-based compensation - 3 - - 3 - 3
Balance as at May 31, 2017 3,993 38 1,833 (29) 5,835 1 5,836
Nine months ended May 31, 2016
Attributable to equity shareholders
[millions of Canadian dollars]
Share
capital
Contributed
surplus
Retained
earnings (restated,
note 2)
Accumulated
other comprehensive
loss
Total
Equity
attributable to non-controlling
interests
Total
equity
Balance as at September 1, 2015 3,500 45 1,286 (19) 4,812 237 5,049
Net income - - 1,066 - 1,066 20 1,086 Other comprehensive income - - - (18) (18) - (18)
Comprehensive income - - 1,066 (18) 1,048 20 1,068
Dividends - - (299) - (299) - (299) Dividend reinvestment plan 139 - (139) - - - -
Shares issued under stock option plan 26 (4) - - 22 - 22
Share-based compensation - 2 - - 2 - 2
Business Acquisition 68 - - - 68 - 68
Distributions declared by subsidiaries
to non-controlling interests - - - - - (12) (12) Derecognition /Transfer on sale of
discontinued operations - - (4) 4 - (244) (244)
Balance as at May 31, 2016 3,733 43 1,910 (33) 5,653 1 5,654

Shaw Communications Inc.
34
CONSOLIDATED STATEMENTS OF CASH FLOWS (unaudited)
Three months ended May 31, Nine months ended May 31,
(millions of Canadian dollars) 2017 2016 2017 2016
OPERATING ACTIVITIES
Funds flow from continuing operations [note 11] 392 402 1,227 1,110
Net change in non-cash balances related to continuing operations 45 22 (86) (27)
Operating activities of discontinued operations 1 3 4 111
438 427 1,145 1,194
INVESTING ACTIVITIES Additions to property, plant and equipment [note 4] (302) (257) (829) (740)
Additions to equipment costs (net) [note 4] (21) (20) (58) (62)
Additions to other intangibles [note 4] (27) (24) (74) (77)
Net (additions) reductions to inventories (14) 4 (29) 5
Business acquisitions, net of cash acquired - (1,552) - (1,778)
Proceeds on sale of discontinued operations, net of cash sold - 1,798 - 1,798 Net additions to investments and other assets (31) (12) (50) (55)
Distributions received and proceeds from sale of investments - - - 2
Proceeds on disposal of property, plant and equipment - - - 6 Investing activities of discontinued operations - (2) - (9)
(395) (65) (1,040) (910)
FINANCING ACTIVITIES
Increase in long-term debt 7 1,300 333 1,897 Debt repayments (403) (1,628) (409) (1,958)
Bank facility arrangement costs (1) (5) (4) (11)
Issue of Class B Non-Voting Shares [note 8] 7 10 37 22 Dividends paid on Class A Shares and Class B Non-Voting
Shares (96) (96) (286) (286)
Dividends paid on Preferred Shares (2) (4) (6) (10) Financing activities of discontinued operations - (12) - (12)
(488) (435) (335) (358)
Effect of currency translation on cash balances - (1) - -
Decrease in cash (445) (74) (230) (74) Cash, beginning of the period 620 357 405 398
Cash, classified as assets held for sale at beginning of period - 41 - -
Cash of continuing operations, end of the period 175 324 175 324

Shaw Communications Inc.
NOTES TO CONDENSED CONSOLIDATED FINANCIAL STATEMENTS
(unaudited)
May 31, 2017 and 2016
[all amounts in millions of Canadian dollars, except share and per share amounts]
35
1. CORPORATE INFORMATION
Shaw Communications Inc. (the “Company”) is a diversified Canadian connectivity company whose core operating
business is providing: Cable telecommunications and Satellite video services to residential customers ("Consumer");
data networking, Cable telecommunications, and Satellite video services to businesses and public sector entities
("Business Network Services"); data centre colocation, cloud technology and managed IT solutions to businesses
(“Business Infrastructure Services”); and wireless services for voice and data communications (“Wireless”). The
Company’s shares are listed on the Toronto Stock Exchange (“TSX”), TSX Venture Exchange and New York Stock
Exchange.
2. BASIS OF PRESENTATION AND ACCOUNTING POLICIES
Statement of compliance
These condensed interim consolidated financial statements of the Company have been prepared in accordance with
International Financial Reporting Standards (“IFRS”) and in compliance with International Accounting Standard
(“IAS”) 34 Interim Financial Reporting as issued by the International Accounting Standards Board (“IASB”).
The condensed interim consolidated financial statements of the Company for the three and nine months ended May
31, 2017 were authorized for issue by the Audit Committee on June 27, 2017.
Basis of presentation
These condensed interim consolidated financial statements have been prepared primarily under the historical cost
convention except as detailed in the significant accounting policies disclosed in the Company’s consolidated financial
statements for the year ended August 31, 2016 and are expressed in millions of Canadian dollars unless otherwise
indicated. The condensed interim consolidated statements of income are presented using the nature classification for
expenses.
The notes presented in these condensed interim consolidated financial statements include only significant events and
transactions occurring since the Company’s last fiscal year end and are not fully inclusive of all matters required to
be disclosed by IFRS in the Company’s annual consolidated financial statements. As a result, these condensed interim
consolidated financial statements should be read in conjunction with the Company’s consolidated financial statements
for the year ended August 31, 2016.
The condensed interim consolidated financial statements follow the same accounting policies and methods of
application as the most recent annual consolidated financial statements except as noted below.
Standards and amendments to standards issued but not yet effective
The Company has not yet adopted certain standards and amendments that have been issued but are not yet effective.
The following pronouncements are being assessed to determine their impact on the Company’s results and financial
position.
IFRIC 23, Uncertainty over Income Tax Treatments was issued in 2017 to clarify how to apply the
recognition and measurement requirements in IAS 12 when there is uncertainty over income tax treatments.
It is required to be applied for annual periods commencing January 1, 2019.
Discontinued operations
The Company reports financial results for discontinued operations separately from continuing operations to
distinguish the financial impact of disposal transactions from ongoing operations. Discontinued operations reporting

Shaw Communications Inc.
NOTES TO CONDENSED CONSOLIDATED FINANCIAL STATEMENTS (unaudited)
May 31, 2017 and 2016
[all amounts in millions of Canadian dollars, except share and per share amounts]
36
occurs when the disposal of a component or a group of components of the Company represents a strategic shift that
will have a major impact on the Company’s operations and financial results, and where the operations and cash flows
can be clearly distinguished, operationally and for financial reporting purposes, from the rest of the Company.
The results of discontinued operations are excluded from both continuing operations and business segment information
in the interim consolidated financial statements and the notes to the interim consolidated financial statements, unless
otherwise noted, and are presented net of tax in the statement of income for the current and comparative periods. Refer
to Note 3 Discontinued Operations for further information regarding the Company’s discontinued operations.
Change in accounting policy
In November 2016, the IFRS Interpretations Committee (“the Committee”) published a summary of its meeting
discussion regarding a request to clarify how an entity determines the expected manner of recovery of an intangible
asset with an indefinite useful life for the purposes of measuring deferred tax in accordance with IAS 12 Income Taxes.
Although the Committee decided not to add this issue to its agenda, the Committee noted that an intangible asset with
an indefinite useful life is not a non-depreciable asset because a non-depreciable asset has an unlimited (or infinite)
life, and that indefinite does not mean infinite. Consequently, the fact that an entity does not amortize an intangible
asset with an indefinite useful life does not necessarily mean that the entity will recover the carrying amount of that
asset only through sale and not through use. As such, the Company changed retrospectively its accounting policy for
the accounting of deferred tax on intangible assets with indefinite useful lives to be in line with the Committee
discussions.
The following table summarizes the impact of this change of accounting policy on previously reported consolidated
statements of financial position. The change of accounting policy did not have an impact on the previously reported
consolidated statements of income or consolidated statements of cash flows.
Increase (decrease) to previously reported amounts As at August 31,
2016 2015
Goodwill 143 182
Deferred income tax liabilities 740 779
Retained earnings (1) (597) (597)
(1) Included in Shareholders’ equity - Common and preferred shareholders
3. DISCONTINUED OPERATIONS
Shaw Tracking
During the quarter, the Company entered into an agreement to sell a group of assets comprising the operations of Shaw
Tracking, a fleet tracking operation reported within the Company’s Business Network Services segment, for proceeds
of approximately USD $20. The Company determined that the assets and liabilities of the Shaw Tracking business
met the criteria to be classified as a disposal group held for sale for the period ended May 31, 2017. Accordingly, the
assets and liabilities of the Shaw Tracking business were reclassified in the consolidated balance sheet at May 31,
2017 to current assets held for sale or current liabilities held for sale, respectively, as the sale of such assets and
liabilities is expected within one year. In addition, the operating results and operating cash flows of the business are
presented as discontinued operations separate from the Company’s continuing operations.
In connection with the reclassification of assets and liabilities of the Shaw Tracking business as held for sale, the
Company reviewed the carrying value of the resulting disposal group and determined it exceeded its fair value less
cost to sell at May 31, 2017. Accordingly, an impairment charge of $32 was recorded during the quarter.

Shaw Communications Inc.
NOTES TO CONDENSED CONSOLIDATED FINANCIAL STATEMENTS (unaudited)
May 31, 2017 and 2016
[all amounts in millions of Canadian dollars, except share and per share amounts]
37
The following table summarizes the carrying value of the major classes of assets and liabilities of the disposal group
which were classified as held for sale as at May 31, 2017:
May 31, 2017
Accounts receivable 6
Inventories 5
Other current assets 1
Other long-term assets 25
Goodwill 24
Total assets of the discontinued operations classified as held for sale 61
Accounts payable and accrued liabilities 5
Deferred credits 32
Deferred income tax liabilities (2)
Total liabilities of the discontinued operations classified as held for sale 35
A reconciliation of the major classes of line items related to Shaw Tracking constituting income from discontinued
operations, net of tax, as presented in the consolidated statements of income is as follows:
Three months ended May 31, Nine months ended May 31,
2017 2016 2017 2016
Revenue 8 8 25 25
Operating, general and administrative expenses
Employee salaries and benefits 2 2 5 5
Purchases of goods and services 4 4 15 13
6 6 20 18 Amortization 1 1 2 3
Impairment of goodwill/disposal group 32 17 32 17
Loss from discontinued operations before tax (31) (16) (29) (13)
Income taxes - - 1 1
Loss from discontinued operations, net of tax (31) (16) (30) (14)
Shaw Media
In the second quarter of fiscal 2016, the Company announced it had entered into an agreement with Corus
Entertainment Inc. (“Corus”), a related party subject to common voting control, to sell 100% of its wholly owned
subsidiary Shaw Media Inc. (“Shaw Media”) for a purchase price of approximately $2.65 billion comprised of $1.85
billion of cash and 71,364,853 Corus Class B non-voting participating shares. The transaction closed on April 1, 2016.
Although, through holding of the shares in Corus, the Company effectively retains an indirect, non-controlling interest
in the former Media division subsequent to the sale, the Company no longer has control over the division.
Accordingly, the operating results and operating cash flows for the previously reported Media segment are presented
as discontinued operations separate from the Company’s continuing operations.

Shaw Communications Inc.
NOTES TO CONDENSED CONSOLIDATED FINANCIAL STATEMENTS (unaudited)
May 31, 2017 and 2016
[all amounts in millions of Canadian dollars, except share and per share amounts]
38
A reconciliation of the major classes of line items related to Shaw Media constituting income from discontinued
operations, net of tax, as presented in the consolidated statements of income is as follows:
Three months ended May 31, Nine months ended May 31,
2017 2016 2017 2016
Revenue - 88 - 610
Eliminations(1) - (7) - (46)
- 81 - 564
Operating, general and administrative expenses
Employee salaries and benefits - 16 - 109
Purchases of goods and services(2) - 32 - 272
- 48 - 381
Eliminations(1) - (7) - (46)
- 41 - 335 Restructuring costs - - - -
Amortization(2) - - - 11
Accretion of long-term liabilities and provisions - - - 2 Other losses - (1) - -
Income from discontinued operations before tax and gain on
divestiture - 41 - 216 Income taxes - 10 - 57
Income from discontinued operations, net of tax, before gain on
divestiture - 31
- 159
Gain on Divestiture - 662 - 662 Income taxes - 47 - 47
Income from Discontinued Operations, Net of Tax - 646 - 774
(1) Eliminations relate to intercompany transactions between continuing and discontinued operations. The costs are
included in continuing operations as they continue to be incurred subsequent to the disposition. (2) As of the date the Media division met the criteria to be classified as held for sale in the prior year, the Company ceased
amortization of non-current assets of the division, including program rights, property, plant and equipment, intangibles
and other. Amortization that would otherwise have been taken in the three and nine month periods ended May 31, 2016
amounted to $15 and $35 for program rights and $2 and $6 for property, plant and equipment, intangibles and other.
4. BUSINESS SEGMENT INFORMATION
The Company’s chief operating decision makers are the CEO, President and CFO and they review the operating
performance of the Company by segments which comprise Consumer, Business Network Services, Business
Infrastructure Services and Wireless. The chief operating decision makers utilize operating income before
restructuring costs and amortization for each segment as a key measure in making operating decisions and assessing
performance. The Consumer segment provides Cable telecommunications services including Video, Internet, Wi-Fi,
Phone, and Satellite Video to Canadian consumers. The Business Network Services segment provides data
networking, video, voice and Internet services through a national fibre-optic backbone network and also provides
satellite Video services to North American businesses and public sector entities. The Business Infrastructure Services
segment provides data centre colocation, cloud and managed services to North American and European businesses.
The Wireless segment, formed by the acquisition of Freedom Mobile (formerly, WIND Mobile) on March 1, 2016,
provides wireless services for voice and data communications serving customers in Ontario, British Columbia and
Alberta. All of the Company’s reportable segments are substantially located in Canada with the exception of Business
Infrastructure Services, consisting primarily of ViaWest, which has operations located in the United States and Europe.
Information on operations by segment is as follows:
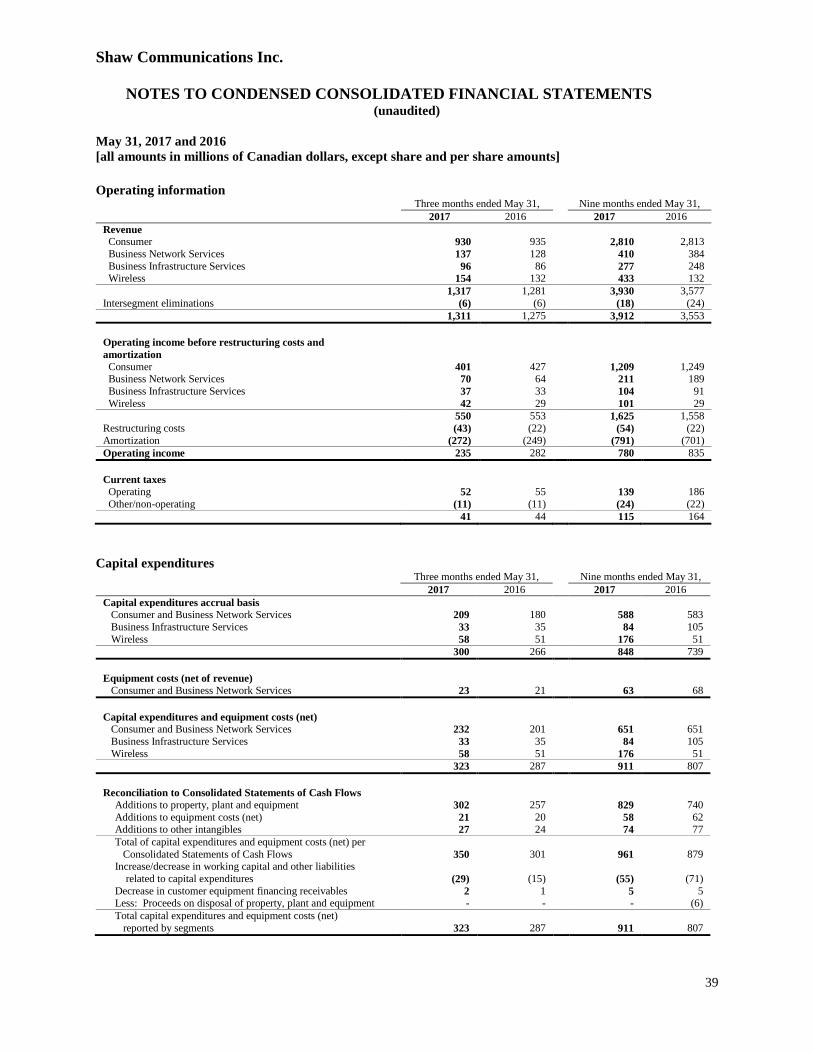
Shaw Communications Inc.
NOTES TO CONDENSED CONSOLIDATED FINANCIAL STATEMENTS (unaudited)
May 31, 2017 and 2016
[all amounts in millions of Canadian dollars, except share and per share amounts]
39
Operating information Three months ended May 31, Nine months ended May 31,
2017 2016 2017 2016
Revenue Consumer 930 935 2,810 2,813
Business Network Services 137 128 410 384
Business Infrastructure Services 96 86 277 248 Wireless 154 132 433 132
1,317 1,281 3,930 3,577
Intersegment eliminations (6) (6) (18) (24)
1,311 1,275 3,912 3,553
Operating income before restructuring costs and
amortization
Consumer 401 427 1,209 1,249 Business Network Services 70 64 211 189
Business Infrastructure Services 37 33 104 91
Wireless 42 29 101 29
550 553 1,625 1,558
Restructuring costs (43) (22) (54) (22)
Amortization (272) (249) (791) (701)
Operating income 235 282 780 835
Current taxes
Operating 52 55 139 186
Other/non-operating (11) (11) (24) (22)
41 44 115 164
Capital expenditures Three months ended May 31, Nine months ended May 31,
2017 2016 2017 2016
Capital expenditures accrual basis Consumer and Business Network Services 209 180 588 583
Business Infrastructure Services 33 35 84 105
Wireless 58 51 176 51
300 266 848 739
Equipment costs (net of revenue)
Consumer and Business Network Services 23 21 63 68
Capital expenditures and equipment costs (net) Consumer and Business Network Services 232 201 651 651
Business Infrastructure Services 33 35 84 105
Wireless 58 51 176 51
323 287 911 807
Reconciliation to Consolidated Statements of Cash Flows
Additions to property, plant and equipment 302 257 829 740
Additions to equipment costs (net) 21 20 58 62 Additions to other intangibles 27 24 74 77
Total of capital expenditures and equipment costs (net) per
Consolidated Statements of Cash Flows 350 301 961 879 Increase/decrease in working capital and other liabilities
related to capital expenditures (29) (15)
(55) (71)
Decrease in customer equipment financing receivables 2 1 5 5 Less: Proceeds on disposal of property, plant and equipment - - - (6)
Total capital expenditures and equipment costs (net)
reported by segments 323 287
911 807

Shaw Communications Inc.
NOTES TO CONDENSED CONSOLIDATED FINANCIAL STATEMENTS (unaudited)
May 31, 2017 and 2016
[all amounts in millions of Canadian dollars, except share and per share amounts]
40
5. PROVISIONS
In September 2016, shomi, a joint venture of the Company and Rogers Communications Inc., announced the decision
to wind down its operations with service ending on November 30, 2016. The Company recorded a provision of $107
in the first quarter relating to the wind down of the investment. In the current quarter, a reversal of $15 of the provision
was recorded, resulting in an aggregate provision of $92 for the year.
6. OPERATING, GENERAL AND ADMINISTRATIVE EXPENSES AND RESTRUCTURING
COSTS
Three months ended May 31, Nine months ended May 31,
2017 2016 2017 2016
Employee salaries and benefits 267 234 724 640
Purchase of goods and services 537 510 1,617 1,377
804 744 2,341 2,017
7. LONG-TERM DEBT
May 31, 2017 August 31, 2016
Long-term
debt at
amortized
cost
Adjustment
for finance
costs
Long-term
debt repayable
at maturity
Long-term
debt at amortized
cost
Adjustment for finance
costs
Long-term
debt repayable at
maturity
$ $ $ $ $ $
Corporate Bank loans (1) 511 - 511 498 - 498
Cdn fixed rate senior notes-
5.70% due March 2, 2017 - - - 400 - 400
5.65% due October 1, 2019 1,247 3 1,250 1,246 4 1,250
5.50% due December 7, 2020 498 2 500 498 2 500 3.15% due February 19, 2021 298 2 300 298 2 300
4.35% due January 31, 2024 497 3 500 497 3 500
3.80% due March 1, 2027 298 2 300 - - - 6.75% due November 9, 2039 1,419 31 1,450 1,418 32 1,450
4,768 43 4,811 4,855 43 4,898
Other
ViaWest – credit facility 730 11 741 682 13 695 ViaWest – other 28 - 28 31 - 31
Freedom Mobile - other 2 - 2 4 - 4
Burrard Landing Lot 2 Holdings Partnership 40 - 40 40 - 40
Total consolidated debt 5,568 54 5,622 5,612 56 5,668
Less current portion (2) 12 - 12 412 - 412
5,556 54 5,610 5,200 56 5,256
(1) Bank loans include borrowings of USD $380 at May 31, 2017 (August 31, 2016 – USD $380). (2) Current portion of long-term debt includes amounts due within one year in respect of ViaWest’s term loan, and ViaWest’s and Freedom
Mobile’s finance lease obligations and landlord debt.
In December 2016, the Company amended the terms of its bank credit facility to extend the maturity date from
December 2019 to December 2021.
On February 28, 2017, the Company issued $300 senior notes at a rate of 3.80% due March 1, 2027, and on March
2, 2017 the Company repaid $400 5.70% senior notes at their maturity.

Shaw Communications Inc.
NOTES TO CONDENSED CONSOLIDATED FINANCIAL STATEMENTS (unaudited)
May 31, 2017 and 2016
[all amounts in millions of Canadian dollars, except share and per share amounts]
41
8. SHARE CAPITAL
Changes in share capital during the nine months ended May 31, 2017 are as follows:
Class A Shares
Class B Non-Voting
Shares
Series A
Preferred Shares
Series B
Preferred Shares
Number $ Number $ Number $ Number $
August 31, 2016 22,420,064 2 463,827,512 3,504 10,012,393 245 1,987,607 48
Issued upon stock option plan exercises - - 1,595,325 45 - - - - Issued pursuant to dividend
reinvestment plan - - 5,527,957 149
- - - -
May 31, 2017 22,420,064 2 470,950,794 3,698 10,012,393 245 1,987,607 48
9. EARNINGS PER SHARE
Earnings per share calculations are as follows:
Three months ended May 31, Nine months ended May 31,
2017 2016 2017 2016
Numerator for basic and diluted earnings per share ($) Net income from continuing operations 164 74 400 326
Deduct: dividends on Preferred Shares (2) (3) (6) (11)
Net income attributable to common shareholders from continuing
operations 162 71
394 315 Net income from discontinued operations (31) 630 (30) 760
Deduct: net income from discontinued operations attributable to non-
controlling interests - (4)
- (20)
Net income from discontinued operations attributable to common
shareholders (31) 626
(30) 740
Net income attributable to common shareholders 131 697 364 1,055
Denominator (millions of shares) Weighted average number of Class A Shares and Class B Non-
Voting Shares for basic earnings per share 492 482
490 478
Effect of dilutive securities (1) 1 1 1 1
Weighted average number of Class A Shares and Class B Non-Voting Shares for diluted earnings per share 493 483
491 479
Basic earnings per share ($)
Continuing operations 0.33 0.14 0.80 0.66 Discontinued operations (0.06) 1.30 (0.06) 1.55
Attributable to common shareholders 0.27 1.44 0.74 2.21
Diluted earnings per share ($)
Continuing operations 0.33 0.14 0.80 0.66 Discontinued operations (0.06) 1.30 (0.06) 1.54
Attributable to common shareholders 0.27 1.44 0.74 2.20
(1) The earnings per share calculation does not take into consideration the potential dilutive effect of certain stock options since
their impact is anti-dilutive. For the three and nine months ended May 31, 2017, 1,158,659 (2016 – 8,298,907) and 3,566,228
(2016 – 4,865,039) options were excluded from the diluted earnings per share calculation, respectively.

Shaw Communications Inc.
NOTES TO CONDENSED CONSOLIDATED FINANCIAL STATEMENTS (unaudited)
May 31, 2017 and 2016
[all amounts in millions of Canadian dollars, except share and per share amounts]
42
10. OTHER COMPREHENSIVE INCOME AND ACCUMULATED OTHER COMPREHENSIVE
LOSS
Components of other comprehensive income and the related income tax effects for the nine months ended May 31,
2017 are as follows: Amount
$
Income
taxes
$
Net
$
Items that may subsequently be reclassified to income
Change in unrealized fair value of derivatives designated as cash flow hedges 3 (1) 2
Adjustment for hedged items recognized in the period (3) 1 (2)
Share of other comprehensive income of associates 7 - 7
Exchange differences on translation of a foreign operation 28 - 28
Exchange differences on translation of US denominated debt hedging a foreign operation (12) - (12)
23 - 23
Items that will not be subsequently be reclassified to income
Remeasurements on employee benefit plans:
Continuing operations - - -
23 - 23
Components of other comprehensive income and the related income tax effects for the three months ended May 31,
2017 are as follows: Amount
$
Income
taxes
$
Net
$
Items that may subsequently be reclassified to income
Change in unrealized fair value of derivatives designated as cash flow hedges 2 (1) 1
Adjustment for hedged items recognized in the period (2) 1 (1)
Share of other comprehensive income of associates (3) - (3)
Exchange differences on translation of a foreign operation 14 - 14
Exchange differences on translation of US denominated debt hedging a foreign operation (6) - (6)
5 - 5
Items that will not be subsequently be reclassified to income
Remeasurements on employee benefit plans:
Continuing operations (23) 6 (17)
(18) 6 (12)
Components of other comprehensive income and the related income tax effects for the nine months ended May 31,
2016 are as follows: Amount
$
Income
taxes
$
Net
$
Items that may subsequently be reclassified to income
Change in unrealized fair value of derivatives designated as cash flow hedges 1 - 1
Share of other comprehensive income of associates (1) - (1)
Exchange differences on translation of a foreign operation (8) - (8)
Exchange differences on translation of US denominated debt hedging a foreign operation 5 - 5
(3) - (3)
Items that will not be subsequently be reclassified to income
Remeasurements on employee benefit plans:
Continuing operations (23) 6 (17) Discontinued operations 2 - 2
(24) 6 (18)

Shaw Communications Inc.
NOTES TO CONDENSED CONSOLIDATED FINANCIAL STATEMENTS (unaudited)
May 31, 2017 and 2016
[all amounts in millions of Canadian dollars, except share and per share amounts]
43
Components of other comprehensive income and the related income tax effects for the three months ended May 31,
2016 are as follows: Amount
$
Income
taxes
$
Net
$
Items that may subsequently be reclassified to income
Change in unrealized fair value of derivatives designated as cash flows 1 - 1 Share of other comprehensive income of associates (1) - (1)
Exchange differences on translation of a foreign operation (36) - (36)
Exchange differences on translation of US denominated debt hedging a foreign operation 16 - 16
(20) - (20)
Items that will not be subsequently be reclassified to income
Remeasurements on employee benefit plans: Continuing operations (15) 4 (11)
Discontinued operations 4 (1) 3
(31) 3 (28)
Accumulated other comprehensive loss is comprised of the following: May 31, 2017
$
August 31, 2016
$
Items that may subsequently be reclassified to income Change in unrealized fair value of derivatives designated as cash flow hedges 2 1
Share of other comprehensive income (loss) of associates 2 (5)
Foreign currency translation adjustments 123 108
Items that will not be subsequently reclassified to income
Remeasurements on employee benefit plans: Continuing operations (156) (156)
(29) (52)
11. STATEMENTS OF CASH FLOWS
Disclosures with respect to the Consolidated Statements of Cash Flows are as follows:
(i) Funds flow from continuing operations
Three months ended May 31, Nine months ended May 31,
2017 2016 2017 2016
Net income from continuing operations 164 74 400 326 Adjustments to reconcile net income to funds flow from operations:
Amortization 273 252 794 708
Deferred income tax expense (recovery) (1) (27) 10 (52) Share-based compensation 1 1 3 2
Defined benefit pension plans 4 3 8 (17)
Accretion of long-term liabilities and provisions (1) - (1) (1) Equity loss (income) of an associate or joint venture (25) 25 (62) 61
Provision (recovery) for investment loss (15) - 92 -
Loss on write-down of assets - 1 - 8 Loss on write-down of investments - 70 - 70
Other (8) 3 (17) 5
Funds flow from continuing operations 392 402 1,227 1,110

Shaw Communications Inc.
NOTES TO CONDENSED CONSOLIDATED FINANCIAL STATEMENTS (unaudited)
May 31, 2017 and 2016
[all amounts in millions of Canadian dollars, except share and per share amounts]
44
(ii) Interest and income taxes paid and interest received and classified as operating activities are as follows:
Three months ended May 31, Nine months ended May 31,
2017 2016 2017 2016
Interest paid 96 131 250 280 Income taxes paid (net of refunds) 15 15 204 227
(iii) Non-cash transactions:
The Consolidated Statements of Cash Flows exclude the following non-cash transactions:
Three months ended May 31, Nine months ended May 31,
2017 2016 2017 2016
Issuance of Class B Non-Voting Shares:
Dividend reinvestment plan 50 46 149 139
12. FAIR VALUE
Fair value estimates are made at a specific point in time, based on relevant market information and information about
the financial instrument. These estimates are subjective in nature and involve uncertainties and matters of significant
judgement and, therefore, cannot be determined with precision. Changes in assumptions could significantly affect the
estimates.
Financial instruments
The fair value of financial instruments has been determined as follows:
(i) Current assets and current liabilities
The fair value of financial instruments included in current assets and current liabilities approximates their carrying
value due to their short-term nature.
(ii) Investments and other assets and other long-term assets
The fair value of publicly traded investments is determined by quoted market prices. Investments in private
entities which do not have quoted market prices in an active market and whose fair value cannot be readily
measured are carried at cost. No published market exists for such investments. These equity investments have
been made as they are considered to have the potential to provide future benefit to the Company and accordingly,
the Company has no current intention to dispose of these investments in the near term. The fair value of long-
term receivables approximates their carrying value as they are recorded at the net present values of their future
cash flows, using an appropriate discount rate.
(iii) Long-term debt
The carrying value of long-term debt is at amortized cost based on the initial fair value as determined at the time
of issuance or at the time of a business acquisition. The fair value of publicly traded notes is based upon current
trading values. The fair value of finance lease obligations is determined by discounting future cash flows using
a rate for loans with similar terms, conditions and maturity dates. The carrying value of bank credit facilities
approximates fair value as the debt bears interest at rates that fluctuate with market values. Other notes and
debentures are valued based upon current trading values for similar instruments.

Shaw Communications Inc.
NOTES TO CONDENSED CONSOLIDATED FINANCIAL STATEMENTS (unaudited)
May 31, 2017 and 2016
[all amounts in millions of Canadian dollars, except share and per share amounts]
45
(iv) Other long-term liabilities
The fair value of contingent consideration arising from a business acquisition is determined by calculating the
present value of the probability weighted assessment of the likelihood that revenue targets will be met and the
estimated timing of such payments.
(v) Derivative financial instruments
The fair value of US currency forward purchase contracts is determined by an estimated credit-adjusted mark-to-
market valuation using observable forward exchange rates at the end of reporting periods and contract forward
rates.
The carrying values and estimated fair values of long-term debt and a contingent liability are as follows:
May 31, 2017 August 31, 2016
Carrying
value
Estimated
fair value
Carrying
value
Estimated
fair value
$ $ $ $
Liabilities
Long-term debt (including current portion) (1) 5,568 6,262 5,612 6,252
Contingent liability(2) 1 1 2 2
(1) Level 2 fair value – determined by valuation techniques using inputs based on observable market data, either directly or indirectly, other than quoted prices.
(2) Level 3 fair value – determined by valuation techniques using inputs that are not based on observable market data.
13. INVESTMENTS AND OTHER ASSETS
Corus Entertainment Inc.
In connection with the sale of the Media division to Corus in 2016, the Company received 71,364,853 Corus Class B
non-voting participating shares representing approximately 37% of Corus’ total issued equity of Class A and Class B
shares. The Company participates in Corus’ dividend reinvestment program for this initial investment in Corus Class
B Shares. For the three and nine months ended May 31, 2017, the Company received dividends of $22 (2016 - $14)
and $65 (2016 - $14) from Corus, of which $20 (2016 - $14) and $61 (2016 - $14) were reinvested in additional Corus
Class B shares, respectively. At May 31, 2017, the Company owned 79,119,000 (2016 – 72,499,684) Corus Class B
shares having a fair value of $1,056 (2016 - $911) and representing 39% (2016 – 37%) of the total issued equity of
Corus. The Company’s weighted average ownership of Corus for the period from September 1, 2016 to May 31, 2017
was 39% (April 1 to May 31, 2016 – 37%).

Shaw Communications Inc.
NOTES TO CONDENSED CONSOLIDATED FINANCIAL STATEMENTS (unaudited)
May 31, 2017 and 2016
[all amounts in millions of Canadian dollars, except share and per share amounts]
46
Summary financial information for Corus and reconciliation with the carrying amount of the investment in the
unaudited interim condensed consolidated balance sheets is as follows:
May 31, 2017 August 31, 2016
Current assets 587 470
Non-current assets 5,583 5,623
Current liabilities (679) (532)
Non-current liabilities (2,905) (3,085)
Net assets 2,586 2,476
Less: non-controlling interests (160) (158)
2,426 2,318
Carrying amount of the investment 883 817
Summarized statement of earnings of Corus:
Three months ended May 31, Nine months ended May 31,
2017 2016 2017 2016
Revenue 462 361 1,298 787
Net income attributable to:
Shareholders 67 (16) 163 128
Non-controlling interest 9 5 25 7
76 (11) 188 135
Other comprehensive income, attributable to shareholders (7) (4) 20 (3)
Comprehensive income 69 (15) 208 132
Equity income from associates(1) 26 (10) 62 (10)
Other comprehensive income from equity accounted
associates(1) (3) (1) 7 (1)
23 (11) 69 (11)
(1) The Company’s share of income and other comprehensive income reflect the weighted average proportion of Corus net
income and other comprehensive income attributable to shareholders for the three and nine months ended May 31, 2017 and
for the two months ended May 31, 2016.
14. RESTRUCTURING COSTS
During 2016, the Company underwent a restructuring following a set of significant asset realignment initiatives,
including the acquisition of Freedom Mobile and the divestiture of Shaw Media.
During the current fiscal year, the Company restructured certain operations within the Consumer segment and
announced a realignment to integrate certain Consumer/Business Network Services operations and Freedom Mobile.
In connection with the restructuring and realignment, the Company recorded $54 primarily related to severance and
employee related costs in respect of the approximate 360 affected employees. The majority of the remaining costs are
expected to be paid in the current year. The continuity of the restructuring provisions is as follows.
$
Balance as at September 1, 2016 4
Additions 54
Payments (44)
Balance as at May 31, 2017 14

Shaw Communications Inc.
NOTES TO CONDENSED CONSOLIDATED FINANCIAL STATEMENTS (unaudited)
May 31, 2017 and 2016
[all amounts in millions of Canadian dollars, except share and per share amounts]
47
15. OTHER GAINS/LOSSES
In the current year, other losses include a provision of $92 in respect of the Company’s investment in shomi which
announced a wind down of operations during the first quarter. In the prior year, other losses include a write-down of
$51 in respect of the Company’s investment in shomi, a write-down of $20 in respect of a private portfolio investment
and asset write-downs of $6. Other gains/losses generally includes realized and unrealized foreign exchange gains and
losses on US dollar denominated current assets and liabilities, gains and losses on disposal of property, plant and
equipment and minor investments, and the Company’s share of the operations of Burrard Landing Lot 2 Holdings
Partnership.
16. SUBSEQUENT EVENTS
Sale of ViaWest, Inc.
On June 13, 2017 the Company announced it had reached an agreement to sell 100% of its wholly owned subsidiary
ViaWest, Inc. for cash proceeds of approximately USD $1.68 billion. In connection with the sale, the Company
intends to repay ViaWest debt of approximately USD $580 and amounts outstanding under the Company’s bank credit
facility of USD $380. ViaWest comprises substantially all of the Business Infrastructure Services division of the
Company. The Transaction is subject to customary conditions, including U.S. regulatory approval and is expected to
close by the end of fiscal 2017.
Acquisition of wireless spectrum licences
On June 13, 2017 the Company announced it had entered into a definitive agreement to acquire 700 MHz and 2500
MHz wireless spectrum licences for $430. The spectrum licences being acquired comprise 10 MHz licences of 700
MHz spectrum in each of British Columbia, Alberta, and Southern Ontario, as well as 20 MHz licences of 2500 MHz
spectrum in each of Vancouver, Edmonton, Calgary, and Toronto.
The purchase is subject to customary closing conditions and all necessary regulatory approvals from the Ministry of
Innovation, Science and Economic Development Canada (ISED), and under the Competition Act. The purchase will
be funded using a combination of cash on hand and the Company’s existing bank credit facility, and is expected to
close in the Summer of 2017.