Embed Size (px)
Citation preview
ET18SCE7080 Next-Generation, Low-GWP Refrigeration Systems
Southern California Edison Page 1 of 51
Emerging Products
Next-Generation, Low-GWP Refrigeration Systems
Tool Assessment and Market Impacts
ET18SCE7080 Report
Prepared by:
Emerging Products
Customer Service
Southern California Edison
June 2021
ET18SCE7080 Next-Generation, Low-GWP Refrigeration Systems
Southern California Edison Page 2 of 51
Emerging Products
Acknowledgements
Southern California Edison’s (SCE) Emerging Products (EP) group is responsible for this project. It was developed as part of SCE’s Emerging Technologies Program under internal project number ET18SCE7080. Jim Kelsey (kW Engineering) conducted this technology evaluation, with overall guidance and management from Paul Delaney (SCE). For more information on this project, contact [email protected].
Disclaimer
This report was prepared by SCE and funded by California utility customers under the
auspices of the California Public Utilities Commission (CPUC). Reproduction or distribution of the whole or any part of the contents of this document without the express written permission of SCE is prohibited. This work was performed with reasonable care and in accordance with professional standards. However, neither SCE
nor any entity performing the work pursuant to SCE’s authority make any warranty or representation, expressed or implied, with regard to this report, the merchantability or fitness for a particular purpose of the results of the work, or any analyses or conclusions contained in this report. The results reflected in the work are generally representative of
operating conditions; however, the results in any other situation may vary, depending upon particular operating conditions.

ET18SCE7080 Next-Generation, Low-GWP Refrigeration Systems
Southern California Edison Page 3 of 51
Emerging Products
EXECUTIVE SUMMARY The goal of this study was to characterize existing refrigerant options in the California
grocery/supermarket sector, and to determine how phasing out Hydrofluorocarbon (HFC) refrigerants in favor of those with lower Global-Warming Potential (GWP) might impact expected energy use and Carbon Dioxide (CO2) emissions in the sector. In this study, “low GWP” is lower than 150. “Intermediate GWP” is between 150 and 2,500, and
“high GWP” is more than 2,500. The project included three areas of investigation:
1. A stakeholder survey, to determine current trends of adopting low-GWP refrigerant options in new construction and retrofits.
2. A review and gap analysis of available energy simulation platforms used to
evaluate and compare the relative energy use and operating costs of various system types, for both established and emerging technologies.
3. Creation of an analytical model to simulate the energy and equivalent CO2
emissions impacts in multiple technology adoption scenarios, including direct impacts due to refrigerant leaks and indirect impacts due to changes in the systems’ overall Energy Efficiency (EE).
STAKEHOLDER FEEDBACK We conducted stakeholder interviews to characterize the grocery/supermarket sector, with respect to existing facilities, retrofit and new construction trends, and how
regulatory requirements were met. Stakeholders described existing facilities as taking mostly traditional refrigeration approaches, including ozone-depleting Hydrochlorofluorocarbon (HFC-22) penetration, a
heavy reliance on HFCs (mostly high-GWP options), and standard multiplex systems. A small fraction of existing stores reported being retrofit with moderate-GWP options, such as R-448a and R-449a.
In new construction, stakeholders reported regulatory requirements, such as California Air Resources Board (CARB) and Environmental Protection Agency (EPA) requirements for Greenhouse Gas (GHG) mitigation would largely drive new refrigerant adoption. While stakeholders from larger chains were preparing by testing approaches with various
refrigerants, these efforts were mainly contained to “pilot” stores, rather than all-new stores. One large chain was an exception – all their new stores were being designed with CO2 transcritical systems.

ET18SCE7080 Next-Generation, Low-GWP Refrigeration Systems
Southern California Edison Page 4 of 51
Emerging Products
COMMERCIAL REFRIGERATION TOOLS There were no readily available tools to meet all stakeholder needs for modeling next-generation commercial refrigeration systems. Market stakeholders stated they would
have liked tools that: ● Were fast and easy to use ● Were model and whole-building interactive
● Accurately modeled the diversity of new technology and low-GWP options
The market study required us to analyze the typical Energy-Efficiency Ratios (EERs) of various system types. We used Pack Calculation Pro, a tool that met most of our immediate needs, including the ability to model CO2 transcritical options and a wide
array of system types. It was also relatively easy to use. We found Pack Calculation Pro to be the most capable of the options we tested, although verification and calibration to known results was beyond our scope of work.
MARKET IMPACTS AND GHG REDUCTION TRENDS Based on historical trends and as confirmed by survey respondents, low-GWP expansion
in the grocery/supermarket sector was (and will continue to be) modest. Historical growth trends were reported at between 0.5% and 1.1% per year1, and major equipment remodel rates were slow at about 3% of existing stock per year. Together, these trends meant equipment turnover could be slow, and it could be a long time before new construction regulations made a significant impact on GHG reductions. Our market models confirmed attaining California’s HFC reduction goals would be difficult in the grocery/supermarket sector, with typical equipment turnover and new construction rates. Using baseline assumptions, reducing HFC direct emissions to 40% of 2013 levels would only be achieved by around 2041, 11 years later than regulatory goals. Primary variables to expedite reaching that goal include increased equipment turnover rates and reduced leak rates. Market remodel/turnover rates would have to double to meet goals on time. Alternatively, given baseline market turnover, a 27% leak rate reduction would achieve the same goal. The goal could be met through a combined strategy – for example, by increasing the market annual turnover rate from 3% to 4%, and reducing leak rates by 20%.
1 Growth rates were an average of: 1.1% per Food Marketing Institute, Industry Facts, 2018; 0.5% per
IBISworld Supermarkets & Grocery Stores in the U.S. industry trends (2015-2020) 2020; and 1.21% per US
Department of Agriculture, Economic Research Service, 2010-2018).
ET18SCE7080 Next-Generation, Low-GWP Refrigeration Systems
Southern California Edison Page 5 of 51
Emerging Products
RECOMMENDATIONS Based on our conclusions and experience conducting this study, we made the following observations and recommendations to help meet California’s important efficiency and
GHG reduction goals: • To achieve state GHG reduction goals, it will be critical to accelerate the
transition to low-GWP options and systematically reduce leak rates. While existing leak rates are tracked through CARB’s Refrigerant Management Program (RMP), low-GWP refrigerants, market turnover, and growth are not. It will be critical to carefully monitor actual turnover rates for retrofitting existing equipment, to ensure the state is on track. Recent trends toward more distributed shopping options may complicate monitoring trends, if facilities use low refrigerant charges that do not require RMP reporting.
• Market turnover rate is a key to success. Since low-GWP remodels2 are not generally cost effective vs. “do-nothing” or “gas-only” retrofit scenarios, financial
incentives for these retrofits may be needed to spur technology acceptance and help transform the market beyond early adopters and pilot projects.
• Workforce education and training will be a necessary component of any
market transformation approach, to ensure the necessary infrastructure exists to support these changes. In interviews, industry participants and stakeholders noted a lack of experience with low-GWP refrigerants among technicians responsible for system installation and maintenance. Unlike traditional refrigerants, new technology
options (such as CO2 transcritical, ammonia, and hydrocarbon-based systems) have unique characteristics (such as high operating pressures, toxicity, flammability, material compatibility, new lubricant requirements, and others).
• To fully integrate refrigerant retrofits with EE program implementation, a deployment equivalency mechanism is needed, to align goal attainment, cost effectiveness, and reward mechanisms. California regulators collaborated on how to evaluate avoided costs associated with refrigerant retrofit GHG reductions, consistent with how avoided costs are attributed to EE improvements. However,
there is no mechanism for recognizing GHG reductions from EE programs beyond their potential impact to the cost effectiveness of EE projects.
• Further development of comprehensive modeling tools is needed, to include the full spectrum of available technologies and refrigerants. Market stakeholders desire tools that: 1) are easy to use; 2) account for interactive effects between Heating, Ventilation, and Air Conditioning (HVAC), including humidity and refrigeration; 3) model whole-building performance; 4) closely model cost impacts and rate treatment; and 4) accurately compare energy performance between disparate systems. We recommend Pack Calculation Pro as the most capable of the modeling tools we used; however, we did not verify the results against real-world results, because verification was not applicable to whole-building consumption.
2 In the supermarket/retail industry, “retrofit” often means gas change, whereas “remodel” or “replacement”
refers to system changes, such as installing HFC-free systems.

ET18SCE7080 Next-Generation, Low-GWP Refrigeration Systems
Southern California Edison Page 6 of 51
Emerging Products
ABBREVIATIONS AND ACRONYMS
BTO Building Technology Office
CARB California Air Resources Board
CEC California Energy Commission
CPUC California Public Utility Commission
DOE Department of Energy
EE Energy Efficiency
EER Energy Efficiency Ratio
EUI Energy Use Intensity
EPA Environmental Protection Agency
ERRA Energy Resource Recovery Account
FRIP Fluorinated Gases Emission Reduction Incentive Program
GHG Greenhouse Gas
GWh Gigawatt-hour
GWP Global Warming Potential
HCFC Hydrochlorofluorocarbon (refrigerant, e.g., R-22)
HFC Hydrofluorocarbon (refrigerant, e.g., R-404a, R-507)
HFO Hydrofluoroolefin (refrigerant, e.g., R-1234yf, R-1234-ze)
HVAC Heating, Ventilation, and Air Conditioning
IPCC Intergovernmental Panel on Climate Change
Msf Millions of Square Feet
MmTCO2-e Million Metric Tons of CO2-Equivalent Emissions
MTCO2-e Metric Tons of CO2-Equivalent Emissions
Mwh Megawatt-hour
NASRC North American Sustainable Refrigeration Council
ODP Ozone Depletion Potential
RMP CARB’s Refrigerant Management Program
R3 CARB’s Refrigerant Registration and Reporting System
SME Subject Matter Expert
SNAP Significant New Alternatives Policy
TEWI Total Equivalent Warming Impact
ET18SCE7080 Next-Generation, Low-GWP Refrigeration Systems
Southern California Edison Page 7 of 51
Emerging Products
CONTENTS
EXECUTIVE SUMMARY __________________________________________________ 3
Stakeholder Feedback ............................................................................. 3
Commercial Refrigeration Tools ................................................................ 4
Market Impacts and GHG Reduction Trends ............................................... 4
Recommendations .................................................................................. 5
ABBREVIATIONS AND ACRONYMS_________________________________________ 6
REGULATORY POLICY BACKGROUND _____________________________________ 11
SB 1383: Short-Lived Climate Pollutants (2016) ...................................... 11
SB 1013: Fluorinated Refrigerants (California Cooling Act, 2018) ............... 12
STAKEHOLDER INTERVIEWS _____________________________________________ 13
Existing Store Makeup .......................................................................... 14
New Construction Trends ...................................................................... 16
Retrofit Trends ..................................................................................... 17
MODELING TOOL NEEDS ASSESSMENT_____________________________________ 18
Stakeholder Feedback on Modeling Tool Needs......................................... 18
Regulatory Needs ................................................................................. 19
Needs Assessment Summary ................................................................. 19
EXISTING TOOL GAP ANALYSIS __________________________________________ 20
Whole-building Energy Simulation Tools .................................................. 21
EnergyPlus ..................................................................................... 21 DOE 2.2R ....................................................................................... 22
System-Level Energy Simulation Tools .................................................... 23
Genetron Properties......................................................................... 23 Pack Calculation Pro (Pack Calc Pro) .................................................. 23 Current Gaps in Available Modeling Platforms ..................................... 28
Modeling Tool Conclusions ..................................................................... 28
MARKET IMPACTS ____________________________________________________ 29
Method ............................................................................................... 29
Assumptions ........................................................................................ 34
Current California Baseline, and Load-Growth Forecasts ............................ 37
Forecast Scenarios for Intervention and Market Transformation ................. 39

ET18SCE7080 Next-Generation, Low-GWP Refrigeration Systems
Southern California Edison Page 8 of 51
Emerging Products
Equivalent CO2 Emissions ................................................................. 41
Meeting California’s CO2 Emission Targets ............................................... 43
Assumptions and Their Relative Impact on Results ................................... 43
Direct Emissions.............................................................................. 44 Indirect Emissions ........................................................................... 45 TEWI ............................................................................................. 46 CO2 Reduction Goal Attainment ......................................................... 47
APPENDIX A – QUESTIONNAIRE _________________________________________ 48
APPENDIX B – REFRIGERANT GWP _______________________________________ 50

ET18SCE7080 Next-Generation, Low-GWP Refrigeration Systems
Southern California Edison Page 9 of 51
Emerging Products
FIGURES Figure 1. Survey Stakeholder Groups ............................................ 13
Figure 2. Relative Market Makeup ................................................ 14
Figure 3. Fraction of Refrigerant Leaks by Mass in California 2019 ........................................................................ 15
Figure 4. Stakeholder Feedback about Low-GWP Design Preferences ............................................................... 16
Figure 5. Historical Decay in CO2-Producing Electric Generation
Statewide in California ................................................ 30
Figure 6. EER By Climate Zone, System Refrigerant, and Heat Rejection – Air Cooled Types ....................................... 32
Figure 6. EER By Climate Zone, System Refrigerant, and Heat
Rejection – Water-Cooled Types ................................... 33
Figure 8. Current Market Makeup in 2020 ...................................... 35
Figure 9. Market Composition Projection – California Statewide ........ 37
Figure 10. Market Composition Projection – SCE Service Territory ................................................................... 38
Figure 11. Refrigerant Market Share – California Statewide ............ 39
Figure 12. Refrigerant Market Share – SCE Service Territory .......... 40
Figure 13. Total Equivalent Emissions (MTCO2-e) – California Statewide Projection ................................................... 41
Figure 14. Total Equivalent Emissions (MTCO2-e) – SCE Service Territory Projection..................................................... 42
Figure 15. Impact of Assumptions on Direct Emissions .................... 44
Figure 16. Impact of Assumptions on INDIRECT EMISSIONS............ 45
Figure 17. Impact of Assumptions on Total Equivalent Warming Impact (TEWI) ........................................................... 46
Figure 18. Impact of Assumptions on Year of CO2 Reduction Goal Attainment ......................................................... 47

ET18SCE7080 Next-Generation, Low-GWP Refrigeration Systems
Southern California Edison Page 10 of 51
Emerging Products
TABLES Table 1. Gap Analysis Summary of Modeling Options ..................... 25
Table 2. System EER by Climate Zone, System Refrigerant, and Heat Rejection ........................................................... 31
Table 3. Sensitivity Testing of Variables and Outcomes ................... 43
Table 4: Refrigerant Global Warming Potential Summary................. 50
ET18SCE7080 Next-Generation, Low-GWP Refrigeration Systems
Southern California Edison Page 11 of 51
Emerging Products
REGULATORY POLICY BACKGROUND These California Air Resources Board (CARB policies currently provide the basis of the
California regulatory environment, and are major driving forces toward shaping the landscape of choices stakeholders face in the state’s commercial refrigeration market:
1. New and retrofit supermarket systems were prevented from using some of the
most common HFC refrigerants, beginning in 2019. The “California Significant New Alternatives Policy (SNAP)” regulations3 prohibited the use of R-404a, R-407b, R-507a, and other less-common refrigerants on a more aggressive timetable than Federal EPA regulations.
2. New commercial refrigeration facilities (with charges of more than 50 lbs.) will be required to use refrigerants with GWPs of 150 or less, beginning in 2022.
3. Existing commercial refrigeration facilities – food retailers with more than 20
stores that have more than 50 lbs. of refrigerant will, by 2026, need to:
a. Achieve a weighted average GWP below 2,500; or
b. Lower their portfolio’s GWP by at least 25%.
And by 2030, all food retailers will need to:
a. Achieve a weighted average GWP below 1,400; or
b. Lower their portfolio’s GWP by at least 55%.
4. CARB and the CPUC are cooperating to recognize parallel policy objectives in EE as well as in GHG reduction efforts. To date, this has been limited to the CPUC recognizing the equivalent GHG reductions of HFC emissions in calculating avoided costs used to evaluate EE costs and benefits. However, this is a work in progress,
and it has not yet been used to incentivize refrigerant retrofits through EE programs or to evaluate program impacts.
CARB established the regulations in #1 above to begin phasing out HFCs in California in
favor of those first passed under the EPA’s SNAP rules.4 #2 and #3 are part of CARB’s regulations passed on December 10, 2020. #4 was ordered by SB 1013 (see below) and to date has resulted in a calculation methodology to assess avoided GHG retrofit costs5.
SB 1383: SHORT-LIVED CLIMATE POLLUTANTS (2016)6 The law committed the state to reduce HFC emissions by 40% by 2030, as compared to a 2013 baseline. It authorized the State Air Resources Board (aka CARB) as the state
agency required to set a plan for achieving these goals, as well as parallel reductions in methane (40%) and black carbon (50%). The law initiated the HFC phaseout plan CARB is now implementing.
3 Final Regulation Order; Prohibitions on Use of Certain Hydrofluorocarbons in Stationary Refrigeration and
Foam End-Uses California Code of Regulations, Title 17, Division 3, Chapter 1, Subchapter 10 Climate Change,
Article 4.
4 https://www.epa.gov/snap/overview-snap
5 CPUC Avoided Costs, 2021 Refrigerant Calculator. https://www.cpuc.ca.gov/general.aspx?id=5267
6 SB-1383 Short-lived climate pollutants: methane emissions: dairy and livestock: organic waste: landfills.

ET18SCE7080 Next-Generation, Low-GWP Refrigeration Systems
Southern California Edison Page 12 of 51
Emerging Products
SB 1013: FLUORINATED REFRIGERANTS (CALIFORNIA COOLING
ACT, 2018)7
SB 1013 (Chapter 375, Statutes of 2018) established the Fluorinated Gases Emission Reduction Incentive Program (FRIP), to be administered by the CARB to promote the adoption of new refrigerant technologies to achieve short- and long-term climate
benefits, EE, and other co-benefits, as specified.8 This bill also required the CPUC to consider developing a strategy for including low-GWP refrigerants in equipment funded by the EE programs it oversees, resulting in a way to quantify GHG reductions related to refrigerant leakage and retrofits (#3 above).
7 SB-1013 Fluorinated refrigerants
8 CARB, F-gas Reduction Incentive Program.
ET18SCE7080 Next-Generation, Low-GWP Refrigeration Systems
Southern California Edison Page 13 of 51
Emerging Products
STAKEHOLDER INTERVIEWS The project team developed an open-ended questionnaire to reach out to stakeholders in
the commercial refrigeration market. The purpose of the survey was two-fold. First, it gathered general feedback on the market environment and response to refrigeration regulations, and trends likely to impact upcoming design decisions.
Secondly, it collected input on how energy modeling tools were used in the commercial refrigeration design process, and interest in new or different tools to aid the store development process.
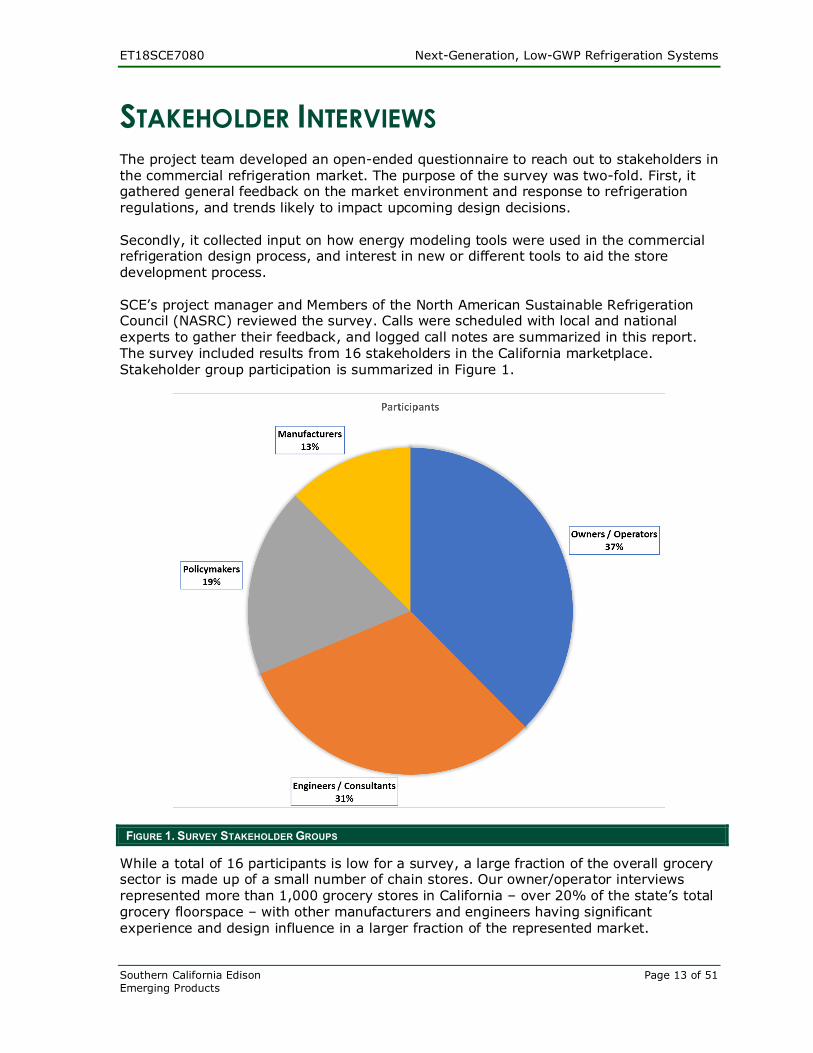
SCE’s project manager and Members of the North American Sustainable Refrigeration Council (NASRC) reviewed the survey. Calls were scheduled with local and national experts to gather their feedback, and logged call notes are summarized in this report. The survey included results from 16 stakeholders in the California marketplace.
Stakeholder group participation is summarized in Figure 1.
FIGURE 1. SURVEY STAKEHOLDER GROUPS
While a total of 16 participants is low for a survey, a large fraction of the overall grocery sector is made up of a small number of chain stores. Our owner/operator interviews represented more than 1,000 grocery stores in California – over 20% of the state’s total grocery floorspace – with other manufacturers and engineers having significant
experience and design influence in a larger fraction of the represented market.

ET18SCE7080 Next-Generation, Low-GWP Refrigeration Systems
Southern California Edison Page 14 of 51
Emerging Products
EXISTING STORE MAKEUP
We asked survey participants to describe the most common types of refrigeration
systems in California, including store configurations, whether systems were mostly water cooled or air-cooled, and the most common types of refrigerants used. Responses to those questions are listed in Figure 2.
FIGURE 2. RELATIVE MARKET MAKEUP
The existing market can be broadly described as made up of traditional approaches to commercial refrigeration. Most California grocery stores consist of built-up, multiplex (parallel) systems, with air-cooled or water-cooled (evaporative) condensers and traditional HCFC or HFC refrigerants. Respondents indicated a growing penetration of
distributed compressor systems, with some chains relying on them exclusively for new store designs. Single-compressor designs, with a single compressor to meet the loads of each case lineup, are still present (mostly in older store designs).
When discussing existing store refrigerant use, several survey respondents made statements like, “There is still a lot of R-22 out there.” Most indicated that, although there are already regulatory bans on new R-22 systems, the cost of eliminating their use still prevents a complete phaseout. It is widely understood that as the existing supply of
R-22 dwindles, the remaining stock prices will increase, expediting HCFC phaseout for remaining systems. Survey respondents also said a small number of existing stores use R-448a and R-449a
to mitigate their GWP. More information about this increasing trend of retrofitting existing systems with lower-GWP refrigerants is provided in the “Retrofit Trends” section of this report. A small fraction of the existing store base was also reported as using CO2 as a refrigerant. Respondents characterized CO2 use to date as being somewhat “experimental” as a means of getting familiar with these systems’ significantly-different design options, installation procedures, challenges, costs, and benefits. Most CO2 stores were installed during new construction and by larger chains taking a proactive stance toward the market and seeking to gain experience with these systems “before they have to.” CO2 designs to date include simple transcritical systems, as well as those using parallel compression to achieve higher efficiencies. The anecdotal market characterization above is supported by data reported to the 2019 CARB RMP. Under California regulations, entities using high-GWP refrigerants in
Configuration Heat Rejection Refrigerants
Multiplex / Parallel Air-cooled HCFC / HFC
Multiplex / Parallel Water-cooled HCFC / HFC
Distributed compressors Water-cooled HCFC / HFC
Singles Air-cooled HCFC / HFC
Multiplex / Parallel Air-cooled 448 / 449
CO2 TC / CO2 booster Adiabatic CO2
Mo
st c
om
mo
nM
ost
Com
mon
ET18SCE7080 Next-Generation, Low-GWP Refrigeration Systems
Southern California Edison Page 15 of 51
Emerging Products
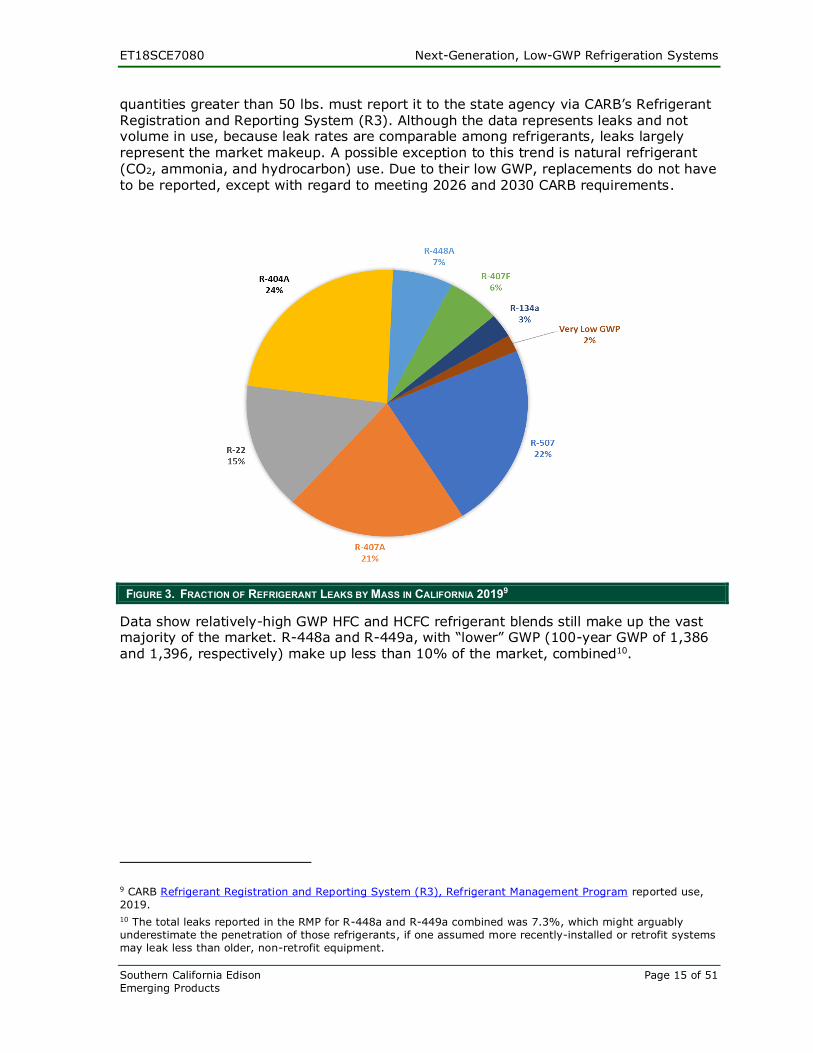
quantities greater than 50 lbs. must report it to the state agency via CARB’s Refrigerant Registration and Reporting System (R3). Although the data represents leaks and not volume in use, because leak rates are comparable among refrigerants, leaks largely represent the market makeup. A possible exception to this trend is natural refrigerant
(CO2, ammonia, and hydrocarbon) use. Due to their low GWP, replacements do not have to be reported, except with regard to meeting 2026 and 2030 CARB requirements.
FIGURE 3. FRACTION OF REFRIGERANT LEAKS BY MASS IN CALIFORNIA 20199
Data show relatively-high GWP HFC and HCFC refrigerant blends still make up the vast majority of the market. R-448a and R-449a, with “lower” GWP (100-year GWP of 1,386
and 1,396, respectively) make up less than 10% of the market, combined10.
9 CARB Refrigerant Registration and Reporting System (R3), Refrigerant Management Program reported use,
2019.
10 The total leaks reported in the RMP for R-448a and R-449a combined was 7.3%, which might arguably
underestimate the penetration of those refrigerants, if one assumed more recently-installed or retrofit systems
may leak less than older, non-retrofit equipment.

ET18SCE7080 Next-Generation, Low-GWP Refrigeration Systems
Southern California Edison Page 16 of 51
Emerging Products
NEW CONSTRUCTION TRENDS Survey participants were consistent in their feedback about new construction
supermarket refrigeration system trends. They all reported that it was primarily larger chains that are testing natural refrigerants to gain experience with the available technologies, with two chains stating all their new stores would be designed for natural refrigerants only. The majority of the market, however, tends to be influenced by regulation, so natural refrigerant adoption will be relatively low until it is regulated. A variety of new system types were mentioned in the interviews. Most participants pointed toward CO2 transcritical as a market leader, following progress and large-scale adoption in European new construction (shown as CO2 Transcritical in the figure below). Some also tried other options, including distributed propane and cascade systems with ammonia/CO2. Others focus primarily on options for R-448 and R-449, which can be legally used in California new construction until January 1, 2022.
FIGURE 4. STAKEHOLDER FEEDBACK ABOUT LOW-GWP DESIGN PREFERENCES
However, new store construction makeup will have little impact on overall GHG emissions in the near term. Survey respondents generally reported growth and new store construction rates to be low, with some describing the existing real estate market for grocery to be “overbuilt.” Some characterized expected growth rates of about 1%
per year, with larger regional chains planning on adding “one or two stores per year” and larger chains indicating “several” per year.11 As described in the “Market Impacts” section of this report, if this turnover continues, it will have a smaller impact on California’s GHG emission levels than retrofit trends will.
11 Interviews were completed prior to the onset of the COVID-19 pandemic which, in its first nine months,
increased sales at grocery stores in the short term. However, the market was still adapting to consumer desire
for safe delivery options. Future growth of traditional store designs remains uncertain, and could be supplanted
by other retail frameworks. Amazon’s purchase of Whole Foods, in particular, has fueled uncertainty in the
market among other chains, and was mentioned more than once by survey respondents.

ET18SCE7080 Next-Generation, Low-GWP Refrigeration Systems
Southern California Edison Page 17 of 51
Emerging Products
RETROFIT TRENDS This section addresses retrofit scenarios, defined here as projects modifying existing
systems without fully replacing them (not “gut rehab” or full refrigerant system and case replacements). Survey respondents said some owners and operators retrofit existing stores with lower-GWP options. Some of the same regional and national chains planning to build new stores with low-GWP options are doing retrofits, to get experience with the process in advance. Others are reportedly waiting until CARB regulations require retrofits. Although these retrofits reduce direct (and sometimes indirect) GHG emissions, they come at a cost that may be difficult for retailers to justify in an extremely competitive landscape. Owners and operators who retrofit their stores to reduce GHG emissions mostly used R-448a and R-449a as primary options – they provide comparable operating pressures and temperatures to serve as practical replacements for R-404a, R407a, R-507, and R-22. Often, these retrofits can be made at relatively low cost12, requiring filter, dryer, operating setpoint, and sometimes lubricant changes. However, for some systems, there may be complications such as decreased capacity, compressor compatibility issues, line sizing, and other factors requiring pre-retrofit engineering evaluations. Replacing existing HFC systems with natural refrigerants is not practical unless the compressors, heat rejection, and cases are also completely replaced. This is costly, at hundreds of thousands to more than a million dollars per store. Unless a chain is
conducting an overall “gut rehab” of an older store location, this type of investment is seldom considered for GHG reduction alone. Survey respondents indicated regulation will largely drive retrofits designed to lower GHG impacts. In the highly-competitive grocery sector, few stores or chains will venture into lower-GWP options without powerful incentives to ease market adoption.
12 $45 per pound, per CARB FRIP Final Guidelines and Solicitation Manual Fiscal Year 2019-2020 Appropriation
August 7, 2020. ww2.arb.ca.gov/sites/default/files/2020-11/FRIP Program Guidelines and Solicitation Manual
FINAL.pdf
ET18SCE7080 Next-Generation, Low-GWP Refrigeration Systems
Southern California Edison Page 18 of 51
Emerging Products
MODELING TOOL NEEDS ASSESSMENT We also used the stakeholder survey to explore awareness of, and needs for, existing
tools to model commercial refrigeration system energy use. The assessment included two primary activities. The first was to reach out to Subject Matter Experts (SMEs) for direct feedback on the state of industry tools, with emphasis on needs for low-GWP refrigerants. The second for in-house energy modeling experts to review existing tools,
clearly delineate available options, and evaluate them against stakeholder priorities. Elements of the survey included questions on:
• The extent of stakeholder refrigeration modeling tool knowledge and use
• Existing tools and uses • Anticipated modeling needs
STAKEHOLDER FEEDBACK ON MODELING TOOL NEEDS Stakeholders reported little modeling tool use. Reasons varied, and are best characterized by user group. With one exception, most system designers said they rarely use existing modeling tools, their design processes lack budget for optimization, and design decisions tend to rely more on peak conditions than on average use. Owners and operators typically do not have time for detailed modeling activities, trusting their design engineers to fulfill these needs. Manufacturers usually rely on their own test data to determine system performance and needs, with little need for modeling approaches. Policymakers tended to value system modeling as necessary for developing standards and making informed decisions, and indicated a need to understand the EE and refrigerant emission factors that arise in policy decisions. However, none of our contacts
had direct experience with modeling tools, instead relying on other industry experts to provide the analyses required to weigh these factors. Survey participants said they desired these refrigeration modeling tool qualities: • Vendor-neutral tools
Respondents said they would be less inclined to trust results from specific equipment vendors’ tools as being unbiased toward particular approaches or refrigerants.
• Level playing field They would want to compare systems against a clear, established, common baseline.
• All available new fixture and system design options included Some said a refrigerant option comparison tool would not be useful without visibility to all the system design options they want to consider, such as various natural refrigerants (including CO2 transcritical systems, which have unique modeling challenges) – and tools should have specific options and technologies (for example,
CO2 transcritical models that compare parallel compression systems as well as those with and without multi-ejector technologies).
ET18SCE7080 Next-Generation, Low-GWP Refrigeration Systems
Southern California Edison Page 19 of 51
Emerging Products
• Ease of use Given the time limitations and lack of existing tool use the design engineers noted, this criterium may be the most important for gaining real market adoption.
• Reliability/trustworthiness Survey participants said results should be reliable and trustworthy, perhaps vetted or developed by an independent party. If the results were seen as inconsistent or otherwise “didn’t add up,” skepticism would render them untrustworthy.
One survey respondent indicated in grocery applications, interactive effects are important and should be included. For example, there is a direct relation between refrigerated case infiltration/exfiltration and HVAC energy use – in particular, the impact of store humidity on case energy loads, and the relative inefficiency of using
refrigeration systems instead of HVAC space cooling systems for dehumidification.
REGULATORY NEEDS
In discussing modeling tools with regulators, a somewhat different set of uses and priorities arose which could drive tool development. While this group made up a small fraction of our interviews, their needs were distinct, and it could be impossible to develop policies without better tools. Specifically in California, there are needs for:
• Title 24 compliance analysis
The impacts of California’s Title 24 EE code is typically evaluated using energy modeling software to estimate proposed new building design energy savings as
compared with a baseline store that just meets the T-24 code baseline. Without new tools to do the same for the grocery sector, there is a gap in the ability to compare design options and their impacts on energy use and overall GHG emissions.
• GWP analysis Without tools to model new system design energy use, it leaves regulators in the dark in terms of weighting the direct and indirect grocery store emissions.
• Incentive determination Under the CPUC’s direction, utilities offer incentives for EE gains relative to “base case” code-compliant store designs. Without tools to estimate the gamut of available design options, savings cannot be determined, and better performance cannot be
incentivized. This issue is further complicated as the CPUC begins to value direct refrigerant GHG emissions as well as indirect GHG contributions from energy use under the same avoided-cost metrics.
NEEDS ASSESSMENT SUMMARY
Our interviews show some contradiction in current modeling tool use and projected needs to assist California supermarket EE design. While existing tool use is reportedly
low, there is an interest in future tools, particularly by (and in support of) regulators and utilities. There are many desired qualities: a preferred tool would address numerous emerging technical approaches to grocery store refrigeration, and be independent, verified/verifiable, and easy to use, while capturing complex interactions between HVAC
and refrigeration systems. Some existing tools have a few of these qualities, as described in the next section.
ET18SCE7080 Next-Generation, Low-GWP Refrigeration Systems
Southern California Edison Page 20 of 51
Emerging Products
EXISTING TOOL GAP ANALYSIS The project team conducted an analysis to identify existing modeling tools’ capabilities
and technical gaps. We found only four widely-available modeling tools capable of analyzing commercial refrigeration; two are comprehensive, whole-building energy simulation models (EnergyPlus and DOE2.2R), while the other two are refrigerant system energy simulation engines (Genetron and Pack Calculation Pro), which do not
model other building components such as HVAC and space conditions. Each met the basic criterium of modeling commercial refrigeration systems typical in U.S. supermarkets, including walk-ins, refrigerated display cases, single- and multiple-compressor racks, heat rejection systems, and other ancillary systems. While they all
include these basic capabilities, they differ greatly in other aspects. None of the tools met all the criteria our survey participants requested. The “system-only” tools could model most system configurations, but not interactive effects with
HVAC systems or indoor store conditions. While the whole-building tools could model the interactive effects, they had limited system configuration options as well as a steeper learning curve. The whole-building models required a vast number of inputs, as well as knowledge of refrigeration, HVAC, building construction, and details of the individual simulation models themselves. Without a full understanding of the specific implications
of some variable settings, what may be viewed as small input errors could have large effects on model results. None of the tools could be described as “easy to use.” These are some of the primary characteristics we sought:
• Ability to model natural refrigerant options, including the following system types:
o CO2 transcritical o CO2 cascades o CO2 parallel compression
o Ammonia cascade systems (including NH3/CO2 cascades) o Hydrocarbon refrigerants, such as propane o HFOs and HFO blends, including R-448a and R-449a
• Ability to model typical existing and baseline equipment:
o Common refrigerants and refrigerant blends used in California today, such as HCFCs and HFCs (and applicable ancillary equipment)
o Code baseline equipment comparisons
• Whole-building or system-only simulation
• Ease of use, including:
o Refrigeration system templates o “Wizards” or quick-development aids
• Ability to accurately represent electricity rates and the impact on operating costs
• Interactive effects, such as relative humidity, case infiltration/exfiltration, case lighting, and interactions between HVAC and refrigeration
• Current version and updates

ET18SCE7080 Next-Generation, Low-GWP Refrigeration Systems
Southern California Edison Page 21 of 51
Emerging Products
We used these criteria to review the individual modeling platforms as described in the next section, with a summary table highlighting a comparison of these key characteristics.
WHOLE-BUILDING ENERGY SIMULATION TOOLS
ENERGYPLUS
EnergyPlus is a whole-building energy simulation program, used primarily to model building loads and energy consumption. The program is free and open source, with development funded by the U.S. Department of Energy’s (DOE) Building Technologies
Office (BTO). The program does not provide an easy method for system-only modeling, and it has no default refrigeration system templates. However, the standard installation comes with
the following data sets: 12 refrigerant-saturated and superheat fluid properties; 357 refrigeration case components; and 1,105 refrigeration compressor components and their associated power and capacity curves.
EnergyPlus offers two refrigeration modeling options: 1) a simplified model, combining compressor(s) and condenser into a single refrigeration compressor rack object; or 2) a more detailed component approach. OpenStudio has incorporated EnergyPlus refrigerant modeling into a user-friendly drag-
and-drop interface, and it allows for cascading systems as well as CO2 transcritical and NH3 refrigerants. Additional fluid properties can be defined beyond what is included in the EnergyPlus datasets. To use this program proficiently, a relatively large amount of training is required, including careful diligence and quality control to monitor the many
inputs required to run a model. According to experienced users, EnergyPlus has “almost all the functionality needed for refrigerant modeling.” However, some of the inputs are nonintuitive, or don't follow
typical design values and require side calculations to derive from design values. The hourly tool accommodates sophisticated rate treatment, and can use rates from the eQUEST rate library13 to reflect peak user-defined time-of-day periods, seasons, demand
charges, block rates, and time-of-use rates.
ENERGY PLUS SUMMARY
Pros: This program models HVAC/refrigeration interactive effects, models CO2 transcritical systems, is under continuous improvement, is independent of commercial influence toward specific technologies, and models compressor performance and individual fixtures. It includes a sophisticated electricity rate treatment.
Cons: The program has a steep learning curve, is difficult to use, is not focused on refrigeration/grocery per se, and has no refrigeration system templates.
13 eQUEST is a free building simulation package based on the DOE 2.2 engine described below.

ET18SCE7080 Next-Generation, Low-GWP Refrigeration Systems
Southern California Edison Page 22 of 51
Emerging Products
DOE 2.2R
DOE 2.2R is a whole-building energy analysis program, and companion program to eQUEST (which also offers simple refrigeration component subsystems). DOE 2.2R
allows users build up systems from individual components connected in one or more systems, and the program estimates energy use and costs for all types of buildings. The program is free and available online. It does not readily accommodate system-only modeling, but has some default refrigeration system templates in example files. The hourly tool accommodates sophisticated rate treatment, and can use rates from the eQUEST rate library to reflect peak user-defined time-of-day periods, seasons, demand charges, block rates, and time-of-use rates. While eQUEST is widely used, DOE 2.2R is not well documented or widely adopted. eQUEST is built on the DOE2 simulation engine, and allows the creation of model wizards for building envelopes, lighting, and HVAC, including creating parametric runs, EE measures, and a graphical result display module. eQUEST models can be developed to establish basic building layouts and HVAC systems, which can then be integrated into DOE 2.2R for developing commercial refrigeration options. However, creating and editing those component-based refrigeration systems must be done in a text editor by following input variable guidelines to directly prepare input files. Since the documentation is sparse, it can be difficult to create and troubleshoot models.
The platform currently cannot model CO2 transcritical systems, although some of our interview participants indicated this functionality may be added in future updates. The standard installation comes with fluid property data for 15 refrigerants. The most recent
publicly-available version was released in July of 201714. Component models can be created to model ammonia refrigeration systems, cascade systems, and those using secondary cooling fluids. A large amount of training is required to become familiar with the program inputs and capabilities, and to generate meaningful results.
DOE 2.2R SUMMARY
Pros: DOE2.2R models HVAC/refrigeration interactive effects, is independent of
commercial influence toward specific technologies, and models compressor performance and individual fixture types. It includes a sophisticated electricity rate treatment.
Cons: The program lacks CO2 transcritical models, has a steep learning curve, is difficult to use, is not well documented, and its future development is uncertain.
14 The eQUEST/DOE 2.2 and DOE 2.2R are privately developed and have no fixed source of funding, and
continuous improvements are uncertain.
ET18SCE7080 Next-Generation, Low-GWP Refrigeration Systems
Southern California Edison Page 23 of 51
Emerging Products
SYSTEM-LEVEL ENERGY SIMULATION TOOLS
GENETRON PROPERTIES
Genetron Properties is a system-level modeling tool available free from Honeywell, who manufactures and distributes refrigerants. It allows the user to choose from 11 pre-defined system types, including CO2 transcritical, CO2 booster, cascade systems,
combined MT and LT with heat exchange (liquid sub-cooling), as well as a large variety of refrigerants, including ammonia, propane, and R-448a (which Honeywell manufactures under the brand name Solstice N40). It does not include R-449a (manufactured by Chemours under the brand name Opteon XP40).
The tool is in some ways simpler than others, defaulting to a single set of inputs (such as design conditions) for its most simple application. The user can create outputs to estimate annual performance in “multicase” mode, where the tool accepts a variety of input conditions to model. This function can be used to create annual performance runs,
although significant post-processing is needed to convert the multicase runs to a bin-type analysis to approximate annual performance15. There is no economic analysis included in the tool.
GENETRON PROPERTIES SUMMARY
Pros: The tool includes transcritical and booster CO2 systems, and R-448a.
Cons: It does not do annual simulations or economics, and it is non-independent (it is offered by a refrigerant manufacturer). It does not model fixtures and loads explicitly. Updates are infrequent.
PACK CALCULATION PRO (PACK CALC PRO)
Pack Calc Pro is a system-only modeling program using specific compressor model and manufacturer performance data to calculate refrigeration system and heat pump annual
energy usage. The program has a free version in metric units, and an annual subscription option for I-P units and an expanded set of capabilities (offered for €199/$266.23 at the time of this report). Pack Calc Pro was developed by two thermodynamics and energy technology engineers in Denmark.
The program has default templates for 14 refrigerant cycles, including transcritical booster and cascade systems. The user can select 13 available refrigerant choices, including NH3, and the software recently included R-448a and R-449a compressor selections16. Secondary coolant distribution and refrigerated fixtures are not explicitly
modeled – the user sets only a load profile for the system to meet. The program has a large compressor performance database, with data from five major manufacturers.
15 In a bin analysis, a simulation is done for a particular set of inputs, and the results are extrapolated to the
number of hours per year those conditions would occur. Typically, outside air temperature is used for the
varying condition, although bins can be created using wet bulb temperatures (for analyzing water-cooled
systems) or other variables.
16 R-448a and R-449a performance is estimated, as these system types were made available after our analysis
was complete.
ET18SCE7080 Next-Generation, Low-GWP Refrigeration Systems
Southern California Edison Page 24 of 51
Emerging Products
Overall, the program requires a relatively short amount of time to model basic system types and view the results. Pack Calc Pro includes annual weather data files from around the world, including 21
representative California cities. It includes a rudimentary economic analysis, with simplified assumptions for energy costs (a single $/kWh can be set at a time). Updates are frequent – at the time of this report, the latest version update was in April of 2021.
PACK CALC PRO SUMMARY
Pros: The program can do annual simulations, and summarizes results for various climates. It is independent of commercial influence toward specific technologies, and
includes multiple CO2 transcritical and booster systems. It is frequently updated.
Cons: It does not explicitly model fixtures and loads. A system license is required to access full functionality.
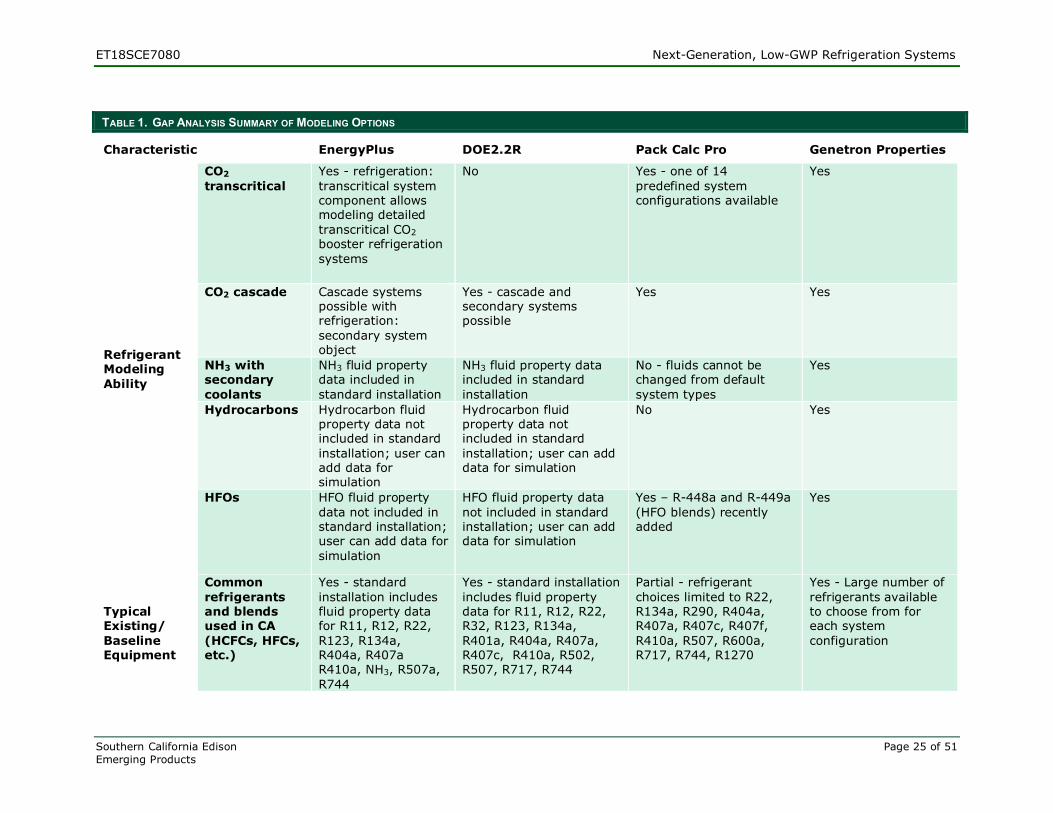
The primary features for these four refrigeration modeling options are summarized in the following table.
ET18SCE7080 Next-Generation, Low-GWP Refrigeration Systems
Southern California Edison Page 25 of 51
Emerging Products
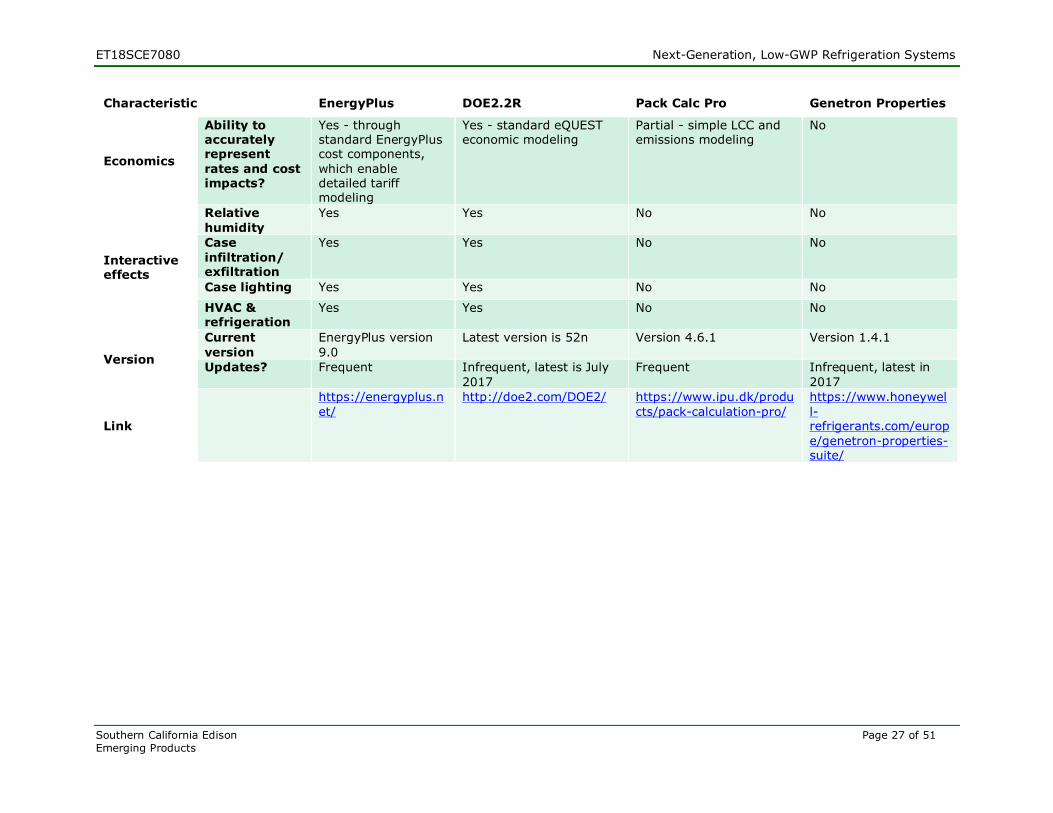
TABLE 1. GAP ANALYSIS SUMMARY OF MODELING OPTIONS
Characteristic EnergyPlus DOE2.2R Pack Calc Pro Genetron Properties
Refrigerant Modeling
Ability
CO2
transcritical
Yes - refrigeration:
transcritical system component allows modeling detailed
transcritical CO2 booster refrigeration
systems
No Yes - one of 14
predefined system configurations available
Yes
CO2 cascade Cascade systems possible with refrigeration:
secondary system object
Yes - cascade and secondary systems possible
Yes Yes
NH3 with secondary
coolants
NH3 fluid property data included in
standard installation
NH3 fluid property data included in standard
installation
No - fluids cannot be changed from default
system types
Yes
Hydrocarbons Hydrocarbon fluid property data not included in standard
installation; user can add data for simulation
Hydrocarbon fluid property data not included in standard
installation; user can add data for simulation
No Yes
HFOs HFO fluid property
data not included in standard installation; user can add data for
simulation
HFO fluid property data
not included in standard installation; user can add data for simulation
Yes – R-448a and R-449a
(HFO blends) recently added
Yes
Typical Existing/
Baseline Equipment
Common
refrigerants and blends used in CA
(HCFCs, HFCs, etc.)
Yes - standard
installation includes fluid property data for R11, R12, R22,
R123, R134a, R404a, R407a R410a, NH3, R507a,
R744
Yes - standard installation
includes fluid property data for R11, R12, R22, R32, R123, R134a,
R401a, R404a, R407a, R407c, R410a, R502, R507, R717, R744
Partial - refrigerant
choices limited to R22, R134a, R290, R404a, R407a, R407c, R407f,
R410a, R507, R600a, R717, R744, R1270
Yes - Large number of
refrigerants available to choose from for each system
configuration

ET18SCE7080 Next-Generation, Low-GWP Refrigeration Systems
Southern California Edison Page 26 of 51
Emerging Products
Characteristic EnergyPlus DOE2.2R Pack Calc Pro Genetron Properties
Code baseline equipment comparisons
Not built in, but can be modeled
Not built in, but can be modeled
No No
Scope
Whole building?
Yes Yes No No
System only? No No Yes, with default load
profiles
Yes - no annual
simulation (sizing only)
Modeling Time
Templates? No default
templates; user can generate templates
and copy them into different projects with minimal building
model connections
No default templates Yes - available system
configurations: One stage
One-stage transcritical One-stage transcritical, parallel compression
Two one stage Two one stage, common condenser
Cascade Cascade, transcritical
Cascade, CO2 Two-stage transcritical Two-stage open
intercooler Two-stage liquid injection
Two-stage transcritical, parallel compression Two-stage closed
intercooler Heat pump, subcritical
Yes - available system
configurations: Simplified basic cycle
Basic cycle Cycle with suction line/liquid line heat
exchanger Combined cycle: medium and low
temperature Cascade cycle
Transcritical cycle Cycle with liquid injection
Two-stage cycle with heat exchanger
Multi-stage cycle with flash tank Pumped CO2
Transcritical booster
Wizards/ Quick
Development Aids?
Comes with 12 refrigerant
properties, 357 refrigerated case components, 1,105
compressor components
No wizard for refrigeration systems
Yes Yes
ET18SCE7080 Next-Generation, Low-GWP Refrigeration Systems
Southern California Edison Page 27 of 51
Emerging Products
Characteristic EnergyPlus DOE2.2R Pack Calc Pro Genetron Properties
Economics
Ability to accurately represent
rates and cost impacts?
Yes - through standard EnergyPlus cost components,
which enable detailed tariff modeling
Yes - standard eQUEST economic modeling
Partial - simple LCC and emissions modeling
No
Interactive effects
Relative
humidity
Yes Yes No No
Case
infiltration/ exfiltration
Yes Yes No No
Case lighting Yes Yes No No
HVAC & refrigeration
Yes Yes No No
Version
Current
version
EnergyPlus version
9.0
Latest version is 52n Version 4.6.1 Version 1.4.1
Updates? Frequent Infrequent, latest is July
2017
Frequent Infrequent, latest in
2017
Link
https://energyplus.n
et/
http://doe2.com/DOE2/ https://www.ipu.dk/produ
cts/pack-calculation-pro/
https://www.honeywel
l-refrigerants.com/europ
e/genetron-properties-suite/

ET18SCE7080 Next-Generation, Low-GWP Refrigeration Systems
Southern California Edison Page 28 of 51
Emerging Products
CURRENT GAPS IN AVAILABLE MODELING PLATFORMS
The following are desired characteristics that were missing from all the platforms. These
tools undergo periodic updates, and this list represents the best available snapshot at the time of this report. • Easy store prototype model development
All the available options have significant learning curves, which make developing a
single annual energy model for a design option difficult and time consuming. Ideally, there would be an automated wizard that could be used to “drag and drop” store fixtures, compressors, and controls into a whole-building model, including typical layouts, HVAC, and California rate schedules, for analyzing the economic impacts of
various design choices.
• Easy code baseline treatment While code baseline development for other building types has often been automated in
simulation tools, this ability has been lacking for the grocery/supermarket sector.
• R-448a and R-449a These two refrigerants have quickly become popular options in California, and are
relatively new to market. Pac Calc Pro is the only tool that has the ability to model system performance with both of these options (added after our system simulations were complete). It would appear that these options could be incorporated relatively easily be into modeling schema that exist for other HFC refrigerants with similar operating properties.
• Multi-ejectors on CO2 systems Multi-ejectors are an emerging technology for improving parallel compression CO2 transcritical system performance. Their interaction with system performance may require significant adaptation of modeling algorithms, due to the fundamental interactions with CO2 phases and pressures – there are no existing analogous components in HFC or simple transcritical CO2 systems.
MODELING TOOL CONCLUSIONS
While currently no single modeling tool meets the ideal stakeholder criteria, there are
alternatives that meet subsets of the requested features. These are the primary elements stakeholders requested, but are missing from available alternatives: • A simple interface to build typical commercial refrigeration systems that quickly and
accurately simulate all desired options for stakeholder consideration
• A modeling tool that includes the complexity of current system options, as well as the system interactive effects between HVAC equipment and indoor humidity
For our market analysis (covered in the next section), we decided to use Pack Calc Pro as the tool with the capability to simulate the largest set of system options, refrigerants, and climates. Using Pack Calk Pro meant sacrificing the interactive effects with HVAC, but it was deemed the most appropriate selection for the purposes of this study.

ET18SCE7080 Next-Generation, Low-GWP Refrigeration Systems
Southern California Edison Page 29 of 51
Emerging Products
MARKET IMPACTS Our final investigation task was to create an analytical model to simulate energy and
equivalent CO2 emission impacts under multiple technology adoption scenarios. This model estimated the direct impacts of refrigerant emissions due to refrigerant leaks, and due to changes in the systems’ overall EE. This section presents the analysis methods, assumptions, and results.
METHOD The market analysis used a combination of assumptions from various sources to develop a comprehensive picture of the 2020 California grocery market sector. We then projected this base model into the future, using the assumptions detailed in the “Assumptions” section of this report. We used additional market segmentation to isolate SCE’s service territory and report it as a separate study sample. We first characterized the market by approximate floor area in millions of square feet (Msf), baseline energy consumption in annual Gigawatt-hours (GWh), and approximate fraction of system types (refrigerant and cooling). We then used an assumed rate of new store growth and remodel rates to determine the floor area added or remodeled each year. We assumed
the new/remodeled space adopted new code-compliant equipment, based on the year. We also assumed through 2022, most new facilities and major remodels would incorporate low-GWP blends, in accordance with current regulations and predominant practice, using moderately-low GWP HFO blends such as R-448a and R-449a.17 We then assumed that from
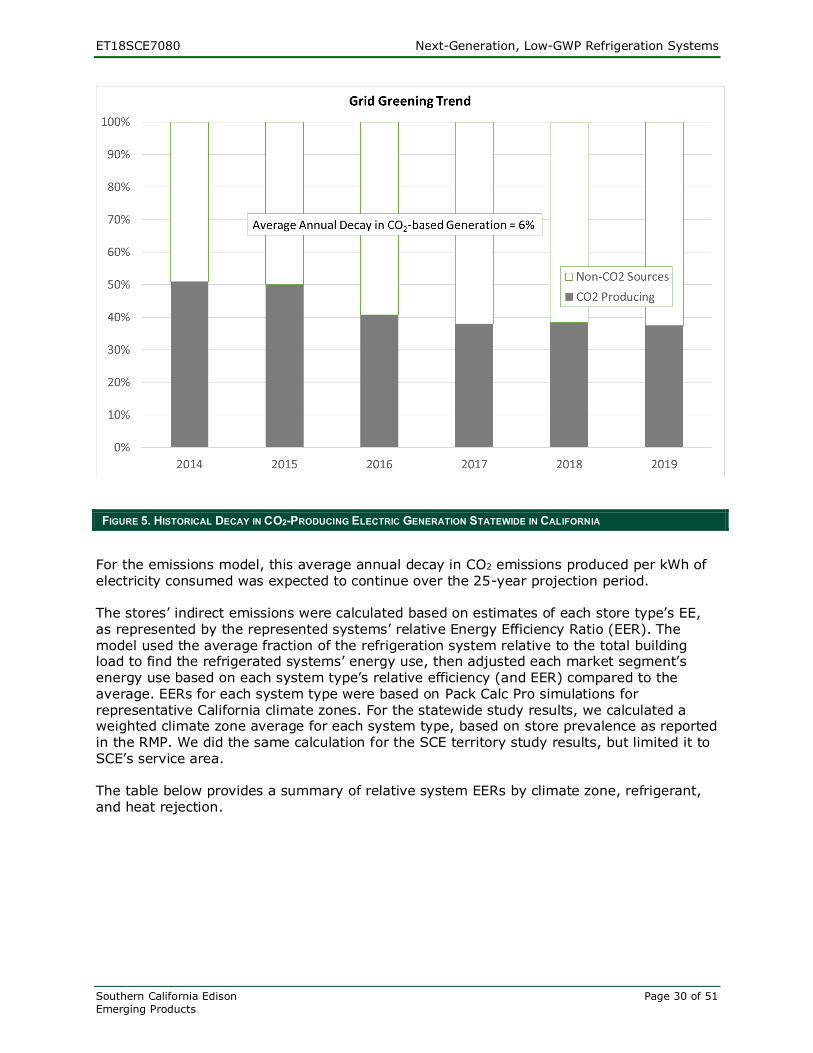
2022 forward, new store designs and end-of-life replacements would use low-GWP refrigerant systems, in alignment with CARB regulations. Direct refrigerant emission impacts were approximated based on estimated system types, typical refrigerant leakage rates, and refrigerant GWP. We used 20-year lifetime GWPs, in line with the CPUC’s Avoided Cost Calculation methods.18 Typical leak rates and refrigerant volumes were used to determine direct emission impacts. We estimated indirect impacts for two scenarios. The first used the current average California power grid CO2 emissions of 0.2279 Metric Tons of CO2 equivalent (MTCO2e) per Megawatt-hour (MWh) of electricity generated19. The second used that same value for 2020, but included a “grid greening” rate to reflect renewable supply growth – specifically, CO2 emission decay over time. Results shown in the tables and graphs below only assume the current CO2-based energy use decay rate is maintained, in alignment with SB 350 goals. A summary of this trend is provided in the following chart showing the average annual decay in equivalent CO2 emissions of 6.0% over the most recent five-year period.
17 Summarized singularly as R-448a, since the properties are so similar.
18 The model actually made it possible to use either 20-year or 100-year GWP ratings. Since we looked at CO2
reduction goals using a baseline defined in the model, the choice of 20-year or 100-year GWP values had little
impact on how soon the 40% reduction target was met. There are some differences in the relative impact of GWP in
these two scenarios when comparing one refrigerant to another. But these differences are dwarfed by the relative
difference between the GWPs of HFCs and the natural refrigerants using either measure.
19 California Air Resources Board, California Climate Investments, Quantification Methodology Emission Factor
Database, November 2019, Values for Average Grid Electricity, per 10/14/2020 release.
ET18SCE7080 Next-Generation, Low-GWP Refrigeration Systems
Southern California Edison Page 30 of 51
Emerging Products
FIGURE 5. HISTORICAL DECAY IN CO2-PRODUCING ELECTRIC GENERATION STATEWIDE IN CALIFORNIA
For the emissions model, this average annual decay in CO2 emissions produced per kWh of
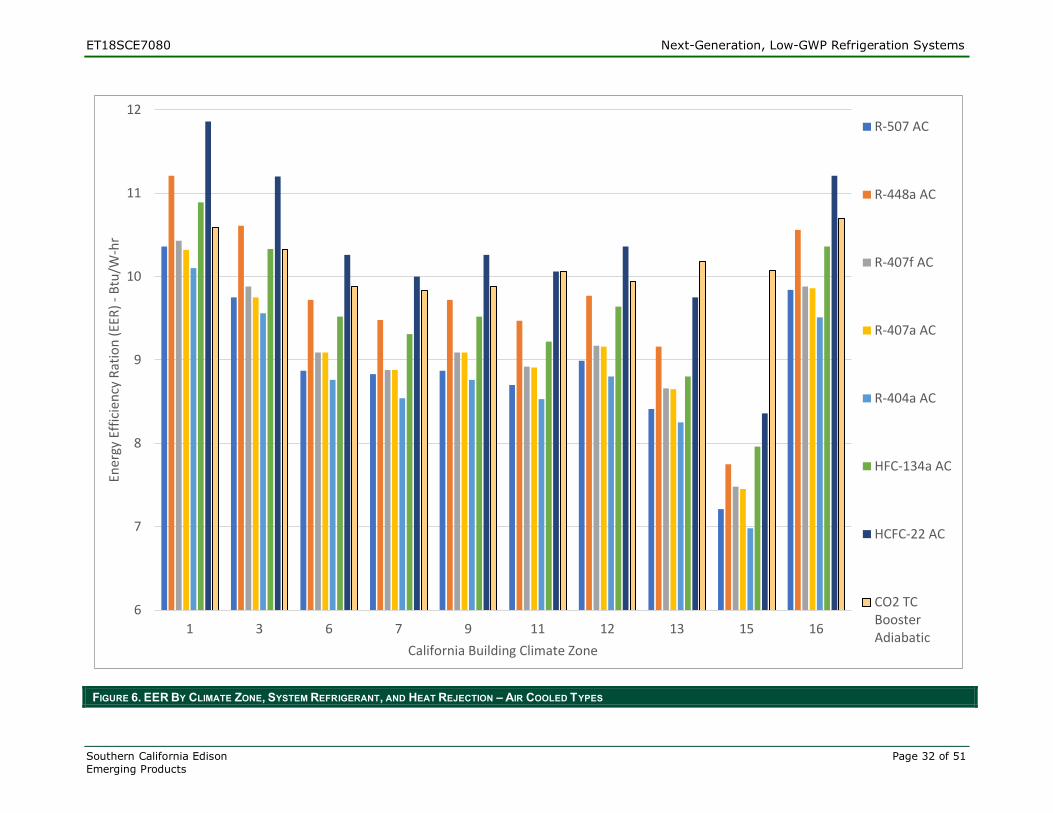
electricity consumed was expected to continue over the 25-year projection period. The stores’ indirect emissions were calculated based on estimates of each store type’s EE, as represented by the represented systems’ relative Energy Efficiency Ratio (EER). The
model used the average fraction of the refrigeration system relative to the total building load to find the refrigerated systems’ energy use, then adjusted each market segment’s energy use based on each system type’s relative efficiency (and EER) compared to the average. EERs for each system type were based on Pack Calc Pro simulations for
representative California climate zones. For the statewide study results, we calculated a weighted climate zone average for each system type, based on store prevalence as reported in the RMP. We did the same calculation for the SCE territory study results, but limited it to SCE’s service area. The table below provides a summary of relative system EERs by climate zone, refrigerant, and heat rejection.

ET18SCE7080 Next-Generation, Low-GWP Refrigeration Systems
Southern California Edison Page 31 of 51
Emerging Products
TABLE 2. SYSTEM EER BY CLIMATE ZONE, SYSTEM REFRIGERANT, AND HEAT REJECTION
EER Climate Zone
Refrigerant/Heat Rejection Type Arcata
San
Francisco Ventura
San
Diego
Los
Angeles
Red Bluff/
Chico
Sacra-
mento Fresno
El
Centro
Mount
Shasta
1 3 6 7 9 11 12 13 15 16
R-507 AC 10.36 9.75 8.87 8.83 8.87 8.70 8.99 8.41 7.21 9.84
R-507 WC 8.94 8.73 8.25 8.18 8.25 8.51 8.56 8.46 8.33 9.06
R-448a AC 11.21 10.61 9.72 9.48 9.72 9.47 9.77 9.16 7.75 10.56
R-448a WC 10.12 9.91 9.39 9.30 9.39 9.65 9.71 9.60 9.44 10.24
R-407f AC 10.43 9.88 9.09 8.88 9.09 8.92 9.17 8.66 7.48 9.88
R-407f WC 9.19 9.02 8.61 8.54 8.61 8.83 8.87 8.79 8.68 9.31
R-407a AC 10.32 9.75 9.09 8.88 9.09 8.91 9.16 8.65 7.45 9.86
R-407a WC 8.87 8.70 8.31 8.25 8.31 8.53 8.57 8.49 8.37 9.32
R-404a AC 10.10 9.56 8.76 8.54 8.76 8.53 8.80 8.25 6.98 9.51
R-404a WC 9.12 8.93 8.46 8.38 8.46 8.70 8.75 8.65 8.50 9.22
NH3/CO2 Evaporative Condenser 10.88 10.83 10.63 10.59 10.63 10.70 10.73 10.67 10.59 10.85
Micro Dist Propane Fluid Cooler 9.11 8.96 8.63 8.58 8.63 8.83 8.86 8.80 8.70 8.98
HFC-134a AC 10.89 10.33 9.52 9.31 9.52 9.22 9.64 8.80 7.96 10.36
HFC-134a WC 9.48 9.30 8.89 8.83 8.89 9.12 9.16 9.08 8.97 9.61
HCFC-22 AC 11.86 11.20 10.26 10.00 10.26 10.06 10.36 9.75 8.36 11.21
HCFC-22 WC 10.39 10.17 9.67 9.59 9.67 9.95 10.00 9.90 9.76 10.54
CO2 TC Booster Adiabatic 10.59 10.33 9.88 9.83 9.88 10.06 9.94 10.18 10.07 10.70
Statewide Weight 0.5% 22.1% 4.2% 9.3% 43.1% 3.2% 16.7% 0.5% 0.5% 0.0%
SCE Weight 0.0% 0.0% 8.1% 0.0% 91.9% 0.0% 0.0% 0.0% 0.0% 0.0%
ET18SCE7080 Next-Generation, Low-GWP Refrigeration Systems
Southern California Edison Page 32 of 51
Emerging Products
FIGURE 6. EER BY CLIMATE ZONE, SYSTEM REFRIGERANT, AND HEAT REJECTION – AIR COOLED TYPES
6
7
8
9
10
11
12
1 3 6 7 9 11 12 13 15 16
Ener
gy E
ffic
ien
cy R
atio
n (
EER
) -
Btu
/W-h
r
California Building Climate Zone
R-507 AC
R-448a AC
R-407f AC
R-407a AC
R-404a AC
HFC-134a AC
HCFC-22 AC
CO2 TCBoosterAdiabatic

ET18SCE7080 Next-Generation, Low-GWP Refrigeration Systems
Southern California Edison Page 33 of 51
Emerging Products
FIGURE 7. EER BY CLIMATE ZONE, SYSTEM REFRIGERANT, AND HEAT REJECTION – WATER-COOLED TYPES
6
7
8
9
10
11
12
1 3 6 7 9 11 12 13 15 16
Ener
gy E
ffic
ien
cy R
atio
n (
EER
) -
Btu
/W-h
r
California Building Climate Zone
R-507 WC
R-448a WC
R-407f WC
R-407a WC
R-404a WC
HFC-134a WC
HCFC-22 WC
NH3/CO2EvaporativeCondenser
Micro DistPropane FluidCooler

ET18SCE7080 Next-Generation, Low-GWP Refrigeration Systems
Southern California Edison Page 34 of 51
Emerging Products
We found the indirect emissions impact by calculating the energy use for each market
segment, using the average EER for that system type (weighted by climate zone) and multiplying the resulting energy use by the emission factor for each year. The indirect and direct equivalent CO2 emissions were then summed to find the Total Equivalent Warming Index (TEWI) in terms of MmCO2e.
ASSUMPTIONS Market impacts were based on the best available assumptions for existing market makeup, and the impact of refrigerant retrofits was applied to that sample over time. The primary data sources and calculation methods are summarized as follows:
1. Commercial sector energy use was based on the California Energy Commission’s (CEC)
2018 demand forecast.20
2. SCE commercial-sector energy use was based on SCE’s Energy Resource Recovery
Account (ERRA) 2020 Forecast of Operations.21
3. Grocery sector energy use was estimated at 8.8% of the total commercial sector, based on the most recent California Commercial End-Use Survey.22
4. Sector consumption data was then converted to estimated grocery sector floor space, using average Energy Use Intensities (EUIs) from multiple sources.23
5. Prevalence of existing refrigerants was extrapolated from 2019 refrigerant leak data from CARB’s Refrigerant Management Database24 and adjusted to include approximate penetration of unlisted refrigerants (CO2, NH3 and hydrocarbons are not required to report due to low GWP).
6. Grocery sector growth was extrapolated using a historical market growth of 1.21%, per the U.S. Department of Agriculture (USDA).
7. Given the expense of very-low-GWP options, and current regulations for California HFC
phaseouts, we assumed existing stores would opt to replace existing refrigerants with allowable “gas-only” retrofit alternatives until retirement, where practical.
8. Penetration of very-low-GWP “natural” options was assumed to occur at the market turnover rate, which we assumed to be 3%, based on industry feedback. We tested the sensitivity of projections to this assumption; this is presented in the “Assumptions and Their Relative Impact on Results” section of this report.
20 California Energy Demand 2018-2030 Revised Forecast, California Energy Commission, 4/19/2018.
21 SCE ERRA 2020 Forecast of Operations, June 2019.
22 2006 California Commercial End-Use Survey (CEUS), 2006. Note: Although this data is dated, the overall fraction
of store energy use is unlikely to have greatly deviated.
23 The final EUI used was from the LBL building performance database, selected for grocery stores in California in
2014. This data is more recent, though in close agreement with other sources for EUIs, such as CEUS (above) and
the U.S. DOE’s Commercial Building Energy Consumption Survey (CBECS, 2012).
24 California Air Resources Board Refrigerant Registration and Reporting System (R3), Refrigerant Leaks by Air
District and Year for 2019, ssl.arb.ca.gov/rmp-r3.

ET18SCE7080 Next-Generation, Low-GWP Refrigeration Systems
Southern California Edison Page 35 of 51
Emerging Products
9. The relatively small amount of low-GWP natural refrigerant stock was estimated based
on a store count from NASRC. Based on industry interviews, we assumed natural refrigerant growth to be divided equally among the three primary market leaders (micro-distributed hydrocarbon, CO2 transcritical, and ammonia/CO2 systems). This distribution is highly speculative; however, very-low-GWP market penetration
assumptions have a small impact on CO2 emission targets.
10. Leak rates were assumed based on historical averages from CARB, and held constant. We tested the sensitivity of the results to leak rate assumptions.
11. R-448a energy performance was modeled as an improvement of 11.2% of the EER compared to R-404a, which has the closets properties relative to other refrigerants.
FIGURE 8. CURRENT MARKET MAKEUP IN 2020
We assumed low-GWP retrofits and growth beyond 2022 to be comprised primarily of three system types:
1. Transcritical CO2 booster systems with adiabatic gas coolers 2. Micro-distributed hydrocarbon refrigerant systems (propane) using fluid coolers 3. Hybrid cascade NH3/CO2 systems with evaporative condensers

ET18SCE7080 Next-Generation, Low-GWP Refrigeration Systems
Southern California Edison Page 36 of 51
Emerging Products
We chose these system types because 1) they reflect the systems currently observed in the
market, as summarized by the Environmental Investigation Agency (EIA)25; and 2) they reflected adoption trends survey participants voiced during their expert interviews.26 Using these assumptions, we constructed a model based on estimated existing building
stock and projected growth/remodel rates, to estimate the prevalence of various system types for the next 25 years. The environmental impacts of that building stock were then estimated in terms of equivalent CO2 emission from direct impacts (refrigerant leakage) and indirect impacts due to electricity consumption.
25 Environmental Investigation Agency, Climate-Friendly Supermarkets online listing:
https://www.climatefriendlysupermarkets.org/map-us.
26 The relative numbers of specific system types within the low-GWP (natural refrigerant) category had no significant
impact on attaining emission reduction goals.

ET18SCE7080 Next-Generation, Low-GWP Refrigeration Systems
Southern California Edison Page 37 of 51
Emerging Products
CURRENT CALIFORNIA BASELINE, AND LOAD-GROWTH FORECASTS Using the data above, we developed a baseline scenario to characterize the current market makeup in terms of approximate system type penetration, refrigerants, and equipment efficiencies. Results of this baseline analysis for California Statewide and
SCE’s service territory are presented below.
FIGURE 9. MARKET COMPOSITION PROJECTION – CALIFORNIA STATEWIDE

ET18SCE7080 Next-Generation, Low-GWP Refrigeration Systems
Southern California Edison Page 38 of 51
Emerging Products
FIGURE 10. MARKET COMPOSITION PROJECTION – SCE SERVICE TERRITORY
ET18SCE7080 Next-Generation, Low-GWP Refrigeration Systems
Southern California Edison Page 39 of 51
Emerging Products
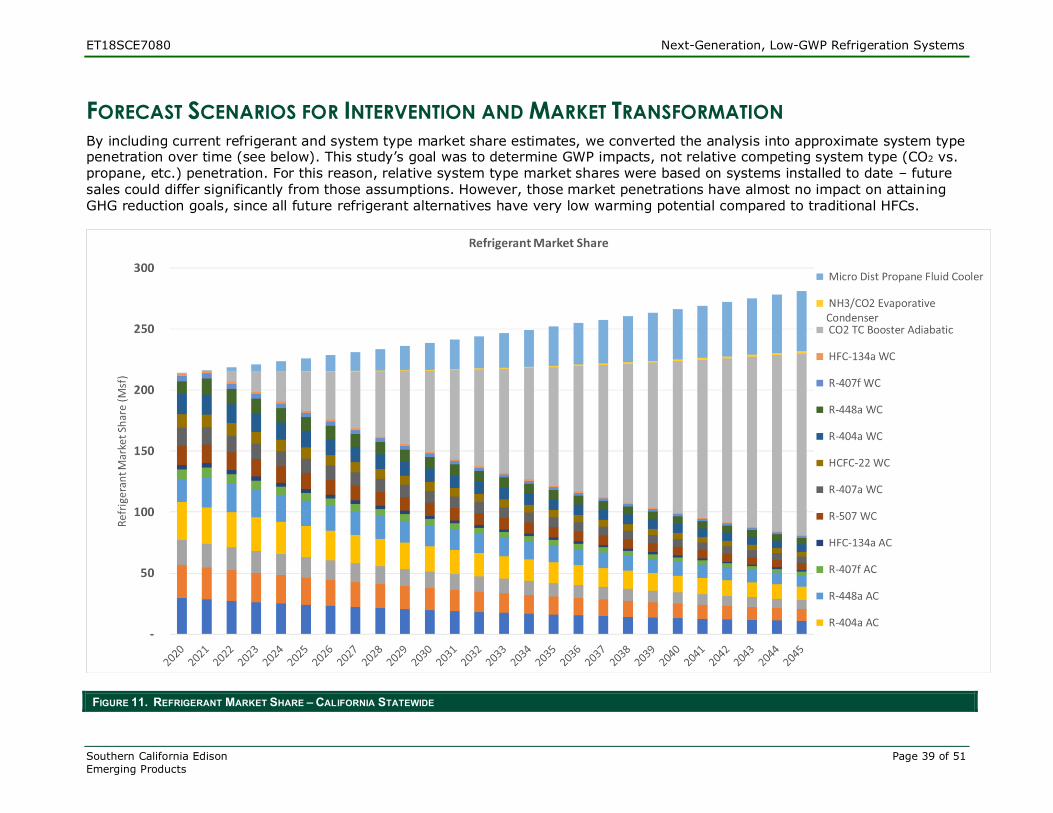
FORECAST SCENARIOS FOR INTERVENTION AND MARKET TRANSFORMATION By including current refrigerant and system type market share estimates, we converted the analysis into approximate system type penetration over time (see below). This study’s goal was to determine GWP impacts, not relative competing system type (CO2 vs. propane, etc.) penetration. For this reason, relative system type market shares were based on systems installed to date – future
sales could differ significantly from those assumptions. However, those market penetrations have almost no impact on attaining GHG reduction goals, since all future refrigerant alternatives have very low warming potential compared to traditional HFCs.
FIGURE 11. REFRIGERANT MARKET SHARE – CALIFORNIA STATEWIDE

ET18SCE7080 Next-Generation, Low-GWP Refrigeration Systems
Southern California Edison Page 40 of 51
Emerging Products
FIGURE 12. REFRIGERANT MARKET SHARE – SCE SERVICE TERRITORY
The charts reflect expected trends due to HFC phaseout, retrofits, and eventual replacement with low-GWP options. As the existing market is turned over through remodels and new store growth, low-GWP alternatives will replace existing refrigerant stock. Since the two models (Statewide and SCE-only) use the same baseline assumptions, the trends are mirrored, only with a smaller stock of store area.

ET18SCE7080 Next-Generation, Low-GWP Refrigeration Systems
Southern California Edison Page 41 of 51
Emerging Products
EQUIVALENT CO2 EMISSIONS
Using the above estimates for refrigerant market penetration, the analysis focused on estimating the direct GWP impacts of refrigerant leaks, and the indirect equivalent CO2 emission impacts due to energy consumption. The results of that model are shown below.
FIGURE 13. TOTAL EQUIVALENT EMISSIONS (MTCO2-E) – CALIFORNIA STATEWIDE PROJECTION

ET18SCE7080 Next-Generation, Low-GWP Refrigeration Systems
Southern California Edison Page 42 of 51
Emerging Products
FIGURE 14. TOTAL EQUIVALENT EMISSIONS (MTCO2-E) – SCE SERVICE TERRITORY PROJECTION
As shown in the graphs above, total emissions, from direct and indirect contributions are projected to decline steadily, due to expected replacement of low-GWP refrigerant systems and overall electricity supply greening. In the next section of this report, we address how quickly emissions may decline if changes are made to the assumptions we made in our analysis.
ET18SCE7080 Next-Generation, Low-GWP Refrigeration Systems
Southern California Edison Page 43 of 51
Emerging Products
MEETING CALIFORNIA’S CO2 EMISSION TARGETS Senate Bill (SB) 1383 requires California to reduce HFC emissions 40% below 2013 levels by 2030. The most recent CARB estimate of the HFC inventory for retail food and
commercial refrigeration totals 3.3 MmTCO2-e in 2018. This aligns well with our estimate of 3.6 MmTCO2-e of emissions for the sector in 2020. Since the policy targets are stated with reference to percent reductions relative to baseline, we took this agreement as significant for our purpose – to determine which assumptions and policy changes would have the
greatest impact on goal attainment. While SB 1383 uses 2013 as a baseline, we did not have a means of connecting our 2020 sector data with the market in 2013. Therefore, our comparison was based on backcasting
our 2020 emission rate to 2013 levels, with historical sector growth targets and assuming a constant refrigerant composition. We then varied the inputs to determine the adoption rates required to meet goals.
With our baseline market impact assumptions, our model predicted a 40% reduction from 2013 direct-equivalent GHG emissions would only be met by 2041. Assuming a greening grid, total direct and indirect emissions would be 40% lower than 2013 total emissions by 2037 (although this does not meet the mandatory requirements).
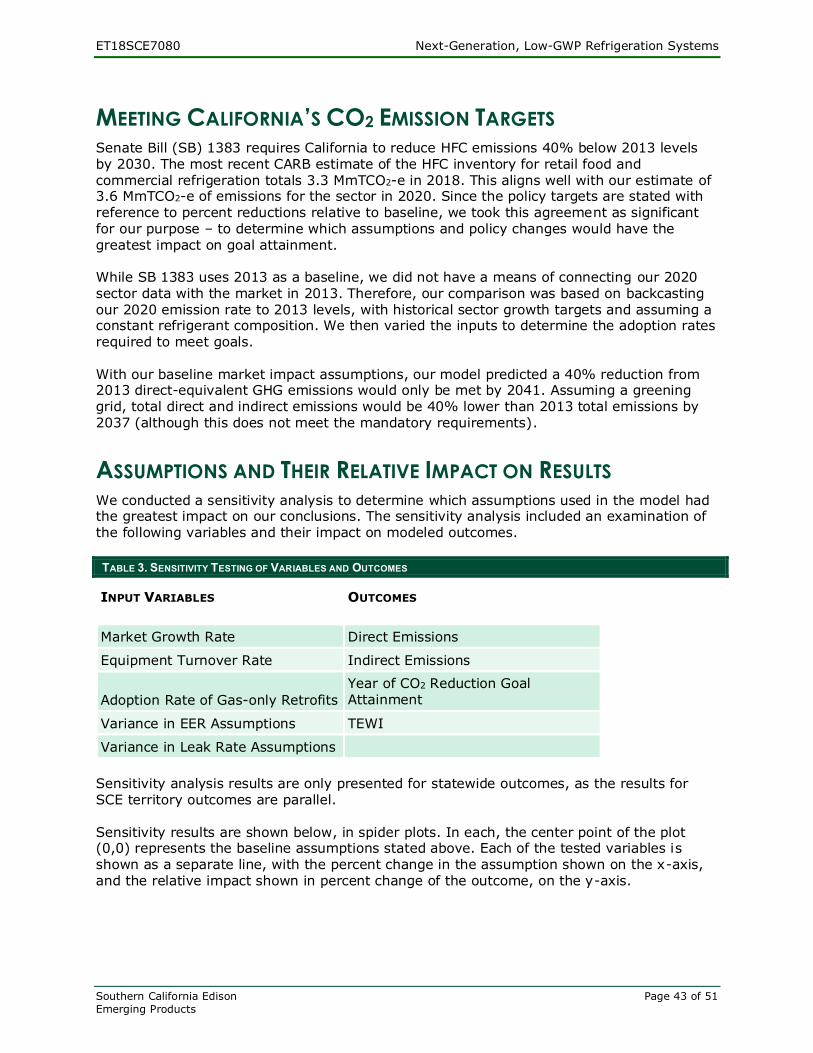
ASSUMPTIONS AND THEIR RELATIVE IMPACT ON RESULTS We conducted a sensitivity analysis to determine which assumptions used in the model had the greatest impact on our conclusions. The sensitivity analysis included an examination of the following variables and their impact on modeled outcomes.
TABLE 3. SENSITIVITY TESTING OF VARIABLES AND OUTCOMES
Sensitivity analysis results are only presented for statewide outcomes, as the results for SCE territory outcomes are parallel. Sensitivity results are shown below, in spider plots. In each, the center point of the plot (0,0) represents the baseline assumptions stated above. Each of the tested variables is shown as a separate line, with the percent change in the assumption shown on the x-axis, and the relative impact shown in percent change of the outcome, on the y-axis.
INPUT VARIABLES OUTCOMES
Market Growth Rate Direct Emissions
Equipment Turnover Rate Indirect Emissions
Adoption Rate of Gas-only Retrofits
Year of CO2 Reduction Goal Attainment
Variance in EER Assumptions TEWI
Variance in Leak Rate Assumptions

ET18SCE7080 Next-Generation, Low-GWP Refrigeration Systems
Southern California Edison Page 44 of 51
Emerging Products
DIRECT EMISSIONS
Figure 14 shows the impact of key assumptions about projected direct GHG emissions, using the sum of 2021-2040 emission estimates. Variance in EER assumptions was omitted here, because it has no impact on direct emissions, only indirect emissions.
FIGURE 15. IMPACT OF ASSUMPTIONS ON DIRECT EMISSIONS
As shown, changes in assumptions for market growth rate and the adoption of gas-only retrofits have little or no impact on direct emission projections. However, equipment turnover and leak rate assumptions have significant impacts on direct emission rates, with changes in leak rate assumptions having the greatest impact.

ET18SCE7080 Next-Generation, Low-GWP Refrigeration Systems
Southern California Edison Page 45 of 51
Emerging Products
INDIRECT EMISSIONS
Figure 15 shows the impact of key assumptions about projected indirect GHG emissions, using the sum of 2021-2040 emission estimates. Variance in the leak rate assumption was omitted here, because it has no impact on indirect emissions, only direct emissions. The rate of gas-only retrofit adoption was included, because that assumption could hypothetically impact indirect emissions – those refrigerants have modest differences in efficiency compared to baseline refrigerant use.
FIGURE 16. IMPACT OF ASSUMPTIONS ON INDIRECT EMISSIONS
The change in EER assumptions has the potential for the most significant change in indirect emissions, with the market growth rate assumption having the second most impact on
estimates. However, it’s important to keep in mind that uncertainties in EER are likely much lower (especially expressed in percent change) than uncertainties in market growth rates. Equipment turnover and the gas-only retrofit adoption rate had little impact on indirect emission estimates.

ET18SCE7080 Next-Generation, Low-GWP Refrigeration Systems
Southern California Edison Page 46 of 51
Emerging Products
TEWI
TEWI is the sum of direct and indirect emissions, and for the sensitivity analysis, we used the sum of the 20-year totals, as above. Figure 16 shows the impact of key assumptions on total equivalent GHG emissions.
FIGURE 17. IMPACT OF ASSUMPTIONS ON TOTAL EQUIVALENT WARMING IMPACT (TEWI)
For the combined TEWI sensitivity, variances in EER, equipment turnover, and leak rate assumptions were most impactful to projections. Market growth rate and gas-only adoption rate assumptions had much smaller impacts on results.
From a policy perspective, it is clear that equipment turnover rate and leak rate are the key variables to have the greatest impact on overall GHG mitigation. While refrigeration system EER assumptions also have a significant impact on indirect emissions and TEWI, major EER changes are difficult to achieve. For example, to have the same impact on TEWI as a 20%
improvement in EER (a major technological achievement in terms of system efficiency) only a 5% leak rate reduction would be required (from the assumed 23.0% to 21.9% annually). Similarly, the same savings could be achieved by increasing equipment turnover from 3% to 3.5% annually.
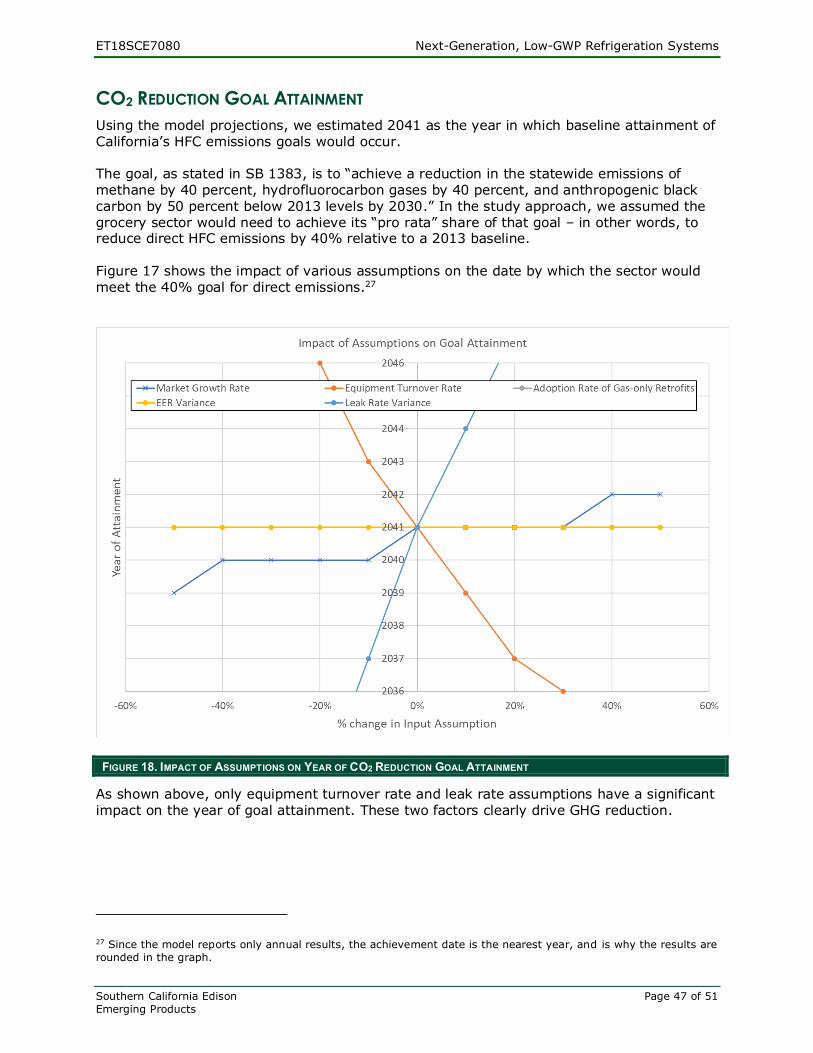
ET18SCE7080 Next-Generation, Low-GWP Refrigeration Systems
Southern California Edison Page 47 of 51
Emerging Products
CO2 REDUCTION GOAL ATTAINMENT
Using the model projections, we estimated 2041 as the year in which baseline attainment of California’s HFC emissions goals would occur. The goal, as stated in SB 1383, is to “achieve a reduction in the statewide emissions of methane by 40 percent, hydrofluorocarbon gases by 40 percent, and anthropogenic black carbon by 50 percent below 2013 levels by 2030.” In the study approach, we assumed the grocery sector would need to achieve its “pro rata” share of that goal – in other words, to reduce direct HFC emissions by 40% relative to a 2013 baseline. Figure 17 shows the impact of various assumptions on the date by which the sector would meet the 40% goal for direct emissions.27
FIGURE 18. IMPACT OF ASSUMPTIONS ON YEAR OF CO2 REDUCTION GOAL ATTAINMENT
As shown above, only equipment turnover rate and leak rate assumptions have a significant impact on the year of goal attainment. These two factors clearly drive GHG reduction.
27 Since the model reports only annual results, the achievement date is the nearest year, and is why the results are
rounded in the graph.

ET18SCE7080 Next-Generation, Low-GWP Refrigeration Systems
Southern California Edison Page 48 of 51
Emerging Products
APPENDIX A – QUESTIONNAIRE The following was used as a basis for stakeholder interviews with third-party participants
(vendors, contractors, design engineers, and regulators). A slightly-modified version was used for grocers, with the same questions worded differently to reflect the stores they operate vs. the customers they serve.
Interview Guide Target Max Duration: 15 minutes
Sectors: Large grocery chains, regional grocery stores
Preface:
• California IOUs are looking to understand technology trends in the grocery sector, in
response to regulations driving toward low-GWP refrigeration systems.
• We are interviewing store energy managers, owners, vendors, contractors, design
engineers, and regulators.
• Answer as best as you can – we don’t expect absolute accuracy, just best-guess
estimates of future trends.
• No confidential information is needed – simply indicate the trends you see.
1. Existing Base
In your estimation, what are the top three refrigeration system types currently in
use?
(Clarify: service territory if applicable)
Market share of each?
Major O&M concerns of industry?
In existing stores, where is biggest opportunity for saving kWh and kW?
If needed, prompt for capital vs. commissioning? High capex or O&M level investments?
2. New Store Development
What growth do you expect in new California store developments by the end of 2022?
What factors will drive expansion, or the lack thereof?
For new stores, do you expect grocers to pursue low-GWP (<150) options?
What factors will influence adopting low-GWP options?
ET18SCE7080 Next-Generation, Low-GWP Refrigeration Systems
Southern California Edison Page 49 of 51
Emerging Products
What low-GWP (< 150) refrigerant and system configuration options do you
expect to gain the most traction with owners?
Compared to standard systems, how do you expect low-GWP systems to perform in terms
of:
a. EE
b. Maintenance costs
c. Durability
What do you see as potential cost/performance tradeoffs?
Are there specific options you expect owners to take to improve EE?
Do you have any specific O&M concerns about low-GWP options?
3. Retrofits
How many California stores (or % of existing stock) do you expect will likely be retrofit with
low-GWP systems by the end of 2022?
What are the top three technologies/refrigerants/configurations you expect to lead the
retrofit market?
1. _______________________________
2. _______________________________
3. _______________________________
What factors do you think will drive owners’ and energy managers’ system choices?
4. Tools /Modeling
Do you anticipate estimating the energy impacts of new system designs? If so, how?
Do you use existing tools?
If so, does it/do they meet your needs?
If not, which needs are not met by your current solution(s)?
If no existing tools meet your needs, what minimum capabilities would you want?
Are there any other factors you can think of about what to expect in the HFC phaseout?

ET18SCE7080 Next-Generation, Low-GWP Refrigeration Systems
Southern California Edison Page 50 of 51
Emerging Products
APPENDIX B – REFRIGERANT GWP Table 4 summarizes the CPUC Refrigerant Calculator for the most common refrigerants in
California commercial refrigeration and air conditioning equipment.
TABLE 4: REFRIGERANT GLOBAL WARMING POTENTIAL SUMMARY
Common Name of Refrigerant/ GHG Full Name
Atmospheric Lifetime in Years
GWP Values from IPCC* Fourth Assessment Report (AR4) (2007)
100-year 20-year
CFC-11 Trichlorofluoromethane (CCl3F) 45 4,750 6,730
CFC-12 Dichlorodifluoromethane (CCl2F2) 100 10,900 11,000
HCFC-22 Monochlorodifluoromethane (CHClF2) 12 1,810 5,160
HCFC-123 Dichlorotrifluoroethane (C2HF3Cl2) 1 77 273
HFC-23 Trifluoromethane (CHF3) 260 14,800 12,000
R-290 Propane 4 4
HFC-32 Difluoromethane (CH2F2) 5 675 2,330
HFC-134a 1,1,1,2-Tetrafluoroethane (CH2FCF3) 14 1,430 3,830
R-402A HCFC-22 Chlorodifluoromethane 38%; HFC-125 Pentafluoroethane 60%; Propane (R-290) 2%
2,788 5,771
R-404A HFC-125 Pentafluoroethane 44%; HFC-134a 1,1,1,2-Tetrafluoroethane 4% HFC-143a 1,1,1-Trifluoroethane 52%
52 years (143a); 29 years (125); 14.6 years (134a)
3,922 6,010
R-407A HFC-32 Difluoromethane 20%; HFC-125 Pentafluoroethane 40%; HFC-134a 1,1,1,2-Tetrafluoroethane 40%
29 years (R-125); 4.9 years (R-32)
2,107 4,538
R-407C HFC-32 Difluoromethane 23%: HFC-125 Pentafluoroethane 25%; HFC-134a 1,1,1,2-Tetrafluoroethane 52%
1,774 4,115
R-407F HFC-32 Difluoromethane 30%: HFC-125 Pentafluoroethane 30%; HFC-134a 1,1,1,2-Tetrafluoroethane 40%
1,825 4,136
R-408A HCFC-22 Chlorodifluoromethane 47%; HFC-125 Pentafluoroethane 7%; HFC-143A 1-1-1 Trifluoroethane 46%
3,152 5,579
R-410A HFC-32 Difluoromethane 50%; HFC-125 Pentafluoroethane 50%
29 years (R-125); 4.9 years (R-32)
2,088 4,340

ET18SCE7080 Next-Generation, Low-GWP Refrigeration Systems
Southern California Edison Page 51 of 51
Emerging Products
Common Name of Refrigerant/ GHG Full Name
Atmospheric Lifetime in Years
GWP Values from IPCC* Fourth Assessment Report (AR4) (2007)
100-year 20-year
R-438A HFC-125 Pentafluoroethane 45%; HFC-134a 1,1,1,2-Tetrafluoroethane 44.2%; HFC-32 Difluoromethane 8.5%; IsoButane (R-600a) 1.7%; Isopentane (R-601) 0.6%
2,238 4,659
R-448A HFC-32 Difluoromethane 26%; HFC-125 Pentafluoroethane 26%; HFC-134a 1,1,1,2-Tetrafluoroethane 21%; R-1234yf HFO-1234yf 2,3,3,3-Tetrafluoropropene 20%; R-1234ze HFO-1234ze 7%
1,386 3,061
R-449A HFC-32 Difluoromethane 24.3%; HFC-125 Pentafluoroethane 24.7%; HFC-134a 1,1,1,2-Tetrafluoroethane 25.7%; R-1234yf HFO-1234yf 2,3,3,3-Tetrafluoropropene 25.3%
1,396 3,119
R-507 HFC-125 Pentafluoroethane 50%;
HFC-143a 1,1,1-Trifluoroethane 50%
29 years (R-125); 52 years (R-143a)
3,985 6,120
R-717 Ammonia (NH3) 0 0 0
R-744 Carbon Dioxide (CO2) 50-200 1 1
*Intergovernmental Panel on Climate Change